79
Marin Community Foundation Older Adults, Healthy Eating Active Living Needs Assessment March 2016

Marin Community Foundation Older Adults, Healthy Eating Active Living
Needs Assessment
March 2016

Contents Executive summary ............................................................................................................................................................................................... 2
Background ........................................................................................................................................................................................................... 7
Demographics...................................................................................................................................................................................................... 10
Overall health ...................................................................................................................................................................................................... 13
Healthy Eating ..................................................................................................................................................................................................... 15
Active Living ........................................................................................................................................................................................................ 19
Community Resources ......................................................................................................................................................................................... 23
Recommendations ............................................................................................................................................................................................... 27
Appendix ............................................................................................................................................................................................................. 30

2
Executive summary
The Marin Community Foundation developed a Healthy Eating Active Living (HEAL) grant making framework to inform its HEAL grant making,
identifying work with older adults as a priority. This needs assessment seeks to inform that grant making by answering several key questions:
Who are older adults in Marin County? What is their health status? What are their health needs?
What services and resources are available to older adults in Marin? What barriers exist to accessing those services? Who
participates/ utilizes services?
What do older adults in Marin need to eat healthy and stay active?
Data from several secondary sources—including national data-sets such as the American Community Survey, state-level data sets such as the
California Health Interview Survey, and Marin County-specific data sources such as the Marin County Aging and Area Agency on Aging (AAA)
Older Adults Needs Assessment—were synthesized alongside data from a set of four focus groups conducted with older adults and one with
providers who work with them in Marin County. This report includes key findings from the triangulation of that data as well as a set of
recommendations for the Foundation and its partners that fit within a policy, systems, and environment (PSE) framework.
Key Findings
This report synthesizes a rich set of findings from both focus groups and secondary data and paints a picture of the healthy eating and active
living experiences of older adults in Marin County. The findings in this report align with other recent efforts to document the demographic and
health profile of older adults in Marin County. In particular, this report highlights the fact that while Marin County itself may be resource rich, for
older adults in the county, the high cost of living and the economic insecurity many face are significant factors in healthy eating and active living.
Nearly a quarter of Marin County residents are over the age of 60. Among older adults in Marin County, 25 percent are economically
insecure, 6% fall at or below the federal poverty level and the rest are in an eligibility gap. While they have annual incomes higher than the
federal poverty level, they are below economic sufficiency, using the Elder Economic Security Index.1 2 Additionally, approximately 44
1 American Community Survey 5 year Estimates (2010-2014). Population 60 Years and over in the United States, Marin County.

3
percent of older adults in Marin County live alone.3 Among this population, there are notable disparities along economic lines in both
health access and health outcomes.
The population of adults 60 and over in Marin County is projected to grow to 33 percent by 2030.4 This makes the imperative to adapt
the policy, systems, and environment of the county to meet the health needs of this population all the more timely. While the county
overall is resource rich, 21 percent of older adults in Marin County (65 and older) fall into an eligibility gap. These older adults are above
the federal poverty level but below the Elder Index. The Elder Economic Security Index or Elder Index is a tool that provides an
alternative calculation to the federal poverty level that, “permits policymakers and planners to understand how much income is needed
to meet basic needs and to set guidelines based on locality-specific measures of the cost of living.”5 The older adults in this eligibility gap
do not qualify for many public programs but still do not have enough money to cover their most basic needs. Additionally, an estimated
44 percent of older adults in Marin County live alone, which is a factor that is known to contribute to poor eating and poor physical
activity.6 Furthermore, while Marin County exceeds state benchmarks for older adults for access to health care and benchmarks for
health outcomes, disparities persist, particularly along socio-economic lines. For example, lower income adults 60 and over have lower
rates of insurance than higher income older adults and more low income older adults identify health insurance as a concern than higher
income older adults.7 8 This discrepancy bears further analysis as those over the age of 65 are eligible for Medicare. The disparity could
be due to those in the 60 to 64 year old age range or due to barriers in accessing or applying for Medicare.
Seniors reported that community resources are a lifeline for healthy eating and active living; however, the affordability of programs is a
concern and some programs have room to improve. Seniors also acknowledged that not all of their peers are accessing services and offered
suggestions for linking those seniors to services.
Older adults participating in focus groups identified a wide range of healthy eating and active living services available to them in Marin
County. Community resources include senior centers, transportation services, meal delivery and congregate meal programs, and
exercise classes. Seniors report that they are happy with the programs they use but want more of existing services, more attention paid
to the affordability of programs, and expanded services in communities that are lacking services. Seniors face not only the costs of
2 Insight Center for Economic and Community Development. (2011). Elders Who Can’t Make Ends Meet in Marin County As Measured by the California Elder Economic Security Standard™ Index. http://ww1.insightcced.org/uploads/eesi/2011_county_pages/Marin/marin_es.pdf. 3 American Community Survey 5 year Estimates (2010-2014). Population 60 Years and over in the United States , Marin County. 4 Ibid. The estimate from the California Department of Finance State and County Population Projections (2010-2060) is higher: 73,848 in 2016. 5 University of California Los Angeles Center for Health Policy Research. The Elder Index. http://healthpolicy.ucla.edu/programs/health-disparities/elder-health/Pages/elder-index-2011.aspx. 6 Cornwell EY, Waite LJ. (2009). Social disconnectedness, perceived isolation, and health among older adults. J Health Soc Behav. 50(1): 31-48; Hughes G, Bennett KM, Hetherington MM. (2004). Old and alone: barriers to healthy eating in older men living on their own. Appetite. 43:269–76; Locher JL, Ritchie CS et al., (2009). Food choice among homebound older adults: Motivations and perceived barriers. J Nutr Health Aging. 13(8): 659-664. 7 American Community Survey 5 year Estimates (2010-2014). Population 60 Years and over in the United States, Marin County. 8 Marin County Area Agency on Aging (AAA) Older Adult Needs Assessment. County of Marin, Division of Social Services, Office of Aging and Adult Services. (2015) www.LiveLongLiveWellMarin.org.
4
accessing services but also the added cost of getting to and from services. Seniors and providers also noted that a portion of the older
adult community in Marin County is disconnected from services altogether, identifying stigma as one possible reason some might not
access service. Seniors offered a number of ideas for reaching their peers, making a case for traditional media over technology-based
media outreach, and also advocating for the use of peer liaisons in the community.
Seniors in Marin County face a number of barriers to maintaining a healthy and active lifestyle, including personal barriers such as physical
limitations, financial constraints, and a lack of information about healthy food options. Seniors also face environmental barriers such as
limited transportation options and a lack of healthy food retail in parts of the county.
Older adults in Marin County reported that they engage in a number of activities aimed at maintaining a healthy lifestyle. However, there
are a number of barriers in their efforts to access services, prepare healthy foods at home, and exercise in their communities. Many of
the barriers identified highlight opportunities for the policies, systems, and environments in the county to adapt to meet the needs of the
growing older adult population.
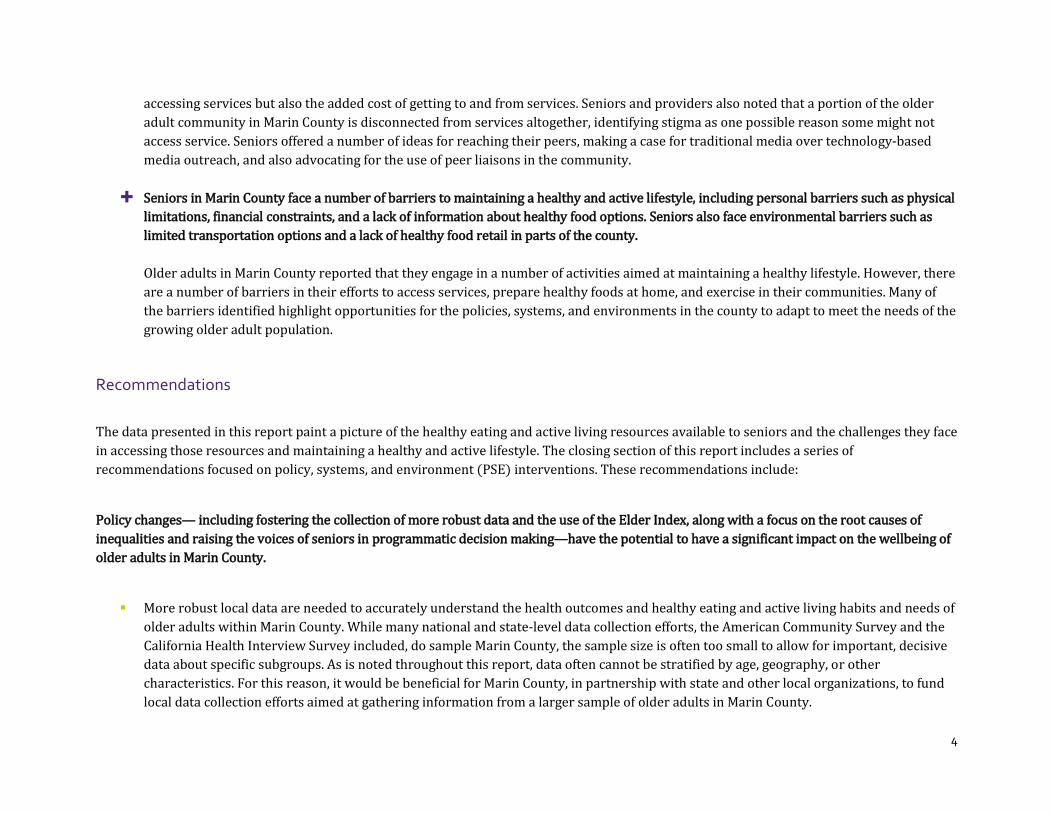
Recommendations
The data presented in this report paint a picture of the healthy eating and active living resources available to seniors and the challenges they face
in accessing those resources and maintaining a healthy and active lifestyle. The closing section of this report includes a series of
recommendations focused on policy, systems, and environment (PSE) interventions. These recommendations include:
Policy changes— including fostering the collection of more robust data and the use of the Elder Index, along with a focus on the root causes of
inequalities and raising the voices of seniors in programmatic decision making—have the potential to have a significant impact on the wellbeing of
older adults in Marin County.
More robust local data are needed to accurately understand the health outcomes and healthy eating and active living habits and needs of
older adults within Marin County. While many national and state-level data collection efforts, the American Community Survey and the
California Health Interview Survey included, do sample Marin County, the sample size is often too small to allow for important, decisive
data about specific subgroups. As is noted throughout this report, data often cannot be stratified by age, geography, or other
characteristics. For this reason, it would be beneficial for Marin County, in partnership with state and other local organizations, to fund
local data collection efforts aimed at gathering information from a larger sample of older adults in Marin County.

5
The Elder Economic Security Index should be used as a tool for local policy-making decisions in order to accurately reflect the economic
situations faced by seniors and should also be a factor in decisions regarding program planning for service providers. Those older adults
who fall above the federal poverty level but below the Elder Index, would benefit from programs that take into account the high cost of
living in Marin County by using the Elder Index as a threshold for provision of low-cost or free services.
Policies that address root cause of inequalities—most importantly, poverty—should be prioritized by local government and supported
by private and nonprofit organizations. Disparate utilization of healthcare resources and disparate health outcomes across economic
lines speaks to the need to address economic inequalities.
The voices of seniors should be central in decision making for senior-serving programs. Programs should regularly assess whether they
meet the needs of seniors in their community and should seek creative solutions. For example, seniors participating in focus groups
emphasized the ways in which liaisons or peer advocates could provide a critical linkage point for seniors to services, particularly for
isolated seniors. Systems (particularly funder collaboratives) could explore ways to fund advocates using the promotora model.
Changes within systems in Marin County, including the development of collaborative funding and information sharing efforts among public, private,
and nonprofit organizations and the infusion of an equity lens into the work of these organizations—have the potential to have a significant impact
on the wellbeing of older adults in Marin County.
Public, private, and nonprofit organizations should foster multi-sector collaborative funding efforts to create healthier communities for
older adults. These might include funder collaboratives focused on HEAL for older adults that promote models known to be effective.
Improvements focused on older adults, for example addressing the lack of healthy food retail in West Marin or the need for better lit
paths—will create healthier communities for Marin residents of all ages.
Similarly, public, private, and nonprofit organizations should collaborate and share information about programs and data when focused
on common goals. The Marin Community Foundation’s relationship with Marin County Aging and Adult Services is an example of an
effective collaborative effort. As the population of older adults in Marin County grows the needs identified in this report will only
increase and demand for services will grow, necessitating coordinated action among senior-serving organizations.
Systems should work to infuse an equity lens in their work, focusing on addressing the needs of vulnerable older adults by addressing
disparities by not only age but also race, gender, geography, and income. Efforts in this arena could include things like working towards
establishing healthy food retail outlets in the parts of Marin County in which they are currently lacking.

6
Changes to the environment—including changes to transportation accessibility for older adults and improvements to the built environment—have
the potential to have a significant impact on the wellbeing of older adults in Marin County.
The built environment—the infrastructure, homes, buildings, and public spaces older adults live in and navigate—can be a barrier to
accessing healthy food and active living opportunities. Seniors identified the lack of sidewalks and clear walking paths in some areas as
factors that limit their ability to access healthy food resources and limit their opportunities to be active in their neighborhoods. Seniors
also identified safety issues, including poorly lit paths and concerns about petty crime in some areas. Environmental changes in this area
might include solutions like installing new lights on paths, increasing the time to cross at cross-walks, or adding benches at bus stops.
Other solutions might involve more systemic approaches to urban planning that are reflective of the needs of older adults such as
developing accessible, affordable housing.
In Marin County, many older adults identified transportation as a key area in need of change in order to meet the needs of older adults.
Local systems should consider the ways transportation design and different transportation options can take into account the needs of
older adults in an effort to make transportation less of a barrier to healthy eating and active living resources for older adults.

7
Background
The Marin Community Foundation (MCF) has developed a Healthy Eating Active Living
(HEAL) grant making framework to inform MCF’s HEAL grant making within a health equity
framework. One key priority area is older adults, a vulnerable—and growing—population in
Marin County. As outlined in MCF’s HEAL Grantmaking Framework, a significant number of
the county’s 66,492 adults over 60 struggle to make ends meet, making difficult choices
between spending on housing, medicine, and food.9 MCF is eager to build on their work to
serve the needs of older adults by introducing a HEAL element to complement other older
adult grant making and to identify ways to supplement and enhance the activities of Marin
County Area Agency on Aging (AAA), under the Office of Aging and Adult Services, as they
enter the planning phase for their next 4-year plan. In developing the framework, MCF
identified the high cost of living and inequities as important contextual issues.
The goal of this needs assessment is to explore the healthy eating, active living resources and
needs of older adults in Marin County in order to provide MCF with information to guide
grant making, particularly in the areas of policy, systems, and environment (PSE), with the
ultimate goal of improving the lives of older adults in Marin County. The information in this
report and the Appendices are designed to be a source of consistent data regarding older
adults in Marin County for community members, service provides, funders, and other key
stakeholders.
9 American Community Survey 5 year (2010-2014). Population 60 Years and over in the United States , Marin County. The estimate from the California Department of Finance State and County Population Projections (2010-2060) is higher: 73,848 in 2016.
Guiding questions
This needs assessment focuses on
understanding the specific needs of older
adults in Marin County related to their
ability to eat nutritiously and be active.
This needs assessment was guided by
several key questions:
Who are older adults in Marin
County? What is their health
status? What are their health
needs?
What services and resources are
available to older adults in Marin?
What barriers exist to accessing
those services? Who participates/
utilizes services?
What do older adults in Marin
need to eat healthy and stay
active?
Throughout this report we use the terms “senior” and “older
adult” interchangeably to describe Marin County residents over
the age of 60. We recognize that this designation is not
universal across various data sources.

8
Methods
This needs assessment includes both secondary data (existing
quantitative information) and qualitative data from focus groups.
Using a mixed-methods approach allowed for the triangulation of
data and produced a set of rich findings and recommendations.
Secondary data
The evaluation team at Harder+Company, in partnership with the
Marin County Area Agency on Aging (AAA), under the Office of
Aging and Adult Services, gathered and synthesized existing data
related to HEAL behaviors and outcomes among older adults (e.g.,
fruit and vegetable consumption by income category) to better
understand trends related to service utilization among older adults.
Data sources include but are not limited to: the American
Community Survey, the California Health Interview Survey, and the
Marin County AAA Older Adults Needs Assessment. See Appendices
A-F for the complete list of indicators, data sources, and years
considered in this report.
Focus groups
The evaluation team at Harder+Company conducted four focus
groups with older adults and one with providers. The focus groups
were designed to gather in-depth, qualitative information directly
from older adults and providers about the nutrition and physical
activity practices and needs of older adults, as well as barriers to
utilizing existing services. Qualitative data were coded using the
qualitative data analysis software Atlas.ti and analyzed to identify
major themes.
The four focus groups for older adults were held in West Marin,
Marin City, and two in San Rafael. Efforts were made to include a
diverse cross-section of older adults in Marin County. Participants
varied in age, connection to resources, gender, ethnicity, health
status, and income (see Appendix F for a summary of focus group
participants’ demographics). In total, 58 older adults participated in
the focus groups. Vietnamese and Spanish speaking residents
participated in the focus groups using translators and a bilingual
facilitator, respectively. Where possible, differences in HEAL
experiences and outcomes by community and group are highlighted.
Focus group demographics were largely similar to older adults in
Marin County overall, however, focus group participants were more
ethnically diverse (focus group participants were 31 percent
Hispanic while the county’s 60 and older population is only 4
percent Hispanic) and consisted of more women (86 percent of
participants were female while 55 percent of the county’s older
adults are female).
The process of recruiting focus group participants in Marin City was
challenging. The evaluation team noted this as a finding in and of
itself as it indicates that older adults in Marin City may not be well-
connected to services. Unlike in other communities, in Marin City
the evaluation team had difficulty establishing contact with a
community liaison to identify and recruit participants and noted
there were very few people at the local senior center during the day.

9
Limitations
As with any consideration of secondary data, this assessment is
limited by the availability and stability of data. While national and
state-level data collection efforts are inclusive of Marin County, the
sample size for Marin County is small, which results in unstable
data, meaning data that may not be representative of the County as
a whole. Additionally, small samples cannot be stratified by factors
such as age, geography, ethnicity, and income.
In order to consider the most stable data available and allow for
analyses by subpopulations, this report utilizes five year averages of
the population data from the American Community Survey (Census
data) rather than data estimates for one or three years, which
allows for a larger sample. Health indicators in this report generally
include data from 2010-2014, though some indicators are not
collected on an annual basis and are only available for a single
year.10 Furthermore, data from other sources are not always
collected on an annual basis; therefore, current estimates may not
be available and some data might be from many years in the past.
The year of data reported should be considered when using this
information in planning and decision-making.
Additionally, though focus group participants are largely
representative of Marin County residents, the sample included
individuals who self-selected to participate and therefore are more
likely to be connected to resources in the community. The themes
that emerged from focus group discussions reflect the viewpoints of
10 It is important to note that the implementation of the Affordable Care Act occurred within this time frame, in 2010.
those individuals who participated, and do not necessarily
represent the views of all older adults in Marin County.
Marin County Community Health Needs Assessment
Harder+Company Community Research was the evaluation partner
for Marin County’s 2016 Community Health Needs Assessment
(CHNA) process, which occurred on a similar timeline with this
needs assessment.11 Harder+Company staff worked collaboratively
on both projects and sought opportunities for collaboration and
data sharing across projects. Additionally, members of MCF and
Marin County Aging and Adult Services contributed to the CHNA
qualitative data collection sampling plan and participated in the
county-wide prioritization process of identifying health needs, a
critical component of the CHNA.
11 The Patient Protection and Affordable Care Act (ACA), enacted on March 23, 2010, included new requirements for nonprofit hospitals in order to maintain their tax exempt status. The provision was the subject of final regulations providing guidance on the requirements of section 501(r) of the Internal Revenue Code. Included in the new regulations is a requirement that all nonprofit hospitals must conduct a Community Health Needs Assessment and develop an implementation strategy every three years.

10
Demographics
The data presented in this section provide an overview of the 60 and older population of Marin County. Throughout this report the most salient
data points are highlighted. In Appendices A-E, data are further stratified by age and poverty level when possible. Demographic information
about focus group participants is available in Appendix F.
A majority of Marin County’s older adults are white (91 percent), a higher rate compared to the 60 and over population in California as a whole
which is 72 percent white.12 Additionally, only 6 percent of adults over 60 in Marin County speak English less than very well, compared to 23
percent of adults over 60 in California overall.13
Nearly a quarter of Marin County residents are over the age of 60 and this
population is projected to grow to 33 percent by 2030.
Marin County is proportionally the oldest county in the Bay Area, meaning that a
larger portion of the county is over 60 as compared to other counties.14 In total, 26
percent of Marin’s population is over 60, compared to 17 percent of the population
across California.15 There are 66,492 adults over the age of 60 in Marin County.16
Additionally, the population of older adults in Marin is expected to grow to 33
percent by 2030.17
12 American Community Survey 5 year Estimates (2010-2014). Population 60 Years and over in the United States, Marin County. 13 Ibid. 14 San Francisco Bay Area State of the Region. (2015). http://reports.abag.ca.gov/sotr/2015/introduction.php 15 American Community Survey 5 year Estimates (2010-2014). Population 60 Years and over in the United States, Marin County. 16 Ibid. 17 Ibid. The estimate from the California Department of Finance State and County Population Projections (2010-2060) is higher: 73,848 in 2016.
7.7%
6.1%
4.2%
2.9%
2.3%
2.5%85 and older
80-84
75-79
70-74
65-69
60-64
Older Adults in Marin County, Age (ACS 5 year 2010-2014)
11
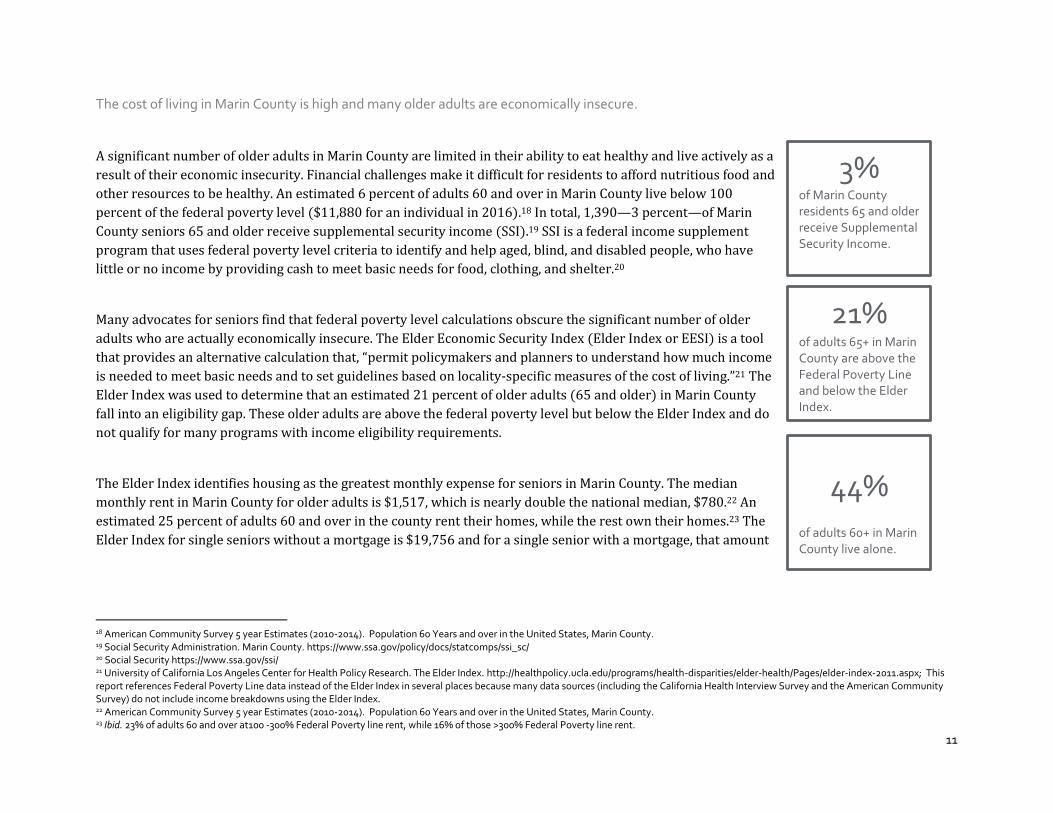
The cost of living in Marin County is high and many older adults are economically insecure.
A significant number of older adults in Marin County are limited in their ability to eat healthy and live actively as a
result of their economic insecurity. Financial challenges make it difficult for residents to afford nutritious food and
other resources to be healthy. An estimated 6 percent of adults 60 and over in Marin County live below 100
percent of the federal poverty level ($11,880 for an individual in 2016).18 In total, 1,390—3 percent—of Marin
County seniors 65 and older receive supplemental security income (SSI).19 SSI is a federal income supplement
program that uses federal poverty level criteria to identify and help aged, blind, and disabled people, who have
little or no income by providing cash to meet basic needs for food, clothing, and shelter.20
Many advocates for seniors find that federal poverty level calculations obscure the significant number of older
adults who are actually economically insecure. The Elder Economic Security Index (Elder Index or EESI) is a tool
that provides an alternative calculation that, “permit policymakers and planners to understand how much income
is needed to meet basic needs and to set guidelines based on locality-specific measures of the cost of living.”21 The
Elder Index was used to determine that an estimated 21 percent of older adults (65 and older) in Marin County
fall into an eligibility gap. These older adults are above the federal poverty level but below the Elder Index and do
not qualify for many programs with income eligibility requirements.
The Elder Index identifies housing as the greatest monthly expense for seniors in Marin County. The median
monthly rent in Marin County for older adults is $1,517, which is nearly double the national median, $780.22 An
estimated 25 percent of adults 60 and over in the county rent their homes, while the rest own their homes.23 The
Elder Index for single seniors without a mortgage is $19,756 and for a single senior with a mortgage, that amount
18 American Community Survey 5 year Estimates (2010-2014). Population 60 Years and over in the United States, Marin County. 19 Social Security Administration. Marin County. https://www.ssa.gov/policy/docs/statcomps/ssi_sc/ 20 Social Security https://www.ssa.gov/ssi/ 21 University of California Los Angeles Center for Health Policy Research. The Elder Index. http://healthpolicy.ucla.edu/programs/health-disparities/elder-health/Pages/elder-index-2011.aspx; This report references Federal Poverty Line data instead of the Elder Index in several places because many data sources (including the California Health Interview Survey and the American Community Survey) do not include income breakdowns using the Elder Index. 22 American Community Survey 5 year Estimates (2010-2014). Population 60 Years and over in the United States, Marin County. 23 Ibid. 23% of adults 60 and over at100 -300% Federal Poverty line rent, while 16% of those >300% Federal Poverty line rent.
21%
of adults 65+ in Marin County are above the Federal Poverty Line and below the Elder Index.
44%
of adults 60+ in Marin County live alone.
3% of Marin County residents 65 and older receive Supplemental Security Income.

12
is $40,916 (see Appendix B for Index categories).24 Among seniors 60 and older in Marin County who rent their homes, 58 percent have gross
rent that is 30 percent or more of their income.25
Many older adults in Marin County live alone.
Living alone as an older adult is associated with unhealthy dietary behaviors and decreased physical activity; older adults who live with others
benefit from regular assistance with the tasks associated with healthy eating and physical activity.26 An estimated 44 percent of adults 60 and
over in Marin live alone.27 Much like living alone, eating alone is correlated with poor eating habits.28 An estimated 54 percent of older adults
participating in the 2015 Marin County Area Agency on Aging (AAA) Needs Assessment reported that they eat alone most of the time.29 The data
also reveal an economic difference; those below the Elder Index are 2.2 times more likely to report eating alone most of the time than those
above the Elder Index.30
24 Marin County, CA. Elder Economic Security Standard Index. (2011). http://www.insightcced.org/past-archives/insight-networks/building-economic-security-for-all-besa/measuring-and-addressing-older-californians-needs/what-seniors-need-to-make-ends-meet-elder-index-in-marin-county/ 25 American Community Survey 5 year Estimates (2010-2014). 26 Cornwell EY, Waite LJ. (2009). Social disconnectedness, perceived isolation, and health among older adults. J Health Soc Behav. 50(1): 31-48; Hughes G, Bennett KM, Hetherington MM. (2004). Old and alone: barriers to healthy eating in older men living on their own. Appetite. 43:269–76; Locher JL, Ritchie CS et al., (2009). Food choice among homebound older adults: Motivations and perceived barriers. J Nutr Health Aging. 13(8): 659-664. 27 American Community Survey 5 year Estimates (2010-2014). Population 60 Years and over in the United States , Marin County. 28 Cornwell EY, Waite LJ. (2009). Social disconnectedness, perceived isolation, and health among older adults. J Health Soc Behav. 50(1): 31-48; Hughes G, Bennett KM, Hetherington MM. (2004). Old and alone: barriers to healthy eating in older men living on their own. Appetite. 43:269–76; Locher JL, Ritchie CS et al., (2009). Food choice among homebound older adults: Motivations and perceived barriers. J Nutr Health Aging. 13(8): 659-664. 29 Marin County Area Agency on Aging (AAA) Older Adult Needs Assessment. County of Marin, Division of Social Services, Office of Aging and Adult Services. (2015) www.LiveLongLiveWellMarin.org. 30 Ibid.
Housing in Marin County (ACS 5 year 2010-2014)
Median Rent: $1,517
Percent of older adults
in Marin County who
own or rent their
homes
76% of
households
are owners
25% of
households
are renters

13
Overall health
This section identifies key indicators related to access to health care services and health outcomes for older adults in Marin County. This baseline
information helps to contextualize the information that follows regarding older adults’ healthy eating and active living behaviors and challenges.
Marin County exceeds state benchmarks for access to care, yet disparities in access persist.
In many ways, Marin County is healthier and wealthier than much of the nation. Access to medical care in Marin exceeds several state
benchmarks. For example, a greater percentage of Marin residents of all ages are insured than in California overall (87 percent in Marin County
compared to 76 percent in the state overall).31 Among adults 65 and older, most of whom are covered by Medicare the rate of insurance is higher
than for the general population—an estimated 95 percent of older adults in Marin are insured (this is the same percentage for the state
overall).32 However, disparities in access to insurance differ by income level; while 97 percent of older adults at 300 percent of the federal
poverty level and above are insured, 68 percent of older adults 60 and over at 0 to 99 percent of the federal poverty level are insured.33
Additionally, the latest available data regarding dental insurance coverage indicates that 52 percent of older adults in Marin County did have
dental insurance in the last year; this is compared to 52 percent in
the state overall.34
Despite high rates of healthcare access countywide, disparities in
utilization persist among specific groups within the county. An estimated 26 percent of older adults participating in the Marin County Aging and
31 California Health Interview Survey (2011-2014). 32 Ibid.; 93% of adults 60-64 (which excludes individuals who qualify for Medi-Cal and are 65+) are insured. 33 Ibid.; It is important to note that this data includes responses from 2011-2014, a time in which coverage changed for many Americans, additionally the California Health Interview Survey database has labeled this data unstable 34 California Health Interview Survey (2007). Dental insurance data for older adults is limited to 2007 and is too unstable to reliably compare across income levels.
Access to care
Percent of older adults in Marin with health insurance
95| 95 Marin California
Percent of older adults without dental insurance
45 | 44 Marin California
Percent of older adults for whom insurance/ Medicare is a concern
26 | 46 Above EESI EESI and
below

14
Adult Services Needs Assessment who are above Elder Index identified “health insurance/ Medicare” as a concern; for those at the Elder Index
and below that number rises to 46 percent.35 There are a number of barriers to accessing care that might be specific to income level. For
example, geography and transportation were identified by many focus group participants as barriers to accessing care for older adults.
Marin County exceeds many state benchmarks for health outcomes, yet disparities persist.
In Marin County, the rate of preventable hospital events among Medicare enrollees, 30 per 100,000 residents, is lower than the state benchmark,
45 events per 100,000 residents.36 Additionally, the rates of Marin County residents receiving preventive services such as mammograms and
colonoscopies also exceed state benchmarks. However, economic inequality is a driver of health disparities. The data for older adults in Marin
County suggests that lower income older adults have lower rates of insurance and also have poorer health outcomes. For example, while 36
percent of older adults at 100 to 300 percent of the federal poverty level report excellent or very good health, 71 percent of older adults at over
300 percent of the federal poverty level report excellent or very good health.37 This disparity is echoed in the Marin County Area Agency on
Aging Needs Assessment, which found that 17 percent of adults participating in the assessment living above the Elder Index report fair or poor
health compared to 28 percent of those living at Elder Index and below.38 The percentage of older adults ever diagnosed with diabetes is another
example, while 6% percent of older adults in Marin have ever been diagnosed with diabetes, which is much lower than the rest of the state
(where 18 percent of older adults have ever been diagnosed); there are disparities within Marin by income.39 Disparities in health outcomes are
particularly evident in the gap in life expectancy between various areas of the county. For example, the gap in life expectancy between Ross and
Hamilton is 13 years.40 An estimated 51 percent of the variation in life expectancy among census tracts in Marin County can be explained by
neighborhood income.41
35Marin County Aging and Adult Services Needs Assessment. (2015). 36 Dartmouth Atlas of Healthcare. (2012). 37 California Health Interview Survey (2011-2014). 38 Ibid. 39Ibid. Note that this data is statistically unstable. For individuals at 100-299% of FPL 11% have ever been diagnosed with diabetes, for individuals over 300% FPL, 6 percent have ever been
diagnosed with diabetes. 40 American Human Development Project. (2012). A Portrait of Marin. http://www.measureofamerica.org/docs/APOM_Final-SinglePages_12.14.11.pdf. 41 Levin M, Arambula Z, Ereman R. (2011). Health Inequities and Poverty Masked by Affluence in Marin County, California. County of Marin Department of Health and Human Services, Epidemiology Program.
Health Outcomes

15
Healthy
Eating
This section presents
data related to accessing healthy food as well as behaviors that impact healthy food
consumption for older adults in Marin County. Much like the previous section, this section
identifies many of the ways in which Marin County has many resources and exceeds
benchmarks, yet disparities persist. For example, while 58 percent of older adults at 300
percent of the federal poverty level and above reported consuming five or more fruits and
vegetables per day, that number falls to 47 percent for older adults at 100 to 300 percent of the
federal poverty level.42
Food insecurity—defined as "limited or uncertain availability of nutritionally adequate and
safe foods or limited or uncertain ability to acquire acceptable foods in socially acceptable
ways"—is known to exacerbate chronic health conditions and is also associated with increased
rates of diabetes, hypertension, congestive heart failure, and depression. 43 44 Among all older
adults in Marin County, 14 percent reported that they are not able to buy enough food—this is
compared to 30 percent of older adults in California overall.45
An estimate from the Marin County Area Agency on Aging Needs Assessment identified 25
percent of participants as being at “high nutritional risk” (among older adults at the Elder Index
42 California Health Interview Survey (2005). This data is only available for 2005. 43 United States Department of Agriculture definition. 44 Lloyd, JL, Wellman NS. (2015). Older Americans Act Nutrition Programs: A Community-Based Nutrition Program Helping Older Adults Remain at Home. Journal of Nutrition in Gerontology and Geriatrics. 34:2, 90-109. 45 California Health Interview Survey (2011-2014). A breakdown by poverty level for this indicator is unstable.
and below—38 percent are
at “high nutritional risk”).46
An additional 39 percent of
older adults are at
46 Marin County Area Agency on Aging (AAA) Older Adult Needs Assessment. County of Marin, Division of Social Services, Office of Aging and Adult Services. (2015) www.LiveLongLiveWellMarin.org.
Rate of preventable hospital events among Medicare enrollees in Marin County, per 100,000 residents
30 | 45 Marin California
Percent of adults 60 and over in Marin County who report excellent or very good health
39 | 71 1 00-300% FPL >300% FPL
Diabetes prevalence among older adults
6 | 18 Marin California
What do Marin County seniors do to maintain a
healthy diet?
Focus group participants report that they:
Eat healthy! Residents said fish, chicken,
vegetables, salads, nuts, yogurt, and oatmeal
are their favorite healthy foods.
Older adults cook for themselves, get meals
from congregate meal sites, or have meals
delivered.
Older adults in Marin County access a number
of community resources designed to address
food insecurity and help older adults eat
healthy. The map on p 20 identifies several of
these. Other resources include:
Community garden in San Geronimo
Home delivered meals, Meals on Wheels
Congregate meals (San Rafael and Marin
City)
Pop up farmers markets outside churches
ExtraFood.org
Shopping shuttle in West Marin

16
“
moderate nutritional risk,” These calculations are made using a
system that involves scoring self-reported information including
whether an individual eats fewer than 2 meals a day, eats alone,
runs out of money for food each month, and is physically unable to
shop, cook, and/or feed themselves. Additionally, an estimated 7
percent of older adults above the Elder Index report running out of
money for food each month while 46 percent below the Elder Index
report running out of money for food each month
Older adults participating in focus groups report that their physical
limitations prevent them from cooking and from being able to
easily access healthy food outside their homes.
Older adults reported that their physical health is sometimes a
barrier to healthy eating. Specifically, older adults said that physical
conditions such as “bad knees” and “bad hips” as well as the process
of recovering from surgery prevents them from being able to easily
cook for themselves or leave their homes to get food from either the
grocery store or a meal site. This is a particularly acute issue for
older adults who live alone and are not able to rely on family
members to help with groceries or preparing food. Some older
adults also mentioned depression and isolation as factors that might
influence their ability and interest in leaving the house which affects
their ability to maintain a healthy diet. In total, 39 percent of
participants in the Marin County Area Agency on Aging Needs
Assessment identified feeling isolated or depressed as a concern.
Other focus group participants mentioned medications that reduce
their appetites. Several mentioned oral health problems, including
tender gums, dentures, and oral pain as barriers to healthy eating
(11 percent of Needs Assessment participants said that they have
tooth or mouth problems that make it difficult for them to chew).47
Focus group participants also cited a general lack of energy and
sometimes a lack of motivation to prepare food.
Older adults said that the high cost of healthy food in Marin County
coupled with their economic situations makes maintaining a
healthy diet challenging. Resources, including congregate meals
and home delivered meals, are a lifeline.
Older adults in Marin County discussed the high price of quality,
healthy food. Specifically, focus group participants referenced the
high cost of food at specialty grocery stores and farmer’s markets.
Many also mentioned the resources that are available to them to
help them eat healthy, specifically—congregate meals and home
delivered meal. The following page includes additional information
about these programs that reach older adults who are most in need
47 Marin County Area Agency on Aging (AAA) Older Adult Needs Assessment. County of
Marin, Division of Social Services, Office of Aging and Adult Services. (2015) www.LiveLongLiveWellMarin.org..
“In Canal and West Marin...a lot of these small stores that
served a lot more day people who are coming in to Marin for
recreation...it is very high quality food, but there is a cost for
that.”—Focus group participant
17
of support.
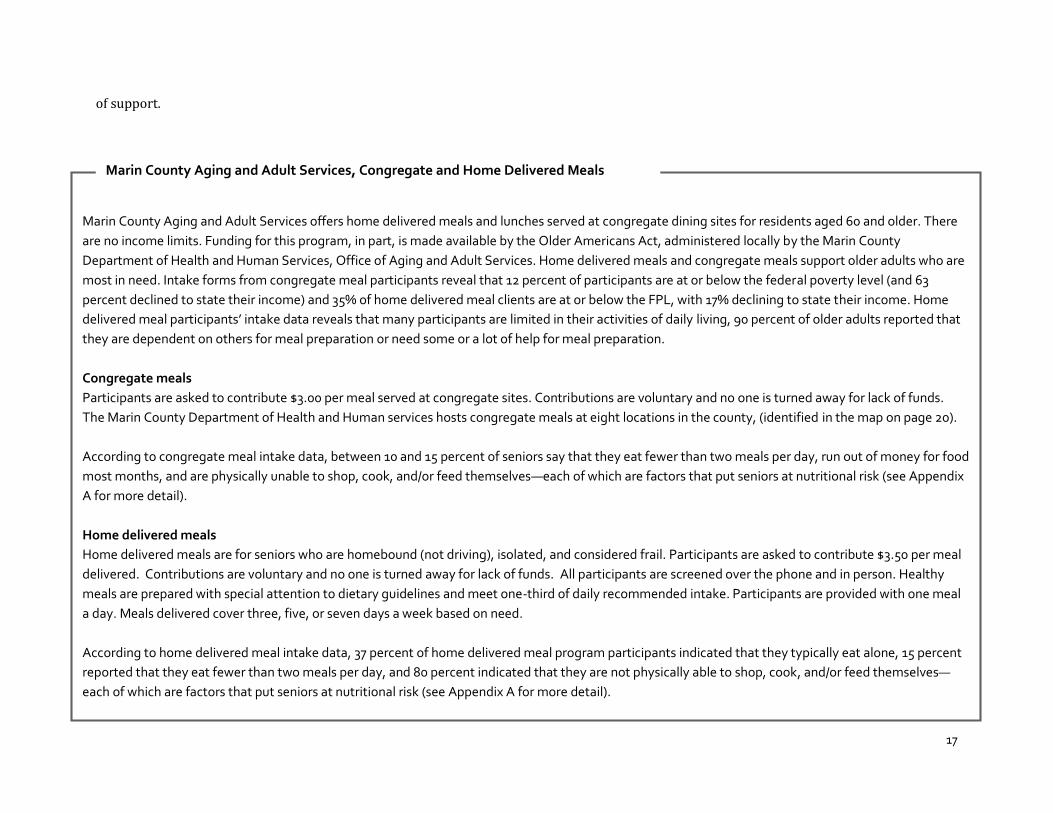
Marin County Aging and Adult Services offers home delivered meals and lunches served at congregate dining sites for residents aged 60 and older. There
are no income limits. Funding for this program, in part, is made available by the Older Americans Act, administered locally by the Marin County
Department of Health and Human Services, Office of Aging and Adult Services. Home delivered meals and congregate meals support older adults who are
most in need. Intake forms from congregate meal participants reveal that 12 percent of participants are at or below the federal poverty level (and 63
percent declined to state their income) and 35% of home delivered meal clients are at or below the FPL, with 17% declining to state their income. Home
delivered meal participants’ intake data reveals that many participants are limited in their activities of daily living, 90 percent of older adults reported that
they are dependent on others for meal preparation or need some or a lot of help for meal preparation.
Congregate meals
Participants are asked to contribute $3.00 per meal served at congregate sites. Contributions are voluntary and no one is turned away for lack of funds.
The Marin County Department of Health and Human services hosts congregate meals at eight locations in the county, (identified in the map on page 20).
According to congregate meal intake data, between 10 and 15 percent of seniors say that they eat fewer than two meals per day, run out of money for food
most months, and are physically unable to shop, cook, and/or feed themselves—each of which are factors that put seniors at nutritional risk (see Appendix
A for more detail).
Home delivered meals
Home delivered meals are for seniors who are homebound (not driving), isolated, and considered frail. Participants are asked to contribute $3.50 per meal
delivered. Contributions are voluntary and no one is turned away for lack of funds. All participants are screened over the phone and in person. Healthy
meals are prepared with special attention to dietary guidelines and meet one-third of daily recommended intake. Participants are provided with one meal
a day. Meals delivered cover three, five, or seven days a week based on need.
According to home delivered meal intake data, 37 percent of home delivered meal program participants indicated that they typically eat alone, 15 percent
reported that they eat fewer than two meals per day, and 80 percent indicated that they are not physically able to shop, cook, and/or feed themselves—
each of which are factors that put seniors at nutritional risk (see Appendix A for more detail).
Marin County Aging and Adult Services, Congregate and Home Delivered Meals

18
Many seniors said they do not have the information they need
about healthy food options.
Many focus group participants said that they are uncertain about
what constitutes healthy eating, reporting that they sometimes hear
conflicting information. Seniors referenced a variety of nutrition
plans and diets, which ranged from more common nutrition
recommendations such as eating fewer sweets and eating more
fruits and vegetables to getting nutrients from a particular food
such as green juice and even fasting. One senior reported that other
seniors coming to the food bank indicate they do not want to take
certain foods home because of what they have heard or read about
healthy foods. In general, seniors reported that when they do have
information about what constitutes healthy food, they put that
knowledge into action.
Transportation is a substantial barrier to healthy eating for older
adults in Marin County.
Focus group participants nearly unanimously identified
transportation as a major barrier to both healthy eating and active
living. The geography in Marin makes transportation a significant
issue for older adults. Specifically, older adults mentioned that
getting from one part of Marin to another for appointments,
services, and to get groceries, is difficult. Some attributed this to
traffic and others mentioned that Marin feels segmented. Several
focus group participants also mentioned the challenge of navigating
Marin’s hills by foot.
Many older adults are no longer able to drive or do not feel safe
driving. For many, this means relying on the Marin Transit bus
service or Marin Access. Many older adults identified challenges
with relying on public transit including having to know and plan
around transit schedules, having to walk to bus stops, and having to
carry groceries home from the bus stop. As one focus group
participant said, “not being able to drive is a major pain in this area.”
For some, grocery stores and food pantries are not in close
proximity to their homes and transportation is a challenge. Many
focus group participants made recommendations related to
improving transit options for older adults in Marin. Additionally, for
older adults who do drive or have others who will drive for them,
the cost of gas is a barrier to regular transportation by car.
Parts of Marin County lack sufficient grocery stores and healthy
food retail outlets.
Some residents of Marin County feel that their neighborhoods lack
grocery stores and other venues to purchase healthy food, such as
farmers markets. For many, a lack of grocery stores in their
immediate neighborhood is a major barrier to obtaining healthy
food as seniors face challenges traveling throughout the county.
“What is a well-balanced diet? When I started
reading everything, it was very confusing” –
Focus group participant

19
Access to healthy food retail differs by community. West Marin and
Marin City, in particular, were identified as communities lacking in
healthy food retail. As one provider said, “while there might be an
abundance of delicious, healthy, fresh food, it is not accessible
financially in West Marin.” Residents of Marin City said that there
are no nearby grocery stores and no places to buy fresh produce.
Some said that the Dollar Store, which recently closed, was the only
option for many to purchase food.
Albert J. Boro Community Center/Pickleweed
Margaret Todd Senior Center
San Rafael Community Center
Corte Madera Community Center
Marin City Senior Center
Fairfax Community Church
San Geronimo Valley Community Center
Dance Palace
Older Adult Nutrition Programs in Marin County

20
Active Living
Physical activity is an important component of a healthy life for older adults and can prevent many
health problems. The Centers for Disease Control and Prevention refers to active living as one of the
most important things seniors can do for their health, specifically for the prevention of health
problems and for strengthening muscles, which may help reduce the risk of falling. Specifically,
exercise reduces the risk of dying from coronary heart disease and of developing high blood pressure,
colon cancer, and diabetes. Older adults are advised to engage in both aerobic activity and muscle
strengthening activity each week.48
An estimated 39 percent of older adults participating in the Marin County Area Agency on Aging
Needs Assessment report that they exercise at least 20 minutes per day 3 to 4 times per week, while
43 percent report exercising at least 20 minutes per day, every day.49 A 2009 estimate indicates that
36 percent of all adults 60 and over in Marin are sedentary or do not engage in physical activity.50
In Marin County, 68 percent of the population lives within a half mile of a park.51 However,
disparities in access to parks and recreational facilities persist. For example, the Old Mill and Cascade
districts of Mill Valley, which are home to predominantly White residents, have 11.6 acres of
parkland per 1,000 people; compared to the Hamilton district of Novato which is 19 percent Latino
has .83 acres of parkland per 1,000 people.52
48 Centers for Disease Control and Prevention. (2015). Older Adults, Physical Activity. http://www.cdc.gov/ physicalactivity/basics/older_adults/. 49 Marin County Area Agency on Aging (AAA) Older Adult Needs Assessment. County of Marin, Division of Social Services, Office of Aging and Adult Services. (2015): www.LiveLongLiveWellMarin.org. 50 California Health Interview Survey. (2009). Data only available for 2009. 51 U.S. Census Bureau, (2010). Decennial Census. ESRI Map Gallery. 52 American Human Development Project. (2012). A Portrait of Marin. http://www.measureofamerica.org/docs /APOM_Final-SinglePages_12.14.11.pdf.
What do Marin County seniors
do to stay active?
Focus group participants report
that they engage in a wide
variety of physical activity,
including:
Walking
Biking
Cleaning house
Dancing
Yoga
Zumba and seated
Zumba
Balance classes
Qigong
Tai-Chi
Swimming
Using exercise machines

21
Physical limitations prevent many seniors from accessing active
living resources and maintaining an active lifestyle.
Older adults have varying abilities; some are able to engage in
vigorous exercise while some may be restricted to less vigorous or
lower impact exercise. Many focus group participants referenced
their balance, as well as knee and hip issues as reasons for their
diminished ability to stay active. One participant also mentioned the
impact that mental health issues, such as depression, might have on
physical activity. Other participants mentioned that the side effects
of some medicines, such as dizziness or fatigue, might make exercise
difficult.
Financial constraints prohibit some older adults from accessing
active living resources in their communities.
Finances were a recurring theme in conversations with older adults
about exercise. While some seniors mentioned free exercise
activities—such as walking and hiking—many of those who
discussed participating in or wanting to participate in exercise
classes or programs said cost was a concern. Options considered low
cost to some are not truly low cost to all. When asked about
challenges with exercise programs for seniors, providers noted that
the exercise programs at many low or no-cost community and senior
centers are under-funded and rely exclusively on volunteers, which
leads to irregular schedules.
Some seniors in Marin reported limited options for exercise.
Focus group participants expressed a desire for more physical
activity options. Some said that, compared to San Francisco, there are
fewer options for exercise classes for seniors in Marin County. Others
noted a lack of community pools. One resident mentioned a parks
program that involved free classes for seniors that no longer has
funding.
Transportation is a significant barrier for older adults seeking to
participate in active living programs outside of their homes.
Many seniors identified transportation as a substantial barrier to
accessing physical activity services. Similar to conversations around
healthy eating, older adults said that being unable to drive and
having to rely on public transit and shuttle services makes accessing
activities or resources challenging.
“There are all these wonderful programs that
happen at night but I have not been able to do it
for years because I cannot get down and back.”—
Focus group participant
“Some of [the programs are] free and some
minimal and what is minimal to me is expensive
for others.”
–Focus group participant

22
Older adults in Marin face environmental barriers to accessing active
living resources.
Focus group participants also identified a number of environmental
barriers to being able to stay active. Several mentioned conditions
such as poorly lit walking paths, and unsafe parks. As one provider
stated, “the physical barrier of the built environment...is a huge
barrier....the lack of sidewalks and highways that move and divide
neighborhoods.” Others noted that they simply felt unsafe leaving
their homes after dark for fear of petty crime.

23
Community Resources
Older adults in Marin County rely on a number of community
resources to lead healthy lives. This section focuses on the
resources older adults use to ensure they are able to eat healthy and
remain active. Given the economic insecurity many older adults in
the county face, the provision of free and low-cost services provided
by social service organizations is critical. Services in Marin County
could be improved to better meet the needs of older adults across a
spectrum of physical ability, level of independence, and economic
situation. Focus group participants revealed that many older adults
rely on these services for access to healthy food, opportunities to
exercise, and opportunities to socialize. Seniors had positive things
to say about the food banks, exercise classes, congregate meals, and
other services they engage with—many also reported finding value
not only in the services offered but also the added benefits of social
engagement afforded by the programs. Many noted areas where
these programs could expand and improve—by increasing their
hours, for example—and perhaps most importantly, many seniors
noted that they and their peers were unaware of many existing
services. Seniors and providers were asked about gaps in services
and many did not identify specific programs that were lacking but
rather identified a need for more of existing services. For example,
seniors mentioned a desire for more frequent congregate meals and
enhanced bus services. Overall, seniors expressed a desire for more
affordable programs and an elimination of eligibility requirements.
The map on this page highlights some of the many services that
support healthy eating and active living for older adults in Marin
County. Other programs not featured on this
Pickleweed Community Center
Margaret Todd Senior Center
San Rafael Community Center
Corte Madera Community Center
Marin City Senior Center
Fairfax Community Church
San Geronimo Valley Community
Center
Dance Palace
Whistlestop
West Marin Senior Services
College of Marin
YMCA in San Rafael
Community Resources Serving Older Adult in Marin County

24
“As long as we keep the food bank here, we are
going to stay healthy.” —Focus group participant
map exist within assisted living facilities, hospitals, and community
centers. In communities lacking specific resources, there was a call
for missing services, such as grocery stores in Marin City.
Seniors feel that community resources are a lifeline for healthy
eating and active living.
Older adults reported that resources including transportation
services and home delivered meals are a lifeline for them. Focus
group participants identified a wide range of programs that exist
across the county. The map on the previous page identifies some of
the resources named by focus group participants. Many
participating seniors mentioned congregate meals and home
delivered meals. The intake data from both of those groups highlight
the ways in which the populations receiving those services are in
need—specifically, that they are limited in their abilities to engage
in activities that are critical to maintaining a healthy diet such as
shopping for and preparing food.
Many seniors reported that the affordability of programs is a
concern.
One of the most frequently identified barriers to participating in
healthy eating and active living activities is cost. Seniors noted that
while some programs are free, others require a nominal fee or
request a donation. For some seniors these fees are too great. Some
exercise classes, for example cost $10 per visit and some local pools
charge $100 a year. For others, the added cost of gas or other
transportation also inhibits their ability to participate in programs.
One in five seniors in Marin lives above the federal poverty level but
below the Elder Index and would benefit from programs either
without income eligibility requirements or without a requirement
that seniors pay a share of the cost of services.
Language and cultural barriers might keep some seniors from
accessing services.
Language barriers and cultural barriers make healthy eating
challenging for some older adults. Focus group participants
included seniors from the Vietnamese and Spanish-speaking
communities in Marin County as well as the service providers who
work with them. Several seniors noted that trips to the grocery
store, which are already challenging for seniors, are even more
challenging for seniors who have limited English proficiency.
Providers also noted that language and cultural barriers present a
challenge in having conversations with clients about food choices.
25
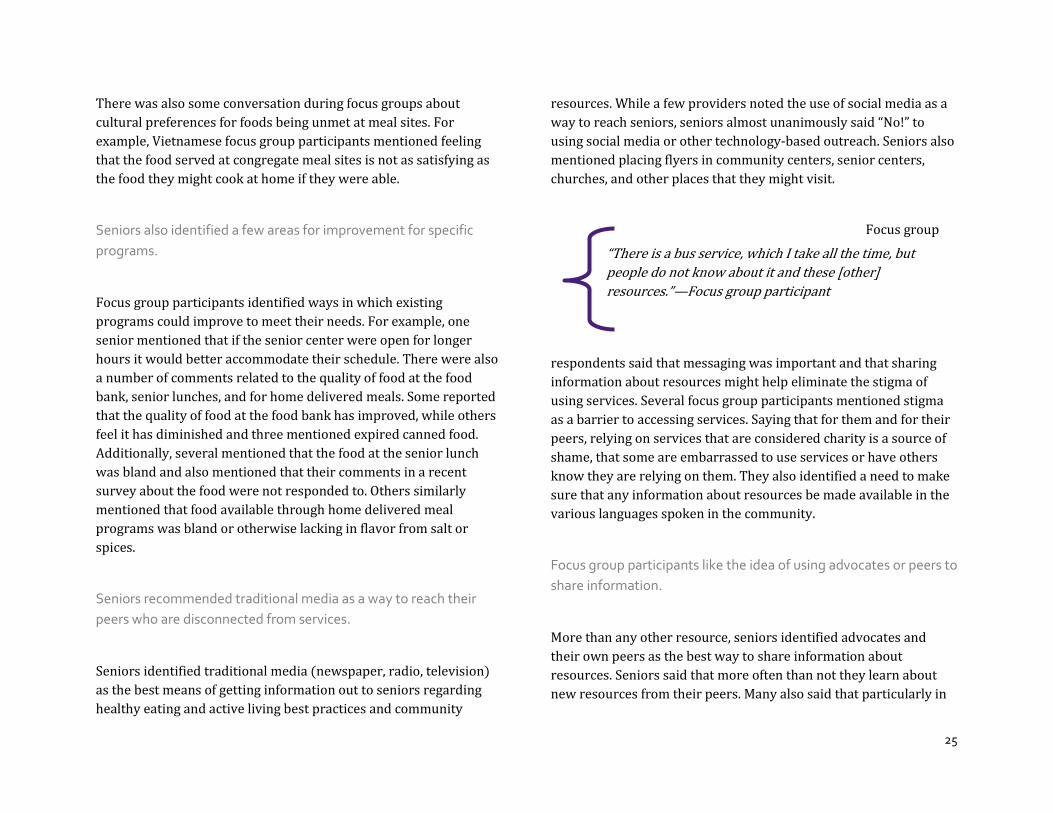
“There is a bus service, which I take all the time, but
people do not know about it and these [other]
resources.”—Focus group participant
There was also some conversation during focus groups about
cultural preferences for foods being unmet at meal sites. For
example, Vietnamese focus group participants mentioned feeling
that the food served at congregate meal sites is not as satisfying as
the food they might cook at home if they were able.
Seniors also identified a few areas for improvement for specific
programs.
Focus group participants identified ways in which existing
programs could improve to meet their needs. For example, one
senior mentioned that if the senior center were open for longer
hours it would better accommodate their schedule. There were also
a number of comments related to the quality of food at the food
bank, senior lunches, and for home delivered meals. Some reported
that the quality of food at the food bank has improved, while others
feel it has diminished and three mentioned expired canned food.
Additionally, several mentioned that the food at the senior lunch
was bland and also mentioned that their comments in a recent
survey about the food were not responded to. Others similarly
mentioned that food available through home delivered meal
programs was bland or otherwise lacking in flavor from salt or
spices.
Seniors recommended traditional media as a way to reach their
peers who are disconnected from services.
Seniors identified traditional media (newspaper, radio, television)
as the best means of getting information out to seniors regarding
healthy eating and active living best practices and community
resources. While a few providers noted the use of social media as a
way to reach seniors, seniors almost unanimously said “No!” to
using social media or other technology-based outreach. Seniors also
mentioned placing flyers in community centers, senior centers,
churches, and other places that they might visit.
Focus group
respondents said that messaging was important and that sharing
information about resources might help eliminate the stigma of
using services. Several focus group participants mentioned stigma
as a barrier to accessing services. Saying that for them and for their
peers, relying on services that are considered charity is a source of
shame, that some are embarrassed to use services or have others
know they are relying on them. They also identified a need to make
sure that any information about resources be made available in the
various languages spoken in the community.
Focus group participants like the idea of using advocates or peers to
share information.
More than any other resource, seniors identified advocates and
their own peers as the best way to share information about
resources. Seniors said that more often than not they learn about
new resources from their peers. Many also said that particularly in
26
linguistically isolated communities, having an advocate or liaison is
helpful. As one focus group participant said, “a liaison function, for
example, you would have someone able to speak the language and
access the healthy food and transportation resources. It has to be
the right liaison for each sub-population.” Notably, each of the focus
groups with seniors sparked conversation among the group about
available resources; seniors informed each other about where they
were getting food or attending fitness classes.
Seniors reported that some, but not all health care providers talk
with them about healthy eating and active living.
Most seniors said that their doctors do discuss healthy eating and
active living behaviors with them, specifically that they discuss diet
and the importance of exercise. Some say that their doctors do not
address healthy eating and active living and the onus is on the
patient to bring up these topics. Providers participating in focus
groups identified the Parks Prescription program as a new way to
encourage physicians to engage with their patients about active
living.
An estimated 1,471 adults 60 and over in Marin are enrolled in
CalFresh.53 The California Food Policy Report, in 2012, stated that
only 12 percent of older adults in California who were eligible for
CalFresh were utilizing it. Providers suggested that one reason for
under-enrollment, particularly in Marin City, might be that there are
not local food retailers that accept benefits via CalFresh,
discouraging seniors from enrolling. Out of the 86 total CalFresh
outlets in Marin, only five are in Marin City (a CVS, Golden Gate
Market, Mollie Stone’s Markets, Sausalito Market, and the New Bait
Shop Market & Deli).54
53 Penetration data for CalFresh is unavailable at this time. Specifically, estimates regarding the proportion of eligible and enrolled seniors is not available. 54EBT. https://www.ebt.ca.gov/caebtclient/cashlocationSearch.recip
The CalFresh Program, federally known as the Supplemental Nutrition Assistance Program (SNAP), had 1,471 individuals over 60 in Marin County enrolled in September 2015.i
$135.43 Average amount of CalFresh benefit among older adults
1,471 Number of older adults age 60 and over enrolled in CalFresh i Marin County CalFresh. September 2015
Recommendations
The data presented in this report tell a clear story about older adults in Marin County. While Marin County is wealthy and resource-rich, the data
presented in this report echoes that of other similar explorations in finding “a tale of two Marins.”55 This needs assessment benefitted from the
inclusion of not only a great deal of secondary data related to older adults but also conversations with older adults in Marin County and some of
the providers that work with them. Despite the wealth of much of Marin, many seniors find themselves in a financially unstable situation and
find it challenging to maintain a healthy and active lifestyle.
The recommendations in this section focus on policy, systems, and environment (PSE) intervention framework—areas in which the Marin
Community Foundation (MCF) seeks to affect change through its grant making. MCF’s hope is that PSE changes will improve access to healthy
food and physical activity which leads to healthy, safe, and livable environments resulting in improved health outcomes for Marin County
residents over the long term.
Policy
Policy change strategies might include changes to the policies and regulations of organizations as well as local government. In this section we
highlight policy changes that both the primary and secondary data suggest might benefit older adults in Marin County as they seek to eat
healthier and stay active.
More robust local data are needed to accurately understand the health outcomes and healthy eating and active living habits and needs of
older adults within Marin County. While many national and state-level data collection efforts, the American Community Survey and the
California Health Interview Survey included, do sample Marin County, the sample size is often too small to allow for important, decisive
data about specific subgroups. As is noted throughout this report, data often cannot be stratified by age, geography, or other
characteristics. For this reason, it would be beneficial for Marin County, in partnership with state and other local organizations, to fund
local data collection efforts aimed at gathering information from a larger sample of older adults in Marin County.
The Elder Economic Security Index should be used as a tool for local policy-making decisions in order to accurately reflect the economic
situations faced by seniors and should also be a factor in decisions regarding program planning for service providers. Those older adults
55 American Human Development Project. (2012). A Portrait of Marin. http://www.measureofamerica.org/docs/APOM_Final-SinglePages_12.14.11.pdf.

28
who fall above the federal poverty level but below the Elder Index, would benefit from programs that take into account the high cost of
living in Marin County by using the Elder Index as a threshold for provision of low-cost or free services.
Policies that address root causes of inequalities—most importantly, poverty—should be prioritized by local government and supported
by private and nonprofit organizations. Disparate utilization of healthcare resources and disparate health outcomes across economic
lines speaks to the need to address economic inequalities.
The voices of seniors should be central in decision making for senior-serving programs. Programs should regularly assess whether they
meet the needs of seniors in their community and should seek creative solutions. For example, seniors participating in focus groups
emphasized the ways in which liaisons or peer advocates could provide a critical linkage point for seniors to services, particularly for
isolated seniors. Systems (particularly funder collaboratives) could explore ways to fund advocates using the promotora model.
Systems
Changes to systems might include changes to organizations, institutions, or whole systems. The Marin Community Foundation sits within and
alongside a number of systems including the network of public, private, and nonprofit organizations working in Marin County as well as funder
collaboratives.
Public, private, and nonprofit organizations should foster multi-sector collaborative funding efforts to create healthier communities for
older adults. These might include funder collaboratives focused on HEAL for older adults that promote models known to be effective.
Improvements focused on older adults, for example addressing the lack of healthy food retail in West Marin or the need for better lit
paths—will create healthier communities for Marin residents of all ages.
Community collaboratives should continue to support local nutrition programs for older adults. Nationally, the Older Americans
Act (OAA) Nutrition Programs fund congregate (group) meal programs and home delivered meal programs. A 2015 report from
the U.S. Department of Health and Human Services Administration on Aging makes a case for collaborative community efforts to
support older adults’ healthy eating. The report states that the OAA Nutrition Programs alone cannot meet the food and
nutrition assistance needs and nutrition health promotion needs of all older adults and recommends that local OAA Nutrition
Programs function as a collaborator to coordinate and leverage other nutrition resources in order to minimize duplication and
maximize available resources.56
56 Lloyd, JL, Wellman NS. (2015). Older Americans Act Nutrition Programs: A Community-Based Nutrition Program Helping Older Adults Remain at Home. Journal of Nutrition in Gerontology and Geriatrics. 34:2, 90-109.
29
Similarly, public, private, and nonprofit organizations should collaborate and share information about programs and data when focused
on common goals. MCF’s relationship with Marin County Aging and Adult Services is an example of an effective collaborative effort. As
the population of older adults in Marin County grows, the needs identified in this report will only increase and demand for services will
grow, necessitating coordinated action among senior-serving organizations.
Systems should work to infuse an equity lens in their work, focusing on addressing the needs of vulnerable older adults by addressing
disparities by not only age but also language, race, gender, geography, and income. Efforts in this arena could include things like working
towards establishing healthy food retail outlets in the parts of Marin County that currently lack those outlets.
Environment
Changes to the environment might include changes to the economic, social, or physical environment.
The built environment—the infrastructure, homes, buildings, and public spaces older adults live in and navigate—can be a barrier to access
to healthy food and active living opportunities. Seniors identified the lack of sidewalks and clear walking paths in some areas as factors that
limit their ability to access healthy food resources and limit their opportunities to be active in their neighborhoods. Seniors also identified
safety issues, including poorly lit paths and concerns about petty crime in some areas. Environmental changes in this area might include
solutions like installing new lights on paths, increasing the time to cross at cross-walks, or adding benches at bus stops. Other solutions
might involve more systemic approaches to urban planning that are reflective of the needs of older adults such as developing accessible,
affordable housing.
In Marin County, many older adults identified transportation as a key area in need of change in order meet the needs of older adults. Local
systems should consider the ways transportation design and different transportation options can take into account the needs of older adults
in an effort to make transportation less of a barrier to healthy eating and active living resources for older adults.

30
MCF HEAL Secondary Data Appendix Prepared by Harder+Company
March 2016

31
A. County of Marin, Aging and Adult Services Congregate and Home Delivered
Participant Intake Analysis: Marin County Ages 60-107 (2014-2015)
Congregate Meals (n=922) Congregate Meal data recorded for older adults between the ages of 60 and 107. Average age is 75 years old. A1. Income Count % Above 100% FPL 223 24% At or below 100% FPL 116 12% Declined to state 582 63% Total* 921 99% A2. “Do you have any illness or condition that made you change the kind and/or
the amount of food you eat?” Count % Yes 195 21% No 606 65% Unknown 22 2% Declined to state 99 10% Total* 922 98% A3. “Do you eat fewer than two meals per day?” Count % Yes 97 10% No 724 78% Unknown 12 1% Declined to state 89 9% Total* 922 98% A4. “Do you have tooth or mouth problems that make it hard for you to eat?” Count % Yes 40 4%
No 772 83% Unknown 11 1% Declined to state 99 10% Total* 922 98% A5. “Do you run out of money for food most months?” Count % Yes 119 12% No 694 75% Unknown 9 1% Declined to state 100 10% Total 922 98% A6. “Do you eat alone most of the time?” Count % Yes 146 15% No 642 69% Unknown 11 1% Declined to state 123 13% Total 922 98% A7. “Have you, without wanting to, lost or gained 10 or more pounds in the last
six months?” Count % Yes 404 43% No 410 44%

32
Unknown 11 1% Declined to state 97 10% Total 922 98% A8. “Are you physically unable to shop, cook, and/or feed yourself?” Count %
Yes 125 13% No 672 72% Unknown 21 2% Declined to state 104 11% Total 922 98%
Home Delivered Meals (n=529) Home delivered meal data is for older adults between the ages of 62 and 104. Average age is 79 years old. Income
Above FPL 265 48%
At or Below FLP 195 35%
Missing/ Decline to State 94 17%
Activities of Daily Living A9. Walking Count % Independent 322 61% Some human help 125 23% Lots of human help 38 7% Dependent 32 6% Verbal assistance 5 1% Unknown 4 <1% Declined to state 1 <1% Total 527 100% A10. Shopping Count % Dependent 349 66% Lots of human help 103 19% Independent 40 7% Some human help 31 5% Verbal assistance 2 <1% Declined to state 2 <1% Unknown 0 --
Total* 527 99%* A11. Meal Preparation Count % Dependent 166 31% Some human help 154 29% Lots of human help 125 23% Independent 78 14% Verbal assistance 2 <1% Declined to state 1 <1% Unknown 1 <1% Total 527 100% A12. “Do you have an illness/condition that made you change the kind and/or
amount of food you eat?” Count % Yes 180 34% No 341 64% Unknown 1 <1% Declined to state 4 <1% Total 526 100% A13. “Do you eat fewer than two meals per day?” Count % Yes 83 15% No 435 82% Unknown 4 <1% Declined to state 4 <1%

33
Total* 526 99%* A14. “Do you have tooth or mouth problems that make it hard to eat?” Count % Yes 20 3% No 497 94% Unknown 5 1% Declined to state 4 <1% Total* 526 99%* A15. “Do you eat alone most of the time?” Count % Yes 197 37% No 321 61% Unknown 4 <1% Declined to state 4 <1% Total 526 100% A16. “Have you, without wanting to, lost or gained 10 or more pounds in the
last six months?” Count % Yes 419 79% No 98 18% Unknown 4 <1% Declined to state 5 <1% Total 526 99%
A17. “Are you physically unable to shop, cook, and/or feed yourself?” Count % Yes 160 30% No 359 68% Unknown 4 <1% Declined to state 3 <1% Total 526 100% A18. “Do you have a working refrigerator and/or microwave?” Count % Yes 430 81%
No 90 17% Unknown 2 <1% Declined to state 4 <1% Total 526 100% A19. “Are you physically and mentally able to open food containers?” Count % Yes 430 81% No 90 17% Unknown 2 <1% Declined to state 4 <1% Total 526 100% *Totals may not equal 100% due to rounding

34
Demographics B1. Demographics Comparison – Needs Assessment Survey vs. the American
Community Survey (ACS)57 Survey ACS
Count % %
Gender (n=2947)
Male 854 29.0% 45.2%
Female 2085 70.7% 54.8%
Transgender 8 0.3% N/A
Housing (n=2958)
Own 1950 65.9% 75.5%
Rent 552 18.7% 24.5%
Assisted Living/Nursing home 68 2.3% -
Senior Housing 228 7.7% -
Affordable Housing 154 5.2% -
Stay with Friends and Family 89 3.0% -
Other 126 4.3% -
Relationship Status (n=2919)
Single 368 12.6% 7.9%
Married 1215 41.6% 55.7%
Partnered 120 4.1% -
Divorced/Widowed/Separated 1216 41.7% 36.5%
Survey ACS
Count % %
Age (n=2992)
60-64 455 15.2% -
65-69 652 21.8% -
70-74 585 19.6% -
57 American Community Survey 5-Year Estimates & CHIS 2011-2014
75-79 470 15.7% -
80-84 389 13.0% -
85 or older 441 14.7% -
Median Age 70-74 - 69.1
Race (n=2927)
White (non-Latino) 2584 88.3% 91.0%
Asian (non-Latino) 89 3.0% 4.5%
African American/Black 86 2.9% 1.6% Native American/Alaskan Native 11 0.4% 0.1%
Native Hawaiian/Pacific Islander 4 0.1% 0.3%
Other 117 4.0% 1.2%
Two or more races 60 2.0% 1.4%
Ethnicity (n=2876)
Hispanic/Latino 143 5.0% 4.3%
Non-Hispanic/Latino 2733 95.0% 95.7%
*Data deemed statistically unstable

35
B2. Preferred Language (n=2,963) Language Count %
Arabic 1 0.03%
English 2835 95.68%
Farsi 3 0.10%
French 5 0.17%
German 4 0.13%
Italian 2 0.07%
Japanese 3 0.10%
Klingon 1 0.03%
Korean 1 0.03%
Lithuanian 1 0.03%
Norwegian 1 0.03%
Portuguese 2 0.07%
Russian 8 0.27%
Spanish 79 2.67%
Tagalog 1 0.03%
Vietnamese 16 0.54%
Total 2963 100.00%
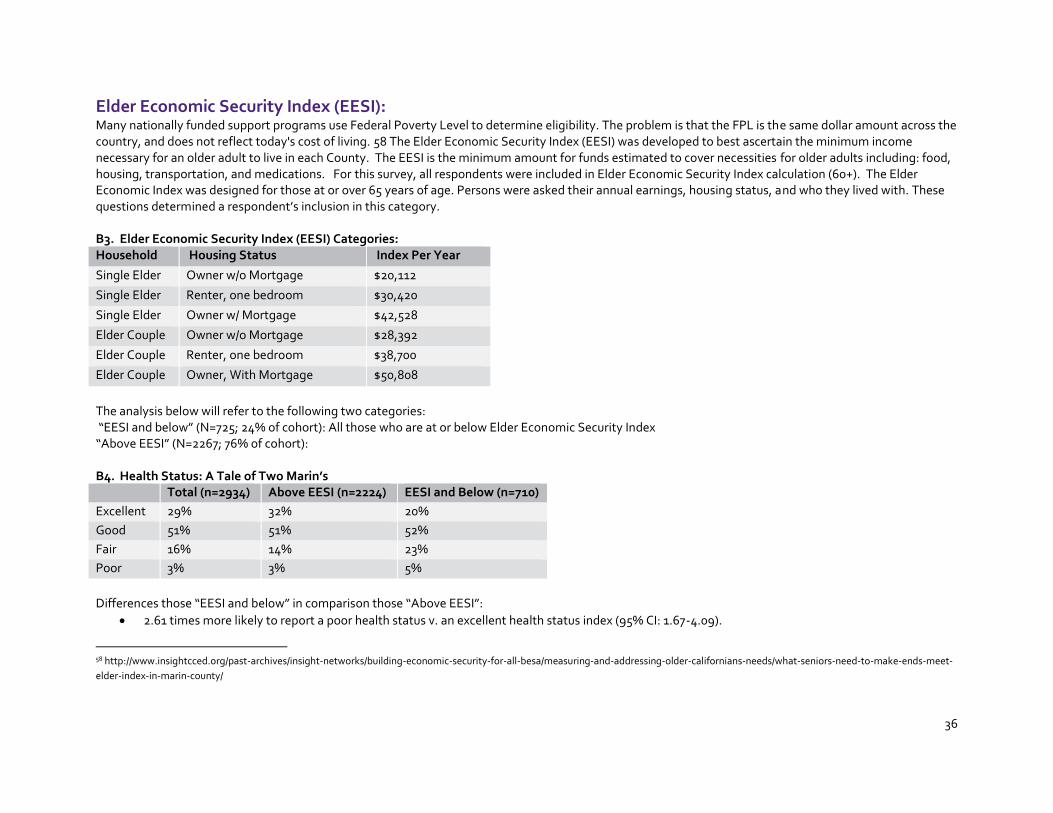
36
Elder Economic Security Index (EESI): Many nationally funded support programs use Federal Poverty Level to determine eligibility. The problem is that the FPL is the same dollar amount across the country, and does not reflect today's cost of living. 58 The Elder Economic Security Index (EESI) was developed to best ascertain the minimum income necessary for an older adult to live in each County. The EESI is the minimum amount for funds estimated to cover necessities for older adults including: food, housing, transportation, and medications. For this survey, all respondents were included in Elder Economic Security Index calculation (60+). The Elder Economic Index was designed for those at or over 65 years of age. Persons were asked their annual earnings, housing status, and who they lived with. These questions determined a respondent’s inclusion in this category. B3. Elder Economic Security Index (EESI) Categories: Household Housing Status Index Per Year
Single Elder Owner w/o Mortgage $20,112
Single Elder Renter, one bedroom $30,420
Single Elder Owner w/ Mortgage $42,528
Elder Couple Owner w/o Mortgage $28,392
Elder Couple Renter, one bedroom $38,700
Elder Couple Owner, With Mortgage $50,808
The analysis below will refer to the following two categories: “EESI and below” (N=725; 24% of cohort): All those who are at or below Elder Economic Security Index “Above EESI” (N=2267; 76% of cohort): B4. Health Status: A Tale of Two Marin’s Total (n=2934) Above EESI (n=2224) EESI and Below (n=710)
Excellent 29% 32% 20%
Good 51% 51% 52%
Fair 16% 14% 23%
Poor 3% 3% 5%
Differences those “EESI and below” in comparison those “Above EESI”:
2.61 times more likely to report a poor health status v. an excellent health status index (95% CI: 1.67-4.09).
58 http://www.insightcced.org/past-archives/insight-networks/building-economic-security-for-all-besa/measuring-and-addressing-older-californians-needs/what-seniors-need-to-make-ends-meet-
elder-index-in-marin-county/

37
Nutrition Risk Nutritional Risk is determined by asking a set of questions approved by the California Department of Aging. Each question is assigned a numeric “score.” The sum of scores equate to the following: 0-2: Not at risk 3-5: Moderate Nutritional Risk 6 or More: High Nutritional Risk B5. Nutrition Risk Scores
Nutrition “Score” Per Question
Question
2 Do you have an illness or condition that made you changed your diet and/or amount of food you eat?
3 Do you eat fewer than 2 meals per day?
2 Do you eat few servings* of fruits or vegetables, or milk/dairy products per day?
2 Do you drink 3 or more alcoholic beverages almost everyday?
2 Do you have tooth or mouth problems that make it hard for you to eat or chew?
4 Do you run out of money for food most months?
1 Do you eat alone most of the time?
1 Do you take 3 or more prescribed or over-the-counter drugs a day?
2 Have you without trying, gained or lost 10 pounds in the last 6 months?
2 Are you physically unable to shop, cook and/or feed yourself?
B6. Nutritional Risk All Cohort (n=2,992) Above EESI (n=2267) EESI and below (n=725)
Count % Count % Count %
Not at Risk 1155 39% 951 42% 204 28%
Moderate Risk 1086 36% 843 37% 243 34%
High Risk 751 25% 473 21% 278 38%
Differences those “EESI and below” in comparison those “Above EESI”:
2.74 times more likely to be at high nutritional risk v. no nutritional risk (95% CI: 2.22-3.39).

38
B7. Nutrition Questions Nutrition Question All Cohort Above EESI EESI and below
Do you eat alone most of the time? 54% 42% 61%
Do you east fewer than 2 meals per day? 7% 6% 11%
Do you eat fewer than 5 servings of fruit or vegetables per day or fewer than 2 servings of milk/ dairy products per day?
44% 41% 53%
Do you have tooth or mouth problems that make it difficult for you to chew?
11% 9% 19%
Do you have an illness or condition that made you change the kind/ amount of food you eat?
26% 24% 33%
Do you run out of money for food most months? 10% 7% 46%
Do you take 3 or more prescribed or over the counter medications per day?
54% 54% 55%
Without trying, have you gained or lost 10 pounds or more in the past 6 months?
18% 17% 22%
Are you physically unable to shop, cook, or feed yourself 14% 14% 27%
Do you have 3 or more drinks or liquor, wine, or beer almost every day?
7% 8% 5%
Differences those “EESI and below” in comparison those “Above EESI”
2.22 times more likely to report eating alone most of the time (95% CI: 1.87-2.65).
2.08 times more likely to report eating fewer than 2 meals a day in comparison to those who are not in the elder economic index and below (95% CI: 1.54-2.79).
1.63 times more likely to report eating fewer than 5 servings of fruits or vegetables per day or fewer than two servings milk/dairy products per day (95% CI: 1.38-1.93).
2.52 times more likely to report tooth or mouth problems that make it hard to eat or chew (95% CI: 1.99-3.20).
1.54 times more likely to report an illness or condition that changed their diet (95% CI: 1.28-1.85).
3.12 times more likely to report running out of money for food most months (95% CI: 2.43-4.00).

39
Exercise B8. “How often do you get 20 minutes of Exercise per day?” All (n=2,934) Above EESI (n=2221) EESI and Below
(n=713) Not at All 8% 7% 11%
3-4 Times a month 9% 9% 12%
3-4 times per week 39% 39% 39%
Every Day 43% 45% 37%
Differences those “EESI and below” in comparison vs those not “Above EESI”:
1.78 times more likely to report not exercising at all versus exercising daily (95% CI: 1.32-2.41).
1.70 times more likely to report exercising only 3-4 times a month versus exercising daily in (95% CI: 1.27-2.26).
Concerns Respondents were asked their level of concern for a variety of items. In the chart below, “% Yes” indicates those who felt any level of concern towards the delineated topic. All items of concern are listed. As demonstrated below, the top 7 concerns remained consistent across the three groups. B9. Concerns Ranking Above EESI % Yes EESI and below % Yes Total Cohort % Yes Having an accident in/out of the house
62% Financial Security 66% Having an accident in/out of the house 63%
Losing my memory/ cognition 58% Losing my memory/cognition 66% Losing my memory/cognition 60% Financial Security 44% Having an accident in/out of the house 66% Financial Security 50% End of life planning 42% End of life plans 51% Crime, financial abuse 44% Crime/ financial abuse 42% Feeling isolated or depressed 49% End of life plans 44% Feeling Isolated/ Depressed 35% Crime, financial abuse 49% Feeling isolated or depressed 39% Knowing where to access information about benefits
33% Knowing where to access information about benefits
48% Knowing where to access information about benefits
37%
Legal Affairs 29% Paying for a caregiver 45% Legal Affairs 32% Paying a caregiver 27% Health Insurance/Medicare 40% Paying for a caregiver 31% How to use cell phones and internet 26% Legal Affairs 40% How to use cell phones and internet 29% Health insurance/ Medicare 26% Getting out of the house to socialize 37% Health Insurance/Medicare 29% Getting out of the house to socialize 22% Transportation 37% Getting out of the house to socialize 26%

40
Above EESI % Yes EESI and below % Yes Total Cohort % Yes Transportation 22% How to use cell phones and internet 37% Transportation 26% Finding a caregiver 21% Housing 36% Finding a caregiver 24% Housing 21% Finding a caregiver 34% Housing 24% Understanding my medications 13% Having enough food to eat 24% Finding work (employment) 16% Finding employment 13% Finding work (employment) 24% Understanding my medications 15% Having enough food to eat 10% Understanding my medications 19% Having enough food to eat 13% Nutrition Differences those “EESI and below” in comparison those “Above EESI”:
2.90 times more likely to report any level of concern about having enough food to eat (95% CI: 2.32-3.64).

41
C. American Community Survey (ACS), Population 60Years and Over in Marin County, compared to California and United States (2010-2014)
United States California Marin County, California Total 60 years and over Total 60 years and over Total 60 years and over Estimate Margin
of Error
Estimate Margin of Error
Estimate Margin of Error
Estimate Margin of Error
Estimate
Margin of Error
Estimate
Margin of Error
Total population 314,107,084 ***** 61,151,720 +/-19,329
38,066,920
***** 6,601,123 +/-7,302
256,802 ***** 66,492 +/-788
SEX AND AGE Male 49.2% +/-0.1 44.9% +/-0.1 49.7% +/-0.1 45.1% +/-0.1 49.0% +/-0.1 45.2% +/-0.5 Female 50.8% +/-0.1 55.1% +/-0.1 50.3% +/-0.1 54.9% +/-0.1 51.0% +/-0.1 54.8% +/-0.5 Median age (years) 37.4 +/-0.1 69.5 +/-0.1 35.6 +/-0.1 69.3 +/-0.1 45.1 +/-0.1 69.1 +/-0.3 RACE AND HISPANIC OR LATINO ORIGIN
One race 97.1% +/-0.1 98.9% +/-0.1 95.5% +/-0.1 98.1% +/-0.1 95.9% +/-0.4 98.6% +/-0.3 White 73.8% +/-0.1 83.4% +/-0.1 62.1% +/-0.1 72.0% +/-0.1 79.4% +/-0.6 91.0% +/-0.5 Black or African American
12.6% +/-0.1 9.2% +/-0.1 5.9% +/-0.1 5.4% +/-0.1 2.7% +/-0.2 1.6% +/-0.2
American Indian and Alaska Native
0.8% +/-0.1 0.5% +/-0.1 0.8% +/-0.1 0.6% +/-0.1 0.3% +/-0.1 0.1% +/-0.1
Asian 5.0% +/-0.1 4.0% +/-0.1 13.5% +/-0.1 14.2% +/-0.1 5.7% +/-0.2 4.5% +/-0.3 Native Hawaiian and Other Pacific Islander
0.2% +/-0.1 0.1% +/-0.1 0.4% +/-0.1 0.3% +/-0.1 0.2% +/-0.1 0.3% +/-0.1
Some other race 4.7% +/-0.1 1.7% +/-0.1 12.8% +/-0.1 5.5% +/-0.1 7.7% +/-0.6 1.2% +/-0.3 Two or more races 2.9% +/-0.1 1.1% +/-0.1 4.5% +/-0.1 1.9% +/-0.1 4.1% +/-0.4 1.4% +/-0.3 Hispanic or Latino origin (of any race)
16.9% +/-0.1 7.8% +/-0.1 38.2% ***** 19.4% +/-0.1 15.7% ***** 4.3% +/-0.3

42
United States California Marin County, California Total 60 years and over Total 60 years and over Total 60 years and over Estimate Margin
of Error
Estimate Margin of Error
Estimate Margin of Error
Estimate Margin of Error
Estimate
Margin of Error
Estimate
Margin of Error
White alone, not Hispanic or Latino
62.8% +/-0.1 77.8% +/-0.1 39.2% +/-0.1 59.1% +/-0.1 72.3% +/-0.1 88.2% +/-0.4
RELATIONSHIP Population in households
306,058,480
***** 59,431,503 +/-18,839
37,251,410 ***** 6,439,978 +/-7,360
248,214 +/-756 64,988 +/-775
Householder or spouse
56.3% +/-0.2 88.8% +/-0.2 50.5% +/-0.1 82.1% +/-0.2 62.3% +/-0.6 91.1% +/-0.9
Parent 1.3% +/-0.1 4.7% +/-0.1 2.1% +/-0.1 8.4% +/-0.1 0.9% +/-0.2 2.7% +/-0.5 Other relatives 36.5% +/-0.1 4.0% +/-0.1 40.4% +/-0.1 6.1% +/-0.1 30.1% +/-0.5 2.0% +/-0.4 Nonrelatives 5.9% +/-0.1 2.4% +/-0.1 7.1% +/-0.1 3.5% +/-0.1 6.7% +/-0.5 4.2% +/-0.6 Unmarried partner
2.3% +/-0.1 1.0% +/-0.1 2.3% +/-0.1 1.1% +/-0.1 2.2% +/-0.2 1.6% +/-0.3
HOUSEHOLDS BY TYPE
Households 116,211,092 +/-230,463
36,944,324
+/-112,307
12,617,280 +/-20,413
3,736,318 +/-11,988
103,034 +/-765 42,364 +/-702
Family households
66.2% +/-0.1 56.9% +/-0.1 68.7% +/-0.1 58.3% +/-0.2 62.3% +/-1.0 50.0% +/-1.5
Married-couple family
48.4% +/-0.1 46.3% +/-0.1 49.1% +/-0.2 45.6% +/-0.2 50.0% +/-1.0 43.3% +/-1.4
Female householder, no husband present, family
13.0% +/-0.1 8.1% +/-0.1 13.6% +/-0.1 9.5% +/-0.1 8.8% +/-0.7 4.8% +/-0.6
Nonfamily households
33.8% +/-0.1 43.1% +/-0.1 31.3% +/-0.1 41.7% +/-0.2 37.7% +/-1.0 50.0% +/-1.5
Householder living alone
27.6% +/-0.1 40.2% +/-0.2 24.1% +/-0.1 37.6% +/-0.2 30.7% +/-0.9 43.8% +/-1.4
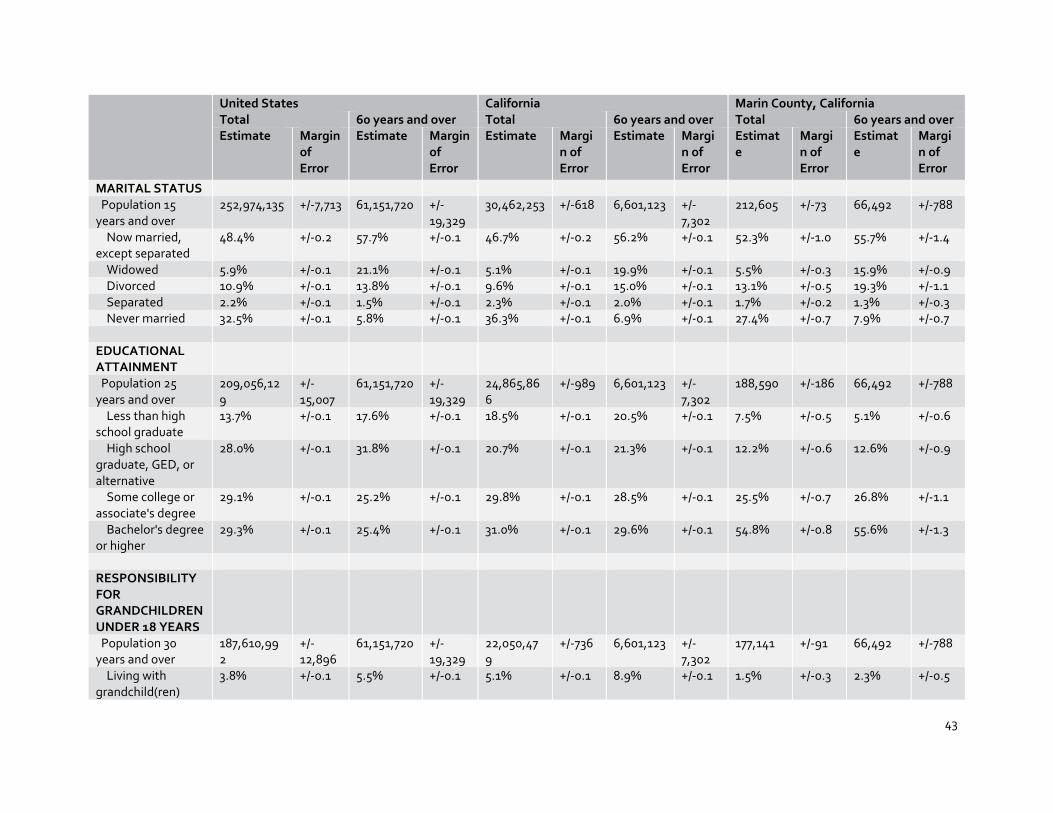
43
United States California Marin County, California Total 60 years and over Total 60 years and over Total 60 years and over Estimate Margin
of Error
Estimate Margin of Error
Estimate Margin of Error
Estimate Margin of Error
Estimate
Margin of Error
Estimate
Margin of Error
MARITAL STATUS Population 15 years and over
252,974,135 +/-7,713 61,151,720 +/-19,329
30,462,253 +/-618 6,601,123 +/-7,302
212,605 +/-73 66,492 +/-788
Now married, except separated
48.4% +/-0.2 57.7% +/-0.1 46.7% +/-0.2 56.2% +/-0.1 52.3% +/-1.0 55.7% +/-1.4
Widowed 5.9% +/-0.1 21.1% +/-0.1 5.1% +/-0.1 19.9% +/-0.1 5.5% +/-0.3 15.9% +/-0.9 Divorced 10.9% +/-0.1 13.8% +/-0.1 9.6% +/-0.1 15.0% +/-0.1 13.1% +/-0.5 19.3% +/-1.1 Separated 2.2% +/-0.1 1.5% +/-0.1 2.3% +/-0.1 2.0% +/-0.1 1.7% +/-0.2 1.3% +/-0.3 Never married 32.5% +/-0.1 5.8% +/-0.1 36.3% +/-0.1 6.9% +/-0.1 27.4% +/-0.7 7.9% +/-0.7 EDUCATIONAL ATTAINMENT
Population 25 years and over
209,056,129
+/-15,007
61,151,720 +/-19,329
24,865,866
+/-989 6,601,123 +/-7,302
188,590 +/-186 66,492 +/-788
Less than high school graduate
13.7% +/-0.1 17.6% +/-0.1 18.5% +/-0.1 20.5% +/-0.1 7.5% +/-0.5 5.1% +/-0.6
High school graduate, GED, or alternative
28.0% +/-0.1 31.8% +/-0.1 20.7% +/-0.1 21.3% +/-0.1 12.2% +/-0.6 12.6% +/-0.9
Some college or associate's degree
29.1% +/-0.1 25.2% +/-0.1 29.8% +/-0.1 28.5% +/-0.1 25.5% +/-0.7 26.8% +/-1.1
Bachelor's degree or higher
29.3% +/-0.1 25.4% +/-0.1 31.0% +/-0.1 29.6% +/-0.1 54.8% +/-0.8 55.6% +/-1.3
RESPONSIBILITY FOR GRANDCHILDREN UNDER 18 YEARS
Population 30 years and over
187,610,992
+/-12,896
61,151,720 +/-19,329
22,050,479
+/-736 6,601,123 +/-7,302
177,141 +/-91 66,492 +/-788
Living with grandchild(ren)
3.8% +/-0.1 5.5% +/-0.1 5.1% +/-0.1 8.9% +/-0.1 1.5% +/-0.3 2.3% +/-0.5
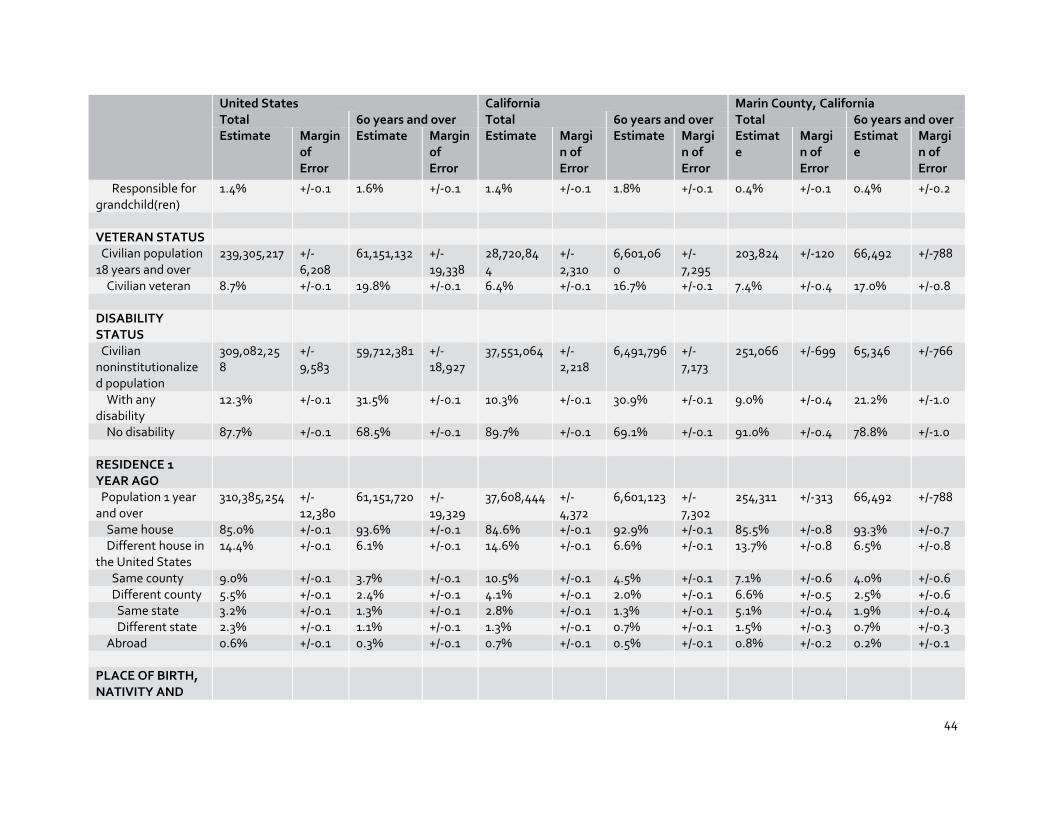
44
United States California Marin County, California Total 60 years and over Total 60 years and over Total 60 years and over Estimate Margin
of Error
Estimate Margin of Error
Estimate Margin of Error
Estimate Margin of Error
Estimate
Margin of Error
Estimate
Margin of Error
Responsible for grandchild(ren)
1.4% +/-0.1 1.6% +/-0.1 1.4% +/-0.1 1.8% +/-0.1 0.4% +/-0.1 0.4% +/-0.2
VETERAN STATUS Civilian population 18 years and over
239,305,217 +/-6,208
61,151,132 +/-19,338
28,720,844
+/-2,310
6,601,060
+/-7,295
203,824 +/-120 66,492 +/-788
Civilian veteran 8.7% +/-0.1 19.8% +/-0.1 6.4% +/-0.1 16.7% +/-0.1 7.4% +/-0.4 17.0% +/-0.8 DISABILITY STATUS
Civilian noninstitutionalized population
309,082,258
+/-9,583
59,712,381 +/-18,927
37,551,064 +/-2,218
6,491,796 +/-7,173
251,066 +/-699 65,346 +/-766
With any disability
12.3% +/-0.1 31.5% +/-0.1 10.3% +/-0.1 30.9% +/-0.1 9.0% +/-0.4 21.2% +/-1.0
No disability 87.7% +/-0.1 68.5% +/-0.1 89.7% +/-0.1 69.1% +/-0.1 91.0% +/-0.4 78.8% +/-1.0 RESIDENCE 1 YEAR AGO
Population 1 year and over
310,385,254 +/-12,380
61,151,720 +/-19,329
37,608,444 +/-4,372
6,601,123 +/-7,302
254,311 +/-313 66,492 +/-788
Same house 85.0% +/-0.1 93.6% +/-0.1 84.6% +/-0.1 92.9% +/-0.1 85.5% +/-0.8 93.3% +/-0.7 Different house in the United States
14.4% +/-0.1 6.1% +/-0.1 14.6% +/-0.1 6.6% +/-0.1 13.7% +/-0.8 6.5% +/-0.8
Same county 9.0% +/-0.1 3.7% +/-0.1 10.5% +/-0.1 4.5% +/-0.1 7.1% +/-0.6 4.0% +/-0.6 Different county 5.5% +/-0.1 2.4% +/-0.1 4.1% +/-0.1 2.0% +/-0.1 6.6% +/-0.5 2.5% +/-0.6 Same state 3.2% +/-0.1 1.3% +/-0.1 2.8% +/-0.1 1.3% +/-0.1 5.1% +/-0.4 1.9% +/-0.4 Different state 2.3% +/-0.1 1.1% +/-0.1 1.3% +/-0.1 0.7% +/-0.1 1.5% +/-0.3 0.7% +/-0.3 Abroad 0.6% +/-0.1 0.3% +/-0.1 0.7% +/-0.1 0.5% +/-0.1 0.8% +/-0.2 0.2% +/-0.1 PLACE OF BIRTH, NATIVITY AND

45
United States California Marin County, California Total 60 years and over Total 60 years and over Total 60 years and over Estimate Margin
of Error
Estimate Margin of Error
Estimate Margin of Error
Estimate Margin of Error
Estimate
Margin of Error
Estimate
Margin of Error
CITIZENSHIP STATUS, AND YEAR OF ENTRY Total population 314,107,084 ***** 61,151,720 +/-
19,329 38,066,920
***** 6,601,123 +/-7,302
256,802 ***** 66,492 +/-788
Native 273,050,199 +/-102,724
53,234,323 +/-34,300
27,776,284 +/-30,066
4,459,690
+/-10,250
208,325 +/-1,508
54,174 +/-934
Foreign born 41,056,885 +/-102,798
7,917,397 +/-25,064
10,290,636
+/-30,066
2,141,433 +/-9,677
48,477 +/-1,508
12,318 +/-750
Entered 2010 or later
7.1% +/-0.1 2.8% +/-0.1 4.8% +/-0.1 2.1% +/-0.1 5.8% +/-1.1 1.0% +/-0.5
Entered 2000 to 2009
30.5% +/-0.1 10.1% +/-0.1 25.2% +/-0.1 9.9% +/-0.2 30.3% +/-2.0 4.4% +/-1.5
Entered before 2000
62.4% +/-0.1 87.1% +/-0.1 70.0% +/-0.1 88.1% +/-0.2 63.9% +/-2.0 94.6% +/-1.5
Naturalized U.S. citizen
45.8% +/-0.2 70.9% +/-0.2 47.7% +/-0.2 71.2% +/-0.3 43.9% +/-1.6 77.2% +/-3.2
Not a U.S. citizen
54.2% +/-0.2 29.1% +/-0.2 52.3% +/-0.2 28.8% +/-0.3 56.1% +/-1.6 22.8% +/-3.2
LANGUAGE SPOKEN AT HOME AND ABILITY TO SPEAK ENGLISH
Population 5 years and over
294,133,373 +/-3,687
61,151,720 +/-19,329
35,545,621 +/-531 6,601,123 +/-7,302
243,549 +/-46 66,492 +/-788
English only 79.1% +/-0.1 85.3% +/-0.1 56.2% +/-0.1 65.2% +/-0.1 76.5% +/-0.7 84.5% +/-0.9 Language other than English
20.9% +/-0.1 14.7% +/-0.1 43.8% +/-0.1 34.8% +/-0.1 23.5% +/-0.7 15.5% +/-0.9

46
United States California Marin County, California Total 60 years and over Total 60 years and over Total 60 years and over Estimate Margin
of Error
Estimate Margin of Error
Estimate Margin of Error
Estimate Margin of Error
Estimate
Margin of Error
Estimate
Margin of Error
Speak English less than "very well"
8.6% +/-0.1 8.5% +/-0.1 19.1% +/-0.1 22.9% +/-0.1 9.1% +/-0.4 6.1% +/-0.7
EMPLOYMENT STATUS
Population 16 years and over
248,775,628
+/-15,776
61,151,720 +/-19,329
29,934,838
+/-3,523
6,601,123 +/-7,302
209,617 +/-365 66,492 +/-788
In labor force 63.9% +/-0.1 28.0% +/-0.1 63.8% +/-0.1 28.7% +/-0.1 65.0% +/-0.8 39.7% +/-1.2 Civilian labor force
63.5% +/-0.1 28.0% +/-0.1 63.4% +/-0.1 28.7% +/-0.1 65.0% +/-0.8 39.7% +/-1.2
Employed 57.7% +/-0.1 26.2% +/-0.1 56.4% +/-0.1 26.3% +/-0.1 60.3% +/-0.7 37.8% +/-1.2 Unemployed 5.8% +/-0.1 1.8% +/-0.1 7.0% +/-0.1 2.4% +/-0.1 4.7% +/-0.4 1.9% +/-0.3 Percent of civilian labor force
9.2% +/-0.1 6.4% +/-0.1 11.0% +/-0.1 8.4% +/-0.1 7.2% +/-0.5 4.9% +/-0.9
Armed forces 0.4% +/-0.1 0.0% +/-0.1 0.4% +/-0.1 0.0% +/-0.1 0.1% +/-0.1 0.0% +/-0.1 Not in labor force 36.1% +/-0.1 72.0% +/-0.1 36.2% +/-0.1 71.3% +/-0.1 35.0% +/-0.8 60.3% +/-1.2 INCOME IN THE PAST 12 MONTHS (IN 2014 INFLATION-ADJUSTED DOLLARS)
Households 116,211,092 +/-230,463
36,944,324
+/-112,307
12,617,280 +/-20,413
3,736,318 +/-11,988
103,034 +/-765 42,364 +/-702
With earnings 77.9% +/-0.1 46.6% +/-0.1 80.4% +/-0.1 50.1% +/-0.2 78.8% +/-0.7 55.5% +/-1.3 Mean earnings (dollars)
76,303 +/-140 61,988 +/-126 87,087 +/-216 74,208 +/-404 136,032 +/-3,592
109,809 +/-6,355
With Social Security income
29.3% +/-0.1 76.3% +/-0.1 25.8% +/-0.1 71.2% +/-0.1 31.5% +/-0.6 69.2% +/-1.3
Mean Social 17,636 +/-17 18,633 +/-22 17,188 +/-35 18,228 +/-38 19,056 +/-366 19,654 +/-401

47
United States California Marin County, California Total 60 years and over Total 60 years and over Total 60 years and over Estimate Margin
of Error
Estimate Margin of Error
Estimate Margin of Error
Estimate Margin of Error
Estimate
Margin of Error
Estimate
Margin of Error
Security income (dollars) With Supplemental Security Income
5.3% +/-0.1 6.6% +/-0.1 6.2% +/-0.1 9.4% +/-0.1 3.2% +/-0.4 4.7% +/-0.7
Mean Supplemental Security Income (dollars)
9,400 +/-18 9,292 +/-25 9,910 +/-44 9,640 +/-59 10,692 +/-740 10,601 +/-995
With cash public assistance income
2.8% +/-0.1 2.0% +/-0.1 4.0% +/-0.1 2.2% +/-0.1 1.5% +/-0.3 1.0% +/-0.4
Mean cash public assistance income (dollars)
3,720 +/-19 3,558 +/-29 5,281 +/-47 5,380 +/-104 5,573 +/-1,301
6,075 +/-2,848
With retirement income
17.8% +/-0.1 43.8% +/-0.1 15.6% +/-0.1 40.2% +/-0.2 17.2% +/-0.7 36.8% +/-1.4
Mean retirement income (dollars)
24,095 +/-46 24,832 +/-50 28,884 +/-144 30,836 +/-155 36,588 +/-1,852
37,704 +/-1,986
With Food Stamp/SNAP benefits
13.0% +/-0.1 9.0% +/-0.1 8.7% +/-0.1 4.4% +/-0.1 3.5% +/-0.5 2.3% +/-0.5
POVERTY STATUS IN THE PAST 12 MONTHS
Population for whom poverty status is determined
306,226,394
+/-13,324
59,711,920 +/-18,943
37,323,127 +/-3,616
6,491,797 +/-7,179
249,612 +/-723 65,346 +/-766
Below 100 percent of the poverty level
15.6% +/-0.1 9.6% +/-0.1 16.4% +/-0.1 10.5% +/-0.1 8.8% +/-0.6 5.7% +/-0.6
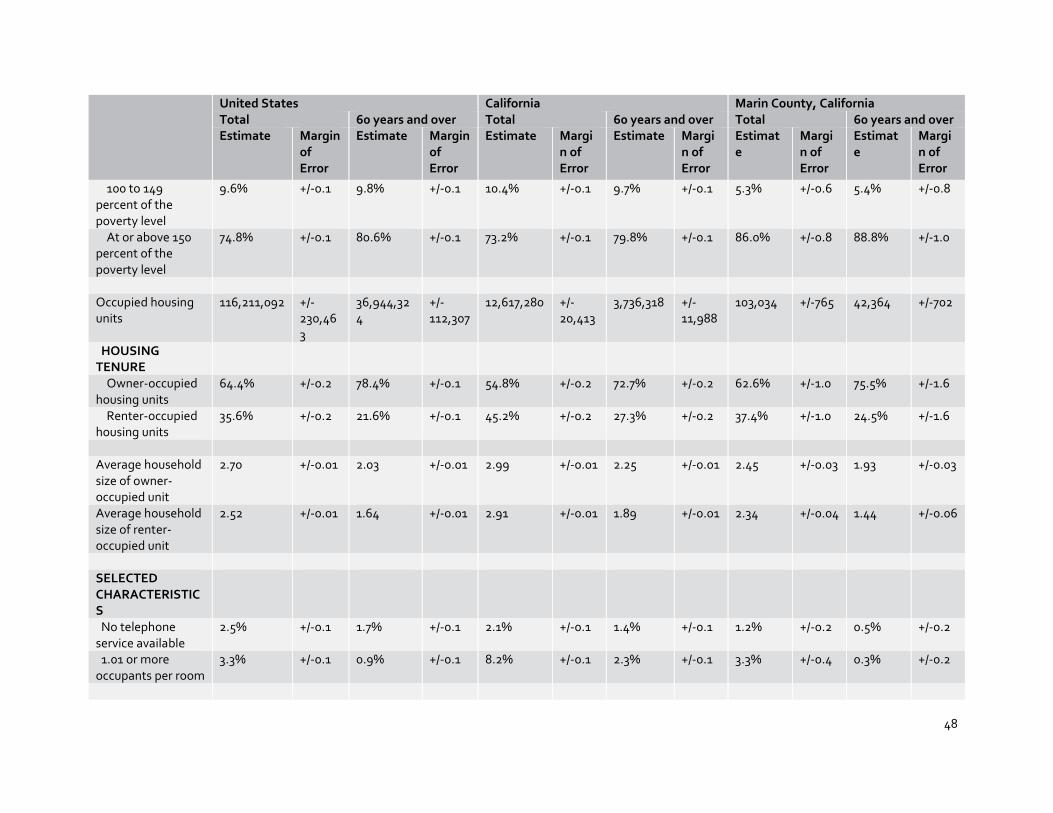
48
United States California Marin County, California Total 60 years and over Total 60 years and over Total 60 years and over Estimate Margin
of Error
Estimate Margin of Error
Estimate Margin of Error
Estimate Margin of Error
Estimate
Margin of Error
Estimate
Margin of Error
100 to 149 percent of the poverty level
9.6% +/-0.1 9.8% +/-0.1 10.4% +/-0.1 9.7% +/-0.1 5.3% +/-0.6 5.4% +/-0.8
At or above 150 percent of the poverty level
74.8% +/-0.1 80.6% +/-0.1 73.2% +/-0.1 79.8% +/-0.1 86.0% +/-0.8 88.8% +/-1.0
Occupied housing units
116,211,092 +/-230,463
36,944,324
+/-112,307
12,617,280 +/-20,413
3,736,318 +/-11,988
103,034 +/-765 42,364 +/-702
HOUSING TENURE
Owner-occupied housing units
64.4% +/-0.2 78.4% +/-0.1 54.8% +/-0.2 72.7% +/-0.2 62.6% +/-1.0 75.5% +/-1.6
Renter-occupied housing units
35.6% +/-0.2 21.6% +/-0.1 45.2% +/-0.2 27.3% +/-0.2 37.4% +/-1.0 24.5% +/-1.6
Average household size of owner-occupied unit
2.70 +/-0.01 2.03 +/-0.01 2.99 +/-0.01 2.25 +/-0.01 2.45 +/-0.03 1.93 +/-0.03
Average household size of renter-occupied unit
2.52 +/-0.01 1.64 +/-0.01 2.91 +/-0.01 1.89 +/-0.01 2.34 +/-0.04 1.44 +/-0.06
SELECTED CHARACTERISTICS
No telephone service available
2.5% +/-0.1 1.7% +/-0.1 2.1% +/-0.1 1.4% +/-0.1 1.2% +/-0.2 0.5% +/-0.2
1.01 or more occupants per room
3.3% +/-0.1 0.9% +/-0.1 8.2% +/-0.1 2.3% +/-0.1 3.3% +/-0.4 0.3% +/-0.2

49
United States California Marin County, California Total 60 years and over Total 60 years and over Total 60 years and over Estimate Margin
of Error
Estimate Margin of Error
Estimate Margin of Error
Estimate Margin of Error
Estimate
Margin of Error
Estimate
Margin of Error
Owner-occupied housing units
74,787,460 +/-343,068
28,978,656
+/-105,349
6,908,925 +/-34,460
2,714,900 +/-12,270
64,490 +/-1,122
31,977 +/-873
SELECTED MONTHLY OWNER COSTS AS A PERCENTAGE OF HOUSEHOLD INCOME IN THE PAST 12 MONTHS
Less than 30 percent
72.6% +/-0.1 72.6% +/-0.1 62.7% +/-0.2 66.4% +/-0.2 63.1% +/-1.3 65.3% +/-2.0
30 percent or more
27.4% +/-0.1 27.4% +/-0.1 37.3% +/-0.2 33.6% +/-0.2 36.9% +/-1.3 34.7% +/-2.0
OWNER CHARACTERISTICS
Median value (dollars)
175,700 +/-224 169,200 +/-201 371,400 +/-530 377,300 +/-928 785,100 +/-13,660
782,200 +/-15,586
Median selected monthly owner costs with a mortgage (dollars)
1,522 +/-2 1,365 +/-2 2,214 +/-4 1,895 +/-6 3,364 +/-59 2,791 +/-74
Median selected monthly owner costs without a mortgage (dollars)
457 +/-1 454 +/-1 493 +/-2 472 +/-2 726 +/-27 682 +/-24
Renter-occupied housing units
41,423,632 +/-117,733
7,965,668 +/-18,321
5,708,355 +/-17,527
1,021,418 +/-5,163
38,544 +/-1,112
10,387 +/-668
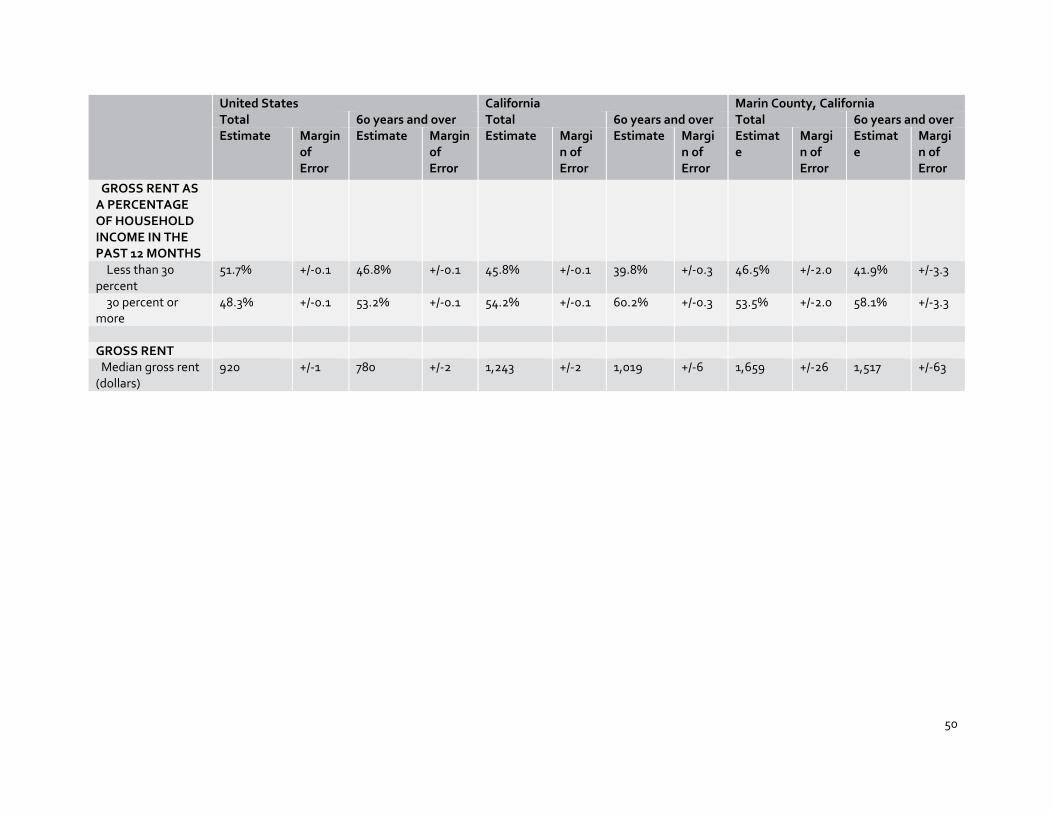
50
United States California Marin County, California Total 60 years and over Total 60 years and over Total 60 years and over Estimate Margin
of Error
Estimate Margin of Error
Estimate Margin of Error
Estimate Margin of Error
Estimate
Margin of Error
Estimate
Margin of Error
GROSS RENT AS A PERCENTAGE OF HOUSEHOLD INCOME IN THE PAST 12 MONTHS
Less than 30 percent
51.7% +/-0.1 46.8% +/-0.1 45.8% +/-0.1 39.8% +/-0.3 46.5% +/-2.0 41.9% +/-3.3
30 percent or more
48.3% +/-0.1 53.2% +/-0.1 54.2% +/-0.1 60.2% +/-0.3 53.5% +/-2.0 58.1% +/-3.3
GROSS RENT Median gross rent (dollars)
920 +/-1 780 +/-2 1,243 +/-2 1,019 +/-6 1,659 +/-26 1,517 +/-63
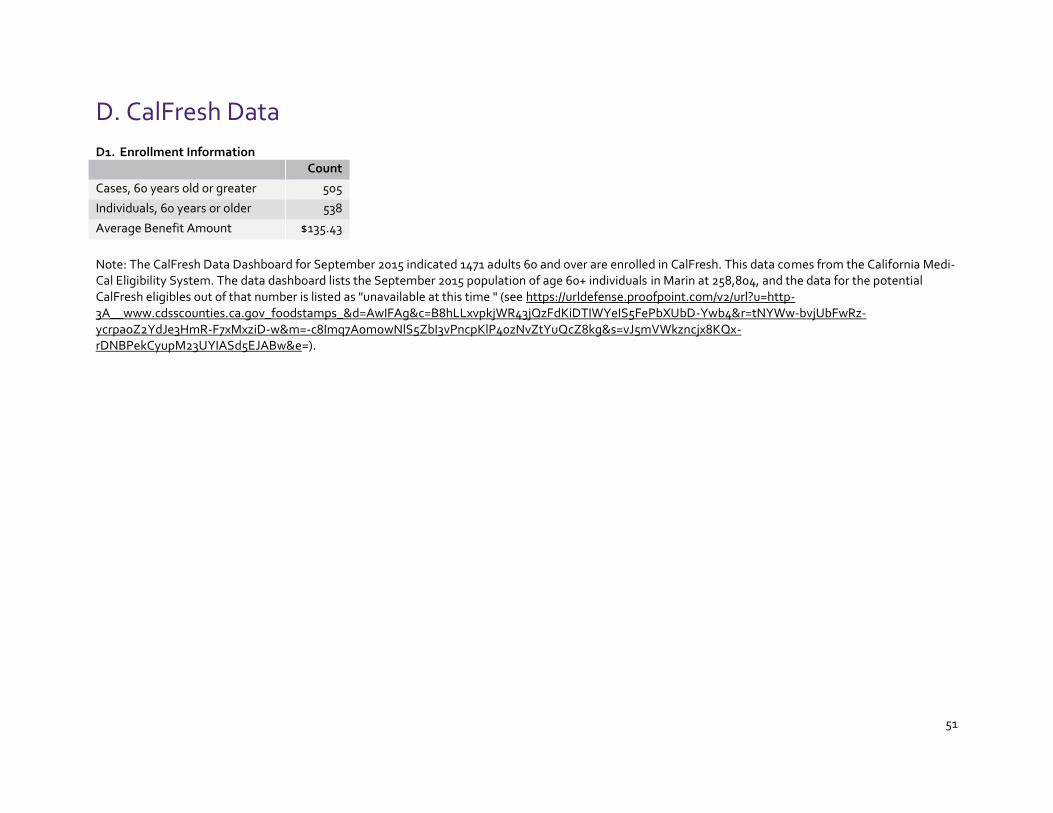
51
D. CalFresh Data
D1. Enrollment Information Count
Cases, 60 years old or greater 505
Individuals, 60 years or older 538
Average Benefit Amount $135.43
Note: The CalFresh Data Dashboard for September 2015 indicated 1471 adults 60 and over are enrolled in CalFresh. This data comes from the California Medi-Cal Eligibility System. The data dashboard lists the September 2015 population of age 60+ individuals in Marin at 258,804, and the data for the potential CalFresh eligibles out of that number is listed as "unavailable at this time " (see https://urldefense.proofpoint.com/v2/url?u=http-3A__www.cdsscounties.ca.gov_foodstamps_&d=AwIFAg&c=B8hLLxvpkjWR43jQzFdKiDTIWYeIS5FePbXUbD-Ywb4&r=tNYWw-bvjUbFwRz-ycrpaoZ2YdJe3HmR-F7xMxziD-w&m=-c8Imq7AomowNlS5ZbI3vPncpKlP40zNvZtYuQcZ8kg&s=vJ5mVWkzncjx8KQx-rDNBPekCyupM23UYIASd5EJABw&e=).

52
E. Community Health Interview Survey (CHIS) Data for Seniors (60+), 2011-2014
Demographic Comparison, Marin and California E1. Demographics and Selected Health Indicators by FPL for Seniors Ages 60+ in Marin County and California (2005-2014) Marin County 2005-2009 Marin County 2011-2014 California 2011-2014
Variable Question 100%-300% FPL
>300% FPL All FPL 100%-300% FPL
>300% FPL All FPL 100%-300% FPL
>300% FPL All FPL
Demographics
GENDER Male 34% 48% 48% 38% 46% 44% 41% 49% 45%
Female 66% 52% 52% 62% 54% 56% 59% 51% 55%
RACE White (non-Latino) 88% 91% 91% 90%* 93%* 92% 52% 76% 62% Latino 6% 2%* 2%* 7%* 3%* 4%* 26% 9% 19%
HOUSING Own 74% 90% 90% 76% 84% 81% 67% 89% 76% Rent 25% 9% 9% 23% 16% 18% 27% 9% 20%
MARITAL STATUS
Married 46% 67% 67% 43% 69% 63% 51% 71% 61%
Live with Partner __ 6% 6% __ 7%* 6% 3% 4% 3%
Separated/Divorced/Widowed/Other
46% 23% 23% 34% 20% 24% 41% 22% 32%
Single, never married 6% 4% 4% 22%* 5%* 9% 5% 3% 4%
HOUSEHOLD COMPOSITION
Single no kids 55% 34% 34% 57% 31% 37% 48% 29% 39%
Married no kids 44% 64% 64% 40% 68% 61% 47% 68% 57%
Married with kids __ 2% 2% 14%* __ 1%* 4% 2% 3% Single with kids __ __ __ __ 1%* 1%* 1% 0% 1%
Chronic Health Conditions
GENERAL HEALTH
In general, would you say your health is excellent, very good, good, fair or poor?
Excellent/Very Good:
50%†
Excellent/Very Good:
68%†
Excellent/Very Good:
62%
Excellent/Very Good:
39%†
Excellent/Very Good: 71%†
Excellent/Very Good: 64%
Excellent/Very Good:
33%†
Excellent/Very Good:
56%†
Excellent/Very Good: 44%
Good/Fair: 46%†
Good/Fair: 30%†
Good/Fair: 35%
Good/Fair: 56%†
Good/Fair: 26%†
Good/Fair: 32%
Good/Fair: 56%†
Good/Fair: 40%†
Good/Fair: 48%

53
Marin County 2005-2009 Marin County 2011-2014 California 2011-2014
Variable Question 100%-300% FPL
>300% FPL All FPL 100%-300% FPL
>300% FPL All FPL 100%-300% FPL
>300% FPL All FPL
Poor: 7%†
Poor: 2%†
Poor: 3%
Poor: 6%* Poor: 4%*
Poor: 4%*
Poor: 11%†
Poor: 4%†
Poor: 8%
DIABETES {Other than during pregnancy, had/Has} a doctor ever told you that you have diabetes or sugar diabetes?
8% 6% 6% 11%* 5% 6% 23%† 14%† 18%
{Other than during pregnancy, has/Has} a doctor ever told you that you have pre-diabetes or borderline diabetes?
17% (for 2009
only)
18% (for 2009
only)
17% (for 2009
only)
17%* 11% 12% 19% 18% 18%
HEART DISEASE
Has a doctor ever told you that you have any kind of heart disease?
21% 16% 18% 16%* 15% 15% 18% 16% 17%
HIGH BLOOD PRESSURE
Has a doctor ever told you that you have high blood pressure?
50% 47% 47% 48% 41% 42% 63% 52%† 57%
ASTHMA Has a doctor ever told you that you have asthma?
11% 11% 11% 13% 15% 15% 13% 12% 13%
Access to Health Care in the Past Year
MEDICAL TREATMENT
In the past 12 months, did you or a doctor think you needed to see a medical specialist?
N/A N/A N/A 50% (for 2013-2014 only)
66% (for 2013-2014 only)
63% (for 2013-2014 only)
48%† (for 2013-2014 only)
58%† (for 2013-2014 only)
53% (for 2013-2014 only)
During the past 12 months, did you delay or not get other medical care you felt you needed-- such as seeing a doctor, a specialist, or other
27%† (for 2007 & 2009 only)
8%† (for 2007 & 2009 only)
11% (for 2007 & 2009 only)
22%*
6% 9% 9% 8% 9%

54
Marin County 2005-2009 Marin County 2011-2014 California 2011-2014
Variable Question 100%-300% FPL
>300% FPL All FPL 100%-300% FPL
>300% FPL All FPL 100%-300% FPL
>300% FPL All FPL
health professional?
During the past 12 months, did you either delay or not get a medicine that a doctor prescribed for you?
9%* (for 2007 & 2009 only)
4% (for 2007 & 2009 only)
7% (for 2007 & 2009 only)
11%* 11% 11%
10%† 8%† 9%
EMERGENCY ROOM
During the past 12 months, did you visit a hospital emergency room for your health? (Respondents who visited the emergency room past year for asthma or other condition are also included.)
22% 22% 23% 27% 15% 18% 20%† 17%† 19%
Elderly Health
FALLS*** During the past 12 months, have you NOT fallen to the ground more than once?
93%* (for 2007
only)
84% (for 2007
only)
84% (for 2007
only)
84%* (for 2011-2012 only)
84% (for 2011-2012 only)
83% (for 2011-2012 only)
85%† (for 2011-2012 only)
89%† (for 2011-2012 only)
88% (for 2011-2012 only)
Did you get any medical care because of those falls?
__ (for 2007
only)
29%* (for 2007
only)
30%* (for 2007
only)
44%* (for 2011-2012 only)
46% (for 2011-2012 only)
46% (for 2011-2012 only)
41% (for 2011-2012 only)
42% (for 2011-2012 only)
42% (for 2011-2012 only)
Mental/Emotional Health EMOTIONAL WELL-BEING
Was there ever a time during the past 12 months when you felt that you might need to see a professional because of problems with your mental
15% (for 2007 & 2009 only)
9% (for 2007 & 2009 only)
10% (for 2007 & 2009 only)
18% 12% 13% 9% 9% 9%

55
Marin County 2005-2009 Marin County 2011-2014 California 2011-2014
Variable Question 100%-300% FPL
>300% FPL All FPL 100%-300% FPL
>300% FPL All FPL 100%-300% FPL
>300% FPL All FPL
health emotions or nerves or your use of alcohol or drugs?
ACCESS/ UTILIZATION
"Was there ever a time during the past 12 months when you felt that you might need to see a professional because of problems with your mental health emotions or nerves or your use of alcohol or drugs?" and "In the past 12 months have you seen your primary care physician or any other professional, such as a counselor, psychiatrist, or social worker for problems with your mental health, emotions, nerves or your use of alcohol or drugs?"
Sought help and Received
Treatment: 53%
(for 2007 & 2009 only)
Sought help and Received
Treatment: 64%
(for 2007 & 2009 only)
Sought help and Received
Treatment: 63%
(for 2007 & 2009 only)
Sought help and Received
Treatment: 82%*
Sought help and Received
Treatment: 61%
Sought help and Received Treatment:
69%
Sought help and Received Treatment:
62%
Sought help and Received Treatment:
62%
Sought help and Received Treatment:
62%
"In the past 12 months have you seen your primary care physician for problems with your mental health, emotions, nerves or your use of alcohol or drugs?" and "In the past 12 months have you seen any other professional, such as a counselor,
10% (for 2007 & 2009 only)
8% (for 2007 & 2009 only)
8% (for 2007 & 2009 only)
17% 7% 9% 9% 8% 8%

56
Marin County 2005-2009 Marin County 2011-2014 California 2011-2014
Variable Question 100%-300% FPL
>300% FPL All FPL 100%-300% FPL
>300% FPL All FPL 100%-300% FPL
>300% FPL All FPL
psychiatrist, or social worker for problems with your mental health, emotions, nerves or your use of alcohol or drugs?"
During the past 12 months, did you take any prescription medications, such as an antidepressant or sedative, almost daily for two weeks or more, for an emotional or personal problem?
15% (for 2007 & 2009 only)
12% (for 2007 & 2009 only)
12% (for 2007 & 2009 only)
27% 13% 15% 14% 12% 13%
SUICIDE Have you ever seriously thought about committing suicide?
9% (for 2009
only)
6% (for 2009
only)
7% (for 2009
only)
9%* 7% 8% 7% 7% 7%
Behavioral Factors
DIET Eats five or more servings of vegetables and fruits daily? This variable is constructed with several questionnaire items and applies variance adjustments to measure dietary intake among adults in California. §
46.5% (for 2005
only)
57.7% (for 2005
only)
55.8% (for 2005
only)
N/A N/A N/A 45%† (for 2005
only)
52%† (for 2005
only)
48% (for 2005
only)
How often fresh fruits/vegetables affordable in neighborhood? This variable is not
N/A
N/A N/A Always: 54%
Always: 76%
Always: 72%
Always: 50%†
Always: 70%†
Always: 60%

57
Marin County 2005-2009 Marin County 2011-2014 California 2011-2014
Variable Question 100%-300% FPL
>300% FPL All FPL 100%-300% FPL
>300% FPL All FPL 100%-300% FPL
>300% FPL All FPL
asked of everyone: Asked of adults who eat and have access to fresh fruits/vegetables in neighborhood
N/A N/A N/A Usually/Sometimes:
44%
Usually/Sometimes:
23%
Usually/Sometimes:
27%
Usually/Sometimes: 48%†
Usually/Sometimes:
30%†
Usually/Sometimes:
40%
N/A N/A N/A Never: 4%*
Never: 2%*
Never: 2%*
Never: 2%†
Never: 0.6%†
Never: 1%
In the past 7 days, how many times did you eat fast food? Include fast food meals eaten at work {school}, at home, or at fast food restaurants, carryout or drive through.
0 times: 77%
(only for 2007&2009)
0 times: 77%
(only for 2007&2009)
0 times: 77%
(only for 2007&2009)
0 times: 78%
0 times: 76%
0 times: 76%
0 times: 50%
0 times: 53%
0 times: 52%
1-2 times: 20%
(only for 2007&2009)
1-2 times: 20%
(only for 2007&2009)
1-2 times: 20%
(only for 2007&2009)
1-2 times: 19%
1-2 times: 22%
1-2 times: 21%
1-2 times: 37%
1-2 times: 37%
1-2 times: 37%
3+ times: __
3+ times: 3%
(only for 2007&2009)
3+ times: 3%
(only for 2007&2009)
3+ times: 4%*
3+ times: 2%*
3+ times: 2%*
3+ times: 12%
3+ times: 11%
3+ times: 11%
PHYSICAL ACTIVITY
This variable was constructed by combining the questionnaire items related to walking. Time frame is in the past 7 days.
70% 80% 78% N/A N/A N/A 68% 73% 71%
BMI 0 - 18.49 (Underweight)
__ __ 1% 7%* 1%* 2%* 2% 1% 1%
18.5 - 24.99 (Normal) 49% 51% 50% 39% 47% 45% 34% 36% 35%
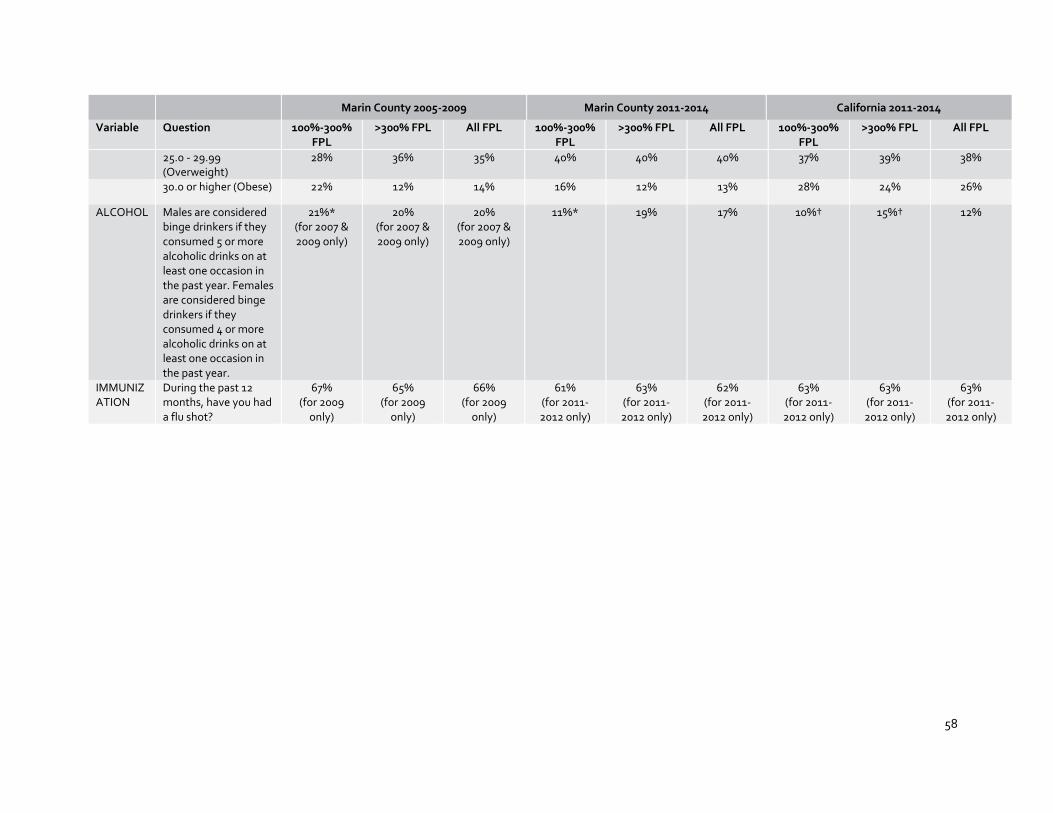
58
Marin County 2005-2009 Marin County 2011-2014 California 2011-2014
Variable Question 100%-300% FPL
>300% FPL All FPL 100%-300% FPL
>300% FPL All FPL 100%-300% FPL
>300% FPL All FPL
25.0 - 29.99 (Overweight)
28% 36% 35% 40% 40% 40% 37% 39% 38%
30.0 or higher (Obese) 22% 12% 14% 16% 12% 13% 28% 24% 26%
ALCOHOL Males are considered binge drinkers if they consumed 5 or more alcoholic drinks on at least one occasion in the past year. Females are considered binge drinkers if they consumed 4 or more alcoholic drinks on at least one occasion in the past year.
21%* (for 2007 & 2009 only)
20% (for 2007 & 2009 only)
20% (for 2007 & 2009 only)
11%* 19% 17% 10%† 15%† 12%
IMMUNIZATION
During the past 12 months, have you had a flu shot?
67% (for 2009
only)
65% (for 2009
only)
66% (for 2009
only)
61% (for 2011-2012 only)
63% (for 2011-2012 only)
62% (for 2011-2012 only)
63% (for 2011-2012 only)
63% (for 2011-2012 only)
63% (for 2011-2012 only)

59
E2. Demographics and Selected Health Indicators by FPL for Seniors Ages 60+ in Marin County and California with Confidence Intervals (2005-2014) Marin County 2005-2009 Marin County 2011-2014 California 2011-2014
Variable Question 100%-300% FPL
C.I. >300% FPL
C.I. All FPL C.I. 100%-300% FPL
C.I. >300% FPL
C.I. All FPL C.I. 100%-300% FPL
C.I. >300% FPL
C.I. All FPL C.I.
Demographics
GENDER Male 34% 25.3-43.2
48% 44.4-52.2
48% 42.8-50.2
38% 21.3-55.6
46% 37.7-53.7
44% 36.4-50.9
41% 39.4-42.5
49% 48.4-50.5
45% 44.5-45.4
Female 66%† 56.8-74.7
52%† 47.8-55.6
52% 49.8-57.2
62% 44.4-78.7
54% 46.3-62.3
56% 49.1-63.6
59% 57.5-60.6
51% 49.5-51.6
55% 54.6-55.5
RACE White (non-Latino)
88% 83.2-92.3
91% 87.6-93.9
91% 86.9-90.2
90%* 82.4-97.2
93%* 89.0-97.5
92% 88.3-95.5
52% 50.6-54.0
76% 74.4-76.9
62% 61.3-63.2
Latino 6% 2.9-9.3 2%* 0.0-5.1 2%* 2.9-5.4 7%* 0.8-14.0
3%* 0.0-5.5 4%* 1.1-6.7 26% 24.5-28.0
9% 8.3-10.1
19% 17.7-19.4
HOUSING Own 74%† 66.3-80.6
90%† 88.0-91.6
90% 83.9-88.0
76% 65.1-86.3
84% 78.3-90.3
81% 76.2-86.4
67% 66.0-68.8
89% 88.6-90.0
76% 75.7-76.7
Rent 25%† 17.9-32.1
9%† 7.1-10.2
9% 10.4-14.0
23% 12.9-33.9
16% 9.4-21.5
18% 12.8-23.0
27% 25.7-28.5
9% 8.5-9.9 20% 18.9-20.2
MARITAL STATUS
Married 46%† 37.4-54.6
67%† 63.9-71.0
67% 59.8-66.0
43%† 27.3-58.8
69%† 61.9-76.8
63% 55.9-69.4
51% 49.4-52.9
71% 70.0-72.3
61% 59.7-61.6
Live with Partner
__ __ 6% 3.2-8.1 6% 2.9-6.7 __ __ 7%* 2.6-10.3
6% 2.3-8.6 3% 2.5-3.7 4% 3.0-3.9 3% 3.0-3.7
Separated/Divorced/Widowed/Other
46%† 38.0-54.0
23%† 20.3-26.1
23% 25.2-30.7
34% 21.2-46.7
20% 14.5-26.3
24% 19.2-29.4
41% 38.8-42.4
22% 21.1-23.0
32% 30.7-32.4
Single, never married
6% 3.7-8.5 4% 2.9-4.6 4% 3.5-5.1 22%* 6.1-38.5
5%* 0.5-10.2
9% 3.8-14.0
5% 4.3-5.9 3% 2.9-3.8 4% 4.0-4.9
HOUSEHOLD COMPOSITION
Single no kids 55%† 46.0-63.3
34%† 30.0-37.3
34% 35.3-41.7
57% 41.2-72.7
31% 23.4-37.9
37% 30.6-43.8
48% 46.3-49.8
29% 28.1-30.5
39% 38.4-40.2
Married no kids 44% 35.4-52.9
64% 60.3-67.6
64% 56.1-62.6
40% 27.2-51.9
68% 60.1-74.8
61% 54.1-67.2
47% 45.2-48.7
68% 67.2-69.6
57% 56.2-58.0
Married with kids
__ __ 2% 1.3-3.0 2% 1.3-2.6 14%* 6.9-20.9
__ __ 1%* 0.0-2.9 4% 2.9-4.6 2% 1.7-2.4 3% 2.4-3.2
Single with kids __ __ __ __ __ __ __ __ 1%* 0.0-2.3 1%* 0.0-1.9 1% 0.8-1.6 0% 0.2-0.3 1% 0.6-1.0
Chronic Health Conditions
GENERAL HEALTH
In general, would you say your health is excellent, very good, good, fair or poor?
Excellent/Ver
y Good: 50%†
41.3-57.6
Excellent/Ver
y Good: 68%†
64.3-71.0
Excellent/Ver
y Good: 62%
58.9-65.5
Excellent/Ver
y Good: 39%†
26.6 - 50.3
Excellent/Ver
y Good: 71%†
64.9 - 77.0
Excellent/Very Good: 64%
57.8 - 70.2
Excellent/Ver
y Good: 33%†
31.5 - 34.9
Excellent/Ver
y Good: 56%†
54.7 - 57.4
Excellent/Very Good: 44%
42.9 - 45.0
Good/Fair:
37.3-54.2
Good/Fair:
27.0-33.7
Good/Fair:
31.7-38.5
Good/Fair:
43.5 - 68.3
Good/Fair:
19.9 - 31.2
Good/Fair:
25.9 - 37.7
Good/Fair:
54.2 - 57.7
Good/Fair:
39.1 - 41.6
Good/Fair:
47.2 - 49.3
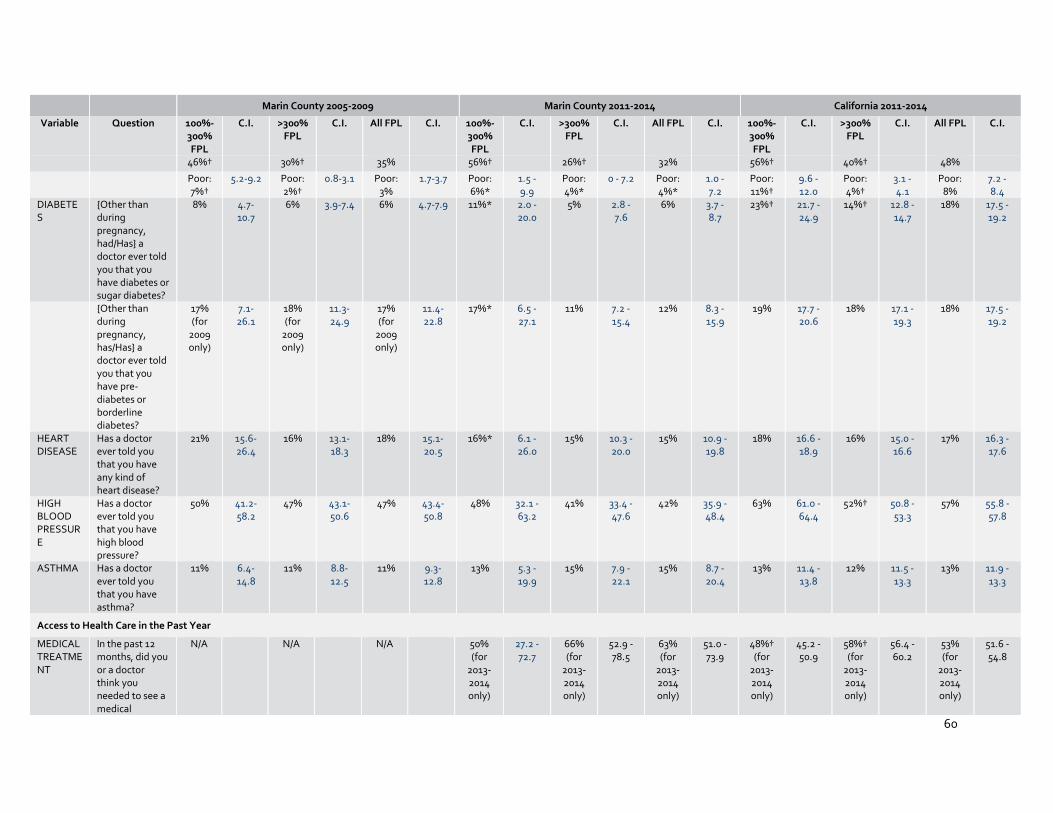
60
Marin County 2005-2009 Marin County 2011-2014 California 2011-2014
Variable Question 100%-300% FPL
C.I. >300% FPL
C.I. All FPL C.I. 100%-300% FPL
C.I. >300% FPL
C.I. All FPL C.I. 100%-300% FPL
C.I. >300% FPL
C.I. All FPL C.I.
46%† 30%† 35% 56%† 26%† 32% 56%† 40%† 48%
Poor: 7%†
5.2-9.2 Poor: 2%†
0.8-3.1 Poor: 3%
1.7-3.7 Poor: 6%*
1.5 - 9.9
Poor: 4%*
0 - 7.2 Poor: 4%*
1.0 - 7.2
Poor: 11%†
9.6 - 12.0
Poor: 4%†
3.1 - 4.1
Poor: 8%
7.2 - 8.4
DIABETES
{Other than during pregnancy, had/Has} a doctor ever told you that you have diabetes or sugar diabetes?
8% 4.7-10.7
6% 3.9-7.4 6% 4.7-7.9 11%* 2.0 - 20.0
5% 2.8 - 7.6
6% 3.7 - 8.7
23%† 21.7 - 24.9
14%† 12.8 - 14.7
18% 17.5 - 19.2
{Other than during pregnancy, has/Has} a doctor ever told you that you have pre-diabetes or borderline diabetes?
17% (for
2009 only)
7.1-26.1
18% (for
2009 only)
11.3-24.9
17% (for
2009 only)
11.4-22.8
17%* 6.5 - 27.1
11% 7.2 - 15.4
12% 8.3 - 15.9
19% 17.7 - 20.6
18% 17.1 - 19.3
18% 17.5 - 19.2
HEART DISEASE
Has a doctor ever told you that you have any kind of heart disease?
21% 15.6-26.4
16% 13.1-18.3
18% 15.1-20.5
16%* 6.1 - 26.0
15% 10.3 - 20.0
15% 10.9 - 19.8
18% 16.6 - 18.9
16% 15.0 - 16.6
17% 16.3 - 17.6
HIGH BLOOD PRESSURE
Has a doctor ever told you that you have high blood pressure?
50% 41.2-58.2
47% 43.1-50.6
47% 43.4-50.8
48% 32.1 - 63.2
41% 33.4 - 47.6
42% 35.9 - 48.4
63% 61.0 - 64.4
52%† 50.8 - 53.3
57% 55.8 - 57.8
ASTHMA Has a doctor ever told you that you have asthma?
11% 6.4-14.8
11% 8.8-12.5
11% 9.3-12.8
13% 5.3 - 19.9
15% 7.9 - 22.1
15% 8.7 - 20.4
13% 11.4 - 13.8
12% 11.5 - 13.3
13% 11.9 - 13.3
Access to Health Care in the Past Year
MEDICAL TREATMENT
In the past 12 months, did you or a doctor think you needed to see a medical
N/A N/A N/A 50% (for
2013-2014 only)
27.2 - 72.7
66% (for
2013-2014 only)
52.9 - 78.5
63% (for
2013-2014 only)
51.0 - 73.9
48%† (for
2013-2014 only)
45.2 - 50.9
58%† (for
2013-2014 only)
56.4 - 60.2
53% (for
2013-2014 only)
51.6 - 54.8

61
Marin County 2005-2009 Marin County 2011-2014 California 2011-2014
Variable Question 100%-300% FPL
C.I. >300% FPL
C.I. All FPL C.I. 100%-300% FPL
C.I. >300% FPL
C.I. All FPL C.I. 100%-300% FPL
C.I. >300% FPL
C.I. All FPL C.I.
specialist?
During the past 12 months, did you delay or not get other medical care you felt you needed-- such as seeing a doctor, a specialist, or other health professional?
27%† (for
2007 & 2009 only)
16.6-38.2
8%† (for
2007 & 2009 only)
5.7-11.0
11% (for
2007 & 2009 only)
8.3-14.6
22%*
6.6 - 37.9
6% 3.4 - 8.1
9% 5.4 - 12.8
9% 8.0 - 9.9
8% 7.1 - 8.6
9% 8.1 - 9.2
During the past 12 months, did you either delay or not get a medicine that a doctor prescribed for you?
9%* (for
2007 & 2009 only)
0-18.6 4% (for
2007 & 2009 only)
2.3-5.9 7% (for
2007 & 2009 only)
3.3-9.8 11%* 3.7 - 18.7
11% 5.0 - 16.3
11%
6.0 - 15.3
10%† 9.0 - 11.0
8%† 7.0 - 8.3
9% 8.3 - 9.4
EMERGENCY ROOM
During the past 12 months, did you visit a hospital emergency room for your health? (Respondents who visited the emergency room past year for asthma or other condition are also included.)
22% 17.1-26.1
22% 18.6-25.4
23% 19.2-26.0
27% 15.4 - 37.5
15% 11.0 - 19.9
18% 13.7 - 21.9
20%† 18.6 - 21.5
17%† 16.1 - 18.1
19% 17.8 - 19.4
Elderly Health
FALLS***
During the past 12 months, have you NOT fallen
93%* (for
2007 only)
86.0 - 100
84% (for
2007 only)
75.2-93.3
84% (for
2007 only)
79.3-93.3
84%* (for
2011-2012
69.7-97.3
84% (for
2011-2012
75.6 - 91.8
83% (for
2011-2012
75.5 - 90.0
85%† (for
2011-2012
83.5 - 86.9
89%† (for
2011-2012
88.4 - 90.4
88% (for
2011-2012
86.7 - 88.5

62
Marin County 2005-2009 Marin County 2011-2014 California 2011-2014
Variable Question 100%-300% FPL
C.I. >300% FPL
C.I. All FPL C.I. 100%-300% FPL
C.I. >300% FPL
C.I. All FPL C.I. 100%-300% FPL
C.I. >300% FPL
C.I. All FPL C.I.
to the ground more than once?
only) only) only) only) only) only)
Did you get any medical care because of those falls?
__ (for
2007 only)
__ 29%* (for
2007 only)
3.1-54.2
30%* (for
2007 only)
6.3-53.9
44%* (for
2011-2012 only)
20.5 - 66.6
46% (for
2011-2012 only)
24.7 - 67.3
46% (for
2011-2012 only)
27.8 - 64.5
41% (for
2011-2012 only)
34.4 - 46.8
42% (for
2011-2012 only)
36.7 - 47.2
42% (for
2011-2012 only)
37.9 - 45.4
Mental/Emotional Health
EMOTIONAL WELL-BEING
Was there ever a time during the past 12 months when you felt that you might need to see a professional because of problems with your mental health emotions or nerves or your use of alcohol or drugs?
15% (for
2007 & 2009 only)
7.7-22.6
9% (for
2007 & 2009 only)
6.8-11.7
10% (for
2007 & 2009 only)
7.8-12.7
18% 11.2 - 24.3
12% 7.6 - 15.8
13% 8.9 - 16.1
9% 8.2 - 10.4
9% 8.1 - 9.4
9% 8.6 - 9.7
ACCESS/ UTILIZATION
"Was there ever a time during the past 12 months when you felt that you might need to see a professional because of problems with your mental health emotions or nerves or your use of alcohol or drugs?" and
Sought help
and Receiv
ed Treatment: 53% (for
2007 & 2009 only)
26.5-80.2
Sought help and
Received
Treatment: 64% (for
2007 & 2009 only)
51.8-76.0
Sought help and
Received
Treatment: 63% (for
2007 & 2009 only)
52.1-74.4
Sought help and
Received
Treatment:
82%*
64.1 - 99.4
Sought help and
Received
Treatment: 61%
48.2 - 74.4
Sought help and
Received
Treatment: 69%
56.3 - 81.2
Sought help and
Received
Treatment: 62%
55.6 - 68.3
Sought help and
Received
Treatment: 62%
57.3 - 66.1
Sought help and
Received
Treatment: 62%
58.3 - 65.3

63
Marin County 2005-2009 Marin County 2011-2014 California 2011-2014
Variable Question 100%-300% FPL
C.I. >300% FPL
C.I. All FPL C.I. 100%-300% FPL
C.I. >300% FPL
C.I. All FPL C.I. 100%-300% FPL
C.I. >300% FPL
C.I. All FPL C.I.
"In the past 12 months have you seen your primary care physician or any other professional, such as a counselor, psychiatrist, or social worker for problems with your mental health, emotions, nerves or your use of alcohol or drugs?"
"In the past 12 months have you seen your primary care physician for problems with your mental health, emotions, nerves or your use of alcohol or drugs?" and "In the past 12 months have you seen any other professional, such as a counselor, psychiatrist, or social worker for problems with your mental health, emotions,
10% (for
2007 & 2009 only)
5.0-14.5
8% (for
2007 & 2009 only)
5.4-9.6 8% (for
2007 & 2009 only)
6.4-10.3
17% 9.4 - 23.8
7% 4.4 - 10.2
9% 6.0 - 11.9
9% 7.9 - 10.0
8% 7.2 - 8.4
8% 7.9 - 9.0
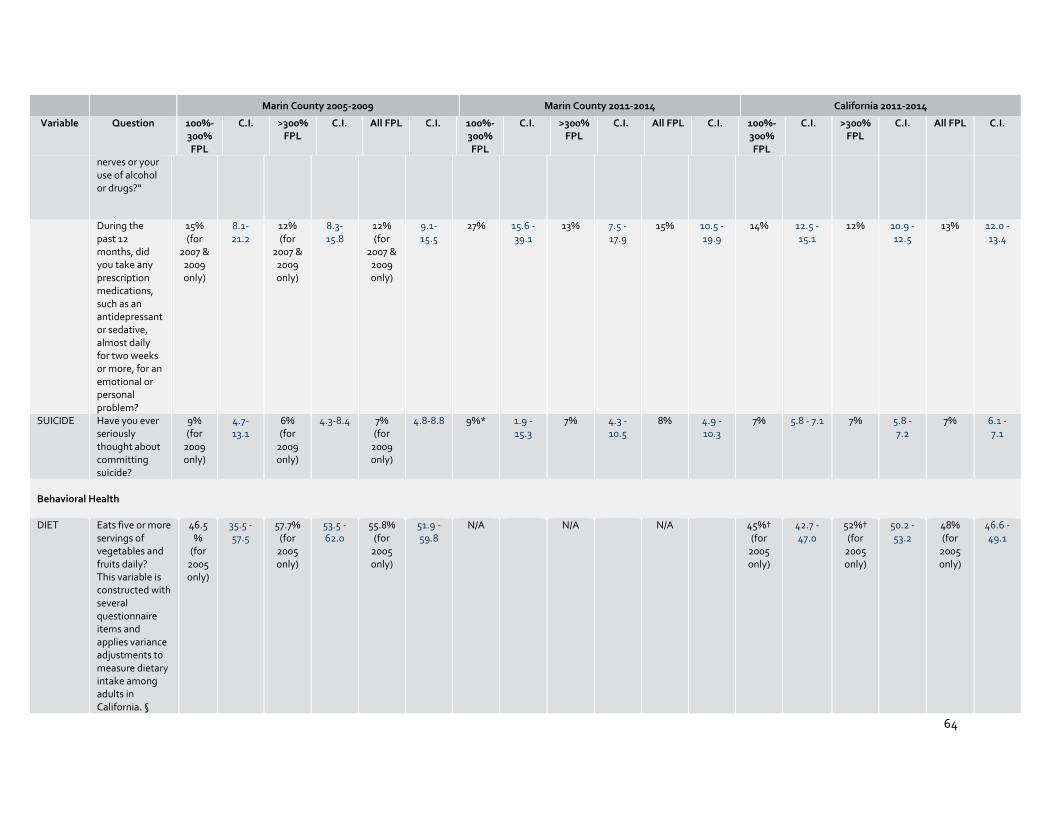
64
Marin County 2005-2009 Marin County 2011-2014 California 2011-2014
Variable Question 100%-300% FPL
C.I. >300% FPL
C.I. All FPL C.I. 100%-300% FPL
C.I. >300% FPL
C.I. All FPL C.I. 100%-300% FPL
C.I. >300% FPL
C.I. All FPL C.I.
nerves or your use of alcohol or drugs?"
During the past 12 months, did you take any prescription medications, such as an antidepressant or sedative, almost daily for two weeks or more, for an emotional or personal problem?
15% (for
2007 & 2009 only)
8.1-21.2
12% (for
2007 & 2009 only)
8.3-15.8
12% (for
2007 & 2009 only)
9.1-15.5
27% 15.6 - 39.1
13% 7.5 - 17.9
15% 10.5 - 19.9
14% 12.5 - 15.1
12% 10.9 - 12.5
13% 12.0 - 13.4
SUICIDE Have you ever seriously thought about committing suicide?
9% (for
2009 only)
4.7-13.1
6% (for
2009 only)
4.3-8.4 7% (for
2009 only)
4.8-8.8 9%* 1.9 - 15.3
7% 4.3 - 10.5
8% 4.9 - 10.3
7% 5.8 - 7.1 7% 5.8 - 7.2
7% 6.1 - 7.1
Behavioral Health
DIET Eats five or more servings of vegetables and fruits daily? This variable is constructed with several questionnaire items and applies variance adjustments to measure dietary intake among adults in California. §
46.5%
(for 2005 only)
35.5 - 57.5
57.7% (for
2005 only)
53.5 - 62.0
55.8% (for
2005 only)
51.9 - 59.8
N/A N/A N/A 45%† (for
2005 only)
42.7 - 47.0
52%† (for
2005 only)
50.2 - 53.2
48% (for
2005 only)
46.6 - 49.1

65
Marin County 2005-2009 Marin County 2011-2014 California 2011-2014
Variable Question 100%-300% FPL
C.I. >300% FPL
C.I. All FPL C.I. 100%-300% FPL
C.I. >300% FPL
C.I. All FPL C.I. 100%-300% FPL
C.I. >300% FPL
C.I. All FPL C.I.
How often fresh fruits/vegetables affordable in neighborhood? This variable is not asked of everyone: Asked of adults who eat and have access to fresh fruits/vegetables in neighborhood
N/A N/A N/A Always:
54%
38.0 - 70.6
Always:
76%
70.1 - 82.6
Always:
72%
65.7 - 77.2
Always:
50%†
48.0 - 52.0
Always:
70%†
68.2 - 70.6
Always:
60%
58.7 - 60.7
N/A N/A N/A Usually/Somet
imes: 44%
28.2 - 59.3
Usually/Somet
imes: 23%
16.5 - 28.9
Usually/Somet
imes: 27%
21.7 - 33.1
Usually/Somet
imes: 48%†
46.4 - 50.4
Usually/Somet
imes: 30%†
28.8 - 31.2
Usually/Somet
imes: 40%
38.2 - 40.1
N/A N/A N/A Never: 4%*
1.3 - 6.6
Never: 2%*
0.5 - 3.2
Never: 2%*
0.3 - 2.7
Never: 2%†
1.2 - 2.0
Never: 0.6%†
0.4 - 0.9
Never: 1%
0.9 - 1.4
In the past 7 days, how many times did you eat fast food? Include fast food meals eaten at work {school}, at home, or at fast food restaurants, carryout or drive through.
0 times:
77% (only
for 2007&2009)
69.9 - 84.8
0 times:
77% (only
for 2007&2009)
71.7 - 82.4
0 times:
77% (only
for 2007&2009)
72.9 - 81.8
0 times:
78%
68.6 - 87.0
0 times:
76%
69.0 - 82.5
0 times:
76%
70.7 - 81.9
0 times: 50%
48.6 - 52.1
0 times:
53%
51.3 - 53.8
0 times: 52%
51.3 - 53.2
1-2 times: 20% (only
for 2007&2009)
13.1 - 27.7
1-2 times: 20% (only
for 2007&2009)
14.8 - 25.1
1-2 times: 20% (only
for 2007&2009)
15.6 - 24.2
1-2 times:
19%
10.6 - 27.2
1-2 times: 22%
15.5 - 29.0
1-2 times:
21%
15.9 - 26.9
1-2 times:
37%
35.5 - 39.4
1-2 times:
37%
35.4 - 37.9
1-2 times:
37%
35.6 - 37.6
3+ times:
__
__ 3+ times:
3% (only
for 2007&
1.3 - 4.7
3+ times:
3% (only
for 2007&
1.3 - 4.1
3+ times: 4%*
0.4 - 8.4
3+ times: 2%*
0.0 - 3.9
3+ times: 2%*
0.5 - 4.2
3+ times:
12%
10.9 - 13.5
3+ times:
11%
10.0 - 11.6
3+ times:
11%
10.5 - 11.8

66
Marin County 2005-2009 Marin County 2011-2014 California 2011-2014
Variable Question 100%-300% FPL
C.I. >300% FPL
C.I. All FPL C.I. 100%-300% FPL
C.I. >300% FPL
C.I. All FPL C.I. 100%-300% FPL
C.I. >300% FPL
C.I. All FPL C.I.
2009) 2009)
PHYSICAL ACTIVITY
This variable was constructed by combining the questionnaire items related to walking. Time frame is in the past 7 days.
70%† 63.7 - 76.8
80%† 77.3 - 82.9
78% 75.5 - 80.6
N/A N/A N/A 68% 66.0 - 69.2
73% 71.8 - 73.7
71% 70.1 - 71.6
BMI 0 - 18.49 (Underweight)
__ __ __ __ 1% 0.6 - 1.3
7%* 0.1 - 13.1
1%* 0.4 - 2.2
2%* 0.8 - 3.5
2% 1.5 - 2.2 1% 0.7 - 1.0
1% 1.2 - 1.5
18.5 - 24.99 (Normal)
49% 40.6 - 56.6
51% 47.1 - 55.7
50% 46.9 - 53.8
39% 23.5 - 53.5
47% 39.7 - 53.7
45% 38.4 - 51.8
34% 31.8 - 35.3
36% 34.9 - 37.4
35% 34.1 - 36.0
25.0 - 29.99 (Overweight)
28% 22.7 - 33.5
36% 31.8 - 39.4
35% 31.6 - 38.1
40% 23.9 - 56.8
40% 32.2 - 47.0
40% 32.9 - 46.1
37% 35.4 - 38.8
39% 38.3 - 40.6
38% 37.1 - 39.0
30.0 or higher (Obese)
22% 14.6 - 29.2
12% 9.4 - 14.8
14% 11.1 - 16.5
16% 7.2 - 25.1
12% 5.5 - 19.4
13% 7.7 - 18.8
28% 25.8 - 29.2
24% 22.4 - 24.6
26% 24.6 - 26.5
ALCOHOL
Males are considered binge drinkers if they consumed 5 or more alcoholic drinks on at least one occasion in the past year. Females are considered binge drinkers if they consumed 4 or more alcoholic drinks on at least one occasion in the past year.
21%*
(for 2007
& 2009 only)
8.2-33.1
20% (for
2007 & 2009 only)
15.6-25.1
20% (for
2007 & 2009 only)
15.7-24.0
11%* 2.0 - 19.6
19% 10.4 - 26.8
17% 10.0 - 23.6
10%† 8.6 - 10.7
15%† 13.7 - 15.5
12% 11.6 - 12.8
IMMUNIZATION
During the past 12 months, have you had a flu shot?
67% (for
2009 only)
58.3-76.0
65% (for
2009 only)
58.3-70.6
66% (for
2009 only)
60.9-70.7
61% (for
2011-2012 only)
44.3 - 77.2
63% (for
2011-2012 only)
53.6 - 71.9
62% (for
2011-2012 only)
54.2 - 69.5
63% (for
2011-2012 only)
60.4 - 64.7
63% (for
2011-2012 only)
61.7 - 64.9
63% (for
2011-2012 only)
61.3 - 63.9
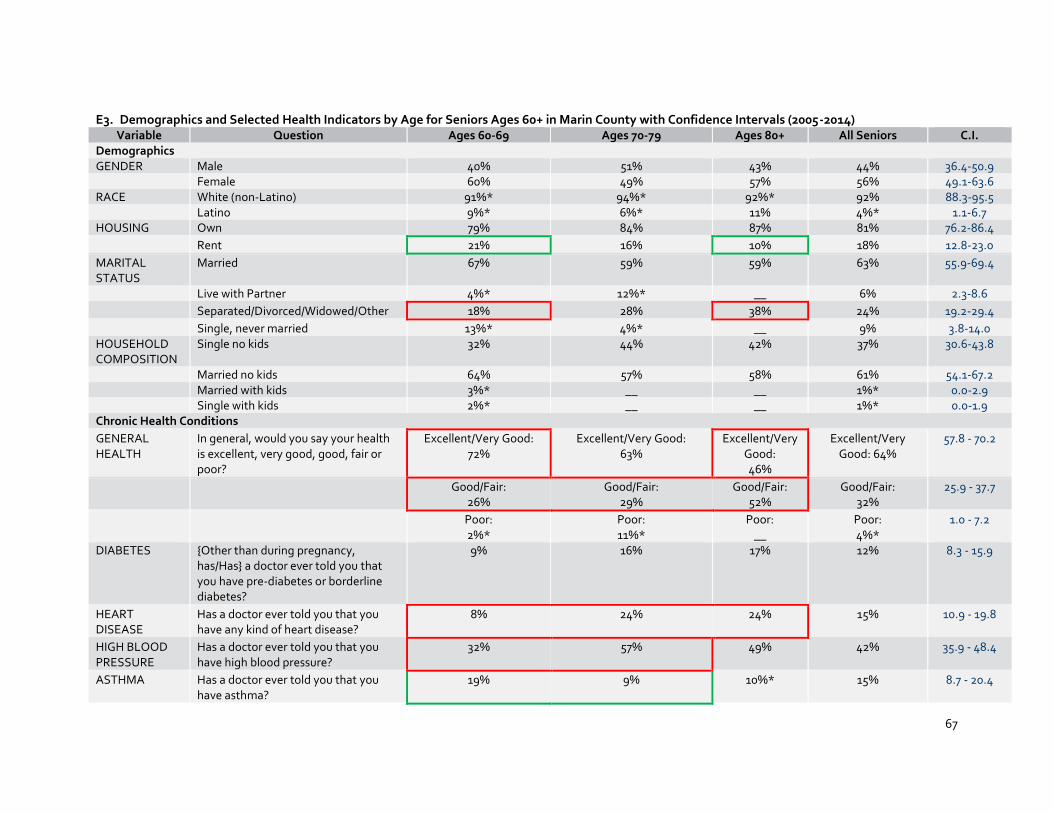
67
E3. Demographics and Selected Health Indicators by Age for Seniors Ages 60+ in Marin County with Confidence Intervals (2005-2014)
Variable Question Ages 60-69 Ages 70-79 Ages 80+ All Seniors C.I. Demographics GENDER Male 40% 51% 43% 44% 36.4-50.9 Female 60% 49% 57% 56% 49.1-63.6 RACE White (non-Latino) 91%* 94%* 92%* 92% 88.3-95.5 Latino 9%* 6%* 11% 4%* 1.1-6.7 HOUSING Own 79% 84% 87% 81% 76.2-86.4
Rent 21% 16% 10% 18% 12.8-23.0
MARITAL STATUS
Married 67% 59% 59% 63% 55.9-69.4
Live with Partner 4%* 12%* __ 6% 2.3-8.6
Separated/Divorced/Widowed/Other 18% 28% 38% 24% 19.2-29.4
Single, never married 13%* 4%* __ 9% 3.8-14.0 HOUSEHOLD COMPOSITION
Single no kids 32% 44% 42% 37% 30.6-43.8
Married no kids 64% 57% 58% 61% 54.1-67.2 Married with kids 3%* __ __ 1%* 0.0-2.9 Single with kids 2%* __ __ 1%* 0.0-1.9 Chronic Health Conditions
GENERAL HEALTH
In general, would you say your health is excellent, very good, good, fair or poor?
Excellent/Very Good: 72%
Excellent/Very Good: 63%
Excellent/Very Good: 46%
Excellent/Very Good: 64%
57.8 - 70.2
Good/Fair: 26%
Good/Fair: 29%
Good/Fair: 52%
Good/Fair: 32%
25.9 - 37.7
Poor: 2%*
Poor: 11%*
Poor: __
Poor: 4%*
1.0 - 7.2
DIABETES {Other than during pregnancy, has/Has} a doctor ever told you that you have pre-diabetes or borderline diabetes?
9% 16% 17% 12% 8.3 - 15.9
HEART DISEASE
Has a doctor ever told you that you have any kind of heart disease?
8% 24% 24% 15% 10.9 - 19.8
HIGH BLOOD PRESSURE
Has a doctor ever told you that you have high blood pressure?
32% 57% 49% 42% 35.9 - 48.4
ASTHMA Has a doctor ever told you that you have asthma?
19% 9% 10%* 15% 8.7 - 20.4

68
Variable Question Ages 60-69 Ages 70-79 Ages 80+ All Seniors C.I. Access to Health Care in the Past Year MEDICAL TREATMENT
In the past 12 months, did you or a doctor think you needed to see a medical specialist?
55% (for 2013-2014 only)
77% (for 2013-2014 only)
67% (for 2013-2014
only)
63% (for 2013-2014 only)
51.0 - 73.9
During the past 12 months, did you delay or not get other medical care you felt you needed-- such as seeing a doctor, a specialist, or other health professional?
11% 7% __ 9%
5.4 - 12.8
EMERGENCY ROOM
During the past 12 months, did you visit a hospital emergency room for your health? (Respondents who visited the emergency room past year for asthma or other condition are also included.)
16% 13% 34% 18.0% 13.7 - 21.9
Mental/Emotional Health
EMOTIONAL WELL-BEING
Was there ever a time during the past 12 months when you felt that you might need to see a professional because of problems with your mental health emotions or nerves or your use of alcohol or drugs?
17% 9% 6%* 13% 8.9 - 16.1
ACCESS/ UTILIZATION
"Was there ever a time during the past 12 months when you felt that you might need to see a professional because of problems with your mental health emotions or nerves or your use of alcohol or drugs?" and "In the past 12 months have you seen your primary care physician or any other professional, such as a counselor, psychiatrist, or social worker for problems with your mental health, emotions, nerves or your use of alcohol or drugs?"
Sought Help and Received Treatment:
71%
Sought Help and Received Treatment: 62%
Sought Help and Received
Treatment: 66%*
Sought help and Received
Treatment: 69%
56.3 - 81.2
"In the past 12 months have you seen your primary care physician for problems with your mental health,
12% 7% 6%* 9% 6.0 - 11.9

69
Variable Question Ages 60-69 Ages 70-79 Ages 80+ All Seniors C.I. emotions, nerves or your use of alcohol or drugs?" and "In the past 12 months have you seen any other professional, such as a counselor, psychiatrist, or social worker for problems with your mental health, emotions, nerves or your use of alcohol or drugs?"
During the past 12 months, did you take any prescription medications, such as an antidepressant or sedative, almost daily for two weeks or more, for an emotional or personal problem?
15% 22% 6%* 15% 10.5 - 19.9
Behavioral Factors
DIET How often fresh fruits/vegetables affordable in neighborhood? This variable is not asked of everyone: Asked of adults who eat and have access to fresh fruits/vegetables in neighborhood
Always: 72%
Always: 80%
Always: 56%
Always: 72%
65.7 - 77.2
Usually/Sometimes: 27%
Usually/Sometimes: 20%
Usually/Sometimes: 41%
Usually/Sometimes: 27%
21.7 - 33.1
Never: __
Never: __
Never: 5%*
Never: 2%*
0.3 - 2.7
In the past 7 days, how many times did you eat fast food? Include fast food meals eaten at work {school}, at home, or at fast food restaurants, carryout or drive through.
0 times: 72%
0 times: 80%
0 times: 82%
0 times: 76%
70.7 - 81.9
1-2 times: 26%
1-2 times: 20%
1-2 times: 14%
1-2 times: 21%
15.9 - 26.9
3+ times: 4%*
3+ times: __
3+ times: 8%*
3+ times: 2%*
0.5 - 4.2
BMI 0 - 18.49 (Underweight) 2%* 4%* __ 2%* 0.8 - 3.5 18.5 - 24.99 (Normal) 47% 46% 41% 45% 38.4 - 51.8
25.0 - 29.99 (Overweight) 35% 40% 51% 40% 32.9 - 46.1

70
Variable Question Ages 60-69 Ages 70-79 Ages 80+ All Seniors C.I.
30.0 or higher (Obese) 16% 11% 6%* 13% 7.7 - 18.8
ALCOHOL Males are considered binge drinkers if they consumed 5 or more alcoholic drinks on at least one occasion in the past year. Females are considered binge drinkers if they consumed 4 or more alcoholic drinks on at least one occasion in the past year.
24% 9% 8%* 17% 10.0 - 23.6
IMMUNIZATION
During the past 12 months, have you had a flu shot?
46% (for 2011-2012 only)
78% (for 2011-2012 only)
77% (for 2011-2012
only)
62% (for 2011-2012 only)
54.2 - 69.5
E4. Demographics and Selected Health Indicators by Race for Seniors Ages 60+ in Marin County with Confidence Intervals (2005-2014) Variable Question White (non-Latino) All Others All C.I.
Chronic Health Conditions GENERAL HEALTH
In general, would you say your health is excellent, very good, good, fair or poor?
65% 53% 64% 57.8 - 70.2 30% 46% 32% 25.9 - 37.7 4%* __ 4%* 1.0 - 7.2
DIABETES {Other than during pregnancy, has/Has} a doctor ever told you that you have pre-diabetes or borderline diabetes?
11% 24% 12% 8.3 - 15.9
HIGH BLOOD PRESSURE
Has a doctor ever told you that you have high blood pressure?
42% 46% 42% 35.9 - 48.4
Access to Health Care in the Past Year MEDICAL TREATMENT
In the past 12 months, did you or a doctor think you needed to see a medical specialist?
65% 47% 63% 51.0 - 73.9
Behavioral Factors DIET How often fresh fruits/vegetables affordable in
neighborhood? This variable is not asked of everyone: Asked of adults who eat and have access to fresh fruits/vegetables in neighborhood
Always: 72%
Always: 62%
Always: 72%
65.7 - 77.2
Usually/Sometimes: 27%
Usually/Sometimes: 37%
Usually/Sometimes: 27%
21.7 - 33.1
Never: 2%*
Never: __
Never: 2%*
0.3 - 2.7
BMI 0 - 18.49 (Underweight) 2%* __ 2%* 0.8 - 3.5 18.5 - 24.99 (Normal) 45% 50% 45% 38.4 - 51.8 25.0 - 29.99 (Overweight) 39% 37% 40% 32.9 - 46.1 30.0 or higher (Obese) 14% 10%* 13% 7.7 - 18.8

71
E5. Demographics and Other Health Behavior Indicators for Seniors Ages 60+ in Marin County and California with Confidence Intervals (2005-2014) Variable Question
Marin California
SODA (only for 2013-2014)
[During the past month,] how often did you drink regular soda or pop that contains sugar? Do not include diet soda." Responses were converted into times per week. Although the question asks about soda consumption in the past month, AskCHIS presents soda consumption for an average week. The average consumption rate is rounded to a whole number, and thus, respondents who indicated drinking soda 1 or 2 times in the past month are grouped into the "0 times" per week category.
0 times 85% 79.6 - 91.2 77% 75.9 - 77.9
1 time 8% 3.3 - 11.7 10% 9.2 - 10.5 2 to 3 times 5%* 0.7 - 8.6 6% 5.4 - 6.3 4 to 6 times 2%* 0.6 - 2.9 2% 1.5 - 2.1 7 or more times 1%* 0.3 - 2.0 6% 5.1 - 6.2
WATER Yesterday, how many glasses of water did you drink at school/work, home, and everywhere else? Count one cup as one glass and count one bottle of water as two glasses. Count only a few sips, like from a water fountain, as less than one glass.
Did not drink water
1%* 0.1 - 2.5 2% 1.9 - 2.8
2 glasses or less 27% 14.3 - 39.8 20% 18.6 - 21.1 3 to 4 glasses 33% 24.7 - 41.0 32% 30.6 - 33.6 5 to 7 glasses 32% 21.1 - 42.2 30% 28.3 - 30.9
8 or more glasses 7% 3.4 - 11.1 16% 15.0 - 17.1
E6. Demographics and Other Health Indicators for Seniors Ages 60+ in Marin County with Confidence Intervals (2011-2014) Age Groups Race/Ethnicity All
Seniors CI
Variable Question Ages 60-69 Ages 70-79 Ages 80+
White (non-Latino) All Others
DIET (only for 2005)
Eats five or more servings of vegetables and fruits daily? This variable is constructed
54% 48.1 - 60.3
57% 50.3 - 62.7
60% 52.7 - 66.4
58% 53.9 - 61.9
37% 20.1 -
53.9
56% 51.9 - 59.8
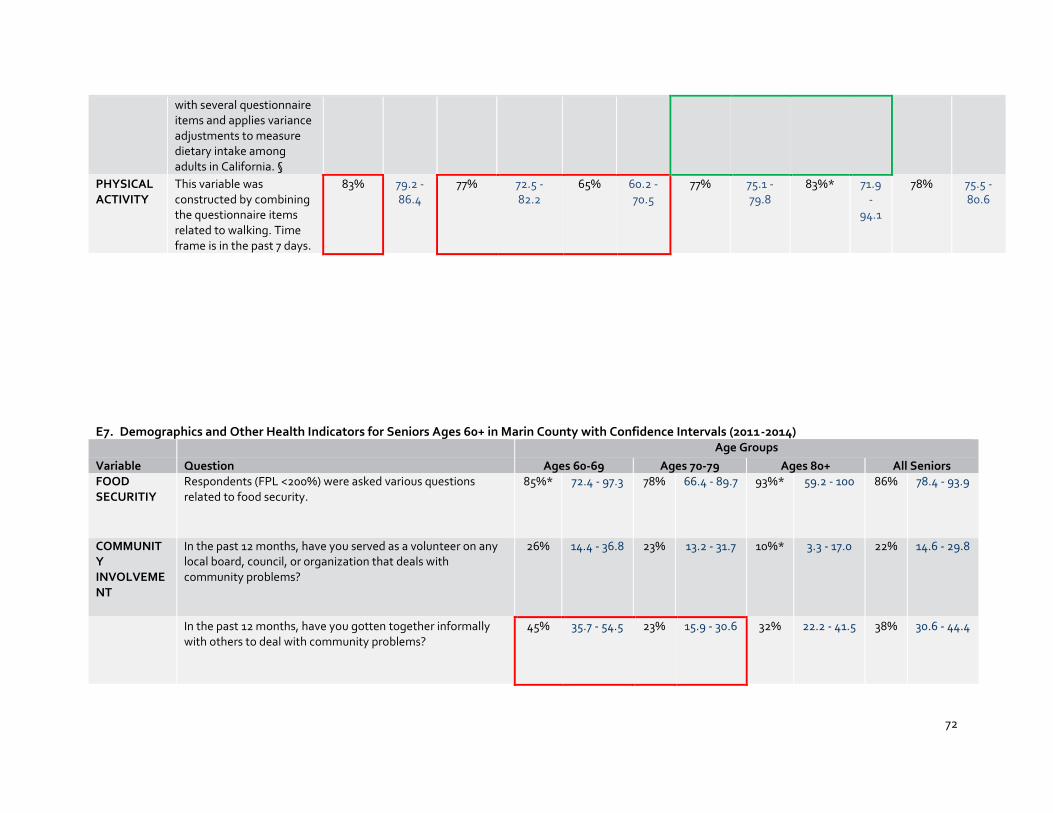
72
with several questionnaire items and applies variance adjustments to measure dietary intake among adults in California. §
PHYSICAL ACTIVITY
This variable was constructed by combining the questionnaire items related to walking. Time frame is in the past 7 days.
83% 79.2 - 86.4
77% 72.5 - 82.2
65% 60.2 - 70.5
77% 75.1 - 79.8
83%* 71.9 -
94.1
78% 75.5 - 80.6
E7. Demographics and Other Health Indicators for Seniors Ages 60+ in Marin County with Confidence Intervals (2011-2014) Age Groups
Variable Question Ages 60-69 Ages 70-79 Ages 80+ All Seniors FOOD SECURITIY
Respondents (FPL <200%) were asked various questions related to food security.
85%* 72.4 - 97.3 78% 66.4 - 89.7 93%* 59.2 - 100 86% 78.4 - 93.9
COMMUNITY INVOLVEMENT
In the past 12 months, have you served as a volunteer on any local board, council, or organization that deals with community problems?
26% 14.4 - 36.8 23% 13.2 - 31.7 10%* 3.3 - 17.0 22% 14.6 - 29.8
In the past 12 months, have you gotten together informally with others to deal with community problems?
45% 35.7 - 54.5 23% 15.9 - 30.6 32% 22.2 - 41.5 38% 30.6 - 44.4

73
References
American Community Survey (ACS) Supporting documentation on code lists, subject definitions, data accuracy, and statistical testing can be found on the American Community Survey website in the Data and Documentation section. Sample size and data quality measures (including coverage rates, allocation rates, and response rates) can be found on the American Community Survey website in the Methodology section. Although the American Community Survey (ACS) produces population, demographic and housing unit estimates, it is the Census Bureau's Population Estimates Program that produces and disseminates the official estimates of the population for the nation, states, counties, cities and towns and estimates of housing units for states and counties. Data are based on a sample and are subject to sampling variability. The degree of uncertainty for an estimate arising from sampling variability is represented through the use of a margin of error. The value shown here is the 90 percent margin of error. The margin of error can be interpreted roughly as providing a 90 percent probability that the interval defined by the estimate minus the margin of error and the estimate plus the margin of error (the lower and upper confidence bounds) contains the true value. In addition to sampling variability, the ACS estimates are subject to nonsampling error (for a discussion of nonsampling variability, see Accuracy of the Data). The effect of nonsampling error is not represented in these tables. While the 2010-2014 American Community Survey (ACS) data generally reflect the February 2013 Office of Management and Budget (OMB) definitions of metropolitan and micropolitan statistical areas; in certain instances the names, codes, and boundaries of the principal cities shown in ACS tables may differ from the OMB definitions due to differences in the effective dates of the geographic entities. Estimates of urban and rural population, housing units, and characteristics reflect boundaries of urban areas defined based on Census 2010 data. As a result, data for urban and rural areas from the ACS do not necessarily reflect the results of ongoing urbanization. Explanation of Symbols:
1. An '**' entry in the margin of error column indicates that either no sample observations or too few sample observations were available to compute a standard error and thus the margin of error. A statistical test is not appropriate.
2. An '-' entry in the estimate column indicates that either no sample observations or too few sample observations were available to compute an estimate, or a ratio of medians cannot be calculated because one or both of the median estimates falls in the lowest interval or upper interval of an open-ended distribution.
3. An '-' following a median estimate means the median falls in the lowest interval of an open-ended distribution. 4. An '+' following a median estimate means the median falls in the upper interval of an open-ended distribution. 5. An '***' entry in the margin of error column indicates that the median falls in the lowest interval or upper interval of an open-ended distribution. A
statistical test is not appropriate.

74
6. An '*****' entry in the margin of error column indicates that the estimate is controlled. A statistical test for sampling variability is not appropriate. 7. An 'N' entry in the estimate and margin of error columns indicates that data for this geographic area cannot be displayed because the number of
sample cases is too small. 8. An '(X)' means that the estimate is not applicable or not available.
Community Health Interview Survey (CHIS) All values, including those with an asterisk, can be used as the best estimate of the given population. Do not use these values for direct comparison as the unstable values are subject to extreme variation.
This indicates situations where the differences between the income categories are statistically significant.
This indicates situations where the confidence intervals overlap very little. We believe that if we had a larger sample size, the confidence intervals would be tighter and there would be a statistically significant difference.
There is a statistically significant difference between the age categories, however, one of the values is statistically unstable and subject to extreme variation. *Data deemed statistically unstable, use with caution **Source: California Health Interview Survey. CHIS 2005-2014. Los Angeles, CA: UCLA *** Falls are only reported for ages 65 and up ‡Demographics are reported because unable to stratify by FPL using ACS data. §Indicator is derived from five other survey items: servings of juice, fruits, potatoes, vegetables, and non-fried white potatoes consumed per day. Those eating a total of five or more fruits and vegetables per day were assigned a value to this indicator.

75
F. Older Adults HEAL Needs Assessment Focus Group Survey Results (n=46)
Demographics F1. Demographic distribution of focus group participants
Count %
Age (n=43)
60-64 9 20.9%
65-69 11 25.6%
70-74 9 20.9%
75-79 4 9.3%
80-84 6 14.0%
85 or older 4 9.3%
Race (n=46)
African American/Black 7 16.3%
White/Caucasian 16 37.2%
Hispanic/Latino 14 31.1%
Native American 1 2.3%
Asian 5 11.6% Vietnamese 3 60.0%
Filipino 1 20.0%
Japanese 1 20.0%
Other 1 2.2%
Gender (n=43)
Male 5 11.6%
Female 37 86.0%

76
F2. Geographic distribution of focus group participants
Transgender Man 0 0%
Transgender Woman 2 4.7%
Gender non-conforming 0 0%
Other 0 0%
Count %
Yearly Household Income (n=37)
$0-$4,999 6 16.2%
$5,000 to $9,999 8 21.6%
$10,000 to $14,999 6 16.2%
$15,000 to $19,999 3 8.1%
$20,000 to $24,999 3 8.1%
$25,000 to $34,999 6 16.2%
$35,000 to $44,999 3 8.1%
$45,000 to $54,999 0 0%
$55,000 to $64,999 1 2.7%
$65,000 to $74,999 0 0%
$75,000 to $99,999 0 0%
$100,000 and Over 1 2.7%
Self-reported Low Income (n=44)
Yes 40 90.9%
No 4 9.1%
Household size (n=40)
Lives alone 23 57.5%
Two 8 20.0%
Three 5 12.5%
Four or more 4 10.0%
Count %
Zip code (n=46)
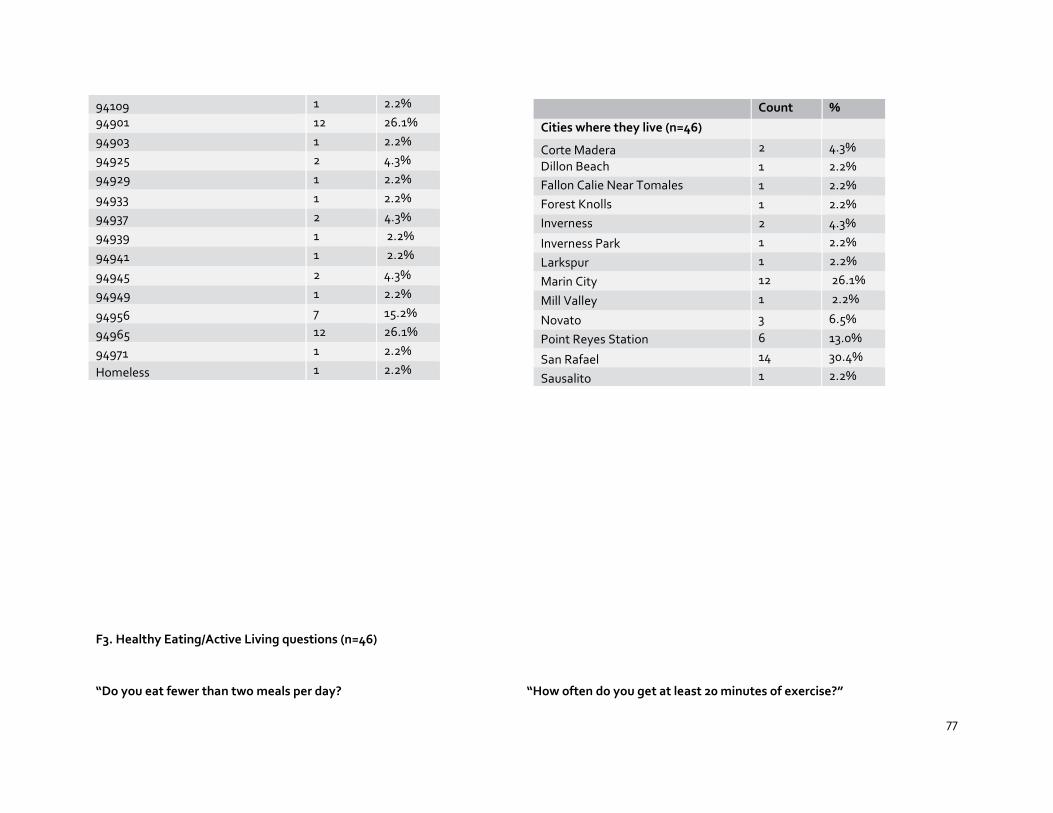
77
F3. Healthy Eating/Active Living questions (n=46)
“Do you eat fewer than two meals per day? “How often do you get at least 20 minutes of exercise?”
94109 1 2.2%
94901 12 26.1%
94903 1 2.2%
94925 2 4.3%
94929 1 2.2%
94933 1 2.2%
94937 2 4.3%
94939 1 2.2%
94941 1 2.2%
94945 2 4.3%
94949 1 2.2%
94956 7 15.2%
94965 12 26.1%
94971 1 2.2%
Homeless 1 2.2%
Count %
Cities where they live (n=46)
Corte Madera 2 4.3%
Dillon Beach 1 2.2%
Fallon Calie Near Tomales 1 2.2%
Forest Knolls 1 2.2%
Inverness 2 4.3%
Inverness Park 1 2.2%
Larkspur 1 2.2%
Marin City 12 26.1%
Mill Valley 1 2.2%
Novato 3 6.5%
Point Reyes Station 6 13.0%
San Rafael 14 30.4%
Sausalito 1 2.2%
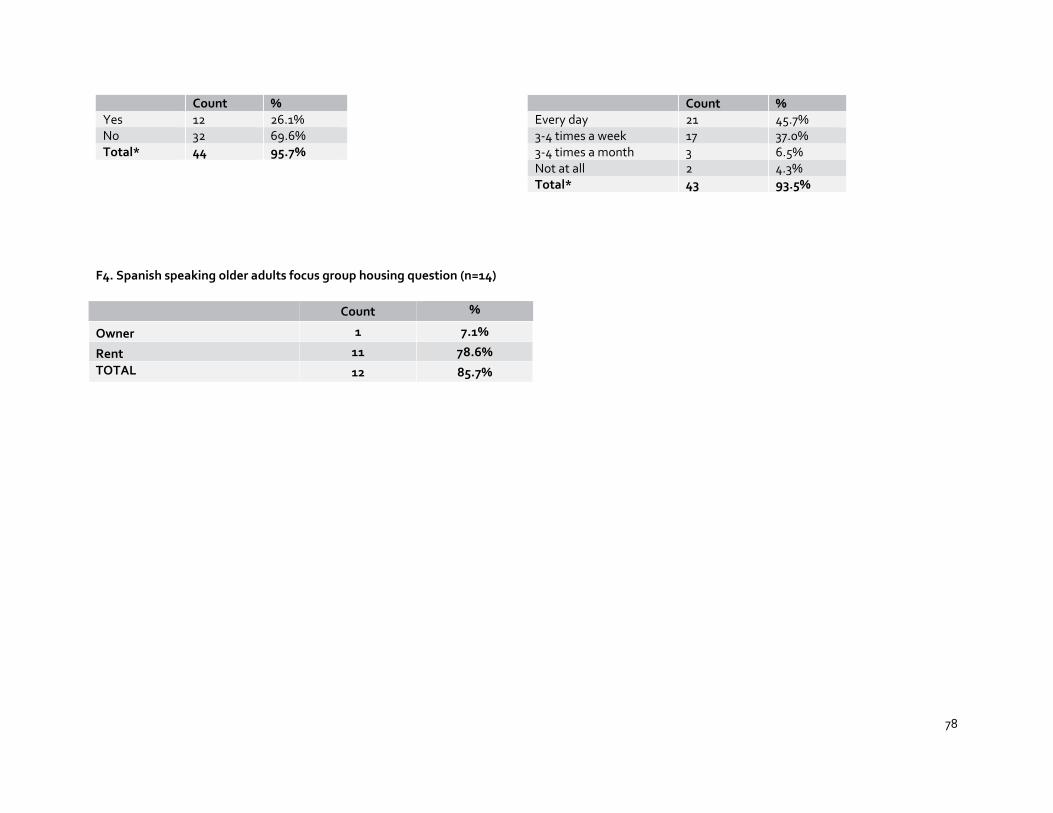
78
Count % Yes 12 26.1% No 32 69.6% Total* 44 95.7%
F4. Spanish speaking older adults focus group housing question (n=14)
Count %
Owner 1 7.1%
Rent 11 78.6%
TOTAL 12 85.7%
Count % Every day 21 45.7% 3-4 times a week 17 37.0% 3-4 times a month 3 6.5% Not at all 2 4.3% Total* 43 93.5%


