Marine Fisheries Stock Assessment Improvement Plan Report of the National Marine Fisheries Service National Task Force for Improving Fish Stock Assessments Pamela M. Mace (Chair), Norman W. Bartoo, Anne B. Hollowed, Pierre Kleiber, Richard D. Methot, Steven A. Murawski, Joseph E. Powers, and Gerald P. Scott October 2001 NOAA Technical Memorandum NMFS-F/SPO-56 U.S. Department of Commerce Donald Evans, Secretary National Oceanic and Atmospheric Administration Vice Admiral Conrad C. Lautenbacher Jr., USN (ret.), Under Secretary for Oceans and Atmosphere 1
Transcript
Marine FisheriesStock Assessment Improvement PlanReport of the National Marine Fisheries Service National Task Force for Improving Fish Stock Assessments
Pamela M. Mace (Chair), Norman W. Bartoo, Anne B. Hollowed,Pierre Kleiber, Richard D. Methot, Steven A. Murawski, Joseph E. Powers, and Gerald P. Scott
October 2001NOAA Technical Memorandum NMFS-F/SPO-56
U.S. Department of CommerceDonald Evans, Secretary
National Oceanic and Atmospheric AdministrationVice Admiral Conrad C. Lautenbacher Jr., USN (ret.), Under Secretary for Oceans and Atmosphere
National Marine Fisheries ServiceWilliam T. Hogarth, Assistant Administrator for Fisheries
1
Contents
List of Illustrations 4
List of Tables 5
Preface 6
Executive Summary 7
I. Introduction 11 Scope of the Stock Assessment Improvement Plan 12
II. Defining NMFS' Stock Assessment Mandate 14 A. What is a "Stock Assessment" 16 B. The Quality of NMFS' Assessments 17 C. Changing Demands 17 Northeast Fisheries Science Center 18 Southeast Fisheries Science Center 19 Southwest Fisheries Science Center 20 Northwest Fisheries Science Center 20 Alaska Fisheries Science Center 21 D. The Credibility of NMFS' Science 22 E. Implications of the Precautionary Approach 23 F. Implications of the Need to Incorporate Ecosystem Considerations 25
III. Assessment and Management Strategy Evaluation Needs 27 A. Input Data 27 (i) Fishery-dependent data needs 27 (ii) Fishery-independent data needs 28 B. Input Data: Minimal and Optimal Requirements 29 C. Stock Assessment Models 34 D. Inventory of the Status of Stock Assessments: Adequacy of Input Data, Assessment Level, and Frequency of Assessments 35 E. Adequacy of Technology and Infrastructure 36 F. Peer Review of Assessments 36 Northeast Fisheries Science Center 37 Southeast Fisheries Science Center 38 Southwest Fisheries Science Center 38 Northwest Fisheries Science Center 38 Alaska Fisheries Science Center 39 G. Translation of Stock Assessment Advice into Management Action 39 H. Communication of Assessment Results and Follow-up Evaluations 41 I. Staffing Issues 41 Education and training 41 Time and motion analysis 42 Beyond assessment scientists 44 Northeast case study 45 IV. Resource Requirements 48 A. Programmatic Needs: Responses to questionnaires 48 B. Three Tiers of Assessment Excellence 53 Tier 1 - Improve stock assessments using existing data 53 Tier 2 - Elevate stock assessments to new national standards of excellence 54
2
Tier 3 - Next generation assessments 54 C. Timeframes and Relationships Between the Tiers 56 D. Region-Specific Needs to Achieve the Three Tiers of Assessment Excellence 57 Northeast Fisheries Science Center 57 NEFSC current situation 58 NEFSC programs and staffing required to meet the three tiers of excellence 59 Southeast Fisheries Science Center 60 SEFSC current situation 60 SEFSC programs and staffing required to meet the three tiers of excellence 61 Southwest Fisheries Science Center 63 SWFSC current situation - central and western Pacific 64 SWFSC current situation - west coast 65 SWFSC programs and staffing required to meet the three tiers of excellence 65 Northwest Fisheries Science Center 67 NWFSC current situation 67 NWFSC programs and staffing required to meet the three tiers of excellence 68 Alaska Fisheries Science Center 71 AFSC current situation - Gulf of Alaska groundfish 72 AFSC current situation - Bering Sea / Aleutian Islands 73 AFSC programs and staffing required to meet the three tiers of excellence 74 E. Summary: National Resource Requirements 78 F. The Benefits of Implementing the Stock Assessment Improvement Plan 80
V. Recommendations 82
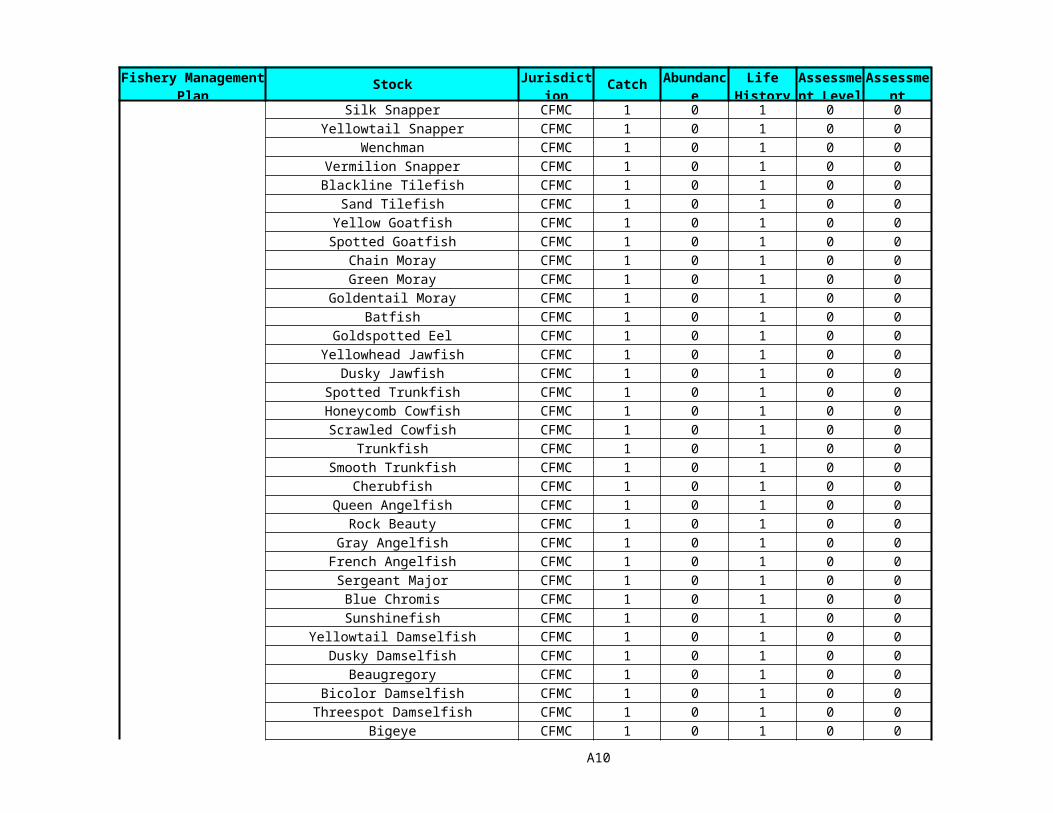
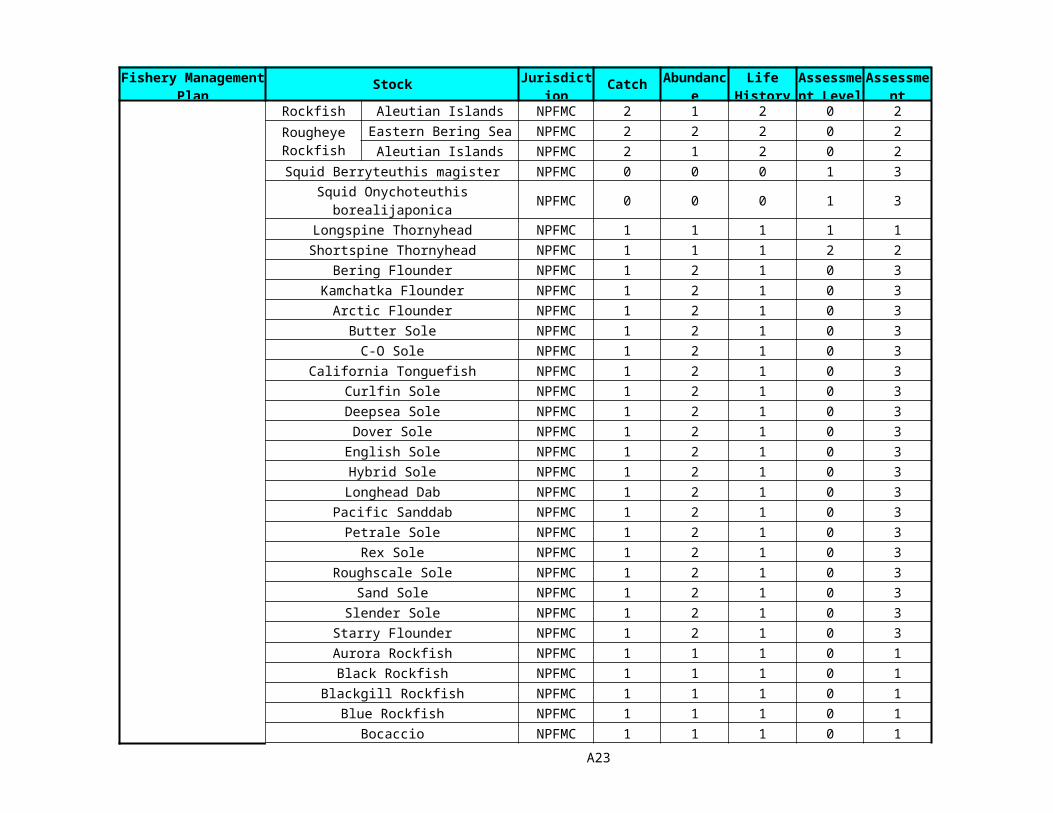
References 84 Acknowledgments 85 Acronyms 86 Appendix 1. Levels of input data (catch, abundance and life history parameters),
assessment methodology, and assessment frequency for the 904 specieslisted in the NMFS (1999a) Report to Congress on theStatus of Fisheries of the United States A1
Appendix 2. Summary of the NMFS Science Quality Assurance Program A30
Appendix 3. Executive Summary from the NOAA Fisheries Data Acquisition Plan A32
Appendix 4. Summary Description of the NMFS Stock Assessment Toolbox A34
Appendix 5. Summary of the Objectives and Scope of the Center for Independent Experts Program A35
Appendix 6. Summary of the Joint NMFS/Sea Grant Graduate Fellowship Program A37
Appendix 7. Extract from the Executive Summary of the NRC Report on Improving Fish Stock Assessments (NRC 1998a) A39 Appendix 8. Executive Summary of the Report to Congress on a Proposed
Implementation of a Fishing Vessel Registration and FisheriesInformation Management System A43
Appendix 9. Executive Summary of the NMFS Bycatch Plan A46
Appendix 10. Summary of the National Observer Program Initiative A48
Appendix 11. Extract from the NMFS Social Sciences Plan and FY2001 Budget Initiative A50
3
Appendix 12. Terms of Reference for the NMFS Standing Working Group on Advanced Technologies A52
Appendix 13. Summary of the Fisheries and the Environment (FATE) Fisheries Oceanography Initiative A54
Appendix 14. Protected Species Programs, Plans, and Initiatives A55
Appendix 15. Habitat Programs, Plans, and Initiatives A58
Appendix 16. Extract from the Executive Summary of the NRC Report on Review of Northeast Fishery Stock Assessments (NRC 1998b) A61
Appendix 17. Executive Summary from "Technical Guidance on the Use of Precautionary Approaches to Implementing National Standard 1 of the Magnuson-Stevens Fishery Conservation and Management Act" (Restrepo et al. 1998) A63
Appendix 18. Conclusions and Recommendations from the Executive Summary of the NRC Report on Sustaining Marine Fisheries (NRC 1999) A65
Appendix 19. Extract from the Executive Summary of the Ecosystem Principles Advisory Panel Report (NMFS 1999b) A69
Appendix 20. Extract from the Executive Summary of the NRC Study on Improvingthe Use and Collection of Fisheries Data (NRC 2000) A72
Appendix 21. List of Relevant National Marine Fisheries Service Partnerships A76
Appendix 22. Cooperative Research Programs with the Fishing Industry A84
Appendix 23. Summary of NOAA's Ocean Exploration Program A85
Appendix 24. Summary of the Census of Marine Life Program A87
Appendix 25. A Non-exhaustive List of Other Programs and Activities that Could Provide Data and Other Inputs to Help Launch Stock Assessments Towards Tier 3 A88
List of Illustrations
Figure 1. Relationship between availability of information and levels of uncertainty 23
Figure 2. Theoretical effects of added information on recommended biological yields 24
Figure 3. Summary descriptions of levels of factors used to classify stocks in termsof input data and assessment status 31
Figure 4. Number of stocks with various levels of input data, assessment methodology,and assessment frequency 33
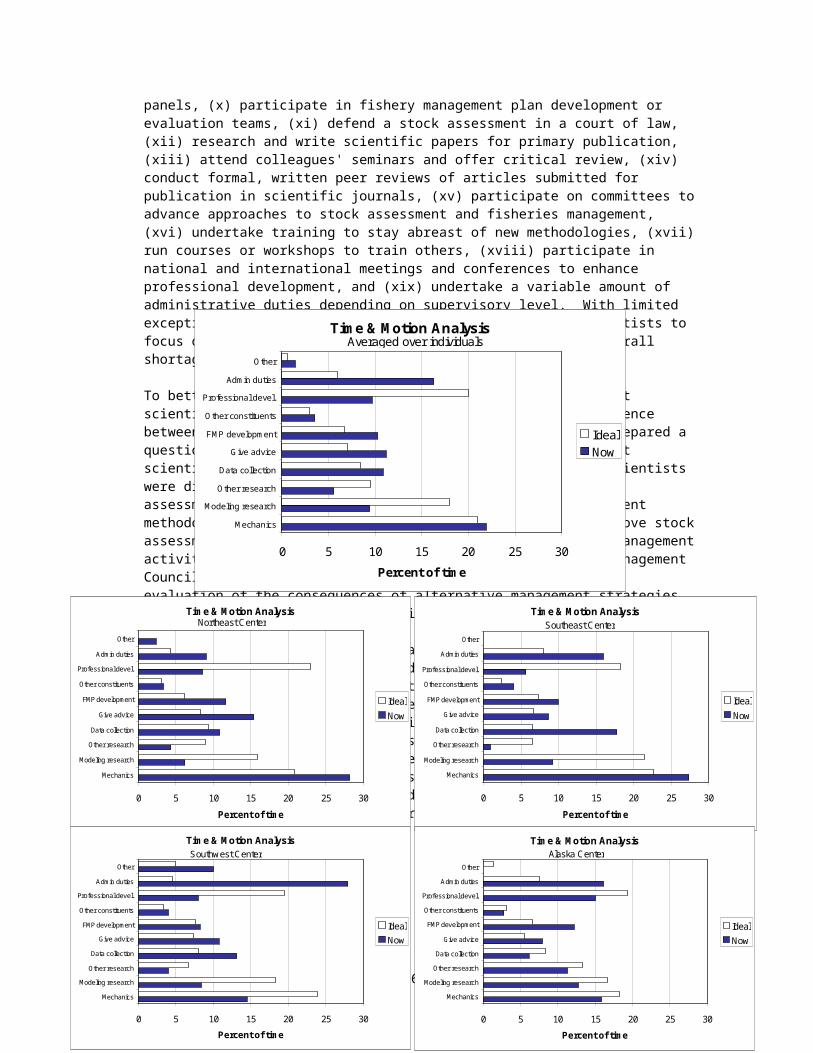
Figure 5. Time and motion analysis for NMS assessment scientists 43
Figure 6. Schematic showing relative staffing requirements to support the provisionof scientific advice for fisheries management 44
4
Figure 7. Schematic showing relative costs of adding new species to be assessed 45
Figure 8. Assessment-related staffing levels by type of activity for theNortheast Fisheries Science Center 48
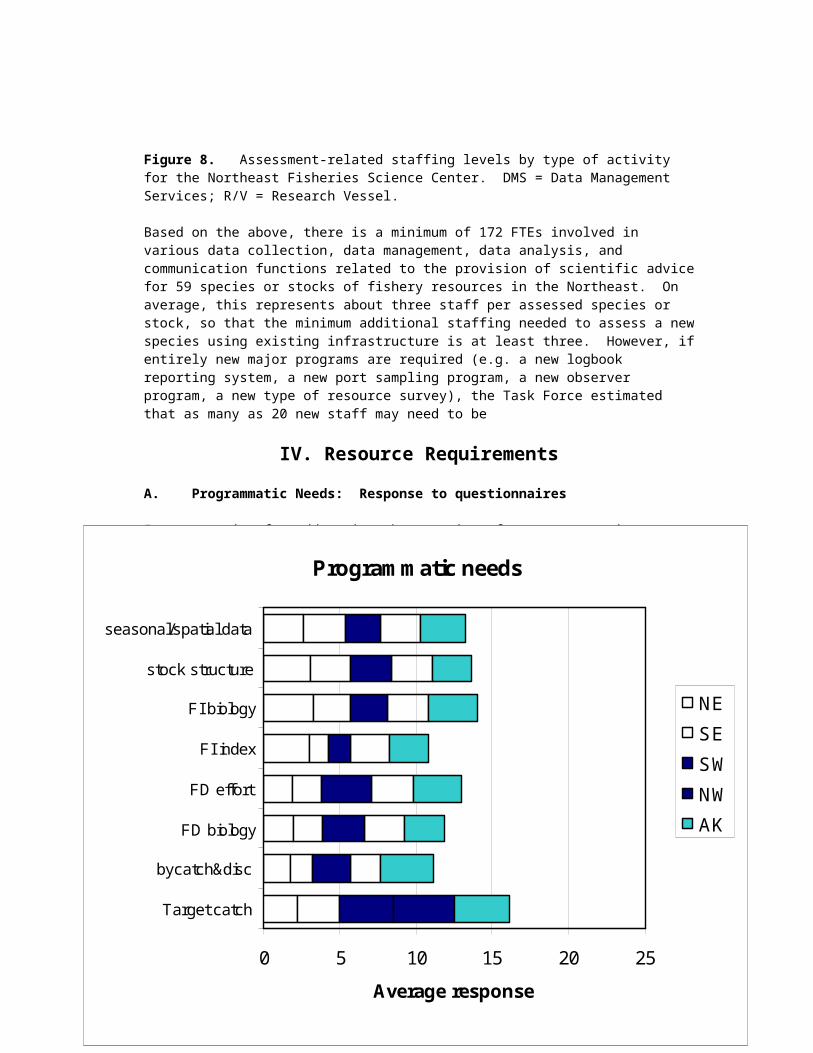
Figure 9. Programmatic needs averaged over responses from assessment scientistswithin each Science Center 49
Figure 10. Impediments to the quality of assessments averaged over responsesfrom assessment scientists within each Science Center 50
Figure 11. Fishery-dependent data needs averaged over responses from assessmentscientists within each Science Center 51
Figure 12. Fishery-dependent data needs averaged over responses from assessmentscientists within each Science Center 52
Figure 13. Summary of the key features of the three Tiers of Assessment Excellence 53
Figure 14. Number of stocks assessed by assessment level at the Northeast FisheriesScience Center 58
Figure 15. Summary of FTE requirements by Science Center, Tiers of Assessment Excellence, and activity 78
List of Tables
Table 1. Numbers of fish stocks with various levels of input data, assessmentmethodology, and assessment frequency 31
Table 2. FTE required to meet the three Tiers of Assessment Excellence by typeof activity for the Northeast Fisheries Science Center 59
Table 3. FTE required to meet the three Tiers of Assessment Excellence by typeof activity for the Southeast Fisheries Science Center 62
Table 4. FTE required to meet the three Tiers of Assessment Excellence by typeof activity for the Southwest Fisheries Science Center 66
Table 5. FTE required to meet the three Tiers of Assessment Excellence by typeof activity for the Northwest Fisheries Science Center 70
Table 6. FTE required to meet the three Tiers of Assessment Excellence by typeof activity for the Alaska Fisheries Science Center 77
Table 7. FTE required to meet the three Tiers of Assessment Excellence by typeof activity for all NMFS Science Centers combined 79
Table 8. Total FTEs required to meet the three Tiers of Assessment Excellencefor each Science Center and all Centers combined 80
5
Preface
This report argues for greatly increased resources in terms of data collection facilities and staff to collect, process, and analyze the data, and to communicate the results, in order for NMFS to fulfill its mandate to conserve and manage marine resources. In fact, the authors of this report had great difficulty defining the “ideal” situation to which fisheries stock assessments and management should aspire. One of the primary objectives of fisheries management is to develop sustainable harvest policies that minimize the risks of overfishing both target species and associated species. This can be achieved in a wide spectrum of ways, ranging between the following two extremes. The first is to implement only simple management measures with correspondingly simple assessment demands, which will usually mean setting fishing mortality targets at relatively low levels in order to reduce the risk of unknowingly overfishing or driving ecosystems towards undesirable system states. The second is to expand existing data collection and analysis programs to provide an adequate knowledge base that can support higher fishing mortality targets while still ensuring low risk to target and associated species and ecosystems. However, defining “adequate” is difficult, especially when scientists have not even identified all marine species, and life histories of many target species, and most associated species is sparse. Increasing calls from the public, stakeholders, and the scientific community to implement ecosystem-based stock assessment and management make it even more difficult to define “adequate,” especially when “ecosystem-based management” is itself not well-defined. In attempting to describe the data collection and assessment needs for the latter, the authors took a pragmatic approach, rather than trying to estimate the resources required to develop a knowledge base about the fine-scale detailed distributions, abundances, and associations of all marine species. Thus, the specified resource requirements will not meet expectations of some stakeholders. In addition, the Stock Assessment Improvement Plan is designed to be complementary to other related plans, and therefore does not duplicate the resource requirements detailed in those plans, except as otherwise noted.
6
Executive Summary
The Stock Assessment Improvement Plan is the report of the National Marine Fisheries Service (NMFS) National Task Force for Improving Fish Stock Assessments, and is a component of the Science Quality Assurance Program. The Task Force consisted of one representative from NMFS Headquarters and 1-2 representatives from each of the five NMFS Science Centers. The report also addresses recommendations made in the National Research Council study on Improving Fish Stock Assessments (NRC 1998a).
Improvements in stock assessments are required for several reasons, including: that management entities are "managing at the edge" for many species, and therefore require the most accurate and precise stock assessments possible; it is no longer permissible to overfish; and there are currently increased demands for adopting a "precautionary approach" and incorporating "ecosystem considerations" into stock assessments and fisheries management. This reports discusses these and other factors that define NMFS' stock assessment mandate.
Although the NRC study on Improving Fish Stock Assessments (NRC 1998a) focused on improving assessment methodology, the Task Force agreed that the greatest impediment to producing accurate, precise, and credible stock assessments is the lack of adequate input data, in terms of the quantity, quality, and type of data available.
For most stocks, there is at least basic information on landed catch and the size frequency of the catch. However, for more than 40% of the 904 stocks listed in the 1999 Report to Congress on the Status of Fisheries of the United States (NMFS 1999a), there is no fishery-independent or fishery-dependent index of abundance, which makes it extremely difficult to conduct a meaningful assessment. Other factors, such as the need to prioritize the stocks to be assessed, result in a total of about 60% of the stocks (545 stocks) lacking assessments sufficient to evaluate stock status relative to overfishing. On the other hand, although there are relatively few stocks with comprehensive input data, a total of 119 stocks are routinely assessed using state-of-the-art age or size structured models, some of which may also incorporate spatial and oceanographic effects. With a few exceptions, all of the high-valued, high-volume, or high-profile species are routinely assessed, while most of the unassessed species contribute little or nothing to total landings.
Stock assessments conducted by NMFS are rarely, if ever, the product of a single individual, and peer review is an integral part of the processes related to provision of scientific advice in support of fisheries management that are carried out by fisheries scientists from within and outside of NMFS. All five Science Centers have systems in place for peer review of stock assessments.
The most important programmatic needs vary by region, and even by species groups within regions. Overall, the two most important needs are research vessel surveys designed to produce fishery-independent indices of abundance and to collect related
7
information on spatial and temporal distributions, associated species, habitat, and oceanographic variables; and observer programs that provide information on species composition, amounts of each species kept and discarded, and fishing effort.
Assessment scientists are faced with many demands. Within a given year, an individual assessment scientist may be expected to: (i) participate in fishery-independent surveys or other field work, (ii) provide input and advice on sampling designs for research surveys and other fishery-independent data collection activities, (iii) spend time on commercial or recreational fishing vessels, (iv) provide input and advice on the development of data collection objectives and protocols for observer programs and other fishery-dependent data collection activities, (v) conduct quality control or other preprocessing of data, (vi) conduct stock assessments, (vii) conduct research into stock assessment methods, (viii) present assessment results to peer review panels and constituent groups, (ix) participate on peer review panels, (x) participate in fishery management plan development or evaluation teams, (xi) defend a stock assessment in a court of law, (xii) research and write scientific papers for primary publication, (xiii) attend colleagues' seminars and offer critical review, (xiv) conduct formal, written peer reviews of articles submitted for publication in scientific journals, (xv) participate on committees to advance approaches to stock assessment and fisheries management, (xvi) undertake training to stay abreast of new methodologies, (xvii) run courses or workshops to train others, (xviii) participate in national and international meetings and conferences to enhance professional development, and (xix) undertake a variable amount of administrative duties depending on supervisory level. With limited exceptions, there is insufficient scope for individual scientists to focus on just one or a few of these activities due to an overall shortage of assessment scientists. A survey of assessment scientists indicated that there is insufficient time to devote to important activities such as research to improve the basis for assessments, professional development, and interactions and cooperative research with national and international peers. The same is likely to be true for individuals involved in data collection, data processing, and data management.
In fact, staffing needs associated with the production of stock assessments go well beyond stock assessment scientists per se, who represent only the "tip of the iceberg." Far greater numbers of staff are needed for deployment in critical data collection activities, such as commercial or recreational catch and effort data, port sampling for biological data, observer programs, and fishery-independent resource surveys. Additional staff are also required to process biological samples (e.g. to determine fish ages from hard structures, construct age-length keys, develop growth curves, construct maturity ogives, and possibly to identify and count eggs and larval fish from ichthyoplankton surveys, and to examine stomach contents), and to enter, audit, integrate, and preprocess data from the myriad of data collection activities.
The Task Force defined three Tiers of Assessment Excellence, which can be summarized as:
Tier 1 - Improve stock assessments using existing data
(a) for core species, conduct assessments that are more comprehensive, more thorough, more timely, better quality-controlled, and better communicated;
(b) for species of currently "unknown" status, mine existing databases of research vessel survey data and/or commercial and recreational statistics for archival information for new analyses to evaluate status determination criteria.
8
Tier 2 - Elevate stock assessments to new national standards of excellence
(a) upgrade assessments for core species to at least Level 3 [the Task Force defined six levels at which assessments are conducted, ranging from 0 to 5; Level 3 assessments comprise analytical models in which ages or species are aggregated];
(b) conduct adequate baseline monitoring for all federally-managed species (including rare species).
Tier 3 - Next generation assessments
(a) assess all federally-managed species or species groups at a minimum level of 3, and all core species at a level of 4 or 5 [size, age or stage-structured models, possibly including spatial and seasonal considerations, species associations, and oceanographic effects];
(b) explicitly incorporate ecosystem considerations such as multispecies interactions and environmental effects, fisheries oceanography, and spatial and seasonal analyses.
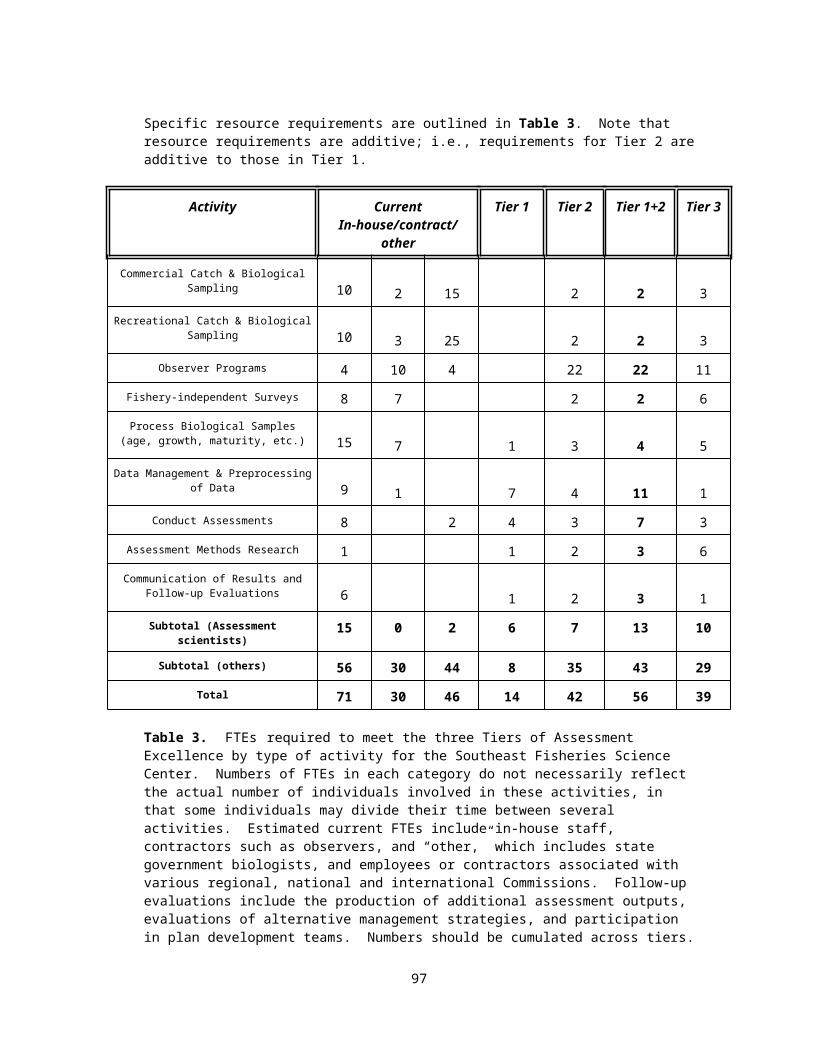
A large part of the report specifies region-by-region program and staffing requirements needed to meet the three Tiers of Assessment Excellence. These are summarized in Table 8 of the report, which is reproduced here.
Table 8. Total Full-Time Equivalents (FTEs) required to meet the three Tiers of Assessment Excellence for each Science Center and all Centers combined. Estimated current FTEs include in-house staff, contractors such as observers, and “other,” which includes state government biologists, and employees or contractors associated with various regional, national and international Commissions. Numbers should be cumulated across tiers.
Among other things, the Task Force recommends that NMFS should aggressively pursue a course of action focusing on new budget and staffing initiatives to modernize its data collection and assessment capabilities. At the minimum, NMFS should attempt to bring stock assessment science to at least Tier 2, and should initiate dialog both within house and with the public to determine how far-reaching and comprehensive Tier 3 should be. This will require hiring or contracting considerable numbers of additional qualified staff for data collection, data processing, data management, stock assessments, and
9
evaluations of alternative management strategies, to ensure adequate data and analyses on which to base conservation and management decisions, now and into the future.
It is also recommended that in order to develop more comprehensive and integrated future budget initiatives geared towards modernizing fisheries assessments and management, NMFS should prepare an umbrella plan that integrates all relevant existing documents on these themes; for example, the current Stock Assessment Improvement Plan, the NOAA Fisheries Data Acquisition Plan (Appendix 3), the NMFS Strategic Plan for Fisheries Research (NMFS 2001b), the Proposed Implementation of a Fishing Vessel Registration and Fisheries Information Management System (Appendix 8), the NMFS Bycatch Plan (Appendix 9), the National Observer Program (Appendix 10), the Social Sciences Plan (Appendix 11), the Advanced Technologies Working Group (Appendix 12), and relevant fisheries oceanography initiatives (e.g. Appendix 13).
In order to make substantial progress towards collecting the data needed to improve stock assessments, particularly next generation assessments, it is essential that NMFS continue to foster partnerships and cooperative research programs with other federal agencies, state agencies, private foundations, universities, commercial and recreational fishing organizations and individuals, environmental groups, and others with a vested interest in collecting similar types of data, although often for different purposes. Programs involving cooperative research with the fishing industry should continue to be developed and expanded as mechanisms for providing data relevant to improving the quality of stock assessments.
10
I. Introduction
The Stock Assessment Improvement Plan (SAIP) is the report of the National Marine Fisheries Service (NMFS) National Task Force for Improving Fish Stock Assessments. It consists of a main document with 8 tables and 15 figures, an Appendix table summarizing the level of completeness of data collection and stock assessments for each federally managed stock (Appendix 1), and an additional 24 appendices (Appendices 2-25) summarizing other relevant programs, plans and reviews. The Stock Assessment Improvement Plan is a component of the Science Quality Assurance Program (Appendix 2), which consists of several other elements including the NOAA Fisheries Data Acquisition Plan (Appendix 3), the Stock Assessment Toolbox (Appendix 4), the Center for Independent Experts (Appendix 5), and the NMFS-Sea Grant Joint Graduate Fellowship Program (Appendix 6). The Task Force consisted of one representative from NMFS Headquarters and 1-2 representatives from each of the five NMFS Science Centers. Additional input from the Science Centers was obtained via questionnaires administered to stock assessment scientists and managers of stock assessment programs. Science Centers were also given the opportunity to review the contents of the Plan.
This report also draws on the analyses and recommendations of the National Research Council (NRC) study on Improving Fish Stock Assessments (NRC 1998a). In order to determine which avenues should be explored to improve stock assessments, NMFS requested in 1995 that the NRC undertake a review of the agency's current stock assessment methods and models and make recommendations for alternative approaches. The objective of the review was to produce an authoritative report that documented the strengths and limitations of stock assessment methods relative to the diversity of available data and types of fisheries management systems. The resulting review (Appendix 7) contained ten recommendations in seven categories for improving stock assessments; these are numbered and presented in summary form below for easy reference through the remainder of the current report.
Recommendation #1: How should assessments be conducted and by whom?Recommendation #2: Development of at least one reliable abundance index for each stock.Recommendation #3: Collection of auxiliary biological data such as natural mortality.Recommendation #4: More realistic assessments of uncertainty.Recommendation #5: Analysis of alternative harvest strategies.Recommendation #6: Development of rigorous evaluation systems including simulation models.Recommendation #7: Development of new techniques for stock assessment.Recommendation #8: More peer reviews.Recommendation #9: Standardized data collection protocols for commercial fisheries.Recommendation #10: Education and training of assessment scientists.
Improvements in stock assessments are required for several reasons, including (a) that management entities are "managing at the edge" for many species, and therefore require the most accurate and precise stock assessments possible; (b) it is no longer permissible to overfish; and (c) there are currently increased demands for adopting a "precautionary approach" and incorporating "ecosystem considerations" into stock assessments and fisheries management. These issues are addressed in detail in Section II, along with other factors that define NMFS' stock assessment mandate. Section III provides background information on requirements for conducting assessments and for evaluating alternative fisheries management strategies. Section IV contains detailed information on qualitative and quantitative resource requirements for each of the five Science Centers, relative to three Tiers of Assessment Excellence. As such, it represents the core part of the report. Recommendations based on the preceding sections of the report are summarized in Section V. Assessment-related information is tabulated in Appendix 1, and an additional 24 Appendices contain information on other relevant plans,
11
reports, and background documents. It is anticipated that the current report will provide a foundation for future initiatives, including budget initiatives, to improve the quality and quantity of NMFS' stock assessments.
Scope of the Stock Assessment Improvement Plan
The Stock Assessment Improvement Plan (SAIP) is the latest of a series of plans for enhancing and modernizing NMFS programs for data collection, information technology, data management, stock assessments, scientific research, and fisheries management. Although the SAIP is specifically geared towards stock assessments, when account is taken of the diverse data needs of stock assessment models and the expectation of more comprehensive ecosystem-based science and management in the future, there is considerable scope for overlap or duplication between several plans. With this in mind, the SAIP was designed to complement plans already completed at its inception, or otherwise to acknowledge duplication, and to avoid contradiction. The key complementary plan is the NOAA Fisheries Data Acquisition Plan (Appendix 3), which details the need for purpose-built fishery research vessels and chartered days-at-sea to satisfy immediate fishery-independent data collection needs. Thus, the SAIP does not include the capital and operating costs of the research vessels, nor chartering costs, nor the permanent vessel crews, but it does include the scientific staff that would participate in research surveys. Another important complementary plan is the Proposed Implementation of a Fishing Vessel Registration and Fisheries Information Management System (Appendix 8), which will provide much more accurate, complete, and timely information on commercial fisheries statistics. The core costs of this program are not considered in the SAIP, but the in-house or contract staff required to collect, manage, and process the data are included. The NMFS Bycatch Plan (Appendix 9), which includes monitoring, data collection, and research, overlaps to a degree with the SAIP but, since the Bycatch Plan did not develop specific staff and other resource requirements, duplication should not be a problem.
One plan with which there is considerable potential for overlap and duplication is the National Observer Program (Appendix 10), which was initiated subsequent to the commencement of the SAIP. As is evident in Section IV of this report, the most important overall need for improving stock assessments is for in-house and contract staff for observer programs for collecting data of relevance to stock assessments, in both the short- and the long-term. The National Observer Program examines observer needs from a slightly different perspective. First, it considers needs for monitoring both commercially-exploited fish species and protected and endangered species such as marine mammals and sea turtles, whereas the SAIP only considers that portion of existing and potential observer programs that could be attributed to obtaining data of direct relevance to commercially-exploited fisheries stock assessments. Second, it outlines a five-year plan, whereas the SAIP is much longer-term. Thus, there is some degree of overlap between the SAIP and the National Observer Program. The overlap will be quantified and controlled for as necessary in future budget initiatives.
The SAIP focuses on field biologists who collect data; laboratory technicians who process biological samples; computer scientists who audit, manage, and analyze data; and quantitative stock assessment scientists who develop and run stock assessment models. Another important fisheries profession not represented in the SAIP is that of social science (economists, sociologists, and anthropologists). The need for additional social scientists is detailed in the NMFS Social Sciences Plan and Budget Initiative (Appendix 11).
Capital costs for the purchase of advanced technologies and operating costs for research and field trials is another activity that is covered elsewhere (Appendix 12), and therefore excluded from explicit consideration in the SAIP. Also excluded are major infrastructure associated with increased staffing, particularly new workspace and buildings that may be required.
In order to further limit the scope of the SAIP and to reduce overlap with other plans and initiatives, it was also decided not to explicitly include resource requirements for fisheries oceanography (e.g. Appendix 13), stock assessments and related activities for marine mammals and sea turtles (Appendix
12
14), habitat-related research and conservation (Appendix 15), and stock assessments and related activities for Pacific salmon.
In order to develop a comprehensive ecosystem approach to fisheries stock assessments and management, and to estimate the actual costs of implementing ecosystem-based management (EBM), all of the above-mentioned plans, initiatives, and activities should be merged into an umbrella plan.
13
II. Defining NMFS' Stock Assessment Mandate
The central importance of stock assessments to NMFS is clear. The NOAA Fisheries Strategic Plan (NMFS 1997a) describes the agency's mission as:
"stewardship of living marine resources for the benefit of the Nation through their science-based conservation and management and promotion of the health of their environment"
That document then outlines five "foundations for stewardship," the first of which is: "Science, which is of the highest quality, and which advances our ability to make living marine resource management decisions." The goals and objectives of the Strategic Plan are reiterated and expanded in the NMFS Strategic Plan for Fisheries Research (1998c, 2001b). Those which are at least partially addressed by the current plan are reproduced below. To facilitate cross reference, the corresponding Fisheries Strategic Plan (FSP) strategy or foundation number follows each fishery research objective.
GOAL 1: Provide scientifically sound information and data to support fishery conservation and management. (Ongoing)
Objective 1.1: Periodically assess stocks to ascertain whether changes in their status due to natural or human-related causes have occurred. These stock assessments require adequate fishery monitoring and resource surveys. (FSP Strategy 1.1.1)
Objective 1.2: Use stock assessments to predict future trends in stock status. Forecasts will take into account projected biological productivity, climatic information, economic markets, and other social forces that will affect levels of fishing effort. (FSP Strategy 1.1.2)
Objective 1.3: Determine and reduce the level of uncertainty associated with stock assessments through improved data collection and advanced analytical techniques. (FSP Strategy 1.2.1)
Objective 1.4: Use stock assessment workshops, peer reviews, and other fora to ensure that our information and advice are developed through an open and collaborative process. (FSP Strategy 1.2.2)
Objective 1.5: Communicate our scientific information and advice, along with the associated uncertainties, to the Councils, other management authorities, and the public. (FSP Strategy 1.1.3)
Objective 1.6: Collaborate with the Councils and other management authorities to explore and develop fishery management regimes and alternative governance systems that will effectively control exploitation and promote sustainability. (FSP Strategy 1.1.4)
Objective 1.7: Provide guidelines to assist the Councils in assessing and specifying maximum sustainable yield (MSY) for managed fisheries. (FSP Strategy 1.1.5) Objective 1.8: Work with the Councils to develop objective and measurable criteria for each managed stock to determine if the stock is overfished or approaching an overfished condition. (FSP Strategy 2.1.1)
Objective 1.9: For each stock which is overfished or approaching an overfished condition, we will develop, in collaboration with the Councils, measures to eliminate or prevent the overfishing. (FSP Strategy 2.1.2)
14
Objective 1.12: Support recommendations provided by the National Research Council [NRC 1999] and the Report to Congress [NMFS 1999b] by establishing criteria to define and delineate marine, estuarine, and riverine ecosystems for management purposes, and identify indicators for assessing the status and detecting changes in the health of such ecosystems. (FSP Strategy 7.3.2)
Objective 1.14: Incorporate assessments or indices of climate variability into stock assessments.
Objective 1.15: Monitor climate change on inter-annual, decadal, and centennial scales and its impact on currently sustainable fisheries.
GOAL 5: Improve the effectiveness of external partnerships with fishers, managers, scientists, conservationists, and other interested groups. (Ongoing)
Objective 5.1: Promote a cooperative network of partners in the coordination of fisheries research.
Objective 5.2: Develop infrastructure for long-term, continuous working relationships with partners to address fisheries research issues.
As reported in the first four annual Reports to Congress on the Status of Fisheries of the United States (NMFS 1997b, 1998b, 1999a, 2001a), the status relative to overfishing of the majority of the fish stocks covered by federal Fisheries Management Plans (FMPs) is unknown. In contrast to the first three reports, the NMFS (2001a) report broke stocks out into "major" or "minor" categories based on landings. Thus, even though the Stock Assessment Improvement Plan is mainly based on information up to January 2000, the following statements are based on the NMFS (2001a) report, which tabulated information on 905 stocks (as compared to a slightly different mix of 904 stocks in the 1999 report). In the 2001 report, 623 of the 905 stocks were recorded as having unknown status. Although it is often overlooked, most of the 905 stocks tabulated can be classified as "minor" stocks: 618/905 or 68.3% have recent landings less than 90.74 metric tons (200,000 pounds) annually. In total, "minor" stocks have accounted for only about 0.11% of total landings in recent years. However, it should be noted that "minor" stocks are often not landed or identified to species, and discarded catches may not be recorded, particularly where observer programs are lacking. Whether or not actual removals constitute a risk to the long-term viability of these species is unknown. Of the 287 "major" stocks, 35.2% are of unknown or undefined status relative to threshold fishing mortality levels that define "overfishing," while 41.8% are of unknown or undefined status relative to threshold stock sizes that define whether a stock is "overfished." While the costs of determining the status of all 623 stocks in the unknown category may be prohibitive, additional efforts to obtain the information necessary to assess the major stocks with unknown status is certainly warranted. In addition, major stocks of "known" status also require special and vigilant attention because many of them (25.3%) are experiencing overfishing and many (36.5%) are overfished or approaching an overfished condition. The need to elevate the level of knowledge of many of the unknown species, even those of "minor" importance, will escalate as fisheries management progresses towards ecosystem-based management (EBM). Thus, there is a need to constantly improve both the quality and quantity of stock assessments.
It is also important to keep in mind that NMFS' mandate is actually a dual one of both sustainability and exploitation, which can often create conflict. The fact that our science is used for regulation means that stock assessments will often be challenged. Thus, as stated in the NMFS Strategic Plan for Fisheries Research, "all of the agency's information must be comprehensive, objective, credible, and effectively communicated."
15
A. What is a "Stock Assessment?"
The term "stock assessment" is used to describe the processes of collecting, analyzing, and reporting demographic information for the purpose of determining the effects of fishing on fish populations. The production of stock assessments requires quantitative information on the relative or absolute magnitude of a fish population, estimates of the total removals due to human activities (due to fishery landings, discarded bycatch, and cryptic mortality due to encounters with fishing gear), life history data including rates of growth, average age of the onset of sexual maturity, maximum longevity, and the proportion of each age group dying each year due to natural causes, and other factors that affect stock productivity. These data are combined using simple or complex mathematical models (NRC 1998a) to derive "best" estimates of vital statistics such as historical and recent trends in the number and biomass of the resource, recruitment levels (number of small fish entering the fishery each year), and the fishing mortality rate or the fraction of the stock alive at the beginning of the year that are killed by fishing (commonly referred to as the exploitation rate).
The results of stock assessment calculations provide information necessary to estimate the current abundance and exploitation rates of resources in relation to predefined goals for these two attributes, also termed "status determination criteria." If the biomass is determined to be significantly below a minimum threshold, the stock is in an "overfished condition." If the current exploitation rate is significantly higher than a maximum exploitation rate threshold, overfishing is deemed to be occurring. The Magnuson-Stevens Fishery Conservation and Management Act (MSFCMA) mandates that if stocks are in an overfished condition or if overfishing is occurring, managers must implement measures to rebuild the stock and/or to eliminate overfishing. In addition, assessment results provide the technical basis for setting the level of biologically acceptable yield for healthy stocks, and the expected rate of rebuilding for depleted stocks.
The stock assessment evaluation is thus a key element of the fishery management process since it is used to determine whether additional regulations are necessary, or if greater fishing opportunities can be allowed consistent with the objective of sustainable fishing. In addition to enabling determination of overfishing, stock assessment results have three additional important purposes: (1) for each managed stock, a history of estimates of catches, stock sizes and exploitation rates is used to establish reference levels for the two status determination criteria; (2) assessment results (biomass, recruitment levels and exploitation rates) are combined to provide short- (1-2 year), medium- (3-10 year) and sometimes long-term (10+ year) projections of how fish populations and catches will change over time; and (3) stock assessment results are typically combined with other research results or assumptions to evaluate various alternative sets of management measures proposed by managers to attain specified objectives. The latter analyses are termed "alternative management strategy analyses" and are important because there are often many different types of measures that can be used to manage fisheries (e.g. regulating the characteristics of the gear such as minimum mesh size, or regulating the amount of effort by fleet sector, area, or season). The selection of the "preferred" set of management measures is often complex and requires quantitative evaluation since even if one or several options allow a stock to rebuild to optimal levels, they may have dramatically different implications for the profitability of fisheries and the allocation of benefits among competing harvest sectors. Quantitative stock assessments provide the essential information necessary for the analyses required in the fishery management process.
The quality of a particular stock assessment (i.e. the accuracy and precision of stock size and exploitation rate estimates) is directly related to the quality and completeness of the input data used for the assessment. No stock assessment is perfect because the information used is derived from a modest number of observations that are assumed to be statistically representative of the population as a whole. Elsewhere in this document (Sections IIA, IIB), information on the quality of data on catches, abundance measures and life history data supporting stock assessments for all managed or assessed fishery stocks occurring in EEZ waters is provided. In most cases, the sophistication of the stock assessment model used to estimate stock size and the accuracy and precision of the results is directly related to the quality of the assessment data. It cannot be overemphasized that improving the quality of fish stock assessments (consistent with the focus of the NRC report) primarily involves improving the
16
quality of basic input data on catches, abundance and life history, and that these improvements will lead to a progression through Tiers of Assessment Excellence.
The goal of improving fish stock assessments is to allow society to extract maximum benefits from fish stocks while minimizing the risk that stocks will become overfished. As assessments are improved, the types of questions posed by managers will increasingly emphasize multispecies aspects (technological and biological interactions among stocks and fisheries), and will require greater temporal and spatial detail to evaluate fine-scale time/area components of management measures. Thus, the requirements for the next generation of fish stock assessments will necessitate continued improvements to data and refinements to models.
In addition to requiring fishery data and selection of appropriate mathematical models, the process of producing stock assessment, as practiced by NMFS, involves explicit and intensive QC/QA through a process known as "peer review." Owing to the implications of stock assessment results for the ecosystem and the economy, the public must be assured that data and procedures used by NMFS and its cooperators meet accepted standards for the production of such analyses. Assessments undertaken by all of the NMFS Science Centers include an element of peer review, which involves review of data and calculations by experts independent of the people responsible for the work being reviewed. In many cases peer reviews have involved academic researchers, inter-Center exchanges of personnel, experts hired by fishery industry groups, and international scientists. An increasing and serious impediment to the improvement of stock assessments nationwide is the difficulty of providing for adequate peer review under the burden of increasing numbers of stock assessments with higher levels of complexity being produced more frequently, in combination with a relatively small pool of experts in this specialized area.
B. The Quality of NMFS' Assessments The stock assessment activities within the National Marine Fisheries Service have produced strengths and accomplishments that are globally recognized. The strength of the national assessment activities lies in the development of periodic stock-wide status determinations for major species; i.e. those species which are economically most important and which comprise the majority of the fisheries biomass. The accomplishments of NMFS scientists in this regard compare favorably with any national effort worldwide. These assessments have allowed these important stocks to be monitored effectively. The precision and accuracy of these assessments has proven to be extremely helpful in management. These results have also formed the basis for much of the understanding of fishery population dynamics and the historical trends of these species.
However, NMFS assessment efforts have been less effective in several other areas. Specifically, there are many species that are not assessed even though in many instances some relevant data may exist. While these species are not economically dominant and do not comprise a high proportion of the biomass, they often interact ecologically with the economically important species and they may be significant keystones in the functioning of the ecosystem. At the present time we have little understanding of the role of these species either in the ecosystem or in local economies. There has been a lack of resources to obtain sufficient data to evaluate these species.
Another limitation to present assessment efforts is the understanding of the spatial and temporal dynamics of the species. Under what conditions do fish move into alternative areas of their range and what are the stimuli? These questions have become important as managers attempt to provide for the diversity of users of the resources.
C. Changing Demands
The demand for stock assessments has shifted both quantitatively and qualitatively throughout the Nation. Fisheries have expanded to target heretofore lightly exploited resources, as traditional stocks have been fully exploited or over exploited, leading to needs for increased numbers of stocks to be assessed. More detailed and complex regulatory mechanisms are being devised to distribute the
17
limited resources equitably between fishing sectors, commercial, recreational, and bycatch users. In order to evaluate these alternative mechanisms, spatial and temporal projections of management scenarios are required, taxing the limits of the available data and the number of assessment scientists. The MSFCMA has imposed new management requirements that have increased both the detail and the number of assessments that are to be conducted. These general changes have manifested themselves in the Nation's fisheries in a variety of ways which are described below for each of the NMFS Science Centers.
Northeast Fisheries Science Center
The Northeast Fisheries Science Center (NEFSC) typically produces stock assessments, in one form or another, for about 51 managed species/stocks (Appendix 1). Not all of these stocks are managed under Federal FMPs (e.g. some are managed by the Atlantic States Marine Fisheries Commission, ASMFC, or individual states, or under international agreements). These assessments run the gamut from index-level assessments using trawl survey information, to stage-based analytical assessments incorporating multiple abundance indices and catches. During the past 15 years, stock assessments have been peer-reviewed under the jurisdiction of the Northeast Stock Assessment Workshop (SAW) process. Typically, the SAW has reviewed about dozen high priority stock assessments per year, six each in spring and autumn SAW meetings.
The demand for more timely and comprehensive stock assessments has increased greatly, primarily as a result of the need to respond to information needs associated with the MSFCMA. The exploitation history of most of the economically-important stocks of the region has necessitated stringent rebuilding plans, and managers are requesting more frequent assessment updates on a wider array of species, and are considering more complex types of indirect controls on fishing mortality, including manipulating the temporal and spatial patterns of fishing.
A major new demand on the assessment process is to increase the precision of estimates of exploitation rates and stock sizes. For many resources, fishing rates historically have greatly exceeded standard biological reference points and stock sizes were considerably below those considered optimal for sustainable fisheries. Thus, even imprecise assessments were considered useful enough to give clear advice about the direction of fishery management and rough indications of the magnitude of fishing effort reductions required (e.g. in many cases fishing mortality rates were five times the target levels, and stock biomasses were 1/5th of the biomasses generating MSY). Management programs instituted in the mid-1990s have resulted in reduced harvest rates for species such as haddock, yellowtail flounder, sea scallop, and other economically-important resources. As a result of these changes, managers require more precise information to determine the probabilities of attaining fishing mortality rate targets associated with the harvest control rules they have adopted. Additionally, because so many of the region's resources were determined to be overfished, 10-year rebuilding programs are now in effect. Consequently, management requires medium-term projections to determine which exploitation strategies will allow attainment of biomass targets with a specific probability.
In addition to the increased demand for precision of analyses, the requirement for estimates of biomasses and fishing mortality rates or proxies associated with MSY for all managed species necessitates that the level of many stock assessments be increased from monitoring of indices of abundance to greater levels of analytic complexity. This means that the demands for biological sampling of fishery catches and abundance indices will increase (e.g. more routine age determinations for managed stocks). Likewise, managers require more specific information on all components of fishery catches, and especially fishery discards, which have historically not been sampled adequately in the Northeast fisheries. Thus, in addition to increased needs for more stocks to be assessed, increased quality of assessments means significantly augmented data collections and biological information to support improved assessments.
The frequency of stock assessment updates has increased primarily as a result of the many changes recently incorporated in many of the region's FMPs. Because of reductions in fishing effort, the closure of large areas of productive fishing grounds, trip limits and other measures, managers want to
18
know the incremental effect of these measures on attaining required fishing mortality and biomass targets. Thus, for example, the New England Fishery Management Council has requested detailed assessment updates on all managed stocks well in advance of each new fishing year, so as to determine the suite of new measures necessary to meet the requirements of the law. This is in strong contrast to recent history when a small group of important species (e.g. cod, haddock, yellowtail flounder) were used as "bellwether" indicators of the exploitation of the status of a complex of about 25 managed stocks. Additionally, the MSFCMA requires that stocks that were historically "written-off" as virtually commercially extinct, be rehabilitated towards sustainable stock levels (e.g. Atlantic halibut, redfish). Thus, new stock assessments are required to determine the feasibility and impacts of efforts to do so. Even stocks for which no commercial uses exist are subject to increased demand for assessments when their status may be impacted as a result of fishery bycatch (e.g. barndoor skates).
Management advice based on analytic stock assessments is also increasingly required to support complex measures accounting for technological interactions among the region's stocks (which are generally significant) and the increased demand for finer spatial and temporal scale information supporting area rotation strategies, and other complex management approaches. Supporting these scales of management will require improvements in basic information collected from fishers (e.g. logbook-type data and observer data) and dealers. There is an important new demand for integration of single species assessment information to support assemblage management (stock trade-offs). Managers are also increasingly concerned with the trophic implications of attempting to increase all managed stocks to BMSY simultaneously, necessitating more research on biological interactions.
Southeast Fisheries Science Center
The fisheries under the research jurisdiction of the Southeast Fisheries Science Center (SEFSC) are diverse in both the species being exploited and the fishing sectors prosecuting these fisheries. The fisheries include a large number of snapper-grouper fisheries, mackerel fisheries, croakers, shrimp and other invertebrates, sharks, and Atlantic-wide tunas and billfish. Characteristically, these fisheries involve large recreational sectors along with the usual commercial sector (in some instances the recreational sector takes the majority of the catch). Additionally, there is a large bycatch sector; i.e. bycatch of commercially and recreationally important species occurs in large numbers in some fisheries. Interactions between these sectors have manifested themselves in numerous allocation conflicts.
Another characteristic of southeastern U.S. fisheries is that the productivity of many of the species being exploited is low, supporting relatively small catches (there are over 400 species within Southeast FMPs or international conventions). However, some of the species are extremely valuable and many are very important to local communities. Also, in aggregate the species catches are significant and the fisheries often have the capability to exploit a variety of species, switching target species as conditions change. These characteristics create unique dynamics which affect the research and management of these resources.
The Southeast Fisheries Science Center has conducted assessments for the most important stocks for the last two decades. These assessments have been reviewed through Stock Assessment Panels of the Councils and through international scientific working groups within the International Commission for the Conservation of Atlantic Tunas. Through these scientific groups the assessment information is integrated into the scientific advice on Allowable Biological Catch (ABC).
However, there are a number of recent events that have altered the assessment landscape in the Southeast. First and foremost, several important stocks have been severely depleted leading to very restrictive limitations on catch. As the stocks begin to recover, more detailed regulations such as trip limits, area closures, minimum sizes and bag limits are being devised to distribute quotas more equitably. Evaluation of these alternatives require an order of magnitude greater spatial and temporal details. The evaluation activities require an increasingly larger proportion of the assessment scientists' time. Additionally, as fishers look for new alternatives to replace depleted stocks, they have begun to target stocks that traditionally have not been exploited. In many cases, detailed assessments have not
19
been conducted for these stocks but as fishing pressure has increased, there has been an increased need to evaluate their status. The ability to do this is limited by both the available data and the human analytical resources.
Finally, the MSFCMA has shifted the focus of management from limiting fishing mortality rates under the 602 Guidelines to limiting both the maximum allowable fishing mortality rate and the minimum allowable stock abundance. Scientifically, it is easier to estimate the reference fishing rates than to determine appropriate reference abundance criteria, especially when data are limited and the species are numerous. The MSFCMA requirements have shifted the focus to determining abundance criteria. This requires examination of each stock individually. It is unclear whether the Southeast Fisheries Science Center has the data or human resources available to address these issues for all 400+ species in the southeast and Caribbean.
Southwest Fisheries Science Center
On the Pacific coast and in Hawaii demands on the Southwest Fisheries Science Center (SWFSC) stock assessment scientists have been increasing significantly due to new FMPs, increasing lawsuits and other pressure from industry and environmental groups, and new demands to manage international fisheries for which little data are available. At the same time, SWFSC resources for this research have diminished and little funding beyond basic salaries is available.
New FMPs are in place or being developed for coastal pelagic species and highly migratory species, and increased attention is being demanded for stock assessments of squid, marlins, swordfish, albacore, groundfish, sharks, marlins and tropical tunas. Environmental groups are pressing for increased research on sharks, monk seals, turtles and rockfish. Marine mammal stock assessments are partially completed for the 38 west-coast species but have not been started for Hawaiian or other U.S. Pacific waters. A new fishery has developed for near shore rockfish; coral fisheries are resuming; and California salmon issues are highly controversial.
A new international agreement on western Pacific Highly Migratory Species is being developed that will demand a huge and complex stock assessment effort by the U.S. in collaboration with other fishing nations. Also, new legislation requires that research be strengthened on the major international fisheries in which U.S. fishers participate, harvesting swordfish, tropical tunas, albacore, plus incidentals such as marlins, mahimahi, opah, wahoo, and others.
Northwest Fisheries Science Center
The Northwest Fisheries Science Center (NWFSC) engages in assessments of west coast groundfish and salmon. The demands for accurate assessments for both groups of species are high and increasing. For groundfish, only 26 of the 82 species have been quantitatively assessed. Of these 26 species, several have experienced severe declines because of overly optimistic historical harvest rates during a 20-year regime of poor ocean productivity with inadequate stock assessment information to adequately monitor and forecast the declines. As of 2001, rebuilding plans are being developed for seven groundfish species that have declines below the overfished threshold, and there are concerns that others of the 60+ species with unknown status may also be in danger. For salmon, the status of Pacific salmon species on the west coast has been reviewed under provisions of the Endangered Species Act and 26 of the populations (Evolutionarily Significant Units) have been listed as threatened or endangered. A tremendous effort is being mounted by the NWFSC to develop salmon recovery plans that incorporate all aspects of human and natural risks to salmon.
Groundfish and salmon are managed according to Fishery Management Plans developed by the Pacific Fishery Management Council. Although the NWFSC has the lead role in coordinating assessment information for both FMPs, there are major contributions by other NMFS Science Centers and by the state fishery agencies of California, Oregon and Washington. For salmon, nearly all of the escapement monitoring and run forecasting is based on inriver information and is done by the state agencies. This information is used by the Salmon Technical Team of the PFMC to develop harvest options for
20
consideration by the PFMC. The Scientific and Statistical Committee of the PFMC provides reviews of methodology for this work. For groundfish, shoreside catch monitoring is done by the state agencies with coordination through the Pacific States Marine Fisheries Commission (PSMFC) which maintains a centralized database of fisheries data (PacFIN). In 2001, a coastwide observer program was implemented by NMFS in collaboration with PSMFC and the states. Most resource surveys are conducted by NMFS, with the triennial bottom trawl and hydroacoustic surveys providing a major source of data for most assessments. Approximately six groundfish stock assessments are conducted each year by NMFS, state agencies and others. The NWFSC coordinates a stock assessment review process in conjunction with the PFMC's SSC, that involves external peer-reviewers and public input. These groundfish assessments have been controversial. The west coast groundfish industry seeks an increasing role in gathering of relevant stock assessment information, and in participating in the stock assessment process.
Passage of the Sustainable Fisheries Act strengthens the mandate to improve the west coast stock assessment capability. Assessments need to be conducted for more of the groundfish species. The level of uncertainty in groundfish assessments and the current information indicating low productivity for these species needs to be combined in an adequately precautionary approach to managing these species. Rebuilding plans, which are expected to have time horizons longer than 10 years, need to be developed and subsequently monitored for several long-lived species. All of these tasks will be extraordinarily difficult given the lack of a dedicated research vessel for surveying these resources and the low level of current resource survey efforts. Further, increased stock assessment effort will primarily result in increased knowledge about what changes the fish populations have undergone, but knowing what is only the first step. In order to develop a better understanding of why changes are occurring, programs need to be developed to investigate the role of decadal scale changes in ocean climate, and the role of ecosystem shifts such as the major increase in pinniped abundance that has occurred off the west coast.
Alaska Fisheries Science Center
The Alaska Fisheries Science Center (AFSC) stock assessment staff have experienced increased demands stemming primarily from requests for information regarding the impacts of fishing on marine ecosystems. These requests require added activities including (1) development of new assessments for minor species, (2) development of models that address predator-prey interactions, and (3) development of models that incorporate environmental forcing on stock production.
The AFSC produces stock assessments for fish and shellfish in the Eastern Bering Sea, Aleutians and Gulf of Alaska (Appendix 1). These stocks are managed under Federal Fisheries Management Plans (FMP) or under international agreements. The North Pacific Fisheries Management Council (NPFMC) FMP covers 100 species/stocks in the GOA and 127 species/stocks in the Bering Sea Aleutian Islands. In some circumstances (e.g. Pacific salmon and crab), fish stocks are assessed jointly between federal and state fishery scientists. The NPFMC has a long tradition of conservative management of Alaskan fishery resources that includes bycatch limits to protect weak stocks or prohibited species.
The infrastructure supporting this type of management consists of complex fisheries-dependent and fishery-independent data collection programs as well as detailed assessments of core species. The NPFMC reviews stock assessments for groundfish and crab stocks or stock complexes on an annual basis. Stock assessments are peer-reviewed by the North Pacific Fisheries Management Council's (NPFMC) Plan Team and Scientific and Statistical Committee. In addition, AFSC solicits peer reviews of selected species by outside stock assessment experts. These review panels evaluate all aspects of the assessment from data collection to model formulations.
Passage of the MSFCMA in 1996 increased the need for comprehensive assessment of marine resources in Alaskan waters. The MSFCMA mandated adoption of overfishing definitions for exploited marine resources managed under Federal FMPs, and an evaluation of impacts of humans on essential fish habitat. These two mandates require increased data collection, data analysis, and impact review. Efforts are currently underway to increase the frequency and regional coverage of bottom
21
trawl and Echo Integration Trawl surveys. For some species, new survey methods and fishery-dependent data collection programs are necessary to develop indices of stock abundance and catch. Demands for data processing, data analysis and stock assessment modeling occur as these new sources of fishery-dependent or fishery-independent data become available. There is a growing need for the development and implementation of complex assessment models. Recently, statistical assessment models (SAMs) have been modified to consider uncertainty stemming from process and measurement errors. SAMs have also been developed to explore the impact of temporal trends in predator abundance. These models are used to explore assumptions regarding predator satiation, natural mortality, and predator selectivity on uncertainty in estimating biomass.
In recent years, NMFS has experienced a number of challenges to regulatory decisions based on AFSC assessments. These challenges require assessment scientists to evaluate a number of alternative harvest strategies. For example, assessment scientists have been asked to develop ecosystem based harvest strategies that encompass impacts of fishing on the structure and function of marine communities. Recent declines in sea bird and marine mammal populations that share exploited resources with commercial fishers have triggered interest in designing harvest strategies for minimizing impacts of fishing on protected resources. These demands require analysis of marine mammal-fisheries interactions on finer spatial and temporal scales, and they require review of more complex management approaches.
D. The Credibility of NMFS' Science
Assessment activities form the apex of the scientific support of management (see Section III, I). The assessment process integrates a wide array of scientific information and the results are directly communicated to managers and constituents by the assessment scientists. These activities are required to fulfill the Agency's dual role of maintaining conservation stewardship responsibilities and the promotion of optimum usage of resources. This dual role results in a natural tension between scientists and constituents. The scientific results are viewed as a constraint on allowable catch and allocation decisions. Indeed, in the short term they are. This has prompted several external reviews over the years; for example, the NRC Review of Northeast Fishery Stock Assessments (NRC 1998b; Appendix 16).
Criticism of the science occurs for a variety of reasons. At times, valid concerns are raised. However, much criticism stems from other causes, such as lack of understanding of science's role in the decision process by constituents, lack of understanding of scientific methods and issues by constituents, poor communication of these methods and issues by the scientists, poor communication of the issues and methods by the managers to constituents, limited data resources to support the science, limited resources to support communication efforts, deliberate use of criticism of the science as a strategy or negotiation tactic to alter or hinder implementation of unfavorable management decisions, and the perception that scientists have a limited and unrealistic view of the status of fisheries resources.
Credibility with fishing constituents often is related to the data supporting the assessments: constituents argue that the data are of poor quality, that they are unrepresentative of their direct observations, and that the assessment scientists are not cognizant of these features. Hence, the constituents view the scientific opinions as unrealistic. This is a source of criticism against which scientists of NMFS must continually be on guard. New scientific perspectives on old problems must continually be integrated into the assessments. Mechanisms to do this are through regular, periodic peer-review and scientific program review processes which are discussed in Section III F. These reviews should make clear to managers and constituents, alike, appropriate interpretations of existing data for the existing management questions being asked, limitations of those data, and relative benefits to the decisions with improvement of the data.
Communication effects on credibility are a difficult problem. NMFS scientists are presently being asked to communicate and prepare documents in three arenas: to prepare documents with scientific details that will communicate to scientists and withstand scientific challenges; to prepare documents
22
that will communicate to managers/politicians/lawyers to withstand legal challenges; and to prepare documents to communicate the nature of the biological and fisheries issues to lay constituents. Of these three arenas, NMFS scientists are required to put a disproportionate amount of effort into the second category. NMFS scientists, in general, probably get the most career fulfillment from the first and it is in that arena where NMFS scientist's activities overlap with academic scientists. The third category (preparing documents for lay constituencies) is admittedly lacking. Communication with constituencies is mostly spoken and often within the final decision-making process. That atmosphere does not promote dialog. But beyond that, the three activities require resources: people (or proportions of people's time) and travel. In addition, those individuals who actually conduct the science are not likely to have equally good skills in communication in all three arenas. Each arena poses different challenges, and also offers different degrees of career fulfillment. Reallocation of a scientist's time toward one activity will often be at the expense of other required activities of the individual.
Another related credibility issue is that within NOAA. Unfortunately, credibility of NMFS science within NOAA is often filtered through constituent interactions rather than through NMFS scientific interactions. Also, since much of the assessment work results in regulations and limitations on the public users of fishery resources, it is hard to develop "good news" communications.
Perhaps the best solution to the perceived credibility and communication problems is a recognition that under existing management frameworks criticism will continue to exist; that communication to the lay public (including within NOAA) takes specialized skills and resources; that NMFS should develop new resources to achieve communication goals; and that these new resources should not be achieved at the detriment of the data and assessment bases of the scientific advice.
E. Implications of the Precautionary Approach
A major goal of fish stock assessments is to provide scientific advice on sustainable harvest strategies. In reality, this is a dual goal involving determination of the harvest strategy that will, on one hand, approach the maximum long-term average yield, yet, on the other hand, have a low probability of overfishing and causing depletion of the resource or other harm to the ecosystem. Maximizing long-term average yield while at the same time minimizing the risk of overfishing is impossible without a high level of knowledge about the abundance and productivity of the resource, especially when one considers the paucity of knowledge regarding the impact of climate, interactions with other species, and habitat changes (Figure 1).
23
Figure 1. Initial levels of investment in information (e.g. catch monitoring) establish a baseline; intermediate levels of information (e.g. annual resource surveys) produce substantial gains; final levels of investment (e.g. ecosystem research) may have diminishing returns with respect to short-term recommendations, but can substantially affect long-term recommendations. Our goal is to obtain at least an intermediate level of information for the primary commercially or recreationally-exploited species.
The precautionary approach is concerned with maintaining a balance between high yields and low risks of depletion in the face of uncertainty that is often substantial. In the past, it has been common to treat uncertainty as a reason to forestall implementation of restrictive management measures. Although the precautionary approach has many facets, one of the more important and universal features is that uncertainty is perceived as a reason to exercise caution by, for example, scaling back the recommended harvest rate in relation to the level of uncertainty in estimates of stock abundance and productivity (Figure 2) and to develop other methods, such as marine reserves, to contribute to safeguarding these resources. Greater uncertainty should result in greater caution in fishing activities.
24
Attempts to deal with uncertainty in the context of the precautionary approach have enlivened the development of limit reference points, target reference points, harvest control rules, and management procedures simulation models. Harvest control rules specify the management action (e.g. a specific fishing mortality) to be implemented depending on the status of the stock (e.g. the estimated biomass), and generally include target reference points (to be achieved on average) and limit reference points (to be avoided with high probability). The greater the degree of uncertainty in the assessment of stock status or in the ability to effectively implement management actions, the greater the difference between targets and limits should be. Models that include the entire system of observation-assessment-management with the attendant suite of errors (commonly called management procedures simulation models) deal with uncertainty in a more comprehensive way and enable evaluation of the robustness of alternative management strategies. A previous NMFS Working Group developed technical guidance on these and related topics as they relate to the development of definitions of overfishing (Restrepo et al. 1998; Appendix 17).
The need to develop precautionary approaches, target and limit reference points, harvest control rules, management procedures simulation models, and related methods has added considerably to the duties of stock assessment scientists and, in many cases, has strained the limits of available data. In order to implement a precautionary approach, fishery scientists must deliver to fishery managers a description of this uncertainty and an assessment of the risks created by overfishing and other impacts on the stock. It is not adequate to simply report the best estimate and describe its uncertainty. The analysis must be broadened to include evaluation of the possible consequences of alternative harvest strategies given the amount of uncertainty about current and projected stock status.
F. Implications of the Need to Incorporate Ecosystem Considerations
Trends of increasing intensity and specialization of fisheries, and needs to more fully integrate fisheries and protected species management, argue for greater attention to ecosystem effects not addressed by traditional overfishing concepts and stock assessment models supporting them. Recent legal challenges to NMFS resource management decisions relative to the National Environmental Protection Act (NEPA), the Endangered Species Act (ESA) and the MSFCMA illustrate the growing need for NMFS to develop a comprehensive understanding of the effects of fishing on marine food webs and the effects of fishing on marine habitats. In addition, there is currently considerable interest from the public, stakeholders and the scientific community to move towards more comprehensive ecosystem-based fisheries stock assessments and management. Several thorough studies on this topic have recently been completed, including an NRC report entitled "Sustaining Marine Fisheries" that focused on sustainability in an ecosystem context (NRC 1999; Appendix 18).
These issues necessitate the development of a new era in resource monitoring that requires collection of information on seasonal movements of fish, the response of fish to oceanographic factors, and trophic interactions. With added information regarding the functional relationships governing the spatial and temporal distribution of fish, ecosystem considerations could be incorporated into stock assessments by: (1) modifying existing single-species overfishing paradigms and stock assessment approaches to account for ecosystem attributes, (2) coupling fully mechanistic "bottom-up" models that incorporate the influence of trophic interactions and oceanographic factors on recruitment success to stage-based assessment models, and (3) developing aggregate system models to extract principal properties of marine ecosystems that can be utilized to develop single species harvest objectives. While NMFS is actively pursuing research in support of all three types of models, in the short term modification of existing single species models will be the most useful tool for providing management advice to our constituents. These models allow assessment scientists to modify concepts of growth and recruitment overfishing, maximum sustainable and economic yields and protected species management to account for ecosystem attributes such as technological and biological interactions among assemblages, restricted predator-prey communities, or shifts in carrying capacity due to decadal scale variability in ocean conditions.
As our understanding of the mechanisms controlling the productivity of marine communities improves, NMFS must strive to develop fishing strategies that ensure sustained community production.
25
Ecosystem overfishing reference points, based on metrics of biodiversity, sustainability, and trophic considerations, have been proposed but not widely applied and typically fail to address the role of natural disturbance on shifts in community structure. While existing single species overfishing concepts and modifications have the advantage of a strong theoretical basis for evaluating choices between alternative management strategies (including risk assessment) and much practical use, they do not yet provide guidance on issues such as serial depletion of economically-valuable stocks, changes in bio-diversity, habitat-modifying effects of fishing methods, or some trophic impacts of fishing practices such as "fishing down the food chain." On the other hand, measures that prevent overfishing of single species partially serve the objectives of multispecies management by ensuring that no stock is intentionally overfished. With adequate observer coverage, the bycatch can be closely monitored and target fisheries can be closed to protect bycatch species if necessary. The Ecosystem Principles Advisory Panel report on ecosystem-based fisheries management (Appendix 19) calls for the development of Fisheries Ecosystem Plans. A long-term goal would be the development of a theoretical basis for defining ecosystem overfishing. A short term activity in support of these goals would be to improve our documentation and monitoring of metrics of ecosystems such as diversity indices, slopes of size or diversity spectra, or average trophic level. The performance of these indices as predictors or heuristic reference points for management remains untested, but could be evaluated retrospectively for candidate situations of obvious ecosystem overfishing.
Regardless of approach, there appears to be a need to account for ecosystem implications in a more formal way when looking at the entirety of fishery management measures applied to systems. There is, then, a need to develop and implement more widely quantitative models to assist managers in accounting for ecosystem considerations explicitly when choosing between alternative management strategies. Nevertheless, resource management will, in all likelihood, always be driven by the real or perceived importance to society or the ecosystem of a subset of exploited and protected species. Rather than substituting for existing overfishing and assessment modeling concepts, ecosystem considerations will increasingly be used to evaluate and modify primary management guidance applied to the important species. In order for ecosystem overfishing definitions to assume a greater role in resource management, quantifiable, predictive, and unambiguous assessments of ecosystem states and fluxes must be developed and evaluated. This implies research focused on processes and interrelationships, complementing-rather than replacing-traditional stock assessment and monitoring activities supporting existing overfishing definitions. In all likelihood, advice resulting from the explicit incorporation of ecosystem effects will even further emphasize the need for conservative management of the fishing capacity of single- and multipurpose fleets, supported by refinements in the use of technical measures such as marine protected areas and gear restrictions.
26
III. Assessment and Management Strategy Evaluation Needs
This section provides background information on requirements for conducting assessments and for evaluating alternative fisheries management strategies. Topics covered include input data, stock assessment models, assessment frequency, adequacy of technology and infrastructure, peer review processes, translation of stock assessment advice into management action, communication of assessment results and analyses of alternative management strategies, and staffing issues. A. Input Data
Calibration of stock assessment models requires three essential categories of data: catch, abundance, and life history characteristics. These data come from fishery-dependent and fishery-independent sources. The role of catch data in stock assessment models is to indicate the magnitude of fishery removals during the time period in which the surveys have measured a change in abundance. Total catch is determined from monitoring by port samplers and observers, and mandatory or voluntary reporting systems. The most reliable indicators of changes in population abundance are fishery-independent resource surveys (NRC 1998a). In some cases, it is possible to conduct tagging studies, depletion experiments, or absolutely calibrated surveys that result in an absolute estimate of stock abundance rather than a relative index which must be tracked over time. Fishery-dependent data (e.g. logbook data) can also be used to develop indices of changes in abundance; however, validation that these fishery-dependent indices are truly proportional to changes in stock size usually requires comparing the fishery-dependent index to a fishery-independent survey index. Life history data (stock structure, growth, reproduction, and natural mortality rates) indicate the geographic limits of the stock and its inherent productivity. Inclusion of life history data in stock assessment models helps assure biologically realistic results which properly separate fishing mortality from natural changes. With incomplete data on catch, abundance, or life history characteristics, the results of assessment models will be less precise because of uncertainty in the assumptions used in place of the missing data.
The need for improving the collection, management and use of fisheries data was recognized in a recent report entitled, "Improving the Collection, Management, and Use of Marine Fisheries Data" (NRC 2000; Appendix 20).
(i) Fishery-dependent data needs
Fishery-dependent data include the landed catch, at-sea discards, biological characteristics (age and size composition, sex ratio, maturity stage) of the catch, fishing effort, and spatial distribution of catch and effort. Accurate stock assessments require that the total removals (landed plus discarded catch) be known for all significant commercial and recreational fishery segments. The primary methods to obtain these total catch data vary regionally and are strongly influenced by the scale of typical fishing operations and by the degree of historical development of federal and state reporting systems. Methods to track large volume landings by trawl vessels at a few locations may be ill-suited to estimating total landings by large numbers of commercial or recreational hook and line fishers individually landing small amounts of fish at many locations. For example, mandatory reporting of landed commercial catch by the west coast states provides a census of total commercial landings. Off Alaska, mandatory observer programs determine total catch for major species. For recreational fisheries, statistical sampling procedures are used to estimate total recreational catch and effort from samples of anglers nationwide. However, throughout the nation there are gaps in coverage for particular fishery segments, concerns about under-reporting of total catch or misreporting of species and the areas in which they were caught, low levels of sampling coverage, and insufficient statistical and database capabilities to ensure timely access to well-audited data.
27
Information on the size and age composition of the catch is needed to accurately estimate the fishing mortality caused by that catch. These data are typically obtained by samplers in the fishing ports and by observers on board fishing vessels. When comparable data are available for each fishery segment, evaluation of the biological impacts of different allocations among the segments is facilitated. Furthermore, size and age data from the fishery contribute information on variability in recruitment.
Collection of commercial and recreational fishery data faces significant logistic hurdles due to the need to implement sound statistical sampling procedures. The potential for bias and inefficiency exists in current procedures, and the NRC review of stock assessment methods recommends that a standardized and formalized data collection protocol be established:
NRC Recommendation #9: "The Committee recommends that a standardized and formalized data collection protocol be established for commercial fisheries data nationwide. The Committee further recommends that a complete review of methods for collection of data from commercial fisheries be conducted by an independent panel of experts."
One step that has been taken towards addressing this recommendation is the recent NMFS Report to Congress on a "Proposed Implementation of a Fishing Vessel Registration and Fisheries Information Management System" (Appendix 8), as required under the 1996 reauthorization of the MSFCMA. The report lays out a plan for implementing a Fisheries Information System (FIS) by integrating and expanding on the current regional fisheries cooperative statistics activities in three major areas: data collection, information management, and institutional arrangements. However, the plan is to integrate existing activities, rather than to overhaul the system completely and develop protocols to be used nationwide. The plan has been submitted to Congress as required, but to date, it has not been funded.
(ii) Fishery-independent data needs
Fishery-independent data include information on the distribution, abundance, and biology of the species being assessed. A suitable fishery-independent survey method must either be calibrated to measure absolute fish abundance, or it must be directly proportional to fish abundance so that relative trends can be tracked. When the time series of a survey is short, there is greater value in calibrating the survey for absolute abundance; however, such estimates are critically dependent on obtaining good estimates of catchability. As the time series gets longer, the trend information becomes more useful.
A common survey approach is to use carefully standardized sampling gear (e.g. trawls, hooks, or pots) to collect hundreds of samples distributed over the expected range of the stock. Such a resource assessment survey provides information on distribution and abundance, and provides specimens for age, growth, genetic stock structure, food habits, maturity, and other biological studies. However, such methods can be difficult to standardize completely because fish behavior and gear performance may vary with habitat and environmental conditions. Other methods are valuable for directly calibrating such surveys, providing information from habitats not accessible to the primary sampling tool, and providing alternative measures of fish abundance. Acoustic methods have been developed to provide calibrated information on distribution and abundance, but must be coupled with other sampling tools to collect biological specimens. Egg and larval methods have been developed to provide measurements of abundance (spawning biomass) that are not susceptible to the same types of sampling problems that may affect trawl surveys. Imaging systems (visual, laser) are an appropriate tool in high relief nearshore habitats and have been useful in understanding the interaction between fish and other sampling tools. Mark-recapture methods, like egg and larval methods, can provide a direct estimate of absolute abundance but must rely on other tools to measure distribution and to collect biological specimens. More generally, a single survey method may not be suitable for the entire age range; for example, a separate survey may be necessary to provide an index of recruitment. In many instances, it is likely that at least two survey methods may need to be deployed in order to provide appropriate input for stock assessments and projections.
28
The NRC (1998a) evaluation of stock assessment methods recommended that each stock assessment contain at least one reliable index of relative stock abundance, preferably from fishery-independent surveys because incompletely calibrated fishery-dependent indices can lead to biased stock assessment results:
NRC Recommendation #2: "At the minimum, at least one reliable abundance index should be available for each stock. Fishery-independent surveys offer the best choice for achieving a reliable index if designed well with respect to location, timing, sampling gear, and other statistical survey design considerations."
Attempts to satisfy this type of recommendation have played a key role in NMFS' research planning for several decades. The most recent document directed specifically at this type of recommendation is the NOAA Fisheries Data Acquisition Plan (NMFS 1998a; Appendix 3), which calls for a combination of purpose-built fishery research vessels and chartered days-at-sea to satisfy immediate fishery-independent data collection needs.
Reliable fishery-independent indices are already available for several key stocks, primarily in the northeastern United States and Alaska which have long time series of research survey data. Such indices will become even more widely available as NMFS and partnering agencies and institutions acquire additional research platforms, including dedicated research vessels. But, even with additional resources for research, some important variables will always be difficult to estimate; for example, natural mortality, which is a key assessment variable singled out for attention by NRC (1998a):
NRC Recommendation #3 (in part): " ...Greater attention should also be devoted to including independent estimates of natural mortality in assessment models."
To obtain reliable independent estimates of natural mortality, the types of fishery-independent research required are likely to involve extensive mark-recapture studies and/or collection and analysis of food habitats data from large numbers of potential predators covering extensive spatial and temporal scales.
B. Input Data: Minimal and Optimal Requirements
The great diversity of data available for the world's fisheries has fostered the development of a wide range of stock assessment modeling methods that can take advantage of these data. As the scope of the data and their quality and quantity improves, several improvements in stock assessment results will accrue. As data become more precise and as the time series of data become longer, the precision of stock assessment results should improve, and there should be greater stability in resulting recommendations on the status and potential yield from the stock. As more types of data become available, it will be possible to test and validate model assumptions and reduce the possibility that model results are biased because of inappropriate assumptions about the data. Appropriate data are also needed to reliably forecast likely future conditions of a stock, in addition to obtaining a retrospective view of a stock's history. It has sometimes been argued in the scientific literature that well-calibrated fishery catch per unit effort (CPUE) data is an adequate measure of relative stock abundance, and that useful stock assessments can be based solely on simple models tuned to such data. While this may be true for some fisheries, there are many case studies demonstrating that the assumption that commercial CPUE is directly proportional to resource abundance may lead to large biases in results, and that such bias is often detected too late and only when additional sources of data are obtained and included in the assessment.
In each of three major categories of information required as input to stock assessments; viz, catch, abundance, and life history, the Task Force defined 5-6 progressively more complete levels of data availability (Figure 3). Such a progression will fit no fishery perfectly, but gives a general guide to the progression of information improvement that should be the goal of comprehensive stock monitoring programs. A balanced development in these three categories of input data is also beneficial; generally,
29
a stock assessment model will not be able to fully utilize detailed catch data if there is an inadequate survey index and lack of key biological data.
Levels of catch data
0 — No catch data.1 — Landed catch provides a minimum estimate of fishery removals and is typically obtained from
mandatory landing receipts. In some cases, particularly recreational fisheries, a statistical sampling program is used to expand estimates of sampled catch up to the total angling population.
2 — Catch size composition provides a measure of the sizes of fish being impacted by the fishery, and when tracked over time can provide an index of recruitment to the fishery and total mortality rates.
3 — Spatial data on catch from logbooks can provide information on range extensions and contractions, and other changes in stock or fleet distribution.
4 — Catch age composition requires the development of age determination techniques and an investment in the collection and processing of appropriate samples. The result is much greater stock assessment accuracy than can be obtained with size composition data alone.
5 — Accurate and complete data on total removals (including landed catch, discards, bycatch in other fisheries, and cryptic mortality induced by fishing gear contact) will contribute to accurate stock assessment results. An at-sea observer program can monitor total removals, cross-check logbook data, and collect site-specific biological samples. In many fisheries, the relative merits of observer programs for collecting data on total removals and/or age composition data may warrant consideration before or instead of investing in a fishery logbook program.
Levels of abundance data
0 — No abundance data.1 — Relative abundance index from fishery catch per unit effort or an imprecise, infrequent
survey. Another Level 1 situation would be a single survey from which an estimate of absolute abundance has been made. At this low level of information there will only be a limited ability to track changes in stock abundance because of uncertainties in the calibration of the index, or a high level of noise in the data relative to the magnitude of the expected changes in stock abundance.
2 — Precise, frequent surveys with age composition will provide more accurate tracking of changes in stock abundance and the associated age composition data will enable better estimation of historical and current levels of recruitment.
3 — Research surveys with known or estimated catchability, acoustic surveys with known or estimated target strengths, and statistically-designed tagging studies can provide estimates of absolute abundance. This is especially valuable when the time series of the survey is so short that no trend is detectable.
4 — Habitat-specific surveys refine the concept of stratified random surveys so that survey results are more closely associated with particular habitats. The result is improved knowledge of the relationship between fish assemblages and habitat features. In addition, these surveys use alternative methodologies to extend survey coverage into all relevant habitats.
Levels of life history data
0 — No life history data.1 — The size composition of harvested fish provides a simple index of a stock's growth potential
and vulnerability to overharvesting.2 — Basic demographic parameters such as age, growth, and maturity rates provide information on
productivity and natural mortality.
30
3 — Seasonal and spatial patterns of mixing, migration, and variability in life history characteristics, especially growth and maturity, provides improved understanding of how a population responds to its environment.
4 — Food habits information defines the predator-prey and competitive relationships within the fish community, thus providing a first step towards direct estimation of natural mortality rates and ecologically-based harvest recommendations.
Figure 3. Factors used to classify stocks in terms of input data and assessment status.
The availability of data at these various levels is tabulated in Appendix 1 for each of the 904 stocks included in the NMFS (1999a) Report to Congress on the Status of Fisheries of the United States. The data are also summarized by individual and combined Science Centers in Table 1 and Figure 4 and discussed in Section III D.
Table 1. Numbers of stocks with different levels of input data (catch, abundance and life history parameters), assessment methodology and assessment frequency for the 904 stocks listed in the NMFS (1999a) Report to Congress on the Status of Fisheries of the United States. Zero indicates no information; otherwise, the higher the level, the better the information. See Figure 3 and the text for a description of the levels, Figure 4 for graphical comparisons, and Appendix 1 for the stock-by-stock information.
ALL REGIONS COMBINEDLEVELS Catch Abundance Life History Assessment
Catch0 = none1 = landed catch2 = catch size composition3 = spatial patterns (logbooks)4 = catch age composition5 = total catch by sector (observers)
Abundance0 = none1 = fishery CPUE or imprecise survey with size comp.2 = precise, frequent survey with age composition3 = survey with estimates of q4 = habitat-specific survey
Life history0 = none1 = size2 = basic demographic parameters3 = seasonal or spatial info. (mixing, migration)4 = food habits data
Assessment level0 = none1 = index only (commercial or research CPUE)2 = simple life history equilibrium models3 = aggregated production models4 = size/age/stage structured models5 = add ecosystem (multispecies, environment),
spatial, and seasonal analyses
Frequency0 = never1 = infrequent2 = frequent or recent (2-3 years)3 = annual or more
Figure 4. Number of stocks with different levels of input data (catch, abundance and life history parameters), assessment methodology, and assessment frequency for the 904 species listed in the NMFS (1999a) Report to Congress on the Status of Fisheries of the United States. See Figure 3 and the text for a description of the levels, Table 1 for tabulated summaries, and Appendix 1 for the stock-by-stock information.
C. Stock Assessment Models The complexity of assessment methods used for a given stock generally reflects the availability of data and the value or importance of the fishery. To indicate the current levels of analysis of the status of various stocks, two columns were added to Appendix 1, one giving a numerical code that roughly indicates the level of modeling effort/ complexity/ sophistication applied to each species in Appendix 1 and the other giving the frequency with which stock assessments are conducted. To be classified as an assessment, an analysis must produce some measure of stock or fishery status relative to a benchmark such as a fishing target or an overfishing limit. The assessment level codes have the following meanings: 0 — Although some data may have been collected on this species, these data have not been
examined beyond simple time series plots or tabulations of catch.1 — Either:
a) a time series of a (potentially-imprecise) abundance index calculated as raw or standardized CPUE in commercial, recreational, or survey vessel data, orb) a onetime estimation of absolute abundance made on the basis of tagging results, a depletion study, or some form of calibrated survey.
2 — Simple equilibrium models applied to life history information; for example, yield per recruit or spawner per recruit functions based on mortality, growth, and maturity schedules; catch curve analysis; survival analysis; or length-based cohort analysis.
3 — Equilibrium and non-equilibrium production models aggregated both spatially and over age and size; for example, the Schaefer model and the Pella-Tomlinson model.
4 — Size, stage, or age structured models such as cohort analysis and untuned and tuned VPA analyses, age-structured production models, CAGEAN, stock synthesis, size or age-structured Bayesian models, modified DeLury methods, and size or age-based mark-recapture models.
5 — Assessment models incorporating ecosystem considerations and spatial and seasonal analyses in addition to Levels 3 or 4. Ecosystem considerations include one or more of the following:a) one or more time-varying parameters, either estimated as constrained series, or driven by environmental variables,
b) multiple target species as state variables in the model, orc) living components of the ecosystem other than the target species included as state variables in the model.
According to the above scheme, an "assessment" is a data analysis at Level 1 or greater, provided that analysis allows statements about relative stock or fishery status to be made. The frequency column in Appendix 1 give codes defined as follows:
0 — Never: an assessment has never been conducted.1 — Infrequent: the most recent assessment was conducted more than three years ago.2 — Frequent or recent: the most recent assessment was conducted within the last three years but is
not conducted annually.3 — Annual or more: assessments are conducted at least annually.
The assessment levels listed above were designed to represent a series of increasing analytical effort and sophistication. Lower levels are amenable to use of standardized software, but upper levels, particularly Level 5, probably require that models be tailored to deal with the particularities of each stock assessment or group of related assessments. Such newly crafted models will most likely require additional types of input data concerning oceanographic conditions, and/or biological features of various components of the ecosystem, and/or operational details of the fishing gear. Thus the progression of assessment levels implies a progression of increasing data needs. In addition, NRC (1998a) recommends that, where possible, more than one assessment model should be applied for a given data-set or fish stock:
34
NRC Recommendation #3 (in part): "Because there are often problems with the data used in assessments, a variety of different assessment models should be applied to the same data; new methods may have to be developed to evaluate the results of such procedures. The different views provided by different models should improve the quality of assessment results..."
Another NRC (1998a) recommendation is to develop new techniques for stock assessment:
NRC Recommendation #7: "NMFS and other bodies responsible for fisheries management should support the development of new techniques for stock assessment that are robust to incomplete, ambiguous, and variable data and to the effects of environmental fluctuations in fisheries."
Development of new computational and analytical techniques is most likely to take place at the upper end of the list of assessment levels where it will likely be necessary to craft a wide variety of new assessment models. However, because these new kinds of models may require new kinds of data, there may also be a need to develop new sampling or survey techniques, or to perform experiments. Models that can incorporate the effects of environmental fluctuations in fisheries are already under active development, but they suffer from a lack of understanding of the effects of major environmental regime shifts on individual species and species interactions. Thus, their predictability is currently limited. On the other hand, pursuit of this line of research is likely to be more fruitful than attempts to develop models that are robust to incomplete or ambiguous data - the extent to which models can compensate for data deficiencies is extremely limited.
NRC (1998a) also recommended the development of more realistic assessments of uncertainty:
NRC Recommendation #4: "The Committee recommends that fish stock assessments include realistic measures of the uncertainty in the output variables whenever feasible. Although a simple model can be a useful management tool, more complex models are needed to better quantify all the unknown aspects of the system and to address the long-term consequences of specific decision rules adequately. The implementation of this recommendation could follow the methods discussed in Chapter 3 [of NRC 1998a]."
While expression of uncertainty is not included in the above definitions of assessment levels, one would expect that increasing sophistication of assessment models would go hand in hand with increasing sophistication in calculating uncertainty, and one would hope that more sophisticated uncertainty assessments would also be more realistic. To the extent that more realistic uncertainty assessments incorporate more components of variation, there is the possibility that they would show wider confidence bounds. Thus the higher level assessments are not at all guaranteed to yield tighter uncertainty distributions and consequent high levels of allowable catch as promised elsewhere. Therefore, it is important that lower level assessments be accompanied by uncertainty calculations that are sophisticated and comprehensive enough to make them as realistic as they are for higher level assessments.
D. Inventory of the Status of Stock Assessments: Adequacy of Input Data, Assessment Level, and Frequency of Assessments
The status of input data and assessment analyses for the 904 stocks listed in the 1999 Report to Congress on the Status of Fisheries of the United States (NMFS 1999a) is tabulated in Appendix 1 and summarized in Table 1 and Figure 4. The first point to note is that for most stocks, there is at least basic information on landed catch and the size frequency of the catch. However, for more than 40% of the stocks, there is no fishery-independent or fishery-dependent index of abundance, which makes it extremely difficult to conduct a meaningful assessment. Other factors, such as the need to prioritize the stocks to be assessed, results in a total of about 60% of the stocks (545 stocks) lacking assessments sufficient to evaluate stock status relative to overfishing. Although there are relatively few stocks at the highest levels of each of the input data categories, a total of 119 stocks are routinely assessed at Level 4 or higher. Detailed examination of the information contained in Appendix 1 shows that most of NMFS' data collection and assessment resources have been directed towards those species that
35
dominate in the catch or have previously been deemed to be overfished. With a few exceptions, all of the high-valued, high-volume, or high-profile species are routinely assessed, while most of the stocks with few input data and analysis are bycatch species that contribute little or nothing to total landings. In other words, they are usually relatively unimportant from an economic perspective. Their importance from an ecological perspective and their biological status with respect to risk of reproductive failure is generally unknown.
E. Adequacy of Technology and Infrastructure
In some respects, the job expected of stock assessment scientists is impossible: to estimate the numbers and biomass of each harvested species in the ocean even though they cannot be seen; to determine demographic parameters such as growth and mortality even though such are affected by unobservable and complex interactions between species and with the environment; and to forecast catches and population responses ahead 1-10 or more years even though incoming recruitment is known to be highly variable and affected by environmental events that may not yet have occurred. The difficulty of these tasks necessitates high-technology solutions. Improved technologies are needed to sample, survey, or experiment with species of interest in situ, in order to decrease sampling error, increase sampling intensity, or increase the area or number of species covered. Such technologies, many of which are actively being developed at present (Appendix 12), include development of specialized sampling nets and other methods of direct sampling, multifrequency acoustics, multi-beam acoustics, LIDAR, laser line scan systems, remotely-operated vehicles equipped with underwater cameras, and electronic acoustic or satellite tags.
Improvements in fishery-dependent data sampling are also required to reduce the reporting burden on fishers, reduce reporting errors and mistranslation of information, and increase the timeliness of availability of such information. Vessel monitoring systems are already in use by several fishing fleets, but these are mainly used to record and monitor vessel location. Several prototype electronic logbook systems have been developed and tested and, if these can become part of the standard operating procedures of all major fisheries, they will have tremendous benefit to fishers, scientists and managers alike. Tools for remote monitoring of fishing behavior and catch quantity and composition are under development but complex problems remain to be solved.
The availability of hardware and software for processing the complex and voluminous data collected by some sampling tools is often a limiting factor in the implementation of innovative assessment methodologies. Lack of adequate computing power may also be an obstacle in the stock assessment and stock projection processes, particularly when realistic representations of uncertainty are attempted. For example, if uncertainties in assessment inputs are modeled such that probability distributions of current status are produced rather than point estimates, and then future stock or fishery status is projected from these distributions incorporating uncertainty in future events as well, the number of iterations required can quickly mount up and bog down existing computer systems. Thus, proposals for improving stock assessments need to be linked to advanced technology initiatives and information technology (IT) planning. In fact, it is now a requirement that IT staff be included in programmatic planning activities and the budget formulation process.
The final infrastructure-related concern voiced by the Task Force was the availability of space to house the additional staff required to improve stock assessments. Office space is already at a premium in most NMFS facilities. Any plan to increase on-site staff will also need to address this issue.
F. Peer Review of Assessments
Stock assessments conducted by NMFS are rarely, if ever, the product of a single individual. Peer review is an integral part of the process conducted by fisheries scientists from within and outside of NMFS. The NRC (1998a) recommended that:
NRC Recommendation #8: "NMFS conduct (at reasonable intervals) in-depth, independent peer review of its fishery management methods to include (1) the survey sampling methods used in the
36
collection of fishery and fishery-independent data, (2) stock assessment procedures, and (3) management and risk assessment strategies."
With regards to the three classes of peer reviews listed by the NRC, NMFS routinely conducts peer reviews of stock assessments and stock assessment procedures, and occasionally conducts reviews of survey sampling methods, but rarely conducts reviews of management strategies. One of the problems that arises is in the interpretation of the word "independent." To some, it means non-government, or at least non-NMFS. A more liberal interpretation is simply a review conducted by experts who have not been directly involved in the work being evaluated. NMFS Science Centers frequently recruit scientists from other Science Centers, regional offices, or headquarters to participate in peer reviews. It is also common to invite state fisheries scientists, academics and non U.S. nationals to serve as reviewers, particularly now that the Center for Independent Experts (CIE) has been formed. The CIE (Appendix 5) provides a mechanism for accessing a worldwide pool of highly-qualified fisheries scientists, statisticians, and other experts.
All five Science Centers have systems in place for the peer review of stock assessments and sampling methods. These are described briefly below.
Northeast Fisheries Science Center
The current peer review forum for stock assessments conducted in the Northeast dates back to 1985. At that time a region-wide process was initiated to subject selected stock assessments to a two-level peer review. The goals of this process are to assure that scientists reviewing the assessments are not those responsible for the conduct of the work, and that experts independent of the process are included. Although the details of the structure have changed, the Stock Assessment Workshop (SAW) has been, and continues to be, the main vehicle for critical evaluation of stock assessment results and the crafting of management advice in the region.
The SAW consists of two parts: two week-long meetings of the Stock Assessment Review Committee (SARC), usually conducted in June and November each year, and formal SAW meetings with the New England and Mid-Atlantic Fishery Management Councils where results of the SARC are presented and feedback is solicited. Overseeing the process is the SAW Steering Committee, consisting of the Northeast Regional Administrator, the Science and Research Director of the Northeast Fisheries Science Center, and the executive directors of the New England and Mid-Atlantic FMCs and the Atlantic States Marine Fisheries Commission (ASMFC). The steering committee sets the schedule of which stock assessments will be reviewed at upcoming SARC meetings, and determines the specific "terms of reference" establishing assessment information requirements of managers. The SARC committee usually consists of about 10 members selected from the staffs of the Center, ASMFC (member states), the Councils, and designated outside experts from academia, state agencies, other NMFS Centers and foreign (usually Canadian) research institutes.
Stock assessments reviewed at the SARC are conducted by standing working groups (WGs) responsible for the various species: Northern Demersal WG, Southern Demersal WG, Coastal/Pelagic WG, Invertebrate WG. Stock assessment methods are addressed by the standing Methods WG. Currently the chairs of the WGs are NEFSC scientists, but membership consists of state and academic scientists as well. Some assessments are contributed to the SARC directly by ASMFC assessment committees. The chair of the SARC meetings has, in recent years, been selected by the Center for Independent Experts (CIE; Appendix 5), and has included individuals from Canada and Scotland in the past two years.
In addition to the SARC/SAW process, which primarily addresses assessments of state and national importance, stock assessments of transboundary (international) importance are peer reviewed in additional fora, including the TRAC (Transboundary Resource Assessment Committee), a joint U.S.-Canada committee responsible for cod, haddock and yellowtail flounder on Georges Bank, NAFO (the Northwest Atlantic Fisheries Organization), which is responsible for Illex squid and various other stocks, and NASCO (the North Atlantic Salmon Conservation Organization), which receives scientific
37
advice from ICES (the International Council for the Exploration of the Sea) North Atlantic Salmon WG.
Southeast Fisheries Science Center
As the SEFSC provides quantitative stock assessment advice to three Fishery Management Councils plus the NMFS Atlantic Highly Migratory Species Management Division, there are a number of peer-review processes that are undertaken. Most typically, SEFSC assessments are conducted by a team of Center scientists. Assessment documents are prepared and distributed to Council review panel members in advance of review meetings. The Councils' stock assessment review panels, which are typically comprised of regional experts who have not been involved in the work being evaluated, comment on the adequacy of the assessment and provide management advice to each Council. In the case of many Atlantic HMS fisheries, assessments are conducted in an international assessment working group setting (through ICCAT), with subsequent additional peer review conducted by ICCAT's Standing Committee on Research and Statistics. Within ICCAT, it is not unusual for the U.S. scientific delegation to be comprised of scientific representatives of a wide array of interest groups. It is also common for the U.S. scientific delegation to be comprised of non-U.S. nationals. For other HMS species (e.g. coastal sharks), assessments are carried out in a workshop format in which state fisheries scientists, academics and non-U.S. nationals participate in the assessment. Further review of any of these assessments is also undertaken through the Center for Independent Experts (CIE; Appendix 5), if the assessment results appear to raise controversy.
Southwest Fisheries Science Center
The Southwest Fisheries Science Center provides peer review for all its stock assessments and uses a variety of mechanisms to do so. The choice of mechanism is often based on the customary approach for the forum receiving the assessment. For assessments produced by the SWFSC for the Pacific Fishery Management Council (PFMC) a Stock Assessment Review Panel (STAR Panel) is formed with members chosen from the Council's SSC and other nominated non-NMFS individuals to review and verify the assessment. For assessments produced by the SWFSC for the Western Pacific Fishery Management Council (WPFMC), peer review is accomplished using the Center for Independent Experts (CIE; Appendix 5), currently coordinated through the University of Miami, or other designated panels. Protected resource stock assessments are peer reviewed by panels of external reviewers constituted by external organizations such as the Inter-American tropical Tuna Commission (IATTC), or the Marine Mammal Commission, or the SWFSC. For SWFSC assessments presented to international scientific bodies such as the Interim Scientific Committee for Tunas and Tuna-like Species in the North Pacific Ocean (ISC) or the Standing Committee on Tuna and Billfish (SCTB) of the Secretariat of the Pacific Community (SPC), either as finished assessments or as NMFS input for collaborative assessments, the receiving forum and its scientists provide the peer review.
Northwest Fisheries Science Center
The stock assessment review (STAR) process for groundfish assessments off the U.S. west coast has been developed as a shared responsibility of the National Marine Fisheries Service and the Pacific Fishery Management Council. The STAR process helps make groundfish stock assessments the "best available" scientific information and facilitates use of the information by the Council. The process operates under the direction of a NMFS Stock Assessment Coordinator and reports primarily through the Council's Scientific and Statistical Committee (SSC). The process has a detailed calendar, explicit responsibilities for all participants, and specified outcomes and reports. STAR panels meet in a public setting in which all interested parties are legitimate meeting participants. This increases understanding and acceptance of groundfish stock assessment and review work by all members of the Council family.
The STAR Panel's terms of reference concern technical aspects of stock assessment work. The Panel is expected to identify scenarios that are unlikely or have a flawed technical basis, while reporting information, discussions, and disagreements which reflect uncertainty in the assessment. The Panel operates by consensus and strives for a risk neutral approach in its reports and deliberations.
38
STAR Panels normally meet for one week to review two assessments. Typically 2-3 Panels meet each year, and Panels reviewing transboundary assessments are informally coordinated with the Canadian stock assessment review process. Each Panel normally includes a chair, at least one "external" member (i.e. outside the Council family and not involved in management or assessment of West Coast groundfish), and one SSC member. In addition to Panel members, STAR meetings will include representatives from Council technical and advisory committees with responsibilities laid out in their terms of reference. The STAR's SSC representative attends Council meetings where stock assessments are discussed to explain the reviews and provide other technical information and advice.
Alaska Fisheries Science Center
The AFSC provides stock assessment advice to the NPFMC on an annual basis. Stock assessments are reviewed internally for consistency and accuracy. External technical reviews are conducted by the NPFMC BSAI and GOA Plan Teams and the Scientific and Statistical Committee (SSC). The Plan Teams and SSC are composed of scientists who represent federal, state and academic institutions. The Plan Teams provides a detailed technical review of the assessment methods and analytical approaches. The SSC provides a similar level of technical advice and is responsible for establishing the Allowable Biological Catch (ABC) and Overfishing Level (OFL) for FMP species. Preliminary assessments are prepared for the September Council meeting and final assessment documents are completed in November for Council action in December. Preliminary assessment documents are required when assessment scientists introduce a new analytical method, or utilize a new data source in their model. The preliminary SAFE provides an opportunity for the analyst to incorporate comments and suggestions from the Plan Teams and Scientific and Statistical Committee in their final SAFE chapter. In November, the Plan Team meets to review the final SAFE documents. The Plan Teams prepare reports documenting their recommendations for ABCs and OFLs and they compile the SAFE document for distribution at the December Council meeting.
AFSC schedules detailed reviews of selected assessments on an annual or semiannual basis. Stock assessment experts are invited to conduct a thorough review of the methodology used. This review process provides time for the assessment expert(s) to work one on one with the assessment scientists. Reports derived from this process are presented to the NPFMC advisory bodies. This assessment review is similar in scope to the reviews now provided by the Center for Independent Experts (Appendix 5).
G. Translation of Stock Assessment Advice into Management Action
The translation of stock assessment advice to management action is where science and management interface and is an important but often controversial activity. Conflicts frequently arise over the "proper" roles of scientists and managers. At one extreme, it is argued that there should be greater separation of the science and the management, in order to ensure that the science is unbiased. Scientists would then provide information on stock status in a form such as graphs giving the probability that current or projected fishing mortalities will be above or below some benchmark (specified previously by the managers), and managers would decide what action to take on the basis of this information. At the other extreme, it is argued that there should be greater co-mingling of science and management with most if not all science being specifically focused on management-oriented questions, and the priorities for science being driven by management priorities. In reality, scientists provide information on stock status but, because they have the data, the quantitative skills, and the infrastructure, are subsequently asked to evaluate the likely outcomes of alternative management actions with respect to their effect on future stock status. Stock assessment scientists are frequently members of Plan Development Teams and related groups that evaluate the effectiveness of alternative management tactics and strategies in meeting management goals. Assessment scientists often also evaluate and provide advice on management benchmarks.
Many of the problems addressed by Plan Development Teams and related groups are tactical; i.e. short-term measures to solve the immediate problems of reducing fishing mortality and/or rebuilding
39
stock biomass. Tactics that are frequently evaluated include size limits, gear restrictions, closed areas, closed seasons, trip limits, total allowable catches, limited entry, and restricted days at sea. When fishing mortality and fishing capacity are under control, and the stock biomass is near long-term sustainable levels, it is appropriate to conduct strategic (long-term) analyses of "optimum" management strategies. Such strategies might include constant fishing mortality strategies at various levels of fishing mortality, constant escapement strategies, constant catch strategies, alternative strategies that have variable effects on the bycatch of protected species or nontarget species or nontarget sizes, pros and cons of permanent closed areas, and the social and economic implications of alternative fleet configurations. These types of analyses tend to be conducted only sporadically—typically at the beginning of development of a new management plan, during major overhaul of a plan, or as a research topic undertaken by one or more internal or external scientists on their own initiative.
The process of translating assessment advice to management action is also where conflicts arise over the "proper" amount of influence by, or interaction with, stakeholders such as the commercial, recreational and environmental sectors. The process set up by the MSFCMA theoretically involves public participation at every step. In general, however, there is relatively little public involvement in the assessment process itself, possibly because relatively few people have the training or interest in the technical aspects of the quantitative analyses conducted. There tends to be considerably greater involvement at the stage of formulating management actions to improve stock or fishery status. This mainly takes the form of attendance at Fishery Management Council meetings and public hearings and, increasingly, by challenging particular management actions or the stock assessment itself in courts of law. The problems addressed in these forums also tend to be mainly short-term and tactical.
It is likely that conflicts could be lessened considerably if more resources were to be devoted to improving this interface between science and management. First, more attention should be paid to analyzing the long-term implications of alternative management strategies, and a greater array of alternatives should be examined. The NRC (1998a) study recommended evaluation of a wide array of alternative management strategies in terms of their robustness to assessment and other errors.
NRC Recommendation #5: "Precautionary management procedures should include management tools specific to the species managed, such as threshold biomass levels, size limits, gear restrictions, and area closures (for sedentary species)"
Second, simulation models should be constructed to allow managers and other stakeholders to evaluate the implications of alternative actions and strategies themselves. Such models have been in existence for at least 25 years, but it takes considerable time to program them and to construct a user-friendly interface, particularly if a wide array of management alternatives is incorporated. In addition, they may need to be reprogrammed each time a new stock assessment is conducted. Third, models for analyzing assessment methods and harvesting strategies simultaneously, called management procedures simulation models, should be constructed for each major stock or fishery. The structure of management procedures simulation models varies but they generally include an operating model that provides a simulation of a "true" population, a procedure for sampling the true population, an assessment model that uses the sampled data to produce a "perceived" population, a management model that implements specific harvest rules, and performance statistics and feedback associated with each of these components. This is essentially the approach recommended by NRC (1998a).
NRC Recommendation #6: "Assessment methods and harvesting strategies have to be evaluated simultaneously to determine their ability to achieve management goals. Ideally, this involves implementing them both in simulations of future stock trajectories. For complex assessment methods, this may prove to be very computationally intensive, and an alternative is to simulate only the decision rules while making realistic assumptions about the uncertainty of future assessments. Simulation models should be realistic and should encompass a wide range of possible stock responses to management and natural fluctuations consistent with historical experience. The performance of alternative methods and decision rules should be evaluated using several criteria, including the distribution of yield and the probabilities of exceeding management thresholds"
40
This framework is particularly useful for investigating the robustness of various types of biological reference points and management actions, but it is extremely labor and computationally intensive.
H. Communication of Assessment Results and Follow-up Evaluations
Communication, or the perception of a lack of communication, may be one of the greatest threats to the credibility of stock assessment science. Translating complex technical information into formats that a wide array of constituents can identify with can be extremely time consuming and not all assessment scientists are equally adept at it. In addition, it is often not pleasant or rewarding to present assessment results and evaluations of alternative management strategies to a sometimes hostile audience with varying agendas and views about the future of the fishery. Scientists are often accused by one or more sectors (e.g. small-scale commercial fishers, large-scale commercial fisheries, for-hire recreational fishers, private recreational fishers, and environmentalists) of being biased in favor of one or more other sectors.
Another communication problem affecting the credibility of stock assessments is the disassociation between the generation and analysis of fishery-dependent data. A fisher filling out a logbook detailing the catch at a certain time and place may believe that the size of a particular catch was more a function of weather or oceanographic conditions or the way the gear was deployed, rather than actual abundance, but this information will probably not be conveyed to those analyzing the data. In addition, fishers may sometimes have an incentive to under- or over-report catches. And some fishers may provide incomplete data because, like most people, they simply dislike filling out forms. Fishers may distrust stock assessment results because (i) they are aware of the problems inherent in the generation of fishery-dependent data, and (ii) since fishers are adept at finding fish, they may have a more optimistic view of the state of the stock than is implied by the assessment. It is often stated that it is impossible for a scientist to produce a valid assessment unless s/he spends time out on the water observing fish and fleet behavior. However, since individual vessels tend to focus on "hot spots," a few days at sea would only give a very localized view of a fishery or stock. Scientists also need to spend time on statistically-designed fishery-independent surveys to develop a more holistic view of fish distribution and abundance.
Lack of time to communicate with other groups of constituents is not just a problem for scientists. All groups of constituents would probably benefit from participating more in each others activities, but this would take time away from their own specialty. Assessment scientists should, however, devote more time and attention to communications about data deficiencies, to cooperative research with constituents, to communication of assessment results, and to interactive analysis of the implications of alternative management tactics and strategies.
I. Staffing Issues
Education and training
NMFS employs the largest collection of world-renowned fisheries scientists of any agency, university, or other organization worldwide. In general, these scientists have strong backgrounds in both biology and either mathematics or statistics. However, biologists with solid quantitative skills, or quantitative experts with some biological background, are relatively rare and the pool of qualified applicants graduating from appropriate university courses is actually shrinking. This situation was recognized by NRC (1998a) who recommended that:
NRC Recommendation #10: "NMFS and other bodies that conduct stock assessments should ensure a steady supply of well-trained stock assessment scientists to conduct actual assessments and to carry out associated research. NMFS should encourage partnerships among universities, government laboratories, and industry for their mutual benefit. This can be accomplished by exchanging personnel and ideas and by providing funding for continuing education at the graduate, postdoctoral, and professional levels, including elements such as cooperative research projects and specialized courses, workshops, and symposia."
41
In fact, NMFS has numerous cooperative programs with academic institutions (see Data Acquisition Report, NMFS 1998; Appendix 3), provides funding for continuing education of employees, and frequently organizes topical workshops and specialized courses. However, the paucity of qualified applicants for advertised stock assessment scientist positions is evidence that insufficient people are being encouraged to enter this field and receive appropriate training. A relatively new program designed to alleviate this problem has been established jointly by NMFS and NOAA Sea Grant. Each year (beginning in 2000), this program will provide up to three years of funding, mentoring and summer employment for two Ph.D. candidates in quantitative assessment-related areas of research, up to a maximum of six students at any one time (Appendix 6).
In addition, NMFS does not have a comprehensive continuing education program for technical staff, although there have been several attempts to initiate such programs. As shown below, assessment scientists do not feel that they have sufficient opportunity to participate in professional development activities, including training.
Time and motion analysis
As detailed in Sections III G and III H and elsewhere in this report, it is evident that there are many other demands placed on assessment scientists aside from the basic requirement of a background in biology and mathematics. Within a given year, an individual assessment scientist may be expected to: (i) participate in fishery-independent surveys or other field work, (ii) provide input and advice on sampling designs for research surveys and other fishery-independent data collection activities, (iii) spend time on commercial or recreational fishing vessels, (iv) provide input and advice on the development of data collection objectives and protocols for observer programs and other fishery-dependent data collection activities, (v) conduct quality control or other preprocessing of data, (vi) conduct stock assessments, (vii) conduct research into stock assessment methods, (viii) present assessment results to peer review panels and constituent groups, (ix) participate on peer review panels, (x) participate in fishery management plan development or evaluation teams, (xi) defend a stock assessment in a court of law, (xii) research and write scientific papers for primary publication, (xiii) attend colleagues' seminars and offer critical review, (xiv) conduct formal, written peer reviews of articles submitted for publication in scientific journals, (xv) participate on committees to advance approaches to stock assessment and fisheries management, (xvi) undertake training to stay abreast of new methodologies, (xvii) run courses or workshops to train others, (xviii) participate in national and international meetings and conferences to enhance professional development, and (xix) undertake a variable amount of administrative duties depending on supervisory level. With limited exceptions, there is insufficient scope for individual scientists to focus on just one or a few of these activities due to an overall shortage of assessment scientists.
To better understand the allocation of NMFS' stock assessment scientists' time, and to determine whether there is a difference between the actual and optimal allocation, the Task Force prepared a questionnaire and administered it to working stock assessment scientists. Activities commonly undertaken by assessment scientists were divided into ten categories: (i) the mechanics of stock assessments, (ii) modeling research to improve stock assessment methodology, (iii) other (field or related) research to improve stock assessments, (iv) participation in data collection or data management activities, (v) provision of scientific advice to Fishery Management Councils and others, (vi) participation in FMP development, evaluation of the consequences of alternative management strategies, and other Council-related activities, (vii) other interactions with constituents, (viii) professional development including researching and writing scientific papers, reading scientific journals, attending conferences, and training, (ix) administrative duties, and (x) other. Assessment scientists were asked to estimate the percentage of their time roughly averaged over the previous two years spent in each of these activities, and also to estimate the ideal percentage allocation of time averaged across a group of stock assessment scientists, recognizing that there may be some degree of specialization between individuals. Results are summarized in Figure 5 for all respondents combined and separately for each Science Center except the Northwest (due to a very small sample size).
42
Figure 5. Time and motion analysis for NMFS assessment scientists, averaged over all responding individuals, and individuals within each of four of the Science Centers (the sample size for the Northwest Center is too small).
Overall, about 22% of an average assessment scientist's time is spent on the mechanics of conducting stock assessments, and this seems to be close to ideal, although there are notable differences between Centers. The other features of the summarized results that stand out are a desire to spend less time on data collection and data management activities, providing scientific advice, FMP development and, in particular, administrative duties; and more time on modeling and other research and professional development. This is an important result that supports the belief of the Task Force that assessment
43
Time & Motion Analysis
0 5 10 15 20 25 30
Mechanics
Modeling research
Other research
Data collection
Give advice
FMP development
Other constituents
Professional devel.
Admin duties
Other
Percent of time
IdealNow
Averaged over individuals
Time & Motion Analysis
0 5 10 15 20 25 30
Mechanics
Modeling research
Other research
Data collection
Give advice
FMP development
Other constituents
Professional devel.
Admin duties
Other
Percent of time
IdealNow
Northeast CenterTime & Motion Analysis
0 5 10 15 20 25 30
Mechanics
Modeling research
Other research
Data collection
Give advice
FMP development
Other constituents
Professional devel.
Admin duties
Other
Percent of time
IdealNow
Southeast Center
Time & Motion Analysis
0 5 10 15 20 25 30
Mechanics
Modeling research
Other research
Data collection
Give advice
FMP development
Other constituents
Professional devel.
Admin duties
Other
Percent of time
IdealNow
Southwest CenterTime & Motion Analysis
0 5 10 15 20 25 30
Mechanics
Modeling research
Other research
Data collection
Give advice
FMP development
Other constituents
Professional devel.
Admin duties
Other
Percent of time
IdealNow
Alaska Center
scientists are "stretched too thin." Production of an assessment and provision of advice are activities that usually have a critical time horizon associated with them, whereas research to improve the basis for assessments does not. Yet, such research is crucial to advance the discipline. Also, in the hectic world of stock assessments, professional development is almost perceived as a luxury when, in fact, it is essential for maintaining a workforce of high caliber, internationally renowned and respected assessment scientists. Interaction with peers both nationally and internationally is also essential given the small size of the profession and the need to have a critical mass to discuss and debate ideas.
Beyond assessment scientists
A wide diversity of staff is required to produce a stock assessment. In fact, stock assessment scientists just represent the "tip of the iceberg" (Figure 6). Far greater numbers of staff are deployed in critical data collection activities, such as commercial or recreational catch and effort data, port sampling for biological data, observer programs, and fishery-independent resource surveys. Additional staff are required to process biological samples (e.g. to determine fish ages from hard structures, construct age-length keys, develop growth curves, construct maturity ogives, and possibly to identify and count eggs and larval fish from ichthyoplankton surveys and examine stomach contents), and to enter, audit, integrate, and preprocess data from the myriad of data collection activities. Support staff such as secretaries, administrators, and human resource personnel are required to support the data collection and stock assessment staff and their activities. Assessment scientists themselves are involved in three primary assessment-related activities: conducting assessments (using assessment models), methods research (developing assessment models), and analyzing management alternatives and providing advice to managers and constituents based on assessment results (management strategy evaluations). Relative staffing requirements for assessment-related responsibilities can be roughly represented by a pyramid, with data collection activities forming the base of the pyramid, and the assessments themselves at the apex using information from all lower levels (Figure 6).
44
Fishery-dependent data collection(catch, effort, landings, biological sampling)
Observer programs for bycatch, discards, etc.
Fishery-independent surveys
Processing of biological samples(age, growth, maturity, etc.)
Data entry, auditing/database management
Preprocessing of data
Other support staff(secretarial, admin.)
Conductassessments
Methodsresearch
Communication of results
and follow-up evaluations
Figure 6. Schematic showing relative staffing requirements in support of providing scientific advice for fisheries management. Staff requirements for conducting stock assessments, developing new stock assessment methods, and communication of results and management strategy evaluations represent just the tip of the iceberg.
Thus, when a new species needs to be assessed, the entire pyramid of activities needs to be considered. If the existing infrastructure can be used to collect the basic data for the new species (or basic data are already being collected but have never been processed), it may only be necessary to expand slightly on data collection and data management activities. However, the higher up the pyramid, the less the ability of the existing infrastructure to absorb new responsibilities (Figure 7). If an entirely new program or infrastructure is needed to provide the basic data for the new species, one or more levels of the pyramid may require substantial expansion.
Figure 7. Schematic showing the relative cost of adding new species to be assessed. Often the existing infrastructure can be used to collect the basis data. However, the higher up the pyramid, the less the ability of the existing infrastructure to absorb new responsibilities.
Current assessment-related staffing requirements by type of activity are detailed below using the northeast region as a case study.
Northeast case study
A careful inventory was conducted for staffing levels expressed as Full Time Equivalents (FTEs) for all major data collection, research, and modeling activities of direct relevance to northeast stock assessments. It should be noted that these analyses apply only to staffing levels and other resources contributed on the federal side; however, for many of the region's resources, data collection and analyses are undertaken by staff in state marine fisheries organizations. Totals FTEs by category are summarized in Figure 8.
Commercial Catch and Biological Sampling:(49 FTEs; 30 in-house, 19 contract)
Commercial landings data are primarily collected through a network of NMFS "port agents" stationed in major fishing ports throughout the region, and mandatory dealer and fisher-supplied data. Dealer records are required for most major regulated species. Port agents assure that dealer data are entered into computer files and audited. Individual fishers are required to submit vessel trip reports (VTRs or logbooks), which are entered into computer files through a central processing facility located at the Northeast Regional Office in Gloucester, Massachusetts. In addition to basic data on fishery landings (lbs.), VTRs are also used to allocate landings to water area fished, which is an important element when more than one stock of a particular species is assessed and managed, and for analyses of
45
Fishery-dependent data collection(catch, effort, landings, biological sampling)
Observer programs for bycatch, discards, etc.
Fishery-independent surveys
Processing of biological samples(age, growth, maturity, etc.)
Data entry, auditing/database management
Preprocessing of data
Other support staff(secretarial, admin.)
Conductassessments
Methodsresearch
CURRENTSPECIES
ADD NEW SPECIES
Communication of results
and follow-up evaluations
management strategies involving measures such as closed fishing areas. Discard data are requested in VTRs, but the data provided in these self-reported documents are generally considered unreliable for stock assessment purposes (although the data have been used in some limited circumstances). These data collection programs generate information for activities other than stock assessment (e.g. compliance monitoring, economics, and management), but without such data, monitoring of the effects of fishing on the stocks would not be possible.
Biological sampling of landings (length sampling, collection of structures for subsequent ageing) is also carried out by port agents and additional sampling staff allocated to the ports. Sampling priorities are developed by stock assessment scientists, and port agents attempt to fulfill minimum sample sizes for length and age sampling.
Recreational Catch and Biological Sampling:(50 FTEs; 3 in-house, 47 contract)
Recreational fisheries in the Northeast are an important source of fishing mortality on regulated species such as striped bass, bluefish, Atlantic cod, winter flounder, scup and black sea bass. Data on the magnitude of the recreational catch (numbers of fish caught) are derived from the Marine Recreational Fishery Statistical Survey (MRFSS) conducted by NMFS. This nationwide survey employs a contractor who deploys field personnel in a two-phase sampling scheme. The phone survey element of the program identifies the number of households participating in recreational fisheries in the region. The intercept portion of the survey estimates catch numbers and species composition of fishing trips by anglers. The data are combined to generate estimates of recreational landings and discards, by species.Biological sampling of recreational catches is currently limited to length composition and individual weight data. In several states, the basic sampling scheme is augmented (increased sample sizes) in order to provide more precise catch estimates for important species.
In the Northeast region, the contractor utilizes 47 FTEs for the phone survey and intercept portions of the survey. An additional three FTEs are required to administer the program and provide statistical oversight and management.
Research Vessel Surveys:(15 FTEs; 8 in-house, 7 contract or volunteers)
Standardized research vessel surveys provide the backbone for stock assessment activities in the region, and have done so for nearly 40 years. The primary survey activities include spring and autumn bottom trawl survey series (broad-based multispecies trawling surveys), a winter bottom trawl survey in the Middle Atlantic and Southern New England region (primarily providing data for stocks such as summer flounder, scup, squids, dogfish, and skates), a sea scallop dredge survey, an hydraulic dredge survey for surfclam and ocean quahog, and a trawling survey for northern shrimp. These surveys require scientific personnel equivalent to about 10 person-years to collect data in the field. Currently this requirement is fulfilled by assigned personnel, volunteers from various agencies and universities, and stock assessment staff. In addition to field data collection personnel, about 5 FTEs are required for data entry and auditing.
Additional research vessel survey data are provided by some states (and by Canada for transboundary resources). More recently, cooperative NMFS-fishing industry surveys have been undertaken to increase the spatial resolution of surveys for sedentary resources (scallop and surfclam), and to develop approaches to real-time management (squid). These activities have significantly increased the requirement for at-sea personnel and for analysts to design the surveys and analyze the results.
Sea Sampling:(14 FTEs; 3 in-house, 11 contract)
Most sea sampling (fishery observer) activities in the Northeast Region are directed to assessing the impacts of fisheries on marine mammal populations of the region, including harbor porpoise in relation
46
to sink gill net fishing. The total sea sampling program includes about 56 FTEs; however, the majority of the program is focused on monitoring fisheries interactions with protected species, including marine mammals and sea turtles. About 25% of the sea sampling program is devoted to sampling for fishery-related problems (e.g. stock assessment and compliance monitoring for fished resources). The magnitude of the program is not sufficient to provide reliable estimates of fishery catches and discards for all the region's fisheries. Consequently, the limited resources of the fisheries-portion of the sea sampling program have been focused on several high priority problems: (1) discards of summer flounder in the Middle Atlantic and Southern New England trawl fishery, (2) estimates of fishery catches and size composition and bycatches of the sea scallop dredge fisheries, (3) estimates of finfish bycatches in the northern shrimp trawl fishery, and (4) monitoring of finfish bycatches in the sea scallop dredge fishery in an area recently reopened to fishing on Georges Bank.
Age and Growth:(11 FTEs; 8 in-house, 3 contract)
Analyses of year class strength and projections of stock abundance require measurements of the age-length and age-weight relationships of fishery resources. Because of high interannual variation in recruitment survival, the abundance and growth rates of adjacent year classes may differ greatly. Accordingly, where age-based stock assessments are performed, age information must be collected each year from the fisheries and from research vessel abundance surveys.
The NEFSC currently ages about 50,000 individual fish and invertebrates per year. These ageing studies support priority age-based stock assessments, depending on which stock assessments need to be updated. In addition to ageing work, biological studies supporting stock assessments include validation of ageing structures (e.g. fish otoliths or scales, clam shells) and factors controlling the rate of growth and onset of sexual maturity.
Data Management Services:(5 FTEs; 4 in-house, 1 contract)
Data management activities (data entry, data auditing, database maintenance, custom programming for high priority tasks, and support of data processing activities such as geographical information systems) requires about five FTEs.
Stock assessment staff include individuals involved in data assembly and quality control (technical functions), as well as stock assessment model execution, development of new analytical approaches to stock assessment methodology, computer programming of models, the provision of management advice, and peer review of assessment science. These tasks can be divided into three broad categories describing the general functions of stock assessment research: (1) conducting stock assessments, (2) developing and implementing stock assessment methods, and (3) assessment follow-up activities including analysis of the implications of alternative management strategies and other scientific input into the management process. Within the Northeast Region, approximately 16 FTE are involved in the conduct of stock assessments, four in methods-related research, and eight in communicating assessment results and evaluating alternative management strategies. In all cases, no single individual exclusively performs one of these tasks; rather, individuals may function in all three areas during part of an assessment cycle.
Apart from scientists at the NEFSC, other stock assessment professionals from several states, ASMFC, the two regional Fishery Management Councils, Canada, and various academic institutions all contribute to the stock assessment and peer review processes in the Northeast Region.
Total (172 FTEs)
47
Figure 8. Assessment-related staffing levels by type of activity for the Northeast Fisheries Science Center. DMS = Data Management Services; R/V = Research Vessel.
Based on the above, there is a minimum of 172 FTEs involved in various data collection, data management, data analysis, and communication functions related to the provision of scientific advice for 59 species or stocks of fishery resources in the Northeast. On average, this represents about three staff per assessed species or stock, so that the minimum additional staffing needed to assess a new species using existing infrastructure is at least three. However, if entirely new major programs are required (e.g. a new logbook reporting system, a new port sampling program, a new observer program, a new type of resource survey), the Task Force estimated that as many as 20 new staff may need to be
IV. Resource Requirements
A. Programmatic Needs: Response to questionnaires
In preparation for addressing the question of resource requirements for improving stock assessments, the Task Force prepared a questionnaire and administered it to working stock assessment scientists and to managers of stock assessment programs. Not surprisingly, programmatic needs varied by program with, for example, some assessment groups having reasonable fishery-independent data but poor fishery-dependent data, and others the reverse. Thus, on average, all types of data commonly required as input to assessment models are lacking (Figure 9).
48
Numbers of FTEs - Stock Assessment Activities
Northeast Center / Region
Conducting assessments (n=16)
DMS
(n=5)
Age & Growth
(n=11)
Sea Sampling
(n=14)
Commercial Catch & Biological Sampling
(n= 49)
R/V Surveys
(n=15)
Recreational Catch & Biological Sampling
(n= 50)
Methods(n=4)
Follow-up analysis
(n=8)
Figure 9. Programmatic needs averaged over responses from assessment scientists within each Science Center. An average response of 1 for a given Science Center indicates that the lack of a given program is a major impediment to producing credible assessments and has high priority for improvement; 2 indicates a major impediment, but not amongst the highest priorities; 3 indicates adequate for accuracy but not for sample size; 4 indicates that relatively fine-tuning is needed; and 5 indicates that the current program is adequate with no real need for improvement. Thus, for the five stacked histograms combined, a total of five would represent the worst possible situation and 25 would indicate the best possible situation. The difference between 25 and the summed histograms is an overall indication of the need for improving the specified programs. FI = Fishery-independent; FD = Fishery-dependent.
Overall, the need for fishery-independent indices of relative abundance is the greatest of all, although less so in the Northeast Center. Information on target catch appears to be relatively the least problematic except that the Northeast Center identifies it as its most important programmatic need (Figure 9). Similarly, the lack of a reliable fishery-independent index is the greatest impediment to producing high-quality stock assessments, particularly in the southeast, although less so in the northeast (Figure 10).
49
Programmatic needs
0 5 10 15 20 25
Target catch
bycatch&disc
FD biology
FD effort
FI index
FI biology
stock structure
seasonal/spatial data
Average response
NE
SE
SW
NW
AK
Figure 10. Impediments to the quality of assessments averaged over responses from assessment scientists within each Science Center. An average response of 1 for a given Science Center indicates that the quantity or quality of data and staff resources is a major impediment to producing credible assessments and has high priority for improvement; 2 indicates a major impediment, but not amongst the highest priorities; 3 indicates adequate for accuracy but not for sample size; 4 indicates that relatively fine-tuning is needed; and 5 indicates that the current program is adequate with no real need for improvement. Thus, for the five stacked histograms combined, a total of five would represent the worst possible situation and 25 would indicate the best possible situation. The difference between 25 and the summed histograms is an overall indication of the need for improving the specified data collection programs or staffing levels. FI = Fishery-independent; FD = Fishery-dependent; rec = recreational.
50
On average, lack of adequate data seemed to be only slightly more of an impediment than staffing levels to the quality of assessments but again this varies considerably by program. Data and research needs for recreational fisheries were low in Alaska where such fisheries are relatively much less important (Figure 10). Overall, observer programs and analyses of biological samples were identified as the two most important fishery-dependent data needs, with improved information on recreational catch monitoring and commercial fishing effort being relatively the least important, although still in need of substantial improvement (Figure 11). Overall, tagging programs and staff to process biological samples were identified as the two most important fishery-independent data needs, with training in species identification and improved understanding of benthic habitat associations being relatively the least important (Figure 12).
Figure 11. Fishery-dependent data needs averaged over responses from assessment scientists within each Science Center. An average response of 1 for a given Science Center indicates that a new or greatly expanded data collection program of the specified type would greatly enhance the ability to produce accurate, precise and timely assessments; 2 indicates that the program would help moderately; 3 indicates that the program would only help marginally; and 4 indicates that the program would not help or is irrelevant. Thus, for the five stacked histograms combined, a total of four would represent the worst possible situation and 20 would indicate the best possible situation. The difference between 20 and the summed histograms is an overall indication of the need for improving the specified data collection programs or staffing levels. econ = economic; biol = biological; rec = recreational.
51
Figure 12. Fishery-independent data needs averaged over responses from assessment scientists within each Science Center. An average response of 1 for a given Science Center indicates that a new or greatly expanded data collection program of the specified type would greatly enhance the ability to produce accurate, precise and timely assessments; 2 indicates that the program would help moderately; 3 indicates that the program would only help marginally; and 4 indicates that the program would not help or is irrelevant. Thus, for the five stacked histograms combined, a total of four would represent the worst possible situation and 20 would indicate the best possible situation. The difference between 20 and the summed histograms is an overall indication of the need for improving the specified data collection programs or staffing levels. To group main headings (upper case labels) and subheadings (lower case), it is necessary to read from bottom to top on the y-axis. Oceanog = oceanographic; assocs = associations; inc = increased.
52
Fishery-independent data needs
0 5 10 15 20
SAMPLING FREQ
more routine surveys
seasonal surveys
spawning surveys
inc sampling density
TRAWL SURVEY
gear properties
benthic habitat assocs
trawl mortality
benthic impacts
LONGLINE
gear properties
benthic habitat assocs
ACOUSTIC SURVEYS
gear properties
contaminant species
TAGGING
archival tags
tag retention studies
tag recovery studies
SUBMERSIBLES
line transect
avoidance
benthic impacts
benthic habitat assocs
RECRUITMENT STUDIES
gear properties
benthic habitat assocs
PROCESS STUDIES
oceanog data
intensify sampling
DATA MANAGERS
SAMPLE PROCESSORS
STATISTICAL ANALYSIS
SPECIES ID TRAINING
Average response
NESESWNWAK
The general conclusion from these questionnaire summaries is that, overall, no single activity stands out as being disproportionately deficient; however, it is equally true that none of the inputs to stock assessments approach the ideal situation of "no real need for improvement."
Figures 9-12 give a qualitative indication of the variation in data and staffing needs between Science Centers, but the raw data (not included with this report, but available on request) indicate that there is greater variability in data and staffing needs between programs than there is between Centers.
B. Three Tiers of Assessment Excellence
The Task Force developed three scenarios to consider in the analysis of the resources required to improve stock assessments. These are detailed below and summarized in Figure 13.
Figure 13. Summary of the key features of the three Tiers of Assessment Excellence.
Tier 1 - Improve stock assessments using existing data
(a) for core species, conduct assessments that are more comprehensive, more thorough, more timely, better quality controlled, and better communicated;
(b) for species of currently "unknown" status, mine existing databases of research vessel survey data and/or commercial and recreational statistics for archival information for new analyses to evaluate status determination criteria.
Tier 1 essentially addresses the question of what improvements in stock assessments can be made without initiating new data collection programs. Although the Task Force agreed that new and/or expanded data collection programs are of paramount importance to the improvement of stock assessments, it was concluded that a certain limited amount could be accomplished even in the absence of new programs. Although most data collected by NMFS are analyzed in a timely manner, there are many databases that have not been examined exhaustively. In particular, there may be considerable
53
assess all managed species or species groups at a minimum level of 3
Improve assessments using existing data
TIER 3Next generation assessments
assess core species at a Level of 4 or 5 explicitly incorporate ecosystem considerations,
national standards of excellence upgrade to at least Level 3 for core species
adequate baseline monitoring for all managed species
TIER 1
more comprehensive for core species mine existing databases for species of unknown status
unanalyzed data for "minor" or non-target species. In some cases, there may even be historical data that has never been computerized, thus necessitating "data-rescue" operations. One reason that some data have been left unedited or unanalyzed is simply a lack of technical and quantitative staff to do the work. Inadequate staffing levels have also compromised the timeliness, quality and thoroughness of assessments conducted to date. Thus, the main requirements for Tier 1 are increased staffing levels, particularly database managers, statisticians, technicians, and assessment scientists.
Tier 2 - Elevate stock assessments to new national standards of excellence
(a) upgrade assessments for core species to at least Level 3;
(b) conduct adequate baseline monitoring for all federally-managed species (including rare species)
The focus for Tier 2 is new or expanded data collection and research initiatives. The task of upgrading assessments for core species to at least Level 3 would likely be relatively simple if there were adequate baseline monitoring for all federally-managed species. A key question is, "what is 'adequate'?" The definition of "adequate" will differ by species or stocks and will depend on their geographic range, extent of migration, and magnitude of inter-annual variations in stock size and recruitment. The Task Force agreed, however, that in most cases adequate coverage would require sampling throughout the range of a species or stock at least every 1-3 years, and preferably at least every 1-2 years. For most species, fishery-independent research surveys are the method of choice; for some species, tagging experiments may be more practical; and where neither of these are possible, fishery-dependent surveys may suffice. There are currently very few stocks that can be characterized as having adequate baseline monitoring (Appendix 1 and Table 1). In addition, a minimal requirement for conducting ecosystem-based management and for fully satisfying the standards set forth in the Sustainable Fisheries Act (e.g. standards associated with bycatch issues) is that there be adequate baseline monitoring of all commercial and recreational species and also all associated species, not just federally-managed species.
Tier 3 - Next generation assessments
(a) assess all federally-managed species or species groups at a minimum Level of 3, and all core species at a Level of 4 or 5;
(b) explicitly incorporate ecosystem considerations such as multispecies interactions and environmental effects, fisheries oceanography, and spatial and seasonal analyses
The Task Force struggled to define reasonable limits to Tier 3. The most recent Report to Congress on the Status of Fisheries of the United States (NMFS 2001a) lists 905 federally-managed stocks, most of which are not routinely monitored, and many of which may not even be identified to species in commercial or recreational landings. The number of data collection activities and staff resources required to enable 900+ assessments of stock status to be undertaken on a regular (e.g. annual) basis is enormous. Additionally, if associated species and other ecosystem considerations were to be taken into account, the task is mind boggling. It then becomes necessary to ask the question, what would be the utility of having 900+ annual assessments; is this a reasonable long-term objective? Would this substantially enhance fisheries management, or are there simpler ways of achieving a similar result? Certainly, it is hard to imagine that 900+ catch quotas would therefore be set, monitored and enforced simultaneously.
From a management perspective, a more realistic aim would be to manage only the primary (core) species by catch quotas, effort controls, or similar high maintenance management methods, and to manage other species using closed areas (e.g. marine protected areas, MPAs), closed seasons, gear restrictions and other indirect management measures. From a stock assessment perspective, a more realistic aim would be to assess groups of species from within the same fishery or geographic area in an aggregate Level 3 assessment, but to also have separate fishery-independent indices of relative abundance that could be monitored over time to make sure that no individual species was becoming
54
severely depleted. Nevertheless, it is obvious that any reasonable attempt to even partially satisfy the objective of assessing all federally-managed species at a level of 3-5 will require substantial new or expanded data collection and research initiatives, and staff to collect, manage, process, and analyze the data, and to communicate the results.
In essence, Level 4 assessments can be considered "state- of-the-art," while Level 5 assessments are "next generation assessments." Level 4 stock assessments are the standard to which NMFS Science Centers currently strive for the stocks of primary importance. Level 4 assessments comprise analytical age, size, or stage-based calculations that provide relatively precise time series of stock abundance estimates, estimates of exploitation rates and the distribution of the exploitation across size or age groups. From such analyses, short- and medium-term stock and fishery projections and detailed analyses of alternative management scenarios can ensue.
One goal of the Stock Assessment Improvement Plan is to increase the proportion of stocks that can be evaluated with Level 4 stock assessments. This step alone will require a major commitment of resources to enhance data collection activities and analysis functions. However, it is important to consider enhancements beyond high quality single species stock assessments, recognizing longer-term needs of fishery management and emerging issues related to management of species assemblages, communities and ecosystems. Clearly, there is increasing demand for information to allow finer scales of management in space (geographic distribution) and time (seasonally, monthly, and even weekly) than are typically provided in Level 4 assessments. In many cases, these needs are immediate, as managers attempt to manipulate the spatial and temporal pattern of fishing effort to change exploitation rates and patterns on individual stocks, to harmonize the management of co-occurring stocks, and to deal with allocation issues. There is also growing interest and need for quantitative information on predator-prey and competitive interactions among managed stocks and associated species. Assessments incorporating biological interactions will become increasingly important because of the requirements of the Sustainable Fisheries Act to maintain all managed stocks near or above biomass levels that can support MSY. The feasibility of achieving this simultaneously for all stocks warrants further investigation, as do the trade-offs between fishery yields and stock sizes that will accrue due to manipulation of the abundances of interacting species. Such models are now available in limited situations, primarily as research tools, but the next generation of assessment models will be required to allow more detailed management scenario analyses of such trade-offs for a wider diversity of situations.
Next-generation assessments are also envisaged as providing the foundation for ecosystem-based management. While considerable work on incorporating ecosystem considerations into assessment models and management advice is currently underway, both within and outside of NMFS, ecosystem science is still in its infancy. Ecosystem research is also prohibitively expensive and labor-intensive. The U.S. Global Ocean Ecosystem Dynamics (GLOBEC) program on Georges Bank serves as an example. Planning for this program was initiated in 1991 with preliminary studies in 1993, and a full program including broad-scale monitoring of physical and biological variables and fine-scale process-oriented studies was conducted over the period 1994-99. During this period, research vessels were deployed on Georges Bank for about 250 vessel-days per year, with data collection and analysis involving about 70 scientists, plus support staff, at an overall cost of about $5 million per year. It is projected to take at least another four years to process all of the ichthyoplankton samples, analyze the data, and synthesize the results. Although this program went well beyond simple monitoring of species and collected considerable physical oceanographic data as well as investing in new technologies, for practical and logistic reasons, the program focused only on a few target species: cod and haddock (primarily only at the egg and larval stages), and two species of calanoid copepods. Even accounting for the transferability of knowledge gained from the process-oriented studies and technological spin-off benefits, a data collection program of this intensity would hardly be practical if the targeted species included all species inhabiting Georges Bank.
Thus, the goal of performing frequent individual assessments for all 900+ FMP species, incorporating ecosystem considerations for as many stocks as possible, and considering the effects on associated non-FMP species, is probably not realistic. It is highly likely that the cost of conducting this amount of
55
research would far exceed the landed value of the fisheries. This would not necessarily mean that the overall benefit of such research was negative because research on marine ecosystems has utility beyond simply providing advice on optimal harvest levels. However, there are many competing priorities for government spending. Even if this stock assessment improvement plan and related initiatives are aggressively pursued and actively supported by stakeholders, it is unlikely that NMFS will ever have sufficient data collection and analysis capabilities to conduct more than double the number of assessments currently undertaken per annum, meaning that some species will probably always be assessed either infrequently or as part of a larger group. However, with sufficient resources, it will be possible to also conduct better assessments for the core species. In particular, it may be feasible to anticipate conducting Level 5 assessments (incorporating some but not necessarily all elements listed under Level 5) for as many as 4-8 core species per region. Ecosystem-based research is also likely to yield useful ancillary information about associated species, as well as improving our understanding of the dynamics of marine ecosystems.
Another important future consideration for next-generation stock assessment models is that people and groups influenced by the results of such models (commercial fishers, recreational fishers, environmental groups, and managers) will increasingly request greater access to the data and models themselves, and greater participation in data collection and analysis functions. In the next generation, user-friendly models to analyze the implications of alternative management strategies (e.g. stock projection models simulating the biological and economic consequences of various patterns of future catches or exploitation rates) should be developed and made available to the public so that affected parties can conduct their own analyses of alternative management scenarios. While all of this is possible with current technology and agency expertise, the resources required to develop the necessary interfaces with the public at large are not inconsequential. Greater flexibility in analysis options should be one of the hallmarks of next-generation assessment models, as should access to data and models over distributed computer networks. An important element of improving NMFS' stock assessments is planning for and moving forward with the next-generation of stock assessments immediately, consistent with these considerations.
In conclusion, models addressing more species, and more detailed spatial, temporal, environmental and species interactions questions will require significantly more precise, timely and comprehensive fishery-dependent and fishery-independent data. Next generation models will be extremely data-intensive, requiring much-augmented, comprehensive monitoring data. Gathering and analyzing such data will require even greater cooperation from harvesters, fish dealers, and others, more agency staff and funding, and more partnerships and cooperative research programs with other federal and state government agencies, academic institutions, private foundations, fishers, and environmental groups with a vested interest in similar or related data. Many such partnerships already exist (Appendix 21), but many more are needed. Recent initiatives to develop cooperative research programs with the fishing industry (Appendix 22) are showing considerable promise as a mechanism for augmenting existing programs to collect data of relevance to stock assessments, and a National Cooperative Research Program is now being developed. It may also be fruitful to pursue participation in broad-scale programs such as NOAA's Ocean Exploration Program (Appendix 23), the Census of Marine Life (Appendix 24), and other initiatives involving science policy, data collection and scientific research (Appendix 25).
C. Timeframes and Relationships between the Tiers
Attainment of the three Tiers of Assessment Excellence involves both short and long-term horizons, which, in turn, are dependent upon other complementary programs and initiatives being put in place, and the ability to recruit qualified personnel for the various tasks at hand.
Tier 1: With adequate additional trained staff, most useful work based on existing data will probably have been completed within 3-4 years, by which time new data from Tiers 2 and 3 would hopefully be beginning to become available for additional species. Tier 1 benefits will be almost immediately obvious as data on species of currently "unknown" stock status are analyzed; however, moving certain species from "unknown" to "known" status may not be the highest priority. For example, improved
56
analysis of major target stocks, currently overfished stocks, or new or expanded data collection programs for such species may take precedence.
Tier 2: Contingent on initiation of needed new data collection programs and appropriate additional staff, benefits would become obvious within 5-10 years as time series develop to sufficient length to be of use in stock assessment models. There are also likely to be some immediate benefits; e.g. immediate improvements in the knowledge of the fine-scale distribution of some species and assemblages which could improve management decisions.
Tier 3: Next generation assessments represent a long-term (10+ years) objective and investment because considerable research and development is required and because new time series of consistent data collection must be initiated. In addition, Tier 3 is dependent upon an adequate, purpose-built fleet of dedicated research vessels, continued development of advanced technology that will facilitate sampling of marine organisms, and development of partnerships and cooperative research programs with other federal agencies, state agencies, private foundations, universities, commercial and recreational fishing organizations and individuals, environmental groups, and others with a vested interest in collecting similar types of data, although often for different purposes.
D. Region-Specific Needs to Achieve the Three Tiers of Assessment Excellence
The number of species covered by FMPs differs substantially between regions. This is less a reflection of regional differences in species diversity or fishing intensity than it is of regional differences in the philosophy of which species to include in FMPs. For example, the Gulf of Alaska groundfish plan includes 100 species, but most of the landings are comprised of only a dozen or so species; in contrast, in the New England and Mid-Atlantic regions, less than two dozen of the nearly 200 shelf species are explicitly included in FMPs. For the purposes of reporting on the status of U.S. fisheries, tracking progress in conserving or restoring resources, and comparing region-specific needs and achievements, it would be useful to have greater consistency. However, for the purposes of this plan, the authors all approached the question of region-specific needs in a similar way, regardless of differences in regional philosophies about the degree of inclusiveness. Core species are those with the highest value, highest volume, or highest profile. Minor species are those that contribute little or nothing to landings, but need to be considered in some way in an ecosystem context, regardless of whether or not they are explicitly included in FMPs.
Unless otherwise specified, the current and required resources detailed in this section apply as of January 2000. In some cases, there have been several staff hired or contracted to perform assessment-related activities subsequently. These are highlighted in the appropriate sections.
Northeast Fisheries Science Center The following two sections contain an analysis of the current staffing and status of assessments in the northeast region relative to defined assessment levels, and an analysis of the staffing resources necessary to meet the three Tiers of Assessment Excellence based on data and resources currently used in the region. It should be noted that these analyses apply only to staffing levels and other resources contributed on the federal side; however, for many of the region's resources, data and analyses are undertaken by staff in state marine fisheries organizations. Thus, existing and required staffing resources should be considered minimum.
57
NEFSC current situation
A total of approximately 172 staff involved in stock assessment related activities within the Northeast region (Section III, part I and Figure 8) currently provide advice on 59 managed or otherwise important species/stocks (Figure 14).
Figure 14. Number of stocks (N=59) assessed by assessment level at the Northeast Fisheries Science Center.
The distribution of these stocks is bimodal with respect to "assessment level," with 24 stocks assessed at Level 3 and above, and 35 stocks at Level 2 and below. This mix of assessment quality and completeness is primarily a function of historical interest in various species (e.g. groundfish, summer flounder, and surfclams), an increasing need for higher-level assessments to support management programs, and new legal requirements for population biology data. The situation is not static, with managers increasingly requesting more frequent assessment updates, with more extensive "terms of reference."
In particular, stock assessments are now often required to incorporate discussion and evaluation of "control rules" used by management to meet the requirements of the MSFCMA. These control rules provide managers with a formulaic approach to scientific advice, pre-specifying the relationship of target fishing mortality rates to biomass conditions in the stocks. The construction and testing of control rules makes use of absolute biomass and fishing mortality rate estimates, or proxies for these quantities, if adequate approaches can be developed. As part of this effort, medium term simulations of the performance of control rules in recovering and maintaining stocks are required so as to evaluate the efficacy of a proposed control rule in meeting the 10-year or one generation time constraints imposed by the MSFCMA. Center stock assessment scientists have been involved in developing proposed control rule strategies for various species, and in scientific research for providing realistic simulations of the performance of stocks in relation to control rule management (e.g. simulating population status in the medium term using various approaches for determining recruitment responses). As the need for more complex stock assessments has been increasing, so has the need to upgrade
58
Northeast Stock Assessments
0 1 2 3 4 5
Assessment Level
0
5
10
15
20
25
n = 59
2
20
13
3
Num
ber o
f Sto
cks
19
2
index-level assessments to assessments incorporating age/size structure to support sophisticated simulations of control rule performance.
NEFSC programs and staffing required to meet the three tiers of excellence
Based on the current distribution of stock assessment levels, data and technical limitations, and staffing in data collection and analytical tasks, the following represents an analysis of augmented staffing levels required to meet the three Tiers of Assessment Excellence for Northeast stock assessments (staffing increases by activity are summarized in Table 2).
Table 2. FTEs required to meet the three Tiers of Assessment Excellence by type of activity for the Northeast Fisheries Science Center. Numbers of FTEs in each category do not necessarily reflect the actual number of individuals involved in these activities, in that some individuals may divide their time between several activities. Estimated current FTEs include in-house staff, contractors such as observers, and “other,” which includes state government biologists, and employees or contractors associated with various regional, national and international Commissions. Follow-up evaluations include the production of additional assessment outputs, evaluations of alternative management strategies, and participation in plan development teams. Numbers should be cumulated across tiers.
Process Biological Samples (age, growth, maturity, etc.)
8 3 3 5 5 10 5
Data Management & Preprocessing of Data 4 1 7 2 9 5
Conduct Assessments 13 4 3 2 1 3 5
Assessment Methods Research 3 2 1 3 5
Communication of Results & Follow-up Evaluations
7 1 2 1 3 3
Subtotal (Assessment Scientists) 23 5 3 6 3 9 13
Subtotal (Others) 100 44 13 12 40 52 12
Total 123 49 16 18 43 61 25
Tier 1: Improve stock assessments using existing data
The intent of upgrading assessments of Tier 1 is to more fully utilize existing information, to upgrade the synthesis of available data and to provide information to users on a more timely basis. In order to meet Tier 1 requirements for Northeast stocks, additional FTEs are required primarily in data management and synthesis activities (Table 2). Data on species age and growth have been collected and archived, but not analyzed, for many stocks currently assessed in the "index level" category. A total of five additional FTEs in the Age and Growth activity will allow more complete biological data for assessments of some of these stocks. Additionally, this would enable more timely production of age data.
59
Improving Tier 1 assessments will also require additional staff to better archive and extract sea sampling information, and biological sampling data collected from commercial fisheries. Data management support is needed to maintain databases and improve access to a wider array of users. A modest increment in stock assessment and support staff is required to produce more frequent and improved assessments under this tier.
Tier 2: Elevate stock assessments to new national standards
The major increment in FTEs required under the stock assessment improvement plan occurs when moving to Tier 2 requirements to upgrade assessments for core species to at least Level 3 and for providing adequate baseline assessments for all managed species. In order to meet these requirements, there needs to be major improvements in the quality and timeliness of commercial and recreational fisheries data and required biological sampling. Currently, biological sampling of catches is concentrated on a few core stocks, and sampling levels are barely adequate in many other cases. Improvements in the collection, management, and synthesis of fishery dependent data are needed. Ageing structures are not currently collected from recreational catches and this needs to be rectified. Likewise there is no universal sea sampling program providing routine estimates of discards and bycatch from the region's fisheries, and this needs to be improved. Increased biological sampling under these programs will require the processing of greater numbers of ageing structures, and data entry and manipulation. For some stocks not currently indexed by research vessel survey programs (e.g. tilefish, deep water fisheries and components too deep for surveying in current programs) additional types of fishery-independent data are required and will need to be developed. Additional stock assessment scientists are required to produce higher quality and more frequent assessments called for under this requirement.
Tier 3: Next generation assessments
Next generation assessments are intended to provide more explicit accounting for biological and technological interactions, longer-range predictions and integration of biological and environmental data. A major component of these assessments will be the incorporation of feeding data into routine stock assessments and modeling and spatial dynamic models and data to examine the fine-scale implications of alternative management strategies. In order to support such requirements, additional data collections for biological analyses (e.g. stomach sampling) are required, as well as fishery oceanographic data bases, geographical information systems, and data management necessary to support these activities.
Southeast Fisheries Science Center
The fisheries under the research jurisdiction of the Southeast Fisheries Science Center are diverse in both the species being exploited and the fishing sectors prosecuting these fisheries, including large recreational sectors and bycatch sectors, as well as commercial fisheries. In some fisheries, the productivity of many of the species being exploited is low, supporting relatively small catches (there are over 400 species within Southeast FMPs or international conventions). However, some of the species are extremely valuable and many are very important to local communities. Also, in aggregate the species catches are significant and the fisheries often have the capability to exploit a variety of species, switching target species as conditions change. These characteristics result in unique research and management requirements.
SEFSC current situation
The Southeast Fisheries Science Center has unique resource requirements to achieve each of the three Tiers of Assessment Excellence. This results largely from the diversity of fishery resources occurring within the Region. Current stock assessment efforts have focused on a small number of core species (those of greatest public interest and often of greatest political importance due to conflict between constituents). Thus, detailed assessments are conducted on 10-15 stocks, annually. However, there are a large number of stocks upon which little assessment work is done other than to monitor catches. The
60
catches of any individual one of these unassessed stocks is often small and of small socioeconomic significance; however, in aggregate they are an important part of the fisheries economic sector and fishing communities. Fisheries of the southeast are managed by the South Atlantic Fishery Management Council, the Gulf of Mexico Fishery Management Council and the Caribbean Fishery Management Council through fishery management plans on shrimp, reeffish, snapper-grouper, spiny lobsters, coastal pelagics, red drum, stone crabs, corals and others. The number of FMPs requiring stock assessment data is increasing. Data collection in support of assessment of these species comes through the SEFSC efforts and through joint agreements with the individual states (plus Puerto Rico and the U.S. Virgin Islands) and with the Atlantic and Gulf States Marine Fisheries Commissions. Additionally, since the recreational sector is large in many fisheries (in some cases larger than the commercial sector), several joint agreements have been made to obtain recreational catch data from various survey mechanisms.
A major issue that impacts stock assessments in the southeast United States is bycatch, particularly discarded bycatch resulting from Gulf of Mexico shrimp trawlers. The mortality resulting from this activity impacts stocks of fish for which there are directed fisheries, therefore limiting the production from those fisheries. There are also major concerns with the impacts of gill-net fisheries on marine mammals, and hook and release mortality in the substantial recreational fisheries that exist in the region. Incorporating bycatch estimates into stock assessments requires a new level of commitment to data collection through observer programs. Initial ad hoc projects have been conducted to obtain estimates of bycatch, but the precision is lacking.
The Southeast Fisheries Science Center has the responsibility for providing the United States scientific support for assessing stocks of Atlantic tunas, swordfish and billfish in conjunction with the International Commission for the Conservation of Atlantic Tunas (ICCAT) of which the United States is a signatory nation. Assessments of the tuna, swordfish and billfish stocks are conducted jointly with scientists from various nations. The Southeast Fisheries Science Center has the responsibility for monitoring catch and scientific data from throughout the U.S. Atlantic coast and report these to ICCAT. The U.S. scientists, also, take a lead role in the joint assessment working groups within ICCAT's scientific committee.
SEFSC programs and staffing required to meet the three tiers of excellence
Tier 1: Improve stock assessments using existing data
The first Tier of Assessment Excellence is a goal of improving assessments with existing data for both core stocks and those stocks whose status is largely unknown. The core stocks for which detailed assessments are currently being conducted can be improved, even with existing data. Improvements can be achieved largely through more comprehensive characterization of the uncertainty associated with various management parameters arising from the assessment. Characterizing the uncertainty requires stochastic modeling activities which are time consuming both in their development and in the actual running of the models. Uncertainty characterization also requires extended interaction with managers and constituents in order to appropriately formulate the statistical questions.
The first Tier can be achieved for the "non-core" stocks by developing and organizing the data bases necessary for first pass assessments for these species. This will require statistical determinations of catch by size and other relevant strata, the collation of biological data and the analysis of appropriate survey and catch-effort trend data. In many cases some data exist within Federal, State and academic institute data bases on each of these aspects. But it remains to integrate the information and make "first-pass" assessments. These initial assessments are important for management, as they will allow initial overfishing/overfished determinations to be made; additionally, the results will be extremely useful in guiding further scientific prioritization of data collection activities for these stocks. Due to the large number of these stocks within the purview of the SEFSC, this will require increased monitoring by assessment scientists.
61
Tier 2: Elevate stock assessments to new national standards
The second Tier of Assessment Excellence expresses the goal of upgrading assessments of core species to a level in which dynamic changes in stock abundance are estimated and monitored over time; and that there should be a baseline monitoring of all managed species. To achieve this Tier, expanded data collection activities and extensive monitoring activities by assessment scientists will be required. Of particular importance is the need for fisheries-independent data. As noted above, catches for many stocks are relatively small; therefore, assessments with adequate levels of precision will require monitoring of appropriate abundance indices. SEFSC scientists indicate the high importance of developing fishery-independent indices within their responses to the questionnaire (Section IV (A)). The scientists' responses also placed emphasis on observer programs to address important issues of bycatch, discards, collection of biological data, and collection of better effort data. Thus, Tier 2 efforts should focus on developing and improving data collection mechanisms. Fishery independent efforts require extended ship time which is addressed in other initiatives. However, improvements will require more than simply conducting more trawl surveys. Extensive research is needed to explore avenues for monitoring stocks and life stages of stocks that are not conducive to trawl surveys; for example, mackerels and other coastal pelagics; billfishes and tunas; and reef dwelling species. This will require creative interaction between assessment scientists, survey statisticians, ecologists and gear-specialists in order to design appropriate survey strategies. Additionally, second Tier goals will also require improved characterization of bycatch, discards and other fisheries and biological data. Observer programs are essential for these activities. Management of statistically useful observer programs will require the close cooperation of biologists, assessment scientists, data managers and program management with the constituents.
Tier 3: Next generation assessments
The third Tier of Assessment Excellence expresses a goal of having minimal assessment levels (dynamic monitoring of abundance - production modeling) for ALL stocks with all core stocks being addressed by size, age, sex-structured assessments with possible inclusion of ecosystem factors. As noted above, the diversity of fishery stocks under SEFSC purview indicates the importance of ecosystem considerations. What effect are major ecosystem perturbations such as bycatch or environmental changes likely to have on species distributions? Can species shifts be predicted even in a probabilistic sense? Can management strategies be devised to avoid chances of deleterious socioeconomic consequences of species shifts? Can management strategies be devised to achieve short term local objectives of the fishers? These questions pose important research goals. Steps to achieve these goals require extensive research, monitoring and data collection activities. In particular, spatial and temporal scales of data collection will need to be improved. This will require finer scale information on catches, survey abundances and oceanographic variability. Additionally, the monitoring of a large number of stocks (the components of the ecosystem) is needed to discern patterns of variability.
Specific resource requirements are outlined in Table 3. Note that resource requirements are additive; i.e., requirements for Tier 2 are additive to those in Tier 1.
Data Management & Preprocessing of Data9 1 7 4 11 1
Conduct Assessments 8 2 4 3 7 3
Assessment Methods Research 1 1 2 3 6
Communication of Results and Follow-up Evaluations 6 1 2 3 1
Subtotal (Assessment scientists) 15 0 2 6 7 13 10
Subtotal (others) 56 30 44 8 35 43 29
Total 71 30 46 14 42 56 39
Table 3. FTEs required to meet the three Tiers of Assessment Excellence by type of activity for the Southeast Fisheries Science Center. Numbers of FTEs in each category do not necessarily reflect the actual number of individuals involved in these activities, in that some individuals may divide their time between several activities. Estimated current FTEs include in-house staff, contractors such as observers, and “other,” which includes state government biologists, and employees or contractors associated with various regional, national and international Commissions. Follow-up evaluations include the production of additional assessment outputs, evaluations of alternative management strategies, and participation in plan development teams. Numbers should be cumulated across tiers.
Note that the above table specifies the labor resources (FTEs) needed to address the three Tiers of Assessment Excellence for stock assessment responsibilities. The labor resources have an associated cost which is not addressed in the table. However, in addition to the labor costs there will be additional resources needed to conduct experiments to achieve Tiers 2 and 3. Vessel time on research vessels will, of course, be important, but this is discussed elsewhere. Activities which would likely be prominent in achieving Tiers 2 and 3 are archival tagging experiments, stock identification (mtDNA and microconstituents) and other activities.
Southwest Fisheries Science Center
The NOAA Fisheries Southwest Fisheries Science Center's area of responsibility encompasses a vast expanse of open ocean and international waters, including the coastal waters of California, parts of the Antarctic, and the Hawaiian Islands, and the U.S. Territories of Guam and American Samoa. The SWFSC is responsible for the research and management of some of the nation's most intriguing species, and is a major force in the nation's effort to build international cooperation for the stewardship of these species. Research extends over an area of more than 64.2 million square miles of open ocean - greater than 18 times the size of the U.S. land mass - including 1.8 million square miles of EEZ. The Southwest Region is home to over 72 protected marine species, and 153 fishery stocks, of which the status of 101 remains unknown. In addition to the complexity of the marine ecosystems in this region, the international and domestic mix of culturally diverse fishing communities present complex challenges for managing species, conducting research, and collecting data necessary to ensure sustainable fishing practices. The collective value of tuna, swordfish, sharks, and billfish from U.S. Pacific water fisheries exceeds $1.5 billion annually. Near shore landings of sardines, mackerel, tuna, rockfish, and flatfish in California and Hawaii totaled 370 million pounds in 1998 and were valued at $173 million. During the same year, aquaculture in the Southwest Region produced 30 million pounds of fish and shellfish worth $55.6 million to growers. From the recreational perspective, a quarter of a million saltwater anglers, 40 annual fishing tournaments, and prized game fish like marlin, tuna, wahoo, and mahimahi place Hawaii among the top 10 states adding significantly to the economy from
63
sport fishing. California, with over a million recreational anglers, ranked second in the U.S. catching about 23 million pounds of fish.
The SWFSC supports two fishery management councils. The Western Pacific Fishery Management Council (WPFMC), located in Honolulu, Hawaii, manages the insular resources in the central and western Pacific. The Pacific Fishery Management Council (PFMC), located in Portland, Oregon, manages fishery resources along the U.S. west coast. Both councils manage highly migratory species.
SWFSC current situation - central and western Pacific
The SWFSC has assessment responsibility for 56 species listed in the FMPs under the jurisdiction of the WPFMC. In terms of domestic and international market value, "core" species include the large pelagic fishes (tunas and billfish), and in terms of political interest blue sharks are added to the list. These species readily migrate far beyond the U.S. EEZ and into waters where they may be caught by fleets of other countries. Assessments of these stocks cannot be based solely on catch data within U.S. territorial waters from U.S. domestic fleets. Stock assessment work must be conducted in an international context, taking account of all catches that affect the population being assessed. The two Atlantic coast science centers face a prospect somewhat similar to the SWFSC in this respect, although assessment-related procedures in the Atlantic have long been defined by participation in well-established international agencies, such as ICCAT, that orchestrate collection of data and workshops involving scientists from member countries who conduct comprehensive stock assessments. To date there are no comparable fishery management agencies in the temperate and tropical Pacific beyond that covered by the Inter-American Tropical Tuna Commission (IATTC) in the eastern tropical Pacific.
In the absence of such management agencies in the central and western Pacific, it has been necessary for SWFSC scientists to forge their own cooperative arrangements with fishery scientists in other parts of that region. This takes considerable time and effort. Various international cooperative arrangements have operated on a relatively informal basis for the purpose of assembling fishery data from disparate sources and conducting stock assessments. Foremost of late is the Standing Committee on Tunas and Billfish (SCTB) of the Secretariat of the Pacific Community (SPC) which for core tuna species has been fostering fishery data collection and high level stock assessments, with the participation of an international cadre of fishery scientists.
In the past few years, two prongs of diplomatic effort have been undertaken in the Pacific to formalize comprehensive, international management agencies for the region or a portion thereof. One, the Interim Scientific Committee (ISC), has met several times and established several subcommittees to promote assessment of various species and to establish a comprehensive fishery data base. The other effort, dubbed the Multilateral High Level Conference (MHLC), has met five times, is considerably more comprehensive in its membership than the ISC, and has the ambitious goal of establishing a fishery monitoring and management agency by June 2000.
At present, for most of the major fleets harvesting tuna species in the central and western Pacific (including U.S. fleets), catch and effort data are available to NMFS (or other) scientists for the purpose of conducting stock assessments thanks to the work of the SCTB and similar informal cooperative arrangements. The resolution in time and space is not always as fine as desired and there are some holes in the data, particularly catch at size data. Fortunately, good tag return data exist for the four major tuna species (skipjack, yellowfin, bigeye, and albacore) which in conjunction with the fishery data have enabled the high level stock assessments mentioned above. However, as sophisticated as the assessments have been, they have not had the benefit of regular survey data or other types of fishery independent abundance indices because no regular scientific surveys are conducted for pelagic fisheries in the region. Though scientific observer coverage has been very poor, it is improving with the observer requirements of the South Pacific Forum Fisheries Agency (FFA). Observer coverage on U.S. purse seine vessels in the region is 23%, and coverage of the Hawaii longline fleet is less than 5%.
64
For domestic insular fisheries for demersal fishes and crustaceans, the data coverage is mixed. Regular abundance index surveys for lobsters have been conducted in conjunction with release of tagged lobsters. In addition, there has been occasional observer coverage of the lobster fleet. Commercial catch/effort data for demersal fish are collected by the state of Hawaii, but data for significant amounts of "recreational" catch (much of it sold at roadside stands) are not collected. The Honolulu Laboratory has seven stock assessment scientists, including those involved in conducting assessments, methods research, and follow-up activities such as input to plan development, for the 56 species in the WPFMC FMPs. These scientists are additionally charged with investigating the magnitude and gravity of interactions between domestic fisheries and protected species of turtles and sea birds. Assessment duties for tunas, blue marlin, swordfish, and blue shark are shared with scientists from other countries and agencies around the region, but many of the other pelagic species are neglected through necessity.
SWFSC current situation - west coast
The SWFSC has assessment responsibilities for four FMPs under the jurisdiction of the Pacific Fishery Management Council (PFMC). Under the Groundfish FMP, the SWFSC shares assessment responsibilities with the NWFSC. The SWFSC produces the assessments and the NWFSC provides data collection and overall coordination for 82 groundfish species, including over 40 species of rockfish distributed from Southern California to Canada. Only 26 of the 82 groundfish species have been assessed, and almost none from central California southward. Five species have been quantitatively assessed as overfished. This has caused a crisis due to severely reduced catch allocations. Many unassessed species are thought to be overfished as well, and there is at least one case where an unassessed stock may be threatened or endangered.
Under the Salmon FMP, the SWFSC has sole responsibility for assessing and developing recovery plans for 10 endangered salmon and steelhead runs from California affecting three species.
Under the Coastal Pelagics FMP, the SWFSC has sole responsibility for assessing sardine, Pacific and jack mackerel, northern anchovy, and market squid. This is done in cooperation with the State of California on an annual basis.
Under the Highly Migratory Species FMP currently being developed, the SWFSC will have sole responsibility for assessing six tuna and billfish species caught by fisheries originating from the U.S. west coast. This will be done using the same agreements and mechanisms described above in the section on central and western Pacific and will include Mexico. Additionally, this FMP will include four pelagic shark species. None of these have been assessed. The complexities of coordinating international assessments are similar to those discussed for the central and western Pacific.
The SWFSC is currently assessing the white abalone population which has been petitioned to be listed as endangered under the Endangered Species Act. This species needs to be assessed throughout its range, which requires cooperation with Mexico.
The California recreational fishery bridges FMPs and complicates management, research and assessment efforts. This fishery is composed of both commercial passenger fishing vessels and private fishers and generates effort in millions of days annually. It targets many of the same species as commercial fleets, and is highly significant economically.
SWFSC programs and staffing required to meet the three tiers of excellence
The SWFSC currently has 24 assessment scientists with a total of 80 staff in the assessment processes (Table 4). The SWFSC is aided in commercial catch, recreational catch and biological sampling by various state agencies which independently or by contract conduct sampling. The jump to Tier 1 requires a large increase in stock assessment scientists, necessitated by the current low staffing of
65
assessment personnel at the SWFSC. Movement to Tiers 2 and 3 is highlighted by the need for increases in methods research along with additional assessment capacity.
Table 4. FTEs required to meet the three Tiers of Assessment Excellence by type of activity for the Southwest Fisheries Science Center. Numbers of FTEs in each category do not necessarily reflect the actual number of individuals involved in these activities, in that some individuals may divide their time between several activities. Estimated current FTEs include in-house staff, contractors such as observers, and “other,” which includes state government biologists, and employees or contractors associated with various regional, national and international Commissions. Follow-up evaluations include the production of additional assessment outputs, evaluations of alternative management strategies, and participation in plan development teams. Numbers should be cumulated across tiers.
* A loosely determined number of collaborating assessment scientists at SPC, CSIRO, NRIFSF and elsewhere.
Tier 1: Improve stock assessments using existing data
Moving to the first Tier of Assessment Excellence, improving assessments with existing data, could be readily achieved by additional SWFSC scientists for many species. Current data collections, including indices of abundance and key biological data exist with various sources - state, federal, and international - and could be prepared for assessment use in relatively short order. In the Southwest Region, considerable numbers of species have not yet been assessed or have been inadequately assessed. These include some high profile species currently fished such as striped and blue marlins, all of the pelagic sharks caught in the Pacific coast HMS fisheries, and several tuna species such as
66
skipjack and bigeye tunas. The rockfishes in central and southern California have large numbers of unassessed species including some mainstays of the recreational fishery such as Pacific bonito, vermillion rockfish and black abalone which are expected to be declared overfished once Tier 1 assessment are completed, or, as in the case of the white abalone move directly from unassessed to endangered. The jump to Tier 1 requires appreciable increases in database managers and analysts to retrieve, audit and preprocess the data; biological technicians to process archived samples; and stock assessment scientists to conduct assessments, explore new methodologies appropriate to data-poor situations, and communicate the results (Table 4).
Tier 2: Elevate stock assessments to new national standards
Moving or upgrading assessments to Tier 2 where dynamic changes in stock abundance can be assessed and monitored for core species and all managed species are monitored will require expanded data collection as well as extensive monitoring by assessment scientists (Table 4). SWFSC scientists are engaged in developing advanced technology survey methodologies including, for example, ROV strip census, advanced acoustics, LIDAR strip census and integrated acoustic and net surveys for krill-sized organisms. These methods, as well as more established methods, will form the core for fishery-independent data monitoring. Considerable effort will be focused on providing the basic biological parameters needed to move assessments to age and size based methods from current Tier 1 efforts. Genetics will play an important role in developing early life stage indices from fishery-independent survey methods such as continuous underway egg and larval sampling for biomass, which was pioneered at the SWFSC. Coordination of creative interactions between the various stock assessment specialties will require careful management.
Tier 3: Next generation assessments
Tier 3 moves to the goal of providing basic assessments for all stocks with core stocks using age/size/sex structured methods and considering ecosystem effects. To reach this goal for core stocks, extended research to estimate key biological parameters will be needed. This will require substantially increased scientific effort (Table 4). The SWFSC at its Pacific Fisheries Environmental Laboratory is engaged in developing environmental data sets related to decadal climate shifts and shifts in ocean productivity, and researching methodologies for incorporating these effects into assessment models. Currently, SWFSC scientists have provided a management model to the Pacific Council which uses temperature as a forcing factor for determining harvest guidelines. Extension of these emerging methods for incorporating ecosystem effects will require interdisciplinary cooperation and facilitation between assessment scientists and other disciplines.
Northwest Fisheries Science Center
NWFSC current situation
The Northwest Fisheries Science Center has lead responsibility for assessment of west coast groundfish and evaluation of recovery options for Pacific salmon. The demands for accurate scientific investigations for both groups of species are high and increasing. Groundfish and salmon are managed according to Fishery Management Plans developed by the Pacific Fishery Management Council (PFMC). Although the NWFSC has the lead role in coordinating assessment information for both FMPs, there are major contributions by other NMFS Science Centers and by the state fishery agencies of California, Oregon and Washington.
The status of Pacific salmon species on the west coast has been reviewed under provisions of the Endangered Species Act and 26 populations (Evolutionarily Significant Units) have been listed as threatened or endangered. A tremendous effort is being mounted by the NWFSC and the SWFSC to develop salmon recovery plans that incorporate all aspects of human and natural risks to salmon. Nearly all of the salmon escapement monitoring and run forecasting is based on in-river information and is done by the state and tribal agencies. These results are used by the Salmon Technical Team (STT) of the PFMC to develop harvest options for consideration by the PFMC. Because the
67
assessments of salmon are primarily conducted by other agencies, and because the primary west coast salmon activity occurs under Protected Species, the salmon research and monitoring needs are not considered further in this document.
For groundfish, only 26 of the 82 species have ever been quantitatively assessed. Of these 26 species, several have experienced severe declines. Harvest rates, climate, and assessment precision all contributed to this decline. The default harvest rate during most of the 1990s (35% spawners per recruit), while conservative by global standards, was overly optimistic during what has become a 20-year regime of poor ocean productivity. The precision and frequency of stock assessments did not allow forecasting the magnitude or duration of the decline in recruitment until several stocks had already crossed into an overfished state. As of 2001, rebuilding plans are being developed for seven groundfish species. Even among the 26 assessed species, there are some for which there has not been sufficient information to adequately determine their status with respect to overfishing thresholds. There are concerns that others of the 60+ species with unknown status may be in danger of overfishing. Further, some populations of groundfish in Puget Sound have declined to such low levels that their status was reviewed in 2000 for potential listing under the ESA.
The majority of shoreside groundfish catch monitoring is done by the state agencies with coordination through the Pacific States Marine Fisheries Commission which maintains a centralized database of fisheries data (PacFIN). Most resource surveys are conducted by NMFS, with the triennial bottom trawl and hydroacoustic surveys providing a major source of data for most assessments. Approximately six groundfish stock assessments are conducted each year by NMFS, state agencies, and others. The NWFSC coordinates a stock assessment review process in conjunction with the PFMC's SSC, that involves external peer-reviewers and public input.
Passage of the MSFCMA strengthened the mandate to improve the west coast stock assessment capability. Assessments need to be conducted for more of the groundfish species. The level of uncertainty in groundfish assessments and the current information on low productivity for these species needs to be combined in a sound precautionary approach to managing these species. Rebuilding plans, which are expected to take more than 10 years, need to be developed and subsequently monitored for several of these long-lived species.
All of these will be extraordinarily difficult given the lack of a dedicated research vessel for these resources and the low level of current resource survey efforts. Further, increased stock assessment effort will primarily tell us what is occurring to these species. Knowing what is only the first step. In order to develop a better understanding of why these changes are occurring, programs need to be developed to investigate the role of decadal scale changes in ocean climate, and the role of ecosystem shifts such as the major increase in pinniped abundance that has occurred off the west coast.
NWFSC programs and staffing required to meet the three tiers of excellence
The great diversity of habitat, life history, and knowledge for west coast groundfish defies simple description of the data needs for improvement. The 82 species have a collective distribution, which spans 1300 miles of coastline and from estuaries out to at least 1500 m bottom depth. Some species are schooling midwater, others are on the benthic continental slope, and others are associated with high-relief near shore habitat. Species with the greatest accumulation of relevant stock assessment data tend to be those that have historically been targeted by the trawl fishery and are amenable to either trawl or hydroacoustic surveys. Species that have the greatest data needs tend to be those that are associated with high relief habitat and are subject to growing commercial and recreational hook and line fisheries. Today, only 26 of the 82 groundfish species have ever been assessed, and many of these assessments have had insufficient data to allow adequate determination of the status of the species.
68
Tier 1: Improve stock assessments using existing data
Bringing all west coast groundfish species to a Tier 1 level will require additional stock assessment, data processing and ecological staff to make the best use of the limited existing data. Some groundfish assemblages have no fishery dependent or fishery independent index of abundance and limited biological sampling from the fisheries.
The Tier 1 focus of stock assessment modelers needs to be on developing a first-cut assessment for all species so that any overfishing can be identified and corrected. There are three general areas of improvements. One area will be in the development and application of relevant assessment methods for more of the species that do not have sufficient data to support current data-hungry quantitative assessment methods. This will require innovative use of stock assessment, biological and ecological data so that information from better known species can be used to develop proxies for poorly studied species. A second area of improvement is the development of assessment modeling protocols that better quantify and communicate the uncertainty in current assessments. Such improved models will structure implementation of a more formal precautionary approach to harvest management. A third area of improvement is in the spatial integration of fishery and survey databases, particularly through advances in linkage of fishery logbooks, landings data, and fishery biological samples.
Tier 2: Elevate stock assessments to new national standards
Medium-term improvements in major data sources can lead to substantial improvements in assessment precision within about 10 years. These include major programs such as periodic resource assessment surveys, more comprehensive fishery logbook programs and at-sea monitoring of total catch, collection of genetic stock structure data for more species, and evaluation of fish association with particular habitats. Beyond routine monitoring, survey effort also needs to be devoted to studies that will improve understanding of how environmental and other factors affect efforts to standardize surveys. Studies are needed to investigate bycatch mortality and gear impact studies. Many of these medium-term efforts are large scale and expensive, but have the greatest likelihood of significantly improving the accuracy of the assessments and our ability to conduct assessments for all assemblages of groundfish. Current efforts are far from meeting Tier 2 assessment needs because:
1. The NWFSC has no dedicated fishery research vessel to do standardized resource assessment surveys or other field research;
2. Surveys to assess most of the continental shelf rockfish and lingcod are conducted only triennially, yet several of these species are overfished and their rebuilding plan calls for a biennial assessment; 3. A small coastwide observer program to assess bycatch and total mortality of target species was not implemented until 2001, yet estimates of discard for some target species range up to 30%;
4. Fishery monitoring has historically focused on the trawl fleet. There are no fishery logbooks and insufficient fishery-dependent data for the hook&line fishery which accounts for the majority of many nearshore rockfish species catch. Further, there are few if any fishery-independent data from which to assess the status of these species. Tier 3: Next generation assessments Further improvements in assessments can be made by increasing the frequency and precision of fishery-independent surveys, and by increasing the number of species for which there is age composition data from the fishery and surveys. However, major improvements in our ability to forecast future stock conditions and to provide assurance of ecologically safe harvest strategies will require qualitatively different kinds of information. Among these longer term efforts are recruitment surveys that will directly forecast changes in fish abundance, climate studies to provide longer-term predictions of average recruitment levels, and ecosystem studies that will provide better understanding of the interactions among species and with their habitat. For west coast groundfish, recruitment
69
surveys are particularly relevant for species such as whiting which have tremendous variation in recruitment and recruit to the fishery at a young age. With a recruitment survey, we can better adjust harvest levels to track these short-term natural fluctuations in abundance. Recruitment surveys are also relevant for the very long-lived species that have delayed recruitment to conventional surveys and the fishery. Here the recruitment surveys will provide advance notice of longer-term shifts in abundance caused by shifts in average recruitment levels. Climate monitoring and fishery-oceanography investigations will help interpret these shifts in recruitment and further advance predictive capability. The result of these ecosystem studies will be a better assessment of the ecological impact of fishing, better understanding of the impact of factors such as the increased abundance of piscivorous pinnipeds, and potential adjustment of fishing strategies to obtain the best multispecies yields from the system.
Specific resource requirements for west coast groundfish are outlined in Table 5. The information labeled "current" in Table 5 describes the situation in January 2000. A partial step towards meeting Tier 2 needs occurred in 2001 when the NWFSC received funding to establish a small west coast groundfish observer program and conduct coastwide trawl and hydroacoustic surveys.
Data Management & Preprocessing of Data2 1 19 5 4 9 2
Conduct Assessments 6 5 4 4 8 4
Assessment Methods Research 1 1 2 3 2
Communication of Results and Follow-up Evaluations 3 1 3 2 5 7 1
Subtotal (Assessment scientists) 9 2 8 7 11 18 7
Subtotal (others) 9 31 51 6 63 69 32
Total 18 33 59 13 74 87 39
Table 5. FTEs required to meet the three Tiers of Assessment Excellence by type of activity for the Northwest Fisheries Science Center. Numbers of FTEs in each category do not necessarily reflect the actual number of individuals involved in these activities, in that some individuals may divide their time between several activities. Estimated current FTEs include in-house staff, contractors such as observers, and “other,” which includes state government biologists, and employees or contractors associated with various regional, national and international Commissions. Follow-up evaluations include the production of additional assessment outputs, evaluations of alternative management strategies, and participation in plan development teams. Numbers should be cumulated across tiers.
70
1. This table is limited to resources devoted to stock assessment of groundfish and other marine fish. Significant additional NMFS and state resources are devoted to work on salmonids.
2. “Partner” column contains minimum PSMFC and WA, OR, CA personnel working on groundfish. Many of these are supported through federal grants, including PacFIN.
3. The in house staff column represents the total number of positions as of January 2000. New funding in FY2001 is allowing development of an observer program and expansion in survey and assessment programs. Approximately 15-20 Tier 1+2 positions will be filled.
# includes 25 observers and infrastructure hired in FY 2001
* excludes 25 observers hired in FY 2001; includes a proposed additional 30 contract observers (20 in Tier 2 and 10 in Tier 3)
Alaska Fisheries Science Center
The Alaska Fisheries Science Center is responsible for Gulf of Alaska, Bering Sea and Aleutian Island groundfish assessments. The Center conducts activities in support of these assessments that include fishery independent and fishery dependent data collection programs, and fisheries oceanographic studies. The Center is also responsible for conducting fishery independent surveys and research in support of Pacific salmon and Alaskan crab assessments.
Alaskan groundfish and crab are managed according to Fishery Management Plans developed by the North Pacific Fishery Management Council (NPFMC). For the Bering Sea / Aleutian Islands region, assessment scientists currently contribute to thirteen annual groundfish assessments: walleye pollock, Pacific cod, Atka mackerel, yellowfin sole, Greenland turbot, arrowtooth flounder, rock sole, flathead sole, other flatfish, Pacific ocean perch, other rockfish, sablefish and squid and other species. For the Gulf of Alaska region, 11 assessments are produced annually: walleye pollock, Pacific cod, Atka mackerel, thornyhead, slope rockfish, pelagic shelf rockfish, demersal shelf rockfish, arrowtooth flounder, other flatfish, sablefish and other species. AFSC staff assist in the development and review of stock assessments for Bering Sea crab stocks. Staff represent the Center on numerous technical and decision making boards including the NPFMC Groundfish Plan Teams and Scientific and Statistical Committee, the North Pacific Anadromous Commission, the North Pacific Halibut Commission, and international technical committees dealing with trans-boundary stocks such as Pacific hake and Bering Sea pollock.
Bycatch limits for several species have been imposed to ensure that individual species quotas are not exceeded. Species that are designated as prohibited species include Alaskan crab (e.g. Tanner crab, blue and red king crab and snow crab), Pacific halibut, and some stocks of Pacific salmon (chinook, pink, sockeye, chum, coho and steelhead). Retention for sale of prohibited species is prohibited to dissuade any targeting by groundfish fishers. Gulf of Alaska and Bering Sea Aleutian Islands groundfish fisheries also have some bycatch and discard of unmarketable species and small sized fish that is typical of any multispecies fishery. There is some discard of marketable fish caused by the NPFMC management system for the groundfish fishery. When bycatch limits are exceeded for a species, the species can no longer be retained to discourage further catch of this species.
In-season catch composition is monitored by a major fishery-dependent data collection program. Catch is monitored by an observer program and shoreside data collection. Roughly 30,000 observer days (equivalent to 114 FTEs) are expended annually to collect data from the North Pacific groundfish fishery. All vessels capable of hosting an observer may be required to do so at the vessel's expense. As currently implemented, vessels over 125 feet length overall (LOA) are required to have an observer on board at all times when ground-fishing, vessels of 60 to 124 feet LOA are required to have observers on-board 30% of the time, and vessels under 60 feet LOA are generally exempt from the requirements for observer coverage. Most of the fishing vessels operating in the Bering Sea and Aleutian Islands exceed the 125 foot limit, while most of the fishing vessels in the Gulf of Alaska are smaller than 125 feet. The recreational harvest of groundfish in Alaskan waters is a minor component
71
of the total catch. Observers collect biological data such as otoliths, length frequencies, stomach samples and maturity stage for a variety of species. Conducting fishery independent surveys in Alaskan waters requires a major investment of shiptime and personnel. The continental shelves off Alaska make up about 74% of the total area (2,900,785 km2) of the United States continental shelf. The region is marked by adverse seasonal conditions that necessitate sophisticated equipment to ensure the safety of the crew and the accomplishment of the survey mission.
AFSC stock assessment scientists conduct research to improve the precision of their assessments, and provide technical support for the evaluation of potential impacts of proposed fishery management measures. Research activities are designed to improve the quality of stock assessments and to expand the scope of assessments to quantify the ecological impact of fishing on the Gulf of Alaska and Bering Sea ecosystems. Stock assessment scientists often serve a dual role acting as the scientific interface between the Alaska Fisheries Science Center and the North Pacific Fishery Management Council (NPFMC).
Numerous laws govern the implementation of fisheries in federal waters. AFSC staff often conduct research to evaluate the impact of fishing to comply with these legal requirements. The MSFCMA directs NMFS stock assessment scientists to provide annual status evaluations for all species managed under the NPFMC FMPs. AFSC stock assessment scientists also provide analytic assistance on many current fisheries management issues such as research activities leading to implementation of precautionary resource management, consultations and Biological Opinions regarding protected resources, and NEPA impact analyses regarding the effects of fishing on the marine environment. The National Standard Guidelines for overfishing state that "If environmental changes affect the long-term productive capacity of the stock or stock complex, one or more components of the status determination criteria must be re-specified." This requirement necessitates new research on the mechanisms underlying shifts in production. Studies have demonstrated that several groundfish, crab and salmon stocks exhibit shifts in production that show marked similarity to the time scales of distant atmospheric forcing phenomena such as the El Nino Southern Oscillation and the Pacific Decadal Oscillation. To determine whether shifts are due to human actions or environmentally induced shifts in the productive capacity of a stock or stock complex requires new research to investigate the mechanisms underlying the apparent response of key species to decadal scale changes in ocean climate.
Several species protected under the provisions of the Endangered Species Act are present in the region. Among these, the western stock of Steller sea lion has been listed as endangered. A tremendous effort is being mounted by AFSC and the North Pacific Regional Office to develop a Steller sea lion recovery plan that incorporates all aspects of human and natural risks to this marine mammal population. Principal prey items in the sea lion diet include Atka mackerel, Pacific cod, and walleye pollock. These species are also targets of large commercial fisheries. Efforts are underway to explore methods to reduce the potential for competition between commercial fisheries and Steller sea lions at crucial times of the year.
Court challenges underscore the demands on AFSC staff to conduct new research surveys, process oriented research, and assessment activities to improve our understanding of the mechanisms underlying recent declines in the Steller sea lion population and the potential role of commercial fishing in limiting its recovery. These decisions also underscore the need for additional staff to evaluate management alternatives to provide reasonable and prudent alternatives to current fishing practices.
AFSC current situation - Gulf of Alaska groundfish
Among the 100 groundfish species covered by the GOA FMP of the NPFMC, 67 are assessed at a Level 1 or better (Appendix 1). These species have been the targets of fishery monitoring and resource survey programs that provide the basic information for quantitative stock assessments. Not
72
all these assessments have the same level of information and precision. Of the 67 assessed species, only 8 are assessed using staged base models (Level 4 or above). In the case of 91 of the 100 species covered by the FMP, there is insufficient information to determine whether or not the stocks are overfished or approaching an overfished condition. Some of these species are targets of developing fisheries.
The 100 groundfish species can be roughly broken into four assemblages based upon their adult habitat and co-occurrence in the fishery. This breakout will facilitate discussion of fishery monitoring and resource survey programs:
1. Midwater schooling- Walleye pollock, eulachon and squid are amenable to acoustic survey methods. Walleye pollock supports a midwater trawl fishery with annual catch near 100,000 mt.
2. Deep slope (mostly trawlable habitat on shelf break and continental slope extending out to about 1500m bottom depth) includes primarily sablefish, dover sole, shortraker and rougheye rockfish, shortspine thornyheads, longspine thornyheads, Pacific grenadier. This assemblage supports a valuable trawl fishery, plus sablefish is a target of pot and hook&line fishers.
3. Demersal Shelf (mostly trawl caught species on continental shelf and upper slope, but many species occur over rocky habitat and some species have significant off-bottom tendencies). This assemblage includes rockfish species, flatfish, Atka mackerel and Pacific cod. The fishery is trawl for most species; however, Pacific cod is taken by hook&line and pot gear.
4. Pelagic shelf rockfish (mostly in high relief habitat) includes several of rockfish species.
AFSC current situation - Bering Sea / Aleutian Islands (BSAI)
Among the 145 groundfish species covered by the BSAI FMP of the NPFMC, 133 are assessed at a Level 1 or better (Appendix 1). These species exhibit great diversity in life history traits. Many have been the targets of fishery monitoring and resource survey programs that provide the basic information for quantitative stock assessments. Not all these assessments have the same level of information and precision. Of the 133 assessed species, only 15 are assessed using staged base models (Level 4 or above). In the case of 128 of the 145 species covered by the FMP, there is insufficient information to determine whether or not the stocks are overfished or approaching an overfished condition. Some of these species are the target of developing fisheries.
The 145 groundfish species can be roughly broken into four assemblages based upon their adult habitat and co-occurrence in the fishery. This breakout will facilitate discussion of fishery monitoring and resource survey programs:
1. Midwater schooling- Walleye pollock, eulachon and squid are amenable to acoustic survey methods. Walleye pollock supports a midwater trawl fishery with annual catch near 1,000,000 mt.
2. Deep slope (mostly trawlable habitat on shelf break and continental slope extending out to about 1500m bottom depth) includes primarily sablefish, Greenland turbot, shortraker and rougheye rockfish, and shortspine thornyheads. This assemblage supports a valuable trawl fishery, plus sablefish is a target of pot and hook&line fishers.
3. Demersal Shelf (mostly trawl caught species on continental shelf and upper slope, but many species occur over rocky habitat and some species have significant off-bottom tendencies). This assemblage includes rockfish, flatfish, Atka mackerel, crab and Pacific cod. The fishery for this assemblage is primarily trawl for most species however, Pacific cod are taken by hook&line and pot gear, and crab are taken with pot gear.
73
4. Pelagic shelf rockfish (mostly in high relief habitat) includes several of rockfish species.
Three crab stocks are currently listed as overfished: Bering Sea Tanner crab, Bering Sea snow crab and Saint Mathews Island Blue King Crab. Rebuilding plans need to be developed and subsequently monitored for these crab stocks. Building such plans will be difficult given the lack of life history and stage based information for these resources. Increased stock assessment effort will primarily elucidate the underlying factors contributing to recent declines in production. AFSC programs and staffing required to meet the three tiers of excellence
Tier 1: Improve stock assessments using existing data
Bringing all Alaskan groundfish and crab species to a Tier 1 level will require additional stock assessment, data processing and ecological staff to make the best use of existing data. New personnel identified under Tier 1 (Table 6) would utilize existing fishery dependent and fishery independent data to facilitate the development of assessments for several new species and to improve existing assessments to the extent possible. To accomplish the first part of this objective, additional staff are needed to construct assessments for species where historical data is spotty or uncertain. AFSC scientists are exploring modeling approaches that draw on life history information from similar species to parameterize first generation assessments for poorly studied species. Additional assessment scientists could assist in developing overfishing criteria when information regarding the status of the stock is missing or intermittent. Assessment scientists and statisticians are needed to assist in reviewing the sampling design of proposed or existing fishery independent and fishery dependent sampling programs. This research effort would require a retrospective analysis of existing data to evaluate the efficiency of the current data collection program and to make recommendations for improvements in sampling design. Additional analytical staff could conduct research to better quantify and communicate the uncertainty in current assessments. Improved models will structure implementation of a more formal precautionary approach to harvest management. A final area of improvement is in the development of assessment models that fully utilize existing information on top down (predator/prey) influences on time trends in natural mortality, and bottom up on marine survival at early life stages in spatially explicit modes. AFSC is well positioned to advance this type of state-of-the-art stock assessment. The combination of a long history of data collection on the food habits of groundfish in the Eastern Bering Sea and Gulf of Alaska make the development of models that model top down forcing a realistic goal. Likewise, the long history of fisheries oceanographic process oriented research supported by the Fisheries Oceanography Coordinated Investigations provides the necessary knowledge of lower trophic level forcing required to implement a fully coupled model.
Tier 2: Elevate stock assessments to new national standards
Medium-term improvements in major data sources can lead to substantial improvements in assessment precision within about 10 years. These include major programs such as periodic resource assessment surveys, expanding and improving at-sea monitoring of total catch, collection of genetic stock structure data for more species, and evaluation of fish association with particular habitats. Beyond routine monitoring, research should be devoted to studies of factors that may influence survey standardization, and development of cost-effective survey technologies that are not susceptible to environmental influences on standardization.
Additional staff would be required to achieve a Tier 2 level of analysis for BSAI and GOA groundfish. Tier 2 envisions that assessments of core species would be upgraded at least Level 3 and would provide adequate baseline assessments for all managed species. Fishery dependent and fishery independent data collection are needed to achieve Tier 2. These staff members would be responsible for compiling and analyzing data for species currently managed as species groups (e.g. other flatfish, other rockfish and other species).
74
GOA assessment needs to achieve Tier 2
In the current implementation of the observer program, observers monitor catch and collect biological information on 70 of the 100 groundfish species in the Gulf of Alaska. Several minor species are classified into general categories. Skates are almost always recorded as "skate unidentified," with very few exceptions between 1990-1998. In the Gulf of Alaska, at least 80% of the recorded sculpin catch by year is recorded as "sculpin unidentified," with the remainder of the catch identified to the genus level. Only small amounts (<2%) of the sculpin catch each year were identified to species. Likewise, octopus and squid are generally not identified to species in the observer database. Octopus can only be recorded as "octopus unidentified," or "pelagic octopus unidentified." Eulachon and capelin are recorded to species more often than sculpins but in 1998, approximately 80% of their catch was recorded as "smelt unidentified." Monitoring the catch of these minor species would require additional staff to train and implement an expanded observer program.
Groundfish populations are routinely monitored by fishery independent surveys. A longline survey is conducted annually for sablefish. A gulf-wide trawl survey of the shelf areas of the Gulf of Alaska has been conducted on a triennial basis since 1984. Current operating plans call for future surveys to occur on a biennial basis. An acoustic survey of a major spawning concentration of walleye pollock in Shelikof Strait is conducted on an annual basis. These surveys provide a calibrated abundance measure (Level 2 or above) for only 4 species (Appendix 1). These surveys provide an index of abundance for 83 species (Appendix 1). To achieve Tier 2 level analysis additional effort should be devoted to obtaining and analyzing the life history of characteristics of species captured in the longline or trawl surveys (e.g. regional differences in growth, maturity, and habitat association).
For species such as small soft-bottom roundfishes (sculpins, poachers, eelpouts, and skates) the existing time series of trawl survey data is inconsistent because of differing levels of species identification. Starting in 1999 this problem was nearly eliminated because all survey vessels had new species identification guides that included photos of all known species. Species identification has therefore been greatly increased with very little cost. An existing problem for these species in the GOA, however, is that they are likely to have very low catchability by the survey trawls and it is uncertain how well research vessel CPUE tracks stock size. Assessment of these species could be improved using auxiliary trawl experiments to measure escapement under the footrope.Many species of rockfish are not well sampled because they occur in areas that are too rough to be sampled with our usual survey nets and, additionally, some species (e.g. Pacific Ocean perch, northern rockfish, and dusky rockfish) are extremely patchy and not likely to be well sampled in the present bottom trawl survey. Considerable work has been done in attempt to develop a rockfish specific survey, but the best approach has yet to be developed. To improve the survey assessment of rockfish we need more research on gear design and sampling techniques. Once the appropriate technique is developed, it will undoubtedly require a distinctly different survey design than is now used and could not be incorporated into the current normal survey operations. Additional work will be required to develop appropriate techniques for the semi-pelagic species.
Fishery independent collections of age, length frequency and size at maturity are obtained for the core species (about 20 species, mostly rockfish and slope species, split between GOA, AI, and EBS). Expanding the age collections to include the remaining species would require collecting otoliths for additional species on surveys and could be accomplished without a large increase in money or manpower. However, additional staff would be needed to conduct the age determinations. Obtaining size at maturity information would require a considerable increase in research cruises to collect species at a time that is close enough to spawning so that mature or recently spent fish are easily recognized. Most survey or research cruises at the AFSC are currently conducted in the summer, after most species have completed spawning. In addition, a sampling strategy must be worked out so that a sufficient number of small and immature fish are collected.
Acoustic-trawl surveys in Alaska conducted by the Resource Assessment and Conservation Ecology Division (RACE) focus on walleye pollock as a target species. All aspects of survey design (e.g. area, timing, sampling intensity, etc.) are devised to assess the distribution and abundance of pollock.
75
Pollock is ideally suited for acoustic assessment due to its semi-demersal nature, widespread distribution, and tendency to form monospecific aggregations. During RACE acoustic-trawl surveys, other pelagic fish species are encountered in very low numbers. Existing acoustic data could provide some information on eulachon occurrence observed during the 1980-1998 winter-spring Shelikof Strait surveys. Expanding the current acoustic program to routinely monitor eulachon would require a significant effort, including both staff and vessel time. Additional trawling would be needed and extended tracklines may be necessary.
Application of an acoustic-trawl survey approach to other FMP species (e.g. rockfish, capelin, squid, etc.) has been successful under certain circumstances, but would require a substantial amount of work (e.g. literature reviews and feasibility studies) merely to make a good guess of the resources required. A significant amount of preliminary research would be necessary to simply estimate the staff and funding necessary to fund each project.
Bering Sea and Aleutian Island groundfish populations are routinely monitored by fishery independent surveys. A longline survey for sablefish is conducted in alternate years in either the Bering Sea or the Aleutian Islands. Groundfish trawl surveys of the Eastern Bering Sea shelf have been conducted on an annual basis since 1979. Groundfish trawl surveys are conducted on a triennial basis in the Aleutian Islands region. Current operating plans call for future surveys of the Aleutian Islands region on a biennial basis. Acoustic surveys of major spawning concentrations of walleye pollock near Bogoslof Island are conducted on an annual basis. An acoustic survey of walleye pollock on the Eastern Bering Sea shelf has been conducted on a triennial basis since 1979. These surveys provide a calibrated abundance measure (Level 2 or above) for 76 species (Appendix 1). These surveys provide an index of abundance (Level 1) for an additional 47 species (Appendix 1).
As in the case of the Gulf of Alaska, the existing time series of trawl survey data for species such as small soft-bottom roundfishes (sculpins, poachers, eelpouts, and skates) may provide inconsistent results because of differing levels of species identification. This problem has been addressed through the addition of new species identification guides which included photos of all known species. However, as in the GOA, it is likely that these species have very low catchability by the survey trawls in the Aleutian Islands region. Assessment of these species could be improved using auxiliary trawl experiments to measure escapement under the footrope.
Many species of rockfish are not well sampled by the Aleutian Island trawl survey because they occur in areas that are too rough to be sampled with our usual survey nets and, additionally, some species (e.g. Pacific Ocean perch and northern rockfish) are extremely patchy and not likely to be well sampled in the present bottom trawl surveys. Nevertheless, the current Aleutian Island trawl survey does provide an index of abundance for several rockfish species, and rockfish age data are collected during the surveys. Additional research is needed to design a calibrated survey for rockfish.Staffing needs to expand fishery independent collections of age, length frequency and size at maturity were discussed in the section on GOA fishery independent surveys.
During Midwater Assessment and Conservation Engineering (MACE) acoustic-trawl surveys, other pelagic fish species are encountered in very low numbers. Existing acoustic data could provide some information on eulachon occurrence observed during the 1980-1998 winter-spring Bogoslof Island surveys. Expanding the current acoustic program to routinely monitor eulachon would require a significant effort - including both staff and vessel time. Additional trawling would be needed and extended tracklines may be necessary.
Tier 3: Next generation assessments
A substantial increase in stock assessment staff would be required to achieve a Tier 3 level of analysis for BSAI and GOA groundfish. Tier 3 assessments would account for both biological and technological interactions and integration of biological and environmental data that may lead to more
76
reliable long-range predictions. To accomplish this goal necessitates the implementation of fisheries oceanographic research programs for a broad spectrum of species. At the current time AFSC primarily supports fisheries oceanographic research on walleye pollock. Likewise, additional staff would be required to provide information on potential trophic interactions between species. Assessment scientists would be required to develop a broader spectrum of assessment modeling tools to address the complex interactions envisioned under Tier 3. In addition to the complex modeling activities envisioned for core species, additional stock assessment scientists would be required to conduct basic assessment functions for all species covered by the FMP.
Table 6. FTEs required to meet the three Tiers of Assessment Excellence by type of activity for the Alaska Fisheries Science Center. Numbers of FTEs in each category do not necessarily reflect the actual number of individuals involved in these activities, in that some individuals may divide their time between several activities. Estimated current FTEs include in-house staff, contractors such as observers, and “other,” which includes state government biologists, and employees or contractors associated with various regional, national and international Commissions. Follow-up evaluations include the production of additional assessment outputs, evaluations of alternative management strategies, and participation in plan development teams. Numbers should be cumulated across tiers.
* Observer program includes shore-side samplers.+ Recreational data not applicable.
77
E. Summary: National Resource Requirements
Current FTEs and FTEs required to achieve the objectives of the three Tiers of assessment Excellence are summarized by Science Center, Tiers of Assessment Excellence, and activity in Figure 15.
Figure 15. Summary of FTE requirementsby Science Center, Tiers of Assessment Excellence,and activity.
78
Current situation
0 50 100 150 200
Comm catch
Rec catch
Observers
FI surveys
Process samples
Data management
Assessments
Methods research
Follow-up analysis
FTEs (incl. contractors and partners)
NE
SE
SW
NW
AK
Tier 1 requirements
0 20 40 60 80 100
Comm catch
Rec catch
Observers
FI surveys
Process samples
Data management
Assessments
Methods research
Follow-up analysis
FTEs (incl. contractors and partners)
NE
SE
SW
NW
AK
Tier 2 requirements
0 20 40 60 80 100
Comm catch
Rec catch
Observers
FI surveys
Process samples
Data management
Assessments
Methods research
Follow-up analysis
FTEs (incl. contractors and partners)
NE
SE
SW
NW
AK
Tier 3 requirements
0 20 40 60 80 100
Comm catch
Rec catch
Observers
FI surveys
Process samples
Data management
Assessments
Methods research
Follow-up analysis
FTEs (incl. contractors and partners)
NE
SE
SW
NW
AK
Similar but more detailed summaries are provided in Tables 7 and 8. Table 7 sums the FTE requirements for Tiers 1, 2 and 3 by major activity for all five NMFS Science Centers combined. Almost three times as many additional staff are needed to collect, manage and process data, as compared to additional staff needed to conduct and communicate stock assessments, to evaluate alternative management strategies, and to conduct research into assessment methods. By far the greatest overall need is for observers for Tier 2, particularly in the Southeast, Northwest and Alaska Science Centers. The second greatest overall need is for staff to participate in fishery-independent surveys (note, however, that this is contingent on the acquisition of adequate Fisheries Research Vessels, as outlined in the NOAA Fisheries Data Acquisition Plan, NMFS 1998c; Appendix 3).
Table 7. FTEs required to meet the three Tiers of Assessment Excellence by type of activity for all NMFS Science Centers combined. Numbers of FTEs in each category do not necessarily reflect the actual number of individuals involved in these activities, in that some individuals may divide their time between several activities. Estimated current FTEs include in-house staff, contractors such as observers, and “other,” which includes state government biologists, and employees or contractors associated with various regional, national and international Commissions. Follow-up evaluations include the production of additional assessment outputs, evaluations of alternative management strategies, and participation in plan development teams. Numbers should be cumulated across tiers.
Table 8 summarizes the total FTEs requirements for Tiers 1, 2 and 3 for each Science Center and all Centers combined. In terms of current in-house staff, contract employees, and others who provide assessment data (e.g. state government biologists, and employees or contractors associated with various regional , national and international Commissions), the Alaska Center is the largest with 330
79
FTEs, the Northeast Center is second with 188, the Southeast Center is third with 147, the Southwest Center is fourth with 121, and the Northwest Center has 110. (These numbers apply to the baseline of January 2000, except where otherwise noted in Tables 2-6; in particular, the Northwest Center total includes 25 observers hired in FY2001). Considering the sum of Tier 1 and 2 requirements, the Alaska, Northeast, and Southeast Centers require additions of about 30-40% to existing staff, whereas the Southwest Center requires an addition of about 70%, and the Northwest Center an addition of about 80%. To calculate the approximate costs of new FTEs to satisfy Tiers 1, 2 and 3, a multiplying factor of $150,000 per annum was used. This number takes into account salary and benefits, travel, training, equipment and individual Information Technology needs (although not the core systems needed for data management and communications); i.e. the multiplier covers everything except major infrastructure, particularly new workspace and buildings that may be required.
Table 8. Total Full-Time Equivalents (FTEs) required to meet the three Tiers of Assessment Excellence for each Science Center and all Centers combined. Estimated current FTEs include in-house staff, contractors such as observers, and “other,” which includes state government biologists, and employees or contractors associated with various regional, national and international Commissions. Numbers should be cumulated across tiers.
The numbers of additional staff indicated in Tables 2-8 may seem staggering, but these numbers have been carefully thought through by the Task Force members. They simply represent the increasing demands being placed on NMFS to assess more stocks more frequently, and with greater accuracy, precision and timeliness; to incorporate associated non-target species and other ecosystem considerations into the analyses; and to evaluate a wider array of management options on increasingly finer temporal and spatial scales. In addition, as outlined in the Introduction, the FTE requirements detailed here are meant to complement other related NMFS plans such as the Data Acquisition Plan (NMFS 1998a; Appendix 3), which is primarily concerned with the costs of operating dedicated fishery research vessels and purchasing charter boat days at sea; the Stock Assessment Toolbox Plan (Appendix 4); the Center for Independent Experts Program (Appendix 5); the Proposed Implementation of a Fishing Vessel Registration and Fisheries Information Management System (Appendix 8); the NMFS Bycatch Plan (Appendix 9); the National Observer Program (Appendix 10), the Social Sciences Plan (Appendix 11), the Advanced Technologies Working Group (Appendix 12), and relevant fisheries oceanography initiatives (e.g. Appendix 13). In order to develop a comprehensive ecosystem approach to fisheries stock assessments and management, and to estimate the actual costs of implementing ecosystem-based management (EBM), these and related plans, initiatives and activities should be merged into an umbrella plan.
F. The Benefits of Implementing the Stock Assessment Plan
The benefits of implementing the Stock Assessment Improvement Plan are numerous and diverse. With adequate additional trained staff, existing databases can be mined for material to improve
80
analyses for major target stocks and for currently overfished stocks, and to develop new analyses for stocks of currently unknown status. The benefits arising from Tier 1 alone will, however, be limited because the most important need is for new and expanded data collection programs. Ultimately, these will lead to greater numbers of stocks being assessed with higher frequency, and greater accuracy, precision and timeliness. Incorporation of ecosystem considerations into the analyses will facilitate analysis of trade-offs between harvesting target species and protecting non-target species such as marine mammals. The enhanced data collection and analysis activities proposed herein will also result in more accurate projections of future stock status under various alternative management strategies, and will enable evaluation of an increasingly wider array of management options on finer temporal and spatial scales, both of which will improve the basis for management decisions.
An improved knowledge base, improved ongoing data collection programs, and more comprehensive models should reduce the frequency of risk-prone management decisions, which have been common in many regions of the United States to date. This in turn will enable higher catches on average, at less risk to fisheries resources. The risk of non-target marine species becoming rare or extinct should also be considerably diminished, particularly in comparison to the current situation in which species could potentially be disappearing without us even being aware of it.
Overall, implementation of the Stock Assessment Improvement Plan will result in a greatly improved knowledge base for marine species, and a better basis for risk-averse management decisions which will result in fewer depleted or overfished stocks and greater stability and profitability in the fish harvesting sector. However, it should be noted that improved knowledge and enhanced stock assessment capability will not by themselves result in fewer overfished stocks and a more stable fishing industry; there must be a concomitant commitment to responsible fisheries management and fisheries policy development.
Another benefit of implementing the SAIP will be to improve relations between NMFS and other line offices within NOAA, other federal agencies, state agencies, academia, the commercial and recreational fishing industries, and environmental groups by promoting cooperative research and other types of partnerships. NMFS' own programs and those developed through such partnerships should also result in spin-offs in terms of monitoring information and research that can provide input into other programs; for example, risk and damage assessments. The resulting database of spatial and temporal distributions of marine species, associations between species, oceanographic variables, and habitat relationships will also be an invaluable source of raw material with which to develop and test hypotheses about population dynamics and ecosystem structure and function.
81
V. Recommendations
1. NMFS should aggressively pursue a course of action focusing on new budget and staffing initiatives to modernize its data collection and assessment capabilities. As a minimum, NMFS should attempt to bring stock assessment science to at least Tier 2 (Section IVB), and should initiate dialog both within house and with the public to determine how far-reaching and comprehensive Tier 3 should be. This will require hiring or contracting considerable numbers of additional qualified staff for data collection, data processing, data management, stock assessments, and evaluation of alternative management strategies, to ensure adequate data and analyses on which to base conservation and management decisions, now and into the future.
2. In order to improve the credibility of its stock assessment science, in addition to acquiring the resources needed to produce the best possible science, NMFS must improve its public image, both with constituents and within NOAA itself. There appears to be little awareness that NMFS employs the largest collection of world-renowned fisheries scientists of any agency, university, or other organization worldwide, and that fisheries science is a field where new and useful methodologies have mostly originated within government agencies (including those of foreign governments), rather than within academia.
3. NMFS also needs to make fishers, politicians, and the public aware of the benefits of truly precautionary management which will reduce the risks of overexploiting fisheries resources and associated species, and will ultimately lead to greater stability in the fishing industry.
4. Another avenue of public awareness which NMFS should pursue is to educate and discuss with interested parties (especially constituents and congressional aides) the implications of calls to incorporate ecosystem considerations into fisheries assessment and management. In particular, NMFS should request input on what different groups of people actually mean by "ecosystem considerations," and then jointly evaluate the costs and benefits of adopting such approaches. NMFS needs to work harder to align public expectation with reality.
5. NMFS needs to be more proactive in communicating the fact that the methodologies employed to conduct stock assessments are far less problematic than is the quality, quantity, and type of data available for analysis. NMFS needs to seek out and develop cooperative arrangements with stakeholders to improve the quality, quantity, and type of data provided.
6. In order to make substantial progress towards collecting the data needed to improve stock assessments, particularly next generation assessments, it is essential that NMFS develop further partnerships and cooperative research programs with other federal agencies, state agencies, private foundations, universities, commercial and recreational fishing organizations and individuals, environmental groups, and others with a vested interest in collecting similar types of data, although often for other purposes. Many such partnerships already exist (Appendix 21), but many more are needed. Programs involving cooperative research with the fishing industry (Appendix 22) should continue to be developed and expanded as mechanisms for providing data relevant to improving the quality of stock assessments.
7. In order to enhance progress in the development of new models and methodologies for conducting stock assessments, performing risk analyses and stock projections, and constructing multispecies and ecosystem models, NMFS must free up more time for existing quantitative staff to pursue such research and engage more fully in professional development activities which, in turn, implies the need to also hire or contract additional qualified quantitative staff.
82
8. In order to ensure a future supply of quantitative scientists to perform stock assessments and related activities, NMFS must augment existing programs that fund graduate study in appropriate fields.
9. In order to maintain the high caliber of current analytical staff, NMFS must develop a comprehensive training program to enhance the quantitative skills of in-house staff.
10. In order to develop more comprehensive and integrated future budget initiatives geared towards modernizing fisheries assessments and management, NMFS should prepare an umbrella plan that integrates all relevant existing documents on these themes; for example, the current Stock Assessment Improvement Plan, the NOAA Fisheries Data Acquisition Plan (Appendix 3), the NMFS Strategic Plan for Fisheries Research (NMFS 2001b), the Proposed Implementation of a Fishing Vessel Registration and Fisheries Information Management System (Appendix 8), the NMFS Bycatch Plan (Appendix 9), the National Observer Program (Appendix 10), the Social Sciences Plan (Appendix 11), the Advanced Technologies Working Group (Appendix 12), and relevant fisheries oceanography initiatives (e.g. Appendix 13).
83
References
NMFS 1997a. NOAA Fisheries Strategic Plan. National Marine Fisheries Service, NOAA, Department of Commerce. Silver Spring, Maryland.
NMFS 1997b. Report to Congress on the Status of Fisheries of the United States. National Marine Fisheries Service, NOAA, Department of Commerce. Silver Spring, Maryland.
NMFS 1998a. NOAA Fisheries Data Acquisition Plan. National Marine Fisheries Service, NOAA, Department of Commerce. Silver Spring, Maryland.
NMFS 1998b. Report to Congress on the Status of Fisheries of the United States. National Marine Fisheries Service, NOAA, Department of Commerce. Silver Spring, Maryland.
NMFS 1998c. NMFS Strategic Plan for Fisheries Research. National Marine Fisheries Service, NOAA, Department of Commerce. Silver Spring, Maryland.
NMFS 1998d. Managing the Nation's Bycatch: Programs, Activities, and Recommendations for the National Marine Fisheries Service. National Marine Fisheries Service, U.S. Department of Commerce, Silver Spring, Maryland. 174 p.
NMFS 1999a. Report to Congress on the Status of Fisheries of the United States. National Marine Fisheries Service, NOAA, Department of Commerce. Silver Spring, Maryland.
NMFS 1999b. Ecosystem-Based Fishery Management: a Report to Congress by the Ecosystem Principles Advisory Panel. National Marine Fisheries Service, U.S. Department of Commerce, Silver Spring, Maryland. 54 p.
NMFS 2001a. Report to Congress on the Status of Fisheries of the United States. National Marine Fisheries Service, NOAA, Department of Commerce. Silver Spring, Maryland.
NMFS 2001b. NMFS Strategic Plan for Fisheries Research. National Marine Fisheries Service, NOAA, Department of Commerce. Silver Spring, Maryland. 88 p.
NRC 1998a. Improving Fish Stock Assessments. National Research Council. National Academy Press. Washington, D.C. 177 p.
NRC 1998b. Review of Northeast Fishery Stock Assessments. National Research Council. National Academy Press. Washington, D.C. 128 p.
NRC 1999. Sustaining Marine Fisheries. National Research Council. National Academy Press. Washington, D.C. 164 p.
NRC 2000. Improving the Collection, Management, and Use of Marine Fisheries Data. National Academy Press. Washington, D.C. 236 p.
Restrepo, V.R., Thompson, G.G., Mace, P.M., Gabriel, W.L., Low, L.L., MacCall, A.D., Methot, R.D., Powers, J.E., Taylor, B.L., Wade, P.R. and Witzig, J.F. (1998) Technical Guidance on the Use of Precautionary Approaches to Implementing National Standard 1 of the Magnuson-Stevens Fishery Conservation and Management Act. NOAA Technical Memorandum NMFS-F/SPO-31. 54 p.
84
Acknowledgments
The National Task Force for Improving Fish Stock Assessments would like to thank the NMFS Science Center assessment scientists who participated in the questionnaire survey. We are also grateful for the many insightful comments received from various scientists at the Science Centers and at NMFS Headquarters during the review period. Lastly, we thank Allen Shimada (NMFS Office of Science and Technology), Betty Holmes (NEFSC), and Shelley Arenas and Dave Stanton (NMFS Scientific Publications Office) for their help in producing the final report.
85
Acronyms
ABC - Allowable Biological CatchAFSC - Alaska Fisheries Science CenterAI - Aleutian IslandsASMFC - Atlantic States Marine Fisheries CommissionBSAI - Bering Sea and Aleutian IslandsCIE - Center for Independent ExpertsCPUE - Catch Per Unit EffortCSIRO - Commonwealth Scientific and Industrial Research Organization (Australia)DAS - Days At SeaEBM - Ecosystem-Based ManagementEBS - Eastern Bering SeaEEZ - Exclusive Economic ZoneESA - Endangered Species ActESU - Evolutionarily Significant UnitsFFA - South Pacific Forum Fisheries AgencyFIS - Fisheries Information SystemFMC - Fishery Management CouncilFMP - Fishery Management PlanFRV - Fishery Research VesselFSP - Fisheries Strategic PlanFTE - Full-Time Equivalent (applied to numbers of in-house staff or contractors)FY - Fiscal YearGLOBEC - Global ocean Ecosystem dynamicsGOA - Gulf of AlaskaGOM - Gulf of MexicoHMS - Highly Migratory SpeciesIATTC - Inter-American Tropical Tuna CommissionICCAT - International Commission for the Conservation of Atlantic TunasICES - International Commission for the Exploration of the SeaISC - Interim Scientific Committee for Tunas and Tuna-like Species in the North Pacific OceanLOA - Length OverAllMFCMA - Magnuson Fishery Conservation and Management ActMHLC - Multi-lateral High Level ConferenceMPA - Marine Protected AreaMRFSS - Marine Recreational Fisheries Statistics SurveyMSFCMA - Magnuson-Stevens Fishery Conservation and Management ActMSY - Maximum Sustainable YieldNASCO - North Atlantic Salmon Conservation OrganizationNEFSC - Northeast Fisheries Science CenterNEPA - National Environmental Protection ActNMFS - National Marine Fisheries ServiceNOAA - National Oceanic and Atmospheric AdministrationNRC - National Research CouncilNRIFSF - National Research Institute for Far Seas FisheriesNWFSC - Northwest Fisheries Science CenterOFL - Overfishing LevelPDT - Plan Development TeamPSMFC - Pacific States Marine Fisheries CommissionROV - Remotely Operated VehicleSAFE - Stock Assessment and Fishery EvaluationSAM - Statistical Assessment ModelSARC - Stock Assessment Review Committee (NEFSC)SAW - Stock Assessment Workshop (NEFSC)
86
SCTB - Standing Committee on Tuna and BillfishSEFSC - Southeast Fisheries Science CenterSFA - Sustainable Fisheries Act (1996)SPC - Secretariat of the Pacific CommunitySQAP - Science Quality Assurance ProgramSSC - Scientific and Statistical CommitteeSTAR - Stock Assessment Review PanelSWFSC - Southwest Fisheries Science CenterTRAC - Transboundary Resource Assessment CommitteeVTR - Vessel Trip ReportWG - Working Group
87
Appendix 1. Levels of input data (catch, abundance and life history parameters), assessment methodology and assessment frequency for the 904 stocks listed in the NMFS (1999a) Report to Congress on the Status of Fisheries of the United States. See Figure 3 and the text for a description of the levels, Figure 4 for graphical summaries and Table 1 for tabular summaries.
Fishery Management Plan Stock Jurisdiction Catch Abundance Life
Appendix 2. Summary of the NMFS Science Quality Assurance Program
NMFS is charged with the stewardship of living marine resources for the benefit of the nation through science-based conservation and management. High quality science provides the foundation upon which NMFS operates to fulfill its stewardship mission. Fisheries management has become increasingly more complex through time, creating ever-growing, and increasingly sophisticated demands on the agency's science programs. Meanwhile, management decisions and the science upon which they are based have also come under increasing scrutiny from the fishing industry and environmental groups and, in extreme cases, have become the subject of law suits.
NMFS, throughout its history, has made consistent investments in conducting high-quality science. The Office of Science and Technology and each of the Fisheries Science Centers implement measures to ensure the quality of their science. The Science Quality Assurance Program (SQAP) was established to document, formalize and, where appropriate, standardize these collective efforts. The primary objective of this process is to ensure that NMFS' fisheries science is relevant, timely, objective and accurate. By combining several existing and some new programs into a coherent plan, the SQAP will provide a comprehensive examination of science quality issues within NMFS diverse scientific enterprise. Plan components include:
Strategic Plan for Fisheries Research (see the Introduction to this document for a summary of the goals and objectives)
This five-year plan outlines measures for meeting the requirements of the Sustainable Fisheries Act of 1996. Priorities and recent accomplishments on research areas stipulated by the Act are identified for each of the Fisheries Science Centers. A new edition of the plan will be released in early 2002.
Stock Assessment Improvement Plan (this document)
The SAIP is the report of the NMFS National Task Force for Improving Fish Stock Assessments. The Task Force consists of Headquarters and Science Center scientists. The plan also addresses recommendations made in the National Research Council study on Improving Fish Stock Assessments (NRC 1998).
NOAA Fisheries Data Acquisition Plan (Appendix 3)
This plan outlines a strategy for acquiring the at-sea data needed to manage the nation's living marine resources. Recommendations for the appropriate blend of research platforms to ensure a consistent supply of high quality data into the stock assessment process are made.
NMFS Fisheries Science Center Accreditation
NMFS Fisheries Science Center Directors and the Office of Science and Technology will develop a set of standards designed to maintain and continually improve the high quality of NMFS science, including field activities, laboratory analyses, data handling and analyses, and reporting of results.
The purpose of FACT is to develop a set of standardized and verified software for conducting stock assessments. The toolbox allows analysts to use a variety of assessment models to select options and produce diagnostics appropriate to a particular resource assessment methodology. The suite of programs includes modules for data input, formatting and error checking, and exploratory data analyses for a series of assessment approaches.
A28
Center for Independent Experts (Appendix 5)
NMFS maintains a pool of qualified scientists from outside the agency who can aid in the design and review of NMFS scientific endeavors and products. The core principle is that the CIE pool of experts be composed of independent (non-NMFS) members having the requisite technical and scientific expertise to provide impartial and comprehensive comments and advice.
External Independent Studies
Periodic studies by the National Research Council are commissioned by NMFS to provide an independent scientific examination and research recommendations on issues of national importance.
NMFS - Sea Grant Joint Graduate Fellowship Program in Population Dynamics and Marine Resource Economics (Appendix 6)
The program awards fellowships to Ph.D. students to encourage qualified applicants to pursue careers in population dynamics and stock assessment methodology or marine resource economics, to foster closer relationships between academic scientists and NMFS, and to provide real-world experience to graduate students and accelerate their career development.
CONTACT: Bonnie Ponwith, Office of Science and Technology, National Marine Fisheries Service.
A29
Appendix 3. Executive Summary from the NOAA Fisheries DataAcquisition Plan (NMFS 1998a)
NOAA Fisheries is charged with stewardship of the Nation's living marine resources through science-based conservation and management and promotion of the health of their environment. At-sea research and monitoring is the foundation upon which stewardship is based. This report responds to OMB's request for a data acquisition plan to outline how NOAA Fisheries' data requirements will be met over the next five years. The report deals with the interface of three highly dynamic systems: marine resources and their environment, the science and technology used to understand and manage them, and the policy arena that directs management and distributes fiscal resources. Linkages among these systems are robust; changes in one greatly influence the status of the others. Good planning is essential to the success of any mission, but planning for the future in this dynamic environment is particularly challenging. This Data Acquisition Plan (Plan) describes NOAA Fisheries' approach to provide the best possible information upon which to manage the Nation's living marine resources.
The Plan describes the evolution of NOAA Fisheries' mission, and its research fleet. Legislation which has influenced the stewardship process of marine resources, and its impact on data requirements is discussed. Changes on the horizon, such as management philosophies and impending technological advances, which will influence the way resources are researched, monitored and managed in the future are evaluated. All these factors were considered as the Plan was developed to achieve the flexibility required to properly manage a dynamic system in a dynamic environment.
A complex web of diverse data feeds into the resource management process. The critical importance of fisheries-independent data, requiring at-sea research is discussed. The Plan covers how decisions are made on what data are needed, how the criteria for data quality and quantity are established, and what tools are required to collect data that meet these criteria in the most cost effective manner. Available research platforms are evaluated, including NOAA or other fishery research vessels (FRVs), chartered fishing vessels and university ships.
The Plan discusses several options to meet the data requirements which were analyzed by a multi-disciplinary team from government agencies, academic institutions and private industry. They determined that a new generation of FRVs was needed. The central philosophy of the Plan is to construct a core fleet of purpose-built, dedicated FRVs, and integrate them with chartered vessels from the academic and private industry fleets. Acoustic quieting will reduce behavioral responses of species targeted in surveys and minimize noise interference to hydroacoustic signals. The ships must have the speed, power and endurance to allow acoustic and trawl surveys at the shelf edge. The ships must have adequate berthing to support a full scientific complement, and be configured to support laboratories, computers and multi-gear (e.g., trawl, longline, oceanographic) capabilities. Further, the ships must be available for fisheries missions for at least a decade to protect the integrity of long-term resource surveys. Lastly, their design should accommodate technology development and mission changes over their service lives.
At-sea data are now collected by the existing NOAA fleet using 1,877 days at sea (DAS), supplemented by 1,227 DAS of chartered university and private industry vessels. NOAA Fisheries convened a workshop of stock assessment and vessel experts to review the requirements for DAS and how they were determined. The study concluded that 9.3 ship years of FRV time, supplemented with non-FRV (e.g. fishing vessel, research vessel) charters, is needed to meet at-sea data requirements. The Plan calls for the existing fisheries vessels in the NOAA Fleet to be phased out, as four purpose-built FRVs are constructed deployed and calibrated for service. NOAA will collaborate with UNOLS and the private sector to develop a means of meeting the remaining ship needs with chartered vessels.
An external review of the Plan was performed, and the report was provided to NOAA Fisheries in May 1998. The report concluded that construction of a core fleet of purpose-built vessels is a good approach, that the FRVs, as designed, will be outstanding, will serve the nation extremely well as the
A30
core of a dedicated fisheries fleet for their full projected lifetime, and that the vessels are not over specified. Further study of vessel acquisition management, ownership, and operation was encouraged, and NOAA Fisheries is engaged in those studies now.
NOAA bears the stewardship responsibility for the largest EEZ in the world, and to perform that mission, it must have the proper tools. New legislation, management philosophies and scientific advancements have created new opportunities to improve fisheries management. Providing appropriate support will enable NOAA to capitalize on these opportunities, to the economic benefit of the Nation and integrity of our ecosystems.
CONTACT: Bonnie Ponwith, Office of Science and Technology, National Marine Fisheries Service.
A31
Appendix 4. Summary Description of the NMFS Stock Assessment Toolbox
A Windows-based desktop application, the Fisheries Assessment Computational Toolbox (FACT), has been designed to assist fisheries scientists conducting fisheries stock assessments. The software was developed at NMFS to facilitate the production of verifiable and repeatable results from various assessment models. It has been developed in such a way as to easily accept future enhancements and additional modeling capabilities. Individual stock assessment models have been compiled into dynamic link libraries (DLLs) and integrated with a Windows Interface. The application comes in a zip file that, once unzipped, will run a setup routine and install all necessary library files on a user's PC. At this time, the application is available for download from the FACT website:http://www.wh.whoi.edu/fact for authorized users.
FACT began as the Woods Hole Assessment Toolbox (WHAT) with a focus on enhancing the software being used in the population dynamics branch in Woods Hole. Since then there have been many contributors to FACT. In an effort not to redo work that has already been completed, much of the code comes from individuals or small teams using custom written programs. The modular approach allows researchers working on method development to quickly put together new analytical routines. Modules may consist of single relatively simple assessment methods or complex systems. FACT allows scientists to take advantage of a Windows-based interface to view and manipulate their data.
Currently the following assessment models have been incorporated into the Toolbox: Virtual Population Analysis, (VPA) with retrospective and bootstrapping capabilities, Age Projection, Yield Per Recruit and Spawning Biomass per Recruit, Aspic, A Stock Production Model Incorporating Covariates - a non-equilibrium stock production model, Aspic Projection, Precautionary Approach and Separable VPA Extended Survivors Analysis (XSA), and an Age-Structured Production Model (ASPM). A Delury model and several length-based methods are partially complete and a VPA-2 Box is under construction at this time. Several additional models are currently under consideration for future inclusion into the Toolbox. The package also includes a comprehensive on-line Help and preliminary graphing capabilities.
FACT has been released to the Steering Committee, and the Population Dynamics branch in Woods Hole, MA. The site is password protected but anyone who would like to explore FACT (at his own risk) may obtain the password by contacting [email protected]. The FACT Steering Committee is currently developing testing procedures that will lead to an NMFS-approved set of standard assessment tools for use by and other scientists.
The FACT application has been designed with ease of use, computational power and speed in mind. Accordingly, a visual front-end has been developed using Visual Basic 6.0 forms. The majority of the mathematical and output routines have been written in Visual Fortran 6.0, with a few routines to accomplish particular tasks written in Visual C++ 6.0. The software design is one of a modular application within an object-oriented environment. This design allows for easy modification and simplified enhancement of the software. The front end consists of Visual Basic forms that facilitate the inputting of data and the subsequent processing and outputting of the data. Data may be input either by reading from a disk file or by user keyboard input. Once the data have been input, or read in from disk, they may be easily updated using fields on the various forms. Additionally, they may be viewed graphically via a built-in graphing utility. Then user then selects a command button to choose the type of assessment to be done. A series of windows, menus and options are used to lead the user in the processing of the data using the selected assessment model.
CONTACT: David Curelli, Northeast Fisheries Science Center, National Marine Fisheries Service.
Appendix 5. Summary of the Objectives and Scope of the Center for Independent Experts Program: An Independent System for Peer
Review
As part of its Science Quality Assurance Plan, the National Marine Fisheries Service (NMFS) has established a formal system for independent peer review through a pilot program grant to the University of Miami, Cooperative Institute for Marine and Atmospheric Sciences (CIMAS). Within CIMAS, the Center of Independent Experts (CIE) administers the review process and a formal pool of qualified scientific experts recruited from outside the Agency. From its inception the pilot program has focused specifically on external peer review of NMFS' stock assessments and related management advice for selected stocks.
NMFS has a long tradition of involving outside experts in the design and review of scientific programs, stock assessments, and development of new assessment methodologies. These experts are typically internationally recognized academics in the United States and elsewhere, as well as leading government scientists from other countries. They are generally employed in public and private U.S. universities, with formal programs of teaching and research in fisheries science, as well as in government and academic institutions that deal with fisheries research outside the U.S.
At the core of the concept of a pool of external experts is that the reports they render be free from any manipulation by the Agency, which would steer the review in favor of one outcome over another. That is, expert reviews should be truly independent of any position NMFS may have. At the same time, it is important to NMFS that the selected experts will also be acting free from the influence of groups or organizations with vested interests in the review findings. That is, the expert's views should also be truly independent of any position taken by concerned constituent groups. Furthermore, it is important to NMFS that selected experts’ posses the depth of knowledge and experience that will maximize the likelihood of delivering a useful product, i.e., a product that is more relevant to the Agency's mission than is the typical academic peer criticism. The range of issues represented in the annual schedule of reviews has focused on cutting-edge science, applications of new or novel methods, or scientific advice given in controversial management actions and highly contentious litigation.
In order to accomplish the overarching goal of independent peer review, and to avoid perceptions of improper influence, it is necessary that a steering group outside NMFS administer the selection of individual reviewers with utmost transparency. As currently structured, the CIE Steering Committee is composed of tenured academics, or senior researchers, and charged with program oversight. The potential pool of CIE experts is conceptually the universe of qualified scientists that may take on review tasks.
The guiding principle is that CIE's pool of experts be composed of independent (non-NMFS) members having the requisite technical and scientific expertise to provide impartial and comprehensive comments and advice on subject reviews. To further separate this review process from even the appearance of any influence from the affected parties, the CIE Steering Committee selects each reviewer and collects written assurances of no conflict of interest. For each contracted review, CIE program staff facilitates expert selection, travel arrangements, distribution of background materials, and provide intermediate status reports, including final written reviews, and a complete accounting of distributed funds.
Scope of Work
Reviews conducted by the Center of Independent Experts can vary in scope and duration. Some Members may be asked to carry out short-term assignments, such as proposal and stock assessment reviews, while others could be involved in long-term projects such as programmatic reviews and development, and review of new management methods. The following are some of the assignments-
A33
Review grant proposals.
Conduct reviews of stock assessments.
Conduct alternative stock assessments.
Conduct reviews of scientific programs.
Participate in the design of new scientific programs and management advice.
These assignments require special skills, knowledge and institutional granting and grant oversight capabilities generally found only in large U.S. academic research institutions with international reputations in the marine sciences. Additionally, CIE reviews focus on highly specialized scientific activities, including products of fishery resource assessments and research, and sometimes-controversial issues including court decisions to which the U.S. Government is a party. This has contributed to expanding the concept beyond a strict stock assessment focus into other issues of interest to the Agency. Recent reviews have included Pacific salmon-coastal watershed habitat requirements and endangered species listings.
CONTACT: Steve Brown, Office of Science and Technology, National Marine Fisheries Service.
A34
Appendix 6. Summary of the Joint NMFS/SEA GrantGraduate Fellowship Program
Introduction
The National Sea Grant College Program Office (NSGO) and the National Marine Fisheries Service (NMFS) established a new Graduate Fellowship Program in Population Dynamics and Marine Resource Economics (Program) in 1999.
Contingent upon the availability of Federal funds, the Program will award fellowships, to begin in the summer, to four students each year who are interested in careers related to 1) the population dynamics of living marine resources and the development and implementation of quantitative methods for assessing their status, and 2) the economics of the conservation and management of living marine resources. Two fellowships will be awarded each year in each of the above two disciplines resulting in an anticipated six students per discipline eventually supported annually by fellowships when the Program reaches its maximum level three years following its inception.
The fellowships will provide support for up to three years for highly qualified graduate students working towards a PhD in population dynamics or related fields of study and for up to two years for highly qualified graduate students working towards a PhD in marine resource economics, natural resource economics, or environmental economics. Continued support after the first year will be contingent upon the availability of Federal funds and satisfactory performance of the Fellow. In addition to his/her major professor, each Fellow will be required to work closely with an expert (mentor) from NMFS who will provide data for the Fellow's thesis, serve on the Fellow's committee, and host an annual summer internship at the participating NMFS facility.
The goals of the Program are to 1) encourage qualified applicants to pursue careers in a) population dynamics and stock assessment methodology or b) marine resource economics; 2) increase available expertise related to a) the population dynamics and assessment of stock status of living marine resources or b) economic analysis of living marine resource conservation and management decisions; 3) foster closer relationships between academic scientists and NMFS; and 4) provide real-world experience to graduate students and accelerate their career development.
Eligibility
Any student may apply who is a United States citizen. At the time of application, prospective Population Dynamics Fellows must be admitted to a PhD degree program in population dynamics or a related field such as applied mathematics, statistics, or quantitative ecology at a university in the United States, or submit a signed letter from the university indicating provisional acceptance to a PhD degree program conditional on obtaining financial support such as this fellowship. At the time of application, prospective Marine Resource Economics Fellows must be in the process of completing at least two years of course work in a PhD degree program in natural resource economics or a related field at a university in the United States.
Selection Criteria
Selection criteria will include 1) relevant academic ability and achievement, particularly quantitative skills (35%); 2) demonstrated research ability in the discipline and appropriateness/importance of proposed thesis topic (30%); 3) expertise of major professor (20%); and 4) additional relevant experience (15%).
A35
Selection
Selection is competitive. A review panel consisting of experts in the two disciplines and representatives from the NSGO and NMFS will evaluate and rank the candidates in accordance with the above criteria. The panel members will provide individual evaluations on each candidate, but there will be no consensus advice. The Fellowship Program Manager based in part on the rankings provided by the review panel will select two Fellows in each discipline. In addition, the Program Manager will give priority to NMFS Fisheries Science Centers, which do not currently have Fellows. Accordingly, awards may not necessarily be made to the two highest-scoring candidates in each discipline.
Participating NMFS Facilities
Mentors will be from participating NMFS Science Centers, Laboratories, or Regional Offices. Each Fellow will be required to work as a summer intern at the participating NMFS facility either on his/her thesis or on appropriate related problems. Remuneration for the summer internship will be part of the annual award. Population Dynamics Fellows will also be expected to spend 10-20 days at sea per year learning about sampling techniques and problems, commercial fishing, fishery biology, and local and regional issues of importance to fisheries management. Fellows may also work, as necessary, at the participating NMFS facility during some or all of the academic year at the mutual discretion of mentor, major professor, and Fellow.
CONTACT: information can be obtained from Dr. Emory D. Anderson, Program Director for Fisheries, National Sea Grant College Program, 1315 East-West Highway, Silver Spring, MD 20910, Tel: (301) 7132435 ext. 144, e-mail: [email protected]; from any state Sea Grant program, or from any participating NMFS facility.
Appendix 7. Extract from the Executive Summary of the NRC Report on Improving Fish Stock Assessments (NRC 1998a)
FINDINGS AND RECOMMENDATIONS
The committee focused its examination on the data that are used in assessments, model performance, use of harvest strategies, new assessment techniques, periodic review and quality control of assessments and assessment methods, and education and training of stock assessment scientists. The committee based its recommendations on the results of the simulations and on its collective experience. Caveats about how the analyses conducted for this study compare to actual stock assessments are given in Chapter 5. Accomplishing the recommendations of this report will require concerted and cooperative action by all interested parties (academic and government scientists, fishery managers, user groups, and environmental nongovernmental organizations) to improve the stock assessment process and products.
Data Collection and Assessment Methods The committee concludes that stock assessments do not always provide enough information to evaluate data quality and to estimate model parameters, and it recommends a checklist that would promote more complete data collection for use in stock assessments. The results of the committee's simulations demonstrated that the availability of continuous sets of data collected by using standardized and calibrated methods is important for the use of existing stock assessment models. The best index of fish abundance is one for which extraneous influences (e.g., changes in gear and seasonal coverage, changes in fishers' behavior) can be controlled. The committee recommends that at least one reliable abundance index should be available for each significant stock. CPUE data from commercial fisheries, if not properly standardized, do not usually provide the most appropriate index. Likewise, CPUE data from recreational fisheries require standardization to serve as a good index of abundance.
Fishery-independent surveys offer the best opportunity for controlling sampling conditions over time and the best choice for achieving a reliable index if they are designed well with respect to location, timing, sampling gear, and other considerations of statistically valid survey design. NMFS should support the long-term collection of fishery-independent data, using either the NOAA fleet or calibrated independent vessels. Diminishing the quality of fishery-independent data by failing to modernize NOAA fishery research vessels or by changing sampling methods and gear without proper calibration could reduce the usefulness of existing and future data sets.
The simulation study demonstrated that assessments are sensitive to underlying structural features of fish stocks and fishery practices, such as natural mortality, age selectivity, catch reporting, and variations in these or other quantities. Auxiliary information in the form of indices or survey estimates of abundance, population structure information, and accurate estimates of other population parameters (e.g., natural or fishing mortality, growth, catchability) improves the accuracy of assessments.
Formally reviewed sampling protocols for collection of commercial fisheries statistics have not been implemented in many geographic regions. The lack of formalized, peer-reviewed data collection methods in commercial fisheries is problematic because bias and improper survey conduct may exist, with unknown impact on data reliability. Greater attention should be devoted to sampling design based on an understanding of the statistical properties of the estimators for catch at age and other factors. Sampling and subsequent analysis should also consider the issue of systematic biases that emerge with factors such as misreporting. Formalized sampling protocols have been developed for recreational fisheries in the form of the Marine Recreational Fisheries Statistics Survey (MRFSS). MRFSS data and methods, albeit imperfect, have undergone independent peer review, are readily available, and could serve as a model for commercial fisheries. The committee recommends that a standardized and formalized data collection protocol be established for commercial fisheries nationwide.
A37
Models
Both harvesting strategies and decision rules for regulatory actions have to be evaluated simultaneously to determine their combined ability to sustain stocks. Simulation models should be realistic and encompass a wide range of possible stock responses to management actions and natural fluctuations consistent with experience. The committee recommends that fish stock assessments present realistic measures of the uncertainty in model outputs whenever feasible. Although a simple model can be a useful management tool, more complex models are needed to better quantify the unknown aspects of the system and to address the long-term consequences of specific decision rules adequately. Retrospective analyses performed by the committee showed that persistent over- or underestimation can occur over a number of years of assessment, regardless of which model is used. The committee recommends the use of Bayesian methods both for creating distributions of input variables and for evaluating alternative management policies. Other methods for including realistic levels of uncertainly in models also should be investigated.
In the simulations, model performance became erratic as more variability or errors were introduced to data sets. Newer modeling methods offer promise for reducing bias in key parameter estimates, although using mathematically sophisticated assessment models did not mitigate poor data quality. Different assessment models should be used to analyze the same data to help recognize poor data and to improve the quality of assessment results. Results from such comparisons can be used to direct survey programs to improve data quality and to assess the degree of improvement in data achieved over time. Greater attention should also be devoted to including independent estimates of natural mortality and its variability in assessment models. Further simulation work of this kind is also needed to determine whether the simulation results and the conclusion based on these results remain the same over multiple replications.
The committee believes that single-species assessments provide the best approach at present for assessing population parameters and providing short- term forecasting and management advice. Recent interest in bringing ecological and environmental considerations and multi-species interactions into stock assessment should be encouraged, but not at the expense of a reduction in the quality of stock assessments.
Harvest Strategies
Although the committee did not evaluate alternative harvest strategies, it believes that assessment methods and harvest strategies should be evaluated together because harvest strategies can affect stock assessments and the uncertainty inherent in stock assessments should be reflected in harvest strategies. Despite the uncertainty in stock assessments, fishery scientists may be able to identify robust management measures that can at least prevent overfishing, even if they cannot optimize performance. Conservative management procedures include management tools specific to the specific to the species managed, such as minimum biomass levels, size limits, gear restrictions, and area closures (for sedentary species). Management procedures by which the allowable catch is set as a constant fraction of biomass (used for many U.S. fisheries) generally perform better than many alternative procedures. However, errors in implementation due to assessment uncertainties could result in substantial reductions in long-term average harvests in some years if biomass estimates are highly uncertain. Assessment methods and harvest strategies need to be evaluated simultaneously to determine their ability to achieve management goals. Application of risk adjusted reference points (based on fishing mortality or biomass) would immediately lead to reduced total allowable catch and thus create an economic incentive for investment in improved data gathering and assessment procedures to reduce the coefficient of variation of biomass estimates.
There are at least four alternatives to harvesting a constant fraction of exploitable biomass that may result in levels of total mortality that are consistent with maintaining a fish stock. First, target fishing mortality can be reduced as a stock decreases in size to reduce risks. Second, a minimum biomass level can be established, below which fishing would be halted (this is done for some U.S. fisheries). Third, the size of fish captured can be increased by changing requirements for harvest gear. This
A38
restriction might allow smaller fish to escape and spawn, but could be ineffective if harvesters apply more effort to larger fish. Finally, geographic areas can be closed to limit mortality for sedentary species if the distribution of organisms is well known and if the fishing mortality in other areas is not increased. Area closures have been implemented or proposed for many fisheries worldwide in the form of marine reserves and sanctuaries.
New Approaches
NMFS and other organizations responsible for fisheries management should support the development of new techniques that can better accommodate incomplete and variable data and can account for the effects of environmental fluctuation on fisheries. Such techniques should allow the specification of uncertainty in key parameters (rather than assuming constant, known values), should be robust to measurement error, and should include the ability to show the risks associated with estimated uncertainty.
A few prominent recommendations for new approaches emerged from the study. Scientists that depend on assessments should:
incorporate Bayesian methods and other techniques to include realistic uncertainty in stock assessment models;
develop better assessment models for recreational fisheries and methods to evaluate the impacts of the quality of recreational data on stock assessments;
account for effects of directional changes in environment variables (e.g. those that would accompany climate change) in new models; and
develop new mean to estimate changes in average catch ability, selectivity, and mortality over time, rather than assuming that these parameters remain constant.
The results from the simulation exercise should be sobering to scientists, managers, and the users of fishery resources. The majority of the estimates of exploitable biomass exceeded true values by more than 25%; assessments that used accurate abundance indices performed roughly twice as well as those that use faulty indices. A disturbing feature of the assessment methods is their tendency to lag in their detection of trends in the simulated population abundance over time. For example, some methods with some types of data consistently overestimate exploitable biomass during periods of decreasing simulated abundance and underestimate exploitable biomass during periods of increasing simulated abundance.
Although no stock assessment model was free from significant error in the simulations, it is also true that few of the models failed consistently. Hence, the message of this report is not that stock assessment models should not be used, but rather that data collection, stock assessment techniques, and management procedures need to be improved in terms of their ability to detect and respond to population declines. The simulation results and some actual fishery management examples suggest that overestimation of stock biomass and overfishing of a population can occur due to inaccurate stock assessments and that the overestimation can persist over time. The committee believes that the two most important management actions to mitigate this problem are: (1) to model and express uncertainty in stock assessments explicitly, and (2) to incorporate uncertainty explicitly into management actions such as harvesting strategies.
The absence of adequate data is the primary factor constraining accurate stock assessments. The differences between estimated and true values derived from the simulated data were most likely not introduced by any mistakes made by the analysts. Rather, the large differences that occurred under some scenarios were primarily the results of poor data and model mis-specification steaming from incomplete knowledge of the true situation by the analysts. The surplus production and delay difference models did not include the ability to account for changes over time in key parameters for the
A39
simulated populations. The simulated data sets were better structured for analysis by age-structured methods; hence, these kinds of models performed better. When they did not perform well, it was generally because the models used biased information (e.g., the fishery CPUE index) or did not account for changes in selectivity and catchability over time. Had the analysis been told about these data features, it is likely that they could have compensated for them and obtained better assessments. Some of the newer models appear to be able to achieve such compensation through the introduction of process errors. Nevertheless, modeling will never be able to provide estimates that are as accurate as direct knowledge obtained by measurement and experimentation. Thus, if future stock assessments are to avoid some of the past problems, management agencies must devote the necessary resources to monitor and investigate fish populations in a stable research environment that fosters creative approaches.
Peer Review
It is imperative that stock assessment procedures and results be understood better and trusted more by all stakeholders. One means to achieve such trust is to conduct independent peer review of fishery management methods and results including (1) the survey sampling methods used in data collection, (2) stock assessment procedures, and (3) risk assessment and management strategies. When applied properly to stock assessments, peer review yields an impartial evaluation of quality of assessments as well as constructive suggestions for improvement. Such reviews are most beneficial when conducted periodically, for example, every 5 to 10 years, as new information and practices develop. In addition, a complete review of methods for collection of data from commercial fisheries should be conducted in the near future by an independent panel of experts, which could lead to the adoption of formal protocols.
Education and Training
Reduction in the supply of stock assessment scientists would endanger the conduct of fishery assessments by the federal government, interstate commissions, and international management organizations and would hinder progress in the development and implementation of new stock assessment methods. NMFS and other bodies that conduct and depend on fish stock assessments should cooperate to ensure a steady supply of well-trained stock assessment scientists by using mechanisms such as personnel exchanges among universities, government laboratories, and industry and by funding stock assessment research activities. The training of stock assessment scientists should endow them with skills in applied mathematics, fisheries biology, and oceanography. Education of fisheries scientists should be organized and executed in such a way that it complements and augments the NMFS research mission and leads to improved management strategies for fisheries in the future.
A40
Appendix 8. Executive Summary of the Report to Congress on a Proposed Implementation of a Fishing Vessel Registration and Fisheries Information
Management System
The National Marine Fisheries Service (NMFS), fishery management councils, and states rely on fishery data to make decisions regarding the stewardship of the Nation's living marine resources. Citizens of the United States also rely on fishery statistics to make decisions regarding their participation, investment in, and use of commercial and recreational fisheries. In addition, fishery statistics can be used to measure how effectively governmental agencies are meeting stewardship goals and objectives. The quality of resource stewardship decisions and the predictability of the outcomes are strongly dependent on the quality of the data being used.
Given the increasing complexity of fisheries management, the current state of fisheries statistics needs to be greatly improved. Despite some regional successes, it is clear that the current overall approach to collecting and managing fisheries information needs to be rethought, revised, and reworked. The quality and completeness of fishery data are often inadequate. Data are often not accessible in an appropriate form or a timely manner. Methods for data collection and management are frequently burdensome and inefficient. These drawbacks result in the inability to answer some of the most basic questions regarding the state of the Nation's fisheries, such as: How many vessels and people participate in various fisheries? Do our policy decisions improve the economic and biological sustainability of our fisheries - by how much? How are different people (harvesters, consumers, coastal residents, non-consumptive users) affected by these stewardship decisions? An ability to answer these kinds of questions is essential to sound resource stewardship. Simply put, to manage fisheries at local, state, regional, or national levels requires a much better fisheries information system than the one in place.
To address these shortcomings, the 1996 amendments to the Magnuson-Stevens Fishery Conservation and Management Act required NMFS to "develop recommendations for implementation of a standardized fishing vessel registration and information management system" to improve the state of our fisheries statistics programs. This Report to Congress provides the recommendations for implementation of this "System."
The benefits of such a system would be seen on several levels. At the most basic level, answers to fishery performance questions similar to those above would be immediately available. The ability to evaluate the status of all managed fish stocks would be enhanced. Scientists working with fishery data would be freed of the inordinate amount of time now spent on searching for, cleaning, checking, and reconciling data prior to use. Fishery participants would have an enhanced ability to make decisions on their participation and production. The entire system would be more efficient in the collection of data and the delivery of useful information to those who need it. Just as a business requires data on raw materials, inventory, cash flow, employees, product quality, and capital investments to be successful, this fisheries statistics system is designed to deliver the analogous decision-making information to those who manage and depend on the Nation's living marine resources for their livelihood, food or recreation.
The Magnuson-Stevens Act required that the system be implemented on a regional basis. Since several major regional information systems already exist or are being planned, NMFS recommends creating a system that improves, expands and integrates ongoing regional activities under a nationwide "umbrella."
As specified in the Magnuson-Stevens Act, the system will have two main components. The first component, the Vessel Registration System (VRS) will enable fisheries managers to uniquely identify every US vessel engaged in commercial and recreational for-hire fishing. To implement the VRS component of the system, NMFS recommends utilizing a system already being developed by the U.S. Coast Guard (Coast Guard). The Vessel Information System (VIS), includes nearly all of the
A41
information needed for the VRS and is based on combining data from the Coast Guard vessel documentation and state vessel numbering files into one Coast Guard database. A pilot implementation of the VIS, with data from two states and the Coast Guard, is now on-line and undergoing testing. State participation in the VIS is currently voluntary. However, an expansion of this system to require coastal states and territories to participate would fulfill the requirements for a VRS as set forth in the Magnuson-Stevens Act in the least costly and least burdensome manner. The modifications to the Coast Guard VIS that would allow it to serve as the VRS include:
Requiring that coastal states and territories participate on the VIS The placement of a Hull Identification Number (HIN) on all undocumented vessels
participating in commercial or charter fishing that did not have one upon manufacture
Creation of a “charter fishing” endorsement and principal use category
A new separate system to include recreational vessels in the VRS is not recommended. However, since pleasure craft are already in the VIS, conditionally including them in the VRS is recommended. The recommendation is contingent on there being no additional costs or burdens to participants or the state numbering agencies to include VIS pleasure craft in VRS. Otherwise, the net benefits of inclusion would no longer outweigh the costs.
The VRS design requirement includes obtaining the identity of the owner and operator of each fishing vessel at the time of registration, but vessel operator data changes frequently over time. Several resource management agencies, regional statistics planning groups and industry members suggested that tracking vessel performance over time without information regarding the operator, and in some cases the crew was insufficient to meet their needs. During development of the VRS proposal, it became clear that better data on fisherman, in addition to fishing vessels, was an important design criterion for many stakeholders. While many federal and state permitting and licensing programs contain information on vessel operators, there is no universally accepted means to identify fishermen across fisheries or states. More frequently than not, fishery performance data are not linked to the operator. While various regional statistics planning efforts have identified this issue for resolution, there has yet to be a consensus on how to do this. NMFS proposes that the regional statistics be asked to continue to investigate the development of a regional operator identifier that would be included as part of the catch information.
The second component, the Fisheries Information System (FIS), will be implemented by integrating and expanding on the current regional fisheries cooperative statistics activities. Some of these regional activities are well developed, while others are in the early stages of implementation. Present control and management of these regional programs will remain local. The FIS will simply link and harmonize the data from these programs to each other to form a virtual national system. FIS implementation details are addressed under three major areas: Data Collection; Information Management; and Institutional Arrangements.
Under the recommended FIS, regional detail data would continue to be collected locally with minor adjustments in content, coverage, and quality control as required to meet both the Act's requirements and regional requirements. Access to data will be controlled regionally to ensure a balance in the need for access to data with the confidentiality constraints under which they were collected. Routine summaries of detailed data will be made available for the most frequent uses of data. Reciprocity agreements to satisfy multiple state and federal data submission and user access requirements are recommended. Adoption of common codes or creation of bridges between coding systems is recommended.
Using the unique vessel identifier from the VRS/VIS as a link, the FIS will associate with each vessel a record of its fishing activities, including landings, fishing location, gear used, time periods of fishing, and other data recorded in the regional data collection systems. In addition, data in the VRS/FIS system will be available as necessary to assist in the issuance of permits and for other systems
A42
requiring vessel and ownership data so that an applicant will not have to submit identifying information more than once.
Resolution of issues arising the states, the marine fisheries commissions, and federal agencies (including NMFS) concerning the development of agreements, policies, regulations, and laws to collect and share information, or concerning budgets and planning for cooperative development of the System, will be jointly resolved by the System partners. Statistical committees and work groups, plus an annual statistics meeting of all System partners, are proposed for bringing together the relevant parties. These groups would:
Facilitate coordination of data sharing among states, regions and NMFS, where such outcomes support fisheries stewardship; and
Facilitate consensual formulation of regional and national policies concerning data collection and management.
The plan relies on existing regional statistics, industry advisory and marine fisheries policy groups to facilitate solutions rather than the creation of new entities.
Section 410(a)(5) of the Magnuson-Stevens Act requires that the Report to Congress provide for “funding (subject to appropriations) to assist appropriate state, regional or tribal entities and marine fisheries commissions” for implementing activities associated with the Report. The total cost for the nationwide VRS/FIS system is projected to be $51.9 million. This is the total incremental cost of implementing the system over and above current funding levels, and was derived through an extensive consultative process with the states, Regional Fishery Management Councils, and Marine Fisheries Commissions. Overall, $43.1 million are for data collection, integration and harmonization, $7.2 million for information technology and management and $1.7 million for institutional infrastructure costs. Eighty percent of these costs are annually recurring, with full implementation phased in over a period of 5-7 years. The totals include $23.7 million to fix or redesign data collection programs to fill gaps in current needs, including state-level commercial trip ticket systems, $3.4 million for data quality and data integration improvements, $6.8 million for economic and sociocultural data collection, and $1.7 million for improvements in state/federal information management communication and computer technology. Three legislative/regulatory considerations associated with VRS/FIS implementation are recommended: 1) implement a fisheries statistics confidentiality sunset provision of 10 years coincident with the next Magnuson-Stevens Act reauthorization; 2) create a temporary VRS/FIS System liaison office within the Office of Management and Budget to obtain any Paperwork Reduction Act approvals coincident with VRS/FIS implementation in a comprehensive and expedited manner; and 3) strike prohibitions on collecting economic and financial fisheries statistics data in the Magnuson-Stevens Act coincident with its next reauthorization.
CONTACT: Mark Holliday, Office of Science and Technology, National Fisheries Service.
A43
Appendix 9. Executive Summary of the NMFS Bycatch Plan
Bycatch--defined as fishery discards, retained incidental catch, and unobserved mortalities resulting from a direct encounter with fishing gear--has become a central concern of the commercial and recreational fishing industries, resource managers, scientists, and the public, both nationally and globally. Bycatch concerns stem from the apparent waste that discards represent when so many of the world's marine resources either are utilized to their full potential or are overexploited. These issues apply to fishery resources as well as to marine mammals, sea turtles, seabirds, and other components of marine ecosystems.
Congress has responded to these concerns by increasing requirements of the Marine Mammal Protection Act, the Endangered Species Act , and, most recently, the Sustainable Fisheries Act1 to reduce or eliminate bycatch. The Magnuson-Stevens Fisheries Conservation and Management Act highlighted the need for bycatch management in fishery management plans by requiring that conservation and management measures shall, to the extent practicable, minimize bycatch and to the extent that bycatch cannot be avoided, minimize the mortality of such bycatch. Globally, the United Nations Food and Agriculture Organization's Code of Conduct for Responsible Fisheries, to which the United States is a signatory, also emphasizes bycatch reduction.
The national goal of the National Marine Fisheries Service's bycatch plan activities is to implement conservation and management measures for living marine resources that will minimize, to the extent practicable, bycatch and the mortality of bycatch that cannot be avoided. Inherent in this goal is the need to avoid bycatch, rather than create new ways to utilize bycatch.
Responding to these issues and increasing regulatory requirements, in 1992 the U.S. commercial fishing industries initiated a series of workshops to develop strategies to reduce bycatch and to increase the industries and the public's understanding of bycatch issues. Their recommendations, as well as those from recreational fishing and environmental groups and the public, have prompted the National Marine Fisheries Service to prepare this plan, clearly articulating the agency's objectives, priorities, and strategies regarding bycatch. This plan includes national and regional bycatch objectives; specific recommendations concerning data collection, evaluation, and management actions necessary to attain the objectives; and an assessment of the state of knowledge about bycatch in the nation's marine fisheries. The last of these is intended to serve as a benchmark for measuring progress in bycatch reduction.
Because there are little data available on the retained incidental and unobserved mortality components of bycatch, the assessment of bycatch focuses on the availability of quantitative discard estimates from the nation's fisheries, the significance of those discards to the health of fishery and protected stocks, and progress in addressing bycatch issues associated with each of the fisheries evaluated. Some quantitative information on finish discards was available for about half of the species or species groups; the availability of such estimates is disproportionate among regions of the country and among fisheries within regions.
Review of bycatch reduction efforts completed or under way indicates that successful programs share common characteristics that form the basis for the following seven national objectives in this plan:
1. Determine the magnitude of bycatch and bycatch mortality.
2. Determine the population, ecosystem, and socioeconomic impacts of bycatch and bycatch mortality.
1 The Sustainable Fisheries Act amended the Magnuson Fishery Conservation and Management Act and renamed it the Magnuson Stevens Fishery Conservation and Management Act.
A44
3. Determine whether current conservation and management measures minimize bycatch to the extent practicable and, if not, select measures that will.
4. Implement and monitor selected bycatch management measures.
5. Improve communications with all stakeholders on bycatch issues.
5. Improve the effectiveness of partnerships with groups and individuals external to the National Marine Fisheries Service.
7. Coordinate NMFS activities to effectively implement this plan.
To accomplish these objectives, recommendations are made in the following six areas:
1. bycatch monitoring and data collection programs;
2. research on the population, ecosystem, and socioeconomic effects of bycatch;
3. research to increase the selectivity of fishing gear and to increase the survival of fish and protected species that are inadvertently encountered by fishing gear;
4. incentive programs for fishermen to improve bycatch performance;
5. analysis of the implications of conservation and management measures for bycatch; and
6. exchange of information and development of cooperative management approaches.
Recommended actions in the six areas range from developing strategies for a long-term integrated scientific approach to the collection of biological, economic, and social data to providing information that will help define the benefits and cost associated with managing bycatch. The plan does not attempt an intra-regional needs prioritization. Instead, it suggests a seven-step decision-making research and management.
The development of this plan has brought into focus the fact that there is a multifaceted and complex set of problems associated with bycatch that affects nearly all aspects of fishing operations. Regionally, the causes and implications of bycatch share some characteristics, but often differ since the status of exploitations of resources and the way fisheries are prosecuted and managed can vary substantially. Bycatch management can be accomplished with a wide variety of measures, depending on the specific characteristics of fisheries. As a result, no single solution to the “bycatch problem” exists. Rather, fishermen, managers, scientists, conservationists, and other interest groups must work together to craft a balanced approach to addressing bycatch-one that will promote the sustainability of our nation’s living marine resources.
CONTACT: Mark Chandler, Office of Science and Technology, National Marine Fisheries Services.
A45
Appendix 10. Summary of the National Observer Program
Program Goal: To build a national observer program for the collection of high quality fisheries, environmental, and socioeconomic data from commercial and recreational fishing vessels to assess impacts on marine resources and fishing communities and to monitor compliance with marine resource laws and regulations.
Summary of Problem
An expansion of NMFS observer programs is needed to meet the agency's immediate observer coverage requirements as mandated by existing laws, regulations, fishery management plans, ESA section 7 consultations, and court decisions. NMFS must also establish observer programs in fisheries that are being managed with inadequate data on total catch, have a significant bycatch and/or discard of finfish or shellfish, have suspected incidental takes of protected species, or have rebuilding plans in place. NMFS must ensure that all data are of high quality and collected according to a rigorous sampling design, and that observers are safe, adequately trained, fairly compensated, and supported.
This proposal outlines a plan for meeting the critical information needs of the agency for the management of US commercial and recreational fisheries over the next five years, by placing sufficient observers on fishing vessels to meet target observer coverage levels. Achieving the objectives of this proposal will provide the data to meet the Build Sustainable Fisheries goals to eliminate and prevent overfishing and overcapitalization by improving stock assessments and predictions, reduce interactions between fisheries and protected species, and ensure compliance with environmental laws and regulations. By monitoring bycatch of nontarget species, including marine mammals, sea turtles, and sea birds, it will also contribute to reducing the probability of extinction and depletion of these species, meeting the objectives of the Recover Protected Species initiative.
The Kammer Report recognizes that NMFS observer programs assist in contributing important data necessary to manage, adhering to regulatory requirements, and strengthening relationships with state partners, and recommends additional funding for observers.
Approach
NMFS has developed 40 Fishery Management Plans to manage domestic fishery stocks, under the authority of the Magnuson-Stevens Fishery Conservation and Management Act. Another nine Plans are currently under development. Observers are currently deployed to collect fishery dependent data in only 11 of the fisheries identified within these plans. NMFS also has responsibility for monitoring an additional 25 Category I and II state and federal fisheries under the Marine Mammal Protection Act, yet currently has coverage in only 7 of these fisheries. For fisheries that do have observer coverage, but levels are generally not adequate to determine the full extent of fisheries impacts. Low coverage levels result in incomplete implementation of sampling methodologies and, hence, may result in sampling biases.
In some cases, limited observer data or lack of observer coverage has resulted in fishery closures or restrictions on fishing effort. In other cases, NOAA has adopted a precautionary management approach in the absence of complete data - an approach that may be underutilizing a fishery's full capacity.
Program Highlights
Expansion of the National Observer Program would:
Initiate observer coverage in key fisheries to monitor catch, bycatch of protected species, such as sea turtles, marine mammals, prohibited finfish, and environmental parameters
A46
associated with commercial and recreational fishing - approximately 4,000 additional sea days are planned.
Improve the quality of data collected by observers through better coordination and consistency of NMFS observer program policies and procedures.
Modernize data collection and dissemination technologies, as recommended by the National Research Council's report, Improving the Collection, Management, and Use of Fisheries Management Data.
Develop better outreach and communication programs to facilitate fishery cooperation and fishermen's involvement in observer program activities.
Investigate and prosecute noncompliance with fishery regulations as verified by observers.
Partnerships
Regionally, NMFS observer programs work closely with marine resource agencies in all coastal states, federal agencies such as the U.S. Fish and Wildlife Service and the U.S. Coast Guard, state educational institutions and the National Sea Grant College Program, regional Fishery Management Councils and interstate fisheries commissions, state marine resource agencies, the fishing industry, observer service providers, and non-governmental organizations.
The partners currently work together to manage fishery resources and monitor impacts of commercial fisheries on marine resources. However, the partners are limited by both funding and employees to sufficiently monitor the vast number of commercial and recreational fishing vessels that operate in U.S. waters. Additional resources are required to build the partnerships that will promote the establishment of priorities for fisheries observer programs.
CONTACT: Vicki Cornish, Office of Science and Technology, National Marine Fisheries Service.
A47
Appendix 11. Extract from the NMFS Social Sciences Plan and FY2001 Budget Initiative
Background
ST1 staff were asked by the Science Board to assess the staffing requirements for augmenting a social sciences capability within the Agency, and to develop alternatives for implementing the program. Based on Science Board guidance, site visits were made to each NMFS region to determine current versus minimum FTE needs within each region. "Minimum" was defined as the level needed to ensure that NMFS meets its legal responsibilities under Executive Order 12866, the Magnuson-Stevens Fishery Conservation and Management Act (including adherence to national standards), the Regulatory Flexibility Act, the Marine Mammal Protection Act, the Endangered Species Act and the National Environmental Policy Act. The assumption was that current staffing levels (and data collection activities) are not sufficient to keep pace with increasing responsibilities and intensified scrutiny of the Agency's sociocultural and economic analyses. FTE requirements are broken out between a) economists and b) sociologists and anthropologists. In some regions, requirements above the minimum were also identified, with an "ideal" or optimal program including staff to conduct long term socio-cultural and economic research that goes above the minimum requirements to enhance the credibility of the resulting analyses.
Two broad functions for social science staff were identified: (1) management support (e.g. conduct and review of RIRs/RFAs/SIAs/National Standard 8 analyses) and (2) applied research (modeling efforts and related data collection planning and oversight). Models and analyses developed by the research component relate directly to analysis needed to evaluate and support management decisions. It was noted in each region that socio-cultural and economic analyses are needed on a variety of issues, and that social science staff can contribute to all aspects of the Agency's mandates, not just fishery management decisions. For example, all regions have significant responsibilities for protected and endangered species, and habitat-related issues are becoming more prominent. In identifying staff requirements, NMFS social scientists took into account the range of analyses that would be needed to adequately satisfy the Agency's ability to develop and evaluate policies associated with the commercial and recreational fisheries harvest sectors, the processing and wholesaling sector, the trade and retail sectors, endangered and protected species, habitat, and hatchery and aquaculture activities. In addition, all regions recognize that NMFS must now also consider the effect of any actions on impacted human communities.
Findings
Table 1 presents aggregate minimum social staff requirements by region. The specific requirements of both the minimum and ideal requirements from each of the five NMFS regions follow this summary; the individual descriptions are summarized in terms of the key needs and issues in each region, and contain more detail regarding the areas of specialty and the desired mix of FTEs by graduate degree (Ph.D.s, Master's). In each region, evaluation of minimum requirements indicated the need to more than double social science staff. In the Northwest, where there is currently only one economist, an even larger increase is needed.
Current Staff Additional Economists Additional Sociologists/Anthropologists
The direct cost of hiring these FTEs is approximately $9.6M. However, it was noted by all regional social science staff that it is unrealistic to expect that this number of staff could or should be hired all at once (i.e., in FY01). First, it is doubtful that qualified staff could be found to fill these positions all at once. Second, FTEs are based on the assumption that core data needs are fully met. The current quality and quantity of NMFS sociocultural and economic data cannot support an immediate full program development (data needs of approximately $5.5M per year were identified). These FTE requirements should be considered a mid-term goal for program development.
CONTACT: Amy Buss-Gautam, Office of Science and Technology, National Marine Fisheries Service
A49
Appendix 12. Terms of Reference for the NMFS National Standing Working Group on Advanced Technologies
(Approved January 11, 2001)
Agency Needs
With increasing demands for accurate, precise, and timely information upon which to base assessments of living marine resources, it is incumbent upon NMFS to encourage and play an active role in the development, evaluation, and implementation of promising technological innovations. By establishing the Advanced Technology Working Group (ATWG), the NMFS Science Board recognizes the need for the agency and its scientists to demonstrate leadership in the ongoing process of improving the quality of assessments of the abundance and dynamics of living marine resources through refinement of existing techniques and implementation of improved methods. This process should also focus on improved characterization and understanding of the environments in which our living marine resources exist and assessment of the impact of fishing activities on these environments, and address needs for sampling over a broad range of temporal and spatial scales.
Mission
Promote the Use of Advanced Technologies for Improved Characterization and Assessment of Living Marine Resources and their Environment by:
Identifying potential new technologies, innovative uses of existing technologies, and approaches which involve combination of technologies, and facilitating and leading research and development leading to implementation of these technologies.
Fostering communication and collaboration regarding development of new technologies and appropriate application of existing technologies within NMFS and between NMFS and its partners.
Composition
One or more scientists from each of the five NMFS Science Centers
One representative from NMFS Headquarters
Other participants which may be nominated by the Science Board
Experts from other government offices, universities, and the private sector to be invited on an ad hoc basis.
Subcommittees will be established as necessary to address specific areas of interest and report back to the working group.
Responsibilities
1) Identify critical needs for advanced technology and provide research and development leadership by:
Developing and prioritizing technological solutions by coordinating with scientists involved in stock assessment, ecosystem monitoring and other research activities.
A50
Tracking and examining related efforts outside the agency (e.g., other NOAA offices, NASA, DOD, NRO, FWS, EPA, ONR, industry, international organizations) to capitalize on and seek collaboration with these other efforts.
Monitoring and evaluating NMFS research activities which involve technological innovation.
Identifying requirements for technical assistance and training related to the greater application of advanced technologies.
Investigating appropriate methods to mitigate the impediments associated with obtaining classified data and technology.
Preparing recommendations on how advanced technologies can be modified, expanded, and/or improved to support agency stewardship responsibilities.
Sponsoring, encouraging, and participating in research and development on advanced sampling methodology.
2) Identify costs and funding opportunities for technological innovation by:
Evaluating the costs and benefits of proposed (applications of) technologies.
Developing appropriate budget initiatives
Assisting in the development of new funding opportunities in collaboration with other organizations.
3) Improve awareness of agency needs for advanced technologies and new advances in technology by:
Preparing and delivering an annual briefing to the NMFS Science Board apprizing it of cutting-edge survey techniques and opportunities for collaboration and/or budget initiative development.
Preparing presentations, briefings, and talking points for agency management and Congress.
Developing and maintaining a website for outreach, coordination of working group activities, and cataloging of germane research and development expertise and activities.
4) Provide consultative advice on technology issues
CONTACT: William Karp, Alaska Fisheries Science Center, National Marine Fisheries Service
A51
Appendix 13. Summary of the Fisheries and the Environment (FATE) Fisheries Oceanography Initiative
Knowledge of decadal and basin-scale climate variability and its impacts on fisheries productivity is essential to effective fisheries management. Sudden shifts in climate regime, as seen recently in the North Pacific, have immediate and major impacts on fisheries productivity. The Fisheries and the Environment (FATE) program will provide the information necessary to effectively adapt management to mitigate the ecological, social and economic impacts of major shifts in the productivity of natural resources in the North Pacific, Bering Sea and Hawaiian Islands. Through the implementation of common observing strategies in widespread regions, it will be possible to invoke comparative analyses to evaluate the response of marine fish to different types of climate forcing. Towards this goal, FATE will provide indicators of ecological and oceanographic change at the population and ecosystem level and local to ocean-basin scales. The indicators, computed on annual or shorter frequencies, will provide early warnings of major shifts in the productivity of key stocks as well as monitoring current year trends in ocean conditions, fish production and ecosystem dynamics. While the initiative is based on an ecosystem approach, it will target a suite of commercially important species including groundfish, coastal pelagics and highly migratory fishes.
The program has two essential elements. One is a broad-scale observational program based on ecological indicators - there can be no indicators without measurements, and no useful forecasts without the observations to confirm them. From an array of moored instruments, NOAA will develop fields of mixed layer depth (MLD) and temperature (MLT), surface and subsurface currents, salinities and fronts to support fisheries predictions. Basin-scale habitats will be monitored for changes in atmospheric and oceanic conditions. Biophysical indicators will also be derived from existing measurement programs such as NMFS stock assessment surveys, NOAA and NASA satellites, NBDC buoys, coastal C-MAN and tide stations, and ships of opportunity. Measurements will be enhanced through additional shipboard surveys, moorings, and aerial surveys.
The other essential element is the development of coupled regional-to-basin scale biophysical models. The vision is to use these coupled models to simulate potential impacts of climate change and climate variability on marine resources. Contrasting model predictions with key ecological indicators will allow critical evaluation of model assumptions and parameterizations in a manner similar to most stock assessment models. The iterative process of prediction, comparison and evaluation will improve the capability of NMFS scientist to provide advice regarding ecosystem considerations in fisheries management.
FATE activities will be initiated in early 2002, with a phased approach depending on the level of funding received. Activities will be conducted through partnerships between NOAA and collaborating state, federal and academic institutions.
CONTACT: Ned Cyr, Office of Science and Technology, National Marine Fisheries Service.
A52
Appendix 14. Protected Species Programs, Plans, and Initiatives
In 1998 F/PR attempted to develop a national marine mammal abundance survey plan as part of its annual allocation of funding for stock assessments. This had two parts: (1) coming up with a scientific rationale or process for deciding how often all the various surveys had to be done (survey interval), and (2) putting together a list of all recent surveys with their cost, assigning each a proposed interval, and a schedule looking out 5 years with the purpose of estimating annual costs, and facilitating scheduling (moving surveys from one year to the next when there wasn't enough money in a given year). The first part was completed and was published by Wade and DeMaster (1999). For various reasons, the second part was never completed. Much of the funding was subsequently transferred permanently but large shortfalls in the program remain. We currently allocate about $2M for stock assessments on an annual or multi-year basis. Below are three recent budget initiatives to improve protected resources stock assessment capabilities.
A. FY 2002 Initiative: Sustainable Fisheries Requirements for Protected Species
1. Desired outcome: To gather reliable and precise estimates of protected species abundance and distribution, as well as fisheries-related mortality, to help ensure recovery of species listed under the ESA and implementation of Sections 117 and 118 of the MMPA. Recovery of species listed under the ESA and conservation marine mammals pursuant to the MMPA depends upon reliable, precise estimates of distribution and abundance. Imprecise estimates increase the probability that species will be misclassified under the ESA/MMPA resulting in potentially significant economic loss to fisheries (and the Nation) or alternatively, increasing the risk of extinction for protected species.
2. Summary Initiative Description: RPS Stock Assessments and Mortality Estimation or "Know Your Resources:" Currently the status of over 200 protected and at-risk marine species is unknown. This initiative would launch a comprehensive effort to conduct adequate stock assessments for these species to provide, for the first time, the information needed to determine the most effective conservation efforts. Additional observer coverage is included to estimate fishery-related injury and mortality. The initiative includes additional funding needed to operate and maintain current and new FRVs serving the RPS program.
3. Brief Description of Initiative:
Stock Assessment: The major objectives of the MMPA and ESA are to prevent the extinction and decline of species and to make sure populations remain healthy enough to be functioning elements of their ecosystem. One of the most significant impacts on marine mammal and sea turtle stocks is death from entanglement and drowning in fishing gear. This is a particular issue of concern in those cases where the marine mammal stocks are endangered or threatened or where little is known about their status. Wise management of protected resources depends on knowing the trends of animal populations. At present, population trends are based on surveys that count animals. The results of these surveys are essential to understand the impacts of human activities on marine mammal stocks and to the development of appropriate conservation measures for fisheries. Unfortunately, the level of assessment is inadequate for the majority of species.
Observer Program: Commercial fishing is exempt from the MMPA prohibitions on incidentally killing marine mammals if the fishery is properly monitored and observed to validate the level of take. This requires that NMFS implement a statistically valid monitoring program for all 30 fisheries of concern (i.e. Category I and II fisheries). The MMPA requires that plans be put in place (Take Reduction Plans) to reduce the mortality of marine mammals in those fisheries where the take exceeds a biologically acceptable level. Four plans are in place that affects 6 fisheries. This means we need to develop new fishing technologies to reduce gear impacts and we need to find ways to keep fishing gear and marine mammals away from each other. It also means that we must educate fishermen on ways they can avoid marine mammals while still allowing them to catch fish.
A53
B. FY 2002 Strategic Theme: Improving Assessments through New Technologies
1. Desired Outcome: Gathering reliable and precise estimates of protected species abundance and distribution to help ensure recovery of species listed under the ESA and implementation of Sections 117 and 118 of the MMPA.
2. Brief Description of Theme: Recovery of species listed under the ESA and conservation marine mammals pursuant to the MMPA depends upon reliable, precise estimates of distribution and abundance. Imprecise estimates increase the probability that species will be misclassified under the ESA/MMPA resulting in potentially significant economic loss to fisheries (and the Nation) or alternatively, increasing the risk of extinction for protected species.
Considerable progress has been made in the development of assessment techniques over the past decades; examples of current and potentially useful assessment methods by major taxon are shown in the attached Table. However, much remains to be done; because of ESA/MMPA mandates and limited funding, surveys receive higher priority for funding than do the development of techniques supporting the surveys. As a result, methods development receives virtually no direct funding.
Within this theme, we propose funding solely for the development of techniques to improve assessments for all Protected Species taxa (cetaceans, pinnipeds, turtles, and fish) under the NMFS mandate. With these funds, NOAA will be able to capitalize on recent advances in survey technologies based partly on investments made by the Department of Defense, Energy, and others by developing and testing more accurate and/or less expensive methods for assessing populations of protected species.
C. FY2003 Initiative: Improve and Modernize Stock Assessment Techniques for the Recovery of Endangered Large Whales
There are currently 23 stocks of 8 species of large whale listed as Endangered or Threatened under the Endangered Species Act (ESA), or depleted under the Marine Mammal Protection Act (MMPA). During the past 30years, only one stock, the Eastern North Pacific Gray Whale, has been removed from the ESA’s List of Endangered and Threatened Wildlife because it was deemed recovered. A number of additional whale stocks may have also recovered, but stocks assessment information to confirm this is lacking. This initiative will provide the information to scientifically determine whether other populations have recovered. If this determination is true, it has significant ramifications. If these stocks have not yet recovered, the information collected and techniques implements will improve the precision of our understanding of population recovery needs. In either case we would continue to monitor and protect these stock as required under the MMPA.
With the exception of North Atlantic Right Whales ($2.1M), North Pacific Right Whales ($200K), North Atlantic humpbacks ($42k), and North Pacific humpbacks ($45K), there are no NOAA base funds to assess the status of large whales relative to their recovery under the MMPA and ESA. Basic information necessary to make a prognosis of a population’s recovery, such as abundance estimates and trends ( how many whales are there today and are their populations increasing or decreasing ?), population structure (how many discrete stocks are there and how many males, females and juveniles in each stock?), and knowledge of their habitat (what are the environmental conditions essential for the population) is lacking. This information can be acquired with relatively small, focused, investments in stock assessment. Specifically, we will improve stock assessment techniques through traditional survey methods (photo-identification, aerial photogrammetry, ship-based survey) and innovative technologies such as acoustics, genetics, and satellite telemetry for 5 large whale species.
A54
Reference
Wade, P.R. and DeMaster, D.P. 1999. Determining the optimum interval for abundance surveys for management. Pgs 53-66 in Marine Mammal Survey and Assessment Methods, Garner, G.W, Amsturp, S.C., Laake, J.L., Manly, B.F.J., McDonald, L.L., and Robertson, D.G. (eds.), Balkema, Rotterdam.
CONTACT: Phil Williams, Office of Protected Resources, National Marine Fisheries Service.
A55
Appendix 15. Habitat Programs, Plans, and Initiatives
A. The Habitat Research Plan of the National Marine Fisheries Service, by Gordon W. Thayer, James P. Thomas, K.V. Koski (1996)
Abstract
A responsibility of the National Marine Fisheries Service (NMFS) is to develop the necessary understanding, using basic and applied research and literature syntheses, to help conserve, protect, and restore habitats of living marine resources. The NMFS National Habitat Program has developed a Habitat Research Plan to direct and conduct research and transfer results to management components within NMFS involved in permit reviews, development of the habitat sections of Fishery Management Plans and protected species Recovery Plans, and development of restoration options and plans as part of the Natural Resources Damage Assessment claims. The plan also is designed to develop the necessary expertise to accomplish or oversee the restoration, creation, or acquisition of habitat to benefit living marine resources. This plan provides guidance in four areas - ecosystem structure and function, effects of alterations, development of restoration methods, and development of indicators of impact and recovery. The plan emphasizes a fifth area - the need for syntheses and timely scientific information to managers.
The National Marine Fisheries Service (NMFS), an agency of the National Oceanic and Atmospheric Administration (NOAA), is the principal steward of living marine resources (LMRs) in the U.S. Resource viability depends in part on habitat protection, maintenance, and restoration. Habitat loss to pollution and development is among the greatest long-term threats to the future viability of U.S. fisheries. NMFS has established a National Habitat Program whose goal is to conserve, protect, and restore the valuable habitats needed to sustain marine and anadromous communities. In the past, the conservation, protection, and restoration of habitat has been accomplished by reviewing licensing, permitting, and legislative and administrative activities that affect LMR and habitats; coordinating with Regional Fishery Management Councils on Fishery Management Plans; and conducting habitat-related research.
NMFS is restructuring the National Habitat Program to meet current and evolving demands and responsibilities relative to managing habitats and fisheries and protecting threatened and endangered species in coastal and estuarine areas. NMFS has created a coordinated research guidance plan and approach to support its habitat-related mandates as part of the program. The Habitat Research Plan (HRP) was developed with input from scientific and management personnel at both headquarters and field levels. The plan (1) provides a framework to conduct coastal and estuarine research and transfer results to those management components involved in permit reviews, development of the habitat sections of Fishery Management Plans and protected species Recovery Plans, and development of restoration options and plans as part of the Natural Resources Damage Claims; and (2) develops the necessary expertise within NMFS to identify habitat impacts and accomplish and oversee the restoration, creation, or acquisition of habitat for the benefits of living marine resources. This paper briefly describes the agency's HRP.
B. Linking Fish Productivity to Habitat (1997)
Executive Summary
The Magnuson-Stevens Fishery Conservation and Management Act (MSFCMA) as amended by the Sustainable Fisheries Act of 1996 contains essential fish habitat (EFH) provisions and mandate a supporting research effort. The provisions require a program of research that will provide information to describe and identify EFH, to identify and evaluate actual and potential adverse effects on EFH (including both fishing-related and non-fishing related impacts), and to develop methods and approaches to conserve and enhance EFH. The ultimate goal of the research described is to link fish productivity to habitat. In concept this not only provides for the management of marine habitat via its
A56
protection, restoration and maintenance, but also advances our objectives to provide sustainable fisheries.
Research will focus on: 1) enhanced biological sampling to complete life history distributions and abundances of fisheries species; 2) characterization and relating of benthic habitats to the distributions and abundances of fisheries species; 3) identification of habitat properties that contribute most to survival, growth, and productivity; 4) determination of habitat properties important in recruitment; 5) determination and evaluation of adverse effects on habitat from point and non-point sources, harmful algal blooms, hypoxia, endocrine disrupting chemicals, and pathogens; 6) identification of impacts of fishing gear on habitat of managed species; 7) testing of harvest refugia concept for selected areas and managed species; and 8) development of new methods and approaches for restoration of degraded habitats. This research is to be collaborative with other elements of NOAA (e.g. OAR, NOS, NESDIS), other federal and state agencies, and academic institutions, particularly where those agencies and institutions have needed strengths complimentary to those of NMFS.
C. NOAA/USGS Joint Initiative on Effects of Fishing Activities on Benthic Habitat (1999)
Recommendations
A key issue facing the long-term sustainability of our coastal and marine living resources is the potential effect of fishing activities on benthic habitats. Field surveys indicate that certain fishing practices may cause significant changes to habitat structure and function. The National Oceanic and Atmospheric Administration (NOAA) and U.S. Geological Survey (USGS) are partnering in a national initiative to conserve marine fisheries by assessing the relationship between benthic habitats and sustainable fisheries and recommending appropriate management strategies. The partners have unique capabilities that are essential for assessing the effects of fishing activities on benthic habitat. NOAA's National Marine Fisheries Service (NMFS) is responsible for managing our Nation's marine fisheries, including the regulation of fishing practices and provides a national expertise in biological assessments. NOAA's National Undersea Research Program (NURP) has unique technologies, including submersibles and underwater robots that are necessary for direct observations of seabed habitat structure and biological assemblages. NOAA's National Ocean Service (NOS) is responsible for developing coastal charts and for the stewardship of coastal resources. NOS also conducts research and monitoring on, and promotes sustainable management of, the nation’s coastal ecosystems. The U.S. Geological Survey's Geological Division has particular strength and responsibility for regional seabed morphologic mapping and for subsequent interpretation of geologic character and processes. This initiative focuses on relating the biological and physical effects of fishing (e.g., dredging scars, trawl door marks) to the geological characteristics of benthic habitats (e.g., morphology, geochemistry, bioturbation, sediment stability, history and prediction of change). The partnership addresses these issues by directing research towards the most critical problems through dedicated initiatives and effective leveraging of the partners' resources. Two recommendations follow:
1. IT IS RECOMMENDED that, within the next 6 months, NOAA and USGS develop an implementation plan to jointly plan and undertake activities under the following themes:
A. Determine the Effects of Fishing Gear on Seabed Habitats.
B. Identify and Map Benthic Habitat Characteristics and the Extent of Fishing Impacts.
To facilitate this initiative a program team will be established to develop priorities and implementation plans for the projects under this initiative. The program team will consist of representatives from the USGS and NOAA, headquarters and field. This team will report to senior management in both agencies through the NOAA/USGS Coordination Group. Further, the programmatic framework of this initiative will be reviewed and revised via a series of workshops to be held within the next 6 months, which will strengthen and refine the planned research elements by including appropriate additional elements of the two agencies. A specific approach and workplan with priorities for research tasks and products will be developed from these workshops. Lastly, a national meeting is planned every other
A57
year to communicate and review results of benthic habitat studies supported by the two agencies and their partners, and to reassess program direction. The second national meeting (the first developed the foundation of this initiative) is being planned for November 12-14, 2002, as a symposium on the Effects of Fishing Activities on Benthic Habitat to be held in Tampa, Florida."
2. IT IS RECOMMENDED that NOAA and USGS commit the necessary resources to meet the minimal priorities identified in this initiative. The body of this initiative identifies a number of key regional projects with preliminary estimates of needed resources. While the major priority needs in each region have been identified, a full programmatic review is needed to develop a fully integrated program. This is now being addressed based on the workshops identified above.
CONTACT: James Thomas, Office of Habitat Conservation, National Marine Fisheries Service.
A58
Appendix 16. Extract from the Executive Summary of the NRC Report on Review of Northwest Fishery Stock Assessments
(NRC 1998b)
RECOMMENDED ACTIONS
The committee recommends that the National Marine Fisheries Service take the following actions to improve the Northeast stock assessments:
1. Improve the collection, analysis, and modeling of stock assessment data as detailed in Chapter 3. Such improvements could include evaluations of sample size, design, and data collection in the fishery and the surveys; the use of alternative methods for data analysis; consideration of a wider variety of assessment models; and better treatment of uncertainty in forecasting;
2. Improve relationships and collaborations between NMFS and harvesters by providing, for example, an opportunity to involve harvesters in the stock assessment process and using harvesters to collect and assess disaggregated catch per unit effort data;
3. Continue to educate stock assessment scientists through short-term exchanges among NMFS centers so that each center can keep abreast of the latest improvements in stock assessment technologies being used at other NMFS fishery science centers and other organizations in the United States or elsewhere;
4. Ensure that a greater number of independent scientists from academia and elsewhere participate in the Stock Assessment Review Committee (SARC) process; where necessary, pay competitive rates for such outside participation to ensure that a sufficient number of the best people are involved in the review;
5. Increase the frequency of stock assessments. As the New England Fishery Management Council intensifies its management of the Northeast fishery, stock assessments may have to be performed more frequently than every three years (the current timing);
6. Consider a wider range of scenarios (e.g., recruitment, individual growth, survival, sub- stock structure, ecosystem, data quality, compliance with regulations, long-term industry response) in evaluating management strategies;
7. Investigate the effects of specific management actions, such as closed areas and days at sea limitations, on fishing mortalities and related parameters;
8. Work toward a comprehensive management model that links stock assessments with ecological, social and economic responses, and adaptation for given long-term management strategies. This involves input from the social sciences (economics, social and political science, operations research) and from a wider range of natural sciences (ecology, genetics, oceanography) than traditionally is the case in fisheries management.
The committee has not explicitly considered the costs of implementing these recommendations, which may require either additional resources or a reprogramming of existing resources.
The committee concludes that stock assessment science is not the real source of contention in the management of New England groundfish fisheries. Comments at a public hearing held by the committee support this conclusion. Many speakers suggested that the social and economic concerns created by strong management measures and lack of participation in the management process were the more important concerns. Traditional fishery science has a major role to play in fisheries management, but sound stock assessment clearly is not the only consideration.
A59
The New England Fishery Management Council will be facing critical decisions, depending on the recovery or non-recovery of groundfish stocks. A long-term management strategy will be needed to decide the rate of rebuilding required reaching particular targets. Without sound stock assessment, targets and rebuilding rates cannot be set, nor can the effectiveness of the regulatory actions be measured. However, stock assessment in the narrow sense of estimating status and dynamics of fish populations is not sufficient for rational fisheries management. What constitutes a good management approach will vary over time, location, and components of the fish stock. To obtain the information necessary to design effective institutional and regulatory frameworks, it is essential that management draw on stock assessment, oceanography, ecology, economics, social and political science and operations research. Only when a more comprehensive approach is taken, with long-term management strategies based on data and insight from the various fields, properly accounting for the uncertainties surrounding data and theory, can fishery management provide for high continuing yield of food and health of stocks, while considering the needs of people dependent upon the fisheries.
A60
Appendix 17. Executive Summary from "Technical Guidance on the Use of Precautionary Approaches to Implementing National
Standard 1 of the Magnuson-Stevens Fishery Conservation and Management Act" (Restrepo et al. 1998)
The 1998 Guidelines for National Standard 1 (Optimum Yield) of the Magnuson-Stevens Fishery Conservation and Management Act, 50 CFR Part 600, state: "In general, Councils should adopt a precautionary approach to specification of OY." Because of the technical nature of the task, NMFS convened a panel of scientists to provide technical guidance on specifying OY that is consistent with the Guidelines (NSGs). The technical guidance is contained in this document.
The precautionary approach implements conservation measures even in the absence of scientific certainty that fish stocks are being overexploited. In a fisheries context, the precautionary approach is receiving considerable attention throughout the world primarily because the collapse of many fishery resources is perceived to be due to the inability to implement timely conservation measures without scientific proof of overfishing. Thus, the precautionary approach is essentially a reversal of the "burden of proof."
The precautionary approach in fisheries is multifaceted and broad in scope. The discussions in this document are not so broad in scope, and are limited to providing guidance to managers and scientists for specifying OY and for developing reference points to guide management decisions.
A common element in the application of the precautionary approach to fisheries management worldwide is the definition of "limits" intended to safeguard the long-term productivity of a stock. Several international agreements and documents that deal with the precautionary approach identify maximum sustainable yield (MSY) levels as a minimum standard for defining management limits. The Magnuson-Stevens Act encompasses this concept in that it constrains OY to be no greater than MSY.
The NSGs identify two limits for fishery management (referred to as "thresholds") that are necessary to maintain a stock within safe levels, capable of producing MSY: A maximum fishing mortality threshold (MFMT) and a minimum stock size threshold (MSST). The MFMT and MSST are intended for use as benchmarks to decide if a stock or stock complex is being overfished or is in an overfished state. In the NSGs, these two limits are intrinsically linked through an "'MSY Control Rule" that specifies how fishing mortality or catches could vary as a function of stock biomass in order to achieve yields close to MSY. If the maximum fishing mortality limit is reduced as biomass decreases, then the minimum stock size limit decreases (although the MSST cannot become lower than 2 of the equilibrium biomass under a constant-fishing mortality MSY control rule). Thus, the shape of the MSY control rule is an important consideration for developing status determination criteria for overfishing.
A default MSY control rule is recommended in Section 2 of this document. Noting that Councils have considerable flexibility in defining the shape of the MSY control rule for each stock under their jurisdiction, and that different control rule shapes pertain to different management objectives, the recommended default could be used in the absence of more specific analyses. The default makes use of estimates of the constant fishing mortality rate resulting in MSY, FMSY, and of the corresponding average spawning biomass, BMSY. The limit F, MFMT, is set equal to FMSY at higher stock sizes; if the stock decreases much below BMSY, the limit F is reduced proportionately (the reduction starts at a fraction of BMSY related to the level of natural mortality). It is anticipated that estimates of FMSY and BMSY will be either unavailable or unreliable for many stocks. For this reason, Section 2 also presents a discussion of useful proxies.
Another common element in the application of the precautionary approach to fisheries management worldwide is the specification of "targets" that are safely below limits. Setting OY at its limit (MSY in
A61
the Magnuson-Stevens Act) would not normally be precautionary because there could be a high probability of exceeding the limit year after year. Under the precautionary approach, the target should be set below the limit taking uncertainty and other management objectives into consideration. Development of control rules requires communication between fisheries managers, scientists, industry and the public. If performance criteria for target control rules can be defined, then a range of alternative control rules can be developed and evaluated in terms of precautionary behavior and other desirable economic or operational characteristics for management, once precautionary constraints have been met.
Control rules are pre-agreed plans for making management decisions based on stock size. The pre-agreed nature of the measures ensures that management actions are implemented without delay, and it is possible to respond rapidly to changing conditions. As with MSY control rules, Councils have considerable flexibility in defining targets. Section 3 presents a recommended default target control rule that could be used in the in the absence of more specific analyses. The default sets the target fishing mortality rate 25% below the default limit proposed in Section 2. The 25% reduction constitutes a safety margin that may not perform well for all stocks in terms of preventing overfishing. The performance of the default target can only be evaluated on a case-by-case basis and will depend on (a) the accuracy and precision of stock size, BMSY and FMSY estimates, (b) natural variability in population dynamics, and (c) errors in the implementation of management regulation. Age-structured deterministic models suggest that, for a large combination of life history parameters, the recommended default can result in high stock sizes (around 130% of BMSY) at the expense of relatively small foregone yields (achieving around 95% of MSY). It is recognized that no single policy can fully address all of the considerations to be encountered in the wide variety of fisheries subject to the Magnuson-Stevens Act. Nevertheless, the default target will be useful in variety of situations and should at least serve to encourage development of more suitable policies for individual fisheries.
The default target control rule may not be applicable for many stocks that are already below the MSST (i.e. that are already overfished). In such cases, the NSGs require that special plans be implemented to rebuild the stocks up to the BMSY level within a time period that is related to the stock’s productivity. The document does not propose a default rebuilding plan, because the time to rebuilding may depend on each stock’s current level of depletion. Instead, the document presents the four key elements that should be considered in rebuilding plans: An estimate of BMSY, a rebuilding time period, a rebuilding trajectory, and a transition from rebuilding to more optimal management. The default target control rule may be adapted into a rebuilding plan for each overfished stock, for example, by allowing only a very low fishing mortality when the stock is below the MSST in order to rebuild the stock within the rebuilding time period.
This document also discusses a number of special considerations, such as changes in the selectivity of fishing gear, mixed-stock situations, changes in productivity due to the environment, and the appropriateness of various proxies for MSY-related parameters. One consideration of particular importance relates to setting limits and targets for data poor stocks, i.e. those having very limited information. While the document provides defaults for these cases as well, it is imperative to improve the ability to make informed decisions through enhanced data collection and analyses.
Specification of MSY control rules, status determination criteria, and precautionary target control rules is a challenging exercise. Key to this process is communication between managers, scientists, users and the public. In the face of conflicting objectives (avoiding overfishing while achieving high long-term yields), it is essential to understand the trade-offs associated with alternative control rules and the importance of the weights assigned to the different objectives or performance criteria. Simulation frameworks can facilitate the necessary interaction. In addition, simulation tools should be used to examine the performance of management systems as a whole, including data collection, assessments, control rules, and implementation of management tactics.
A62
Appendix 18. Conclusions and Recommendations from theExecutive Summary of the NRC Report on Sustaining Marine
Fisheries (NRC 1999)
Conclusions
Many populations and some species of marine organisms have been severely overfished. There are widespread problems of overcapacity: there is much more fishing power than needed to fish sustainably. Fishing affects other parts of the ecosystem in addition to the targeted species, and those effects are only now beginning to be understood and appreciated. Other human activities, such as coastal development, have adverse effects on marine ecosystems as well. The effects of these human activities, combined with ecosystem effects of fishing, may well be more serious in the long term than the direct effects of fishing on targeted species. Although societies have been concerned about the effects of fishing on particular populations and species for centuries, recent recognition of the ecosystem effects of fishing has resulted in part from research on ecosystem approaches and has led to calls for the adoption of ecosystem approaches to fishery management to achieve sustainability at a high level of productivity of fish and of ecosystem goods and services.
The committee concludes that a significant overall reduction in fishing mortality is the most comprehensive and immediate ecosystem-based approach to rebuilding and sustaining fisheries and marine ecosystems. The committee's specific recommendations, if implemented, would contribute to an overall reduction in fishing mortality in addition to providing other protective measures.
The committee recommends the adoption of an ecosystem-based approach for fishery management whose goal is to rebuild and sustain populations, species, biological communities, and marine ecosystems at high levels of productivity and biological diversity, so as not to jeopardize a wide range of goods and services from marine ecosystems, while providing food, revenue, and recreation for humans. An ecosystem-based approach that addresses overall fishing mortality will reinforce other approaches to substantially reduce overall fishing intensity. It will help produce the will to manage conservatively, which is required to rebuild depleted populations, reduce bycatch and discards, and reduce known and as-yet- unknown ecosystem effects. Although this approach will cause some economic and social pain at first, it need not result in reduced yields in the long term because rebuilding fish populations should offset a reduction in fishing intensity and increase the potential sustainable yields. Reducing fishing effort in the short term is necessary to achieve sustainable fishing. The options lie in deciding how and when to reduce effort so as to reduce economic and social disruption. The options, however, can be exercised only if decisions are made before the resources are depleted.
Adopting a successful ecosystem-based approach to managing fisheries is not easy, especially at a global or even continental scale. That-is why the committee recommends incremental changes in various aspects of fishery management. The elements of this approach, many of which have been applied in single- species management, are outlined below. They include assignment of fishing rights or privileges to provide conservation incentives and reduce overcapacity, adoption of risk-averse precautionary approaches in the face of uncertainty, establishment of marine protected areas, and research. When overfishing (including bycatch) has been effectively eliminated, other human activities will be the major threat to fisheries and marine ecosystems. Although those effects are not a major focus of this report, they cannot be totally separated from fishing, and mechanisms involving cross-sectoral institutional arrangements will be needed to protect fisheries and marine ecosystems.
Recommendations
A63
The following are recommendations to achieve the broad goals and approach outlined above. Appropriate actions need careful consideration for each fishery and each ecosystem.
Conservative Single-Species Management
Managing single-species fisheries with an explicitly conservative, risk-averse approach should be a first step toward achieving sustainable marine fisheries. The precautionary approach should apply. A moderate level of exploitation might be a better goal for fisheries than full exploitation, because fishing at levels believed to provide the maximum long-term yield tends to lead to over-exploitation. Many species are overfished and their productive potential is impaired, even without considering the ecosystem effects of fishing for them. Expanding fisheries to include previously unfished or lightly fished species, such as deep-sea species, is unlikely to lead to large, sustainable increases in marine capture fisheries. Therefore, the committee recommends that management agencies adopt regulations and policies that strongly favor conservative and precautionary management and that penalize overfishing, as called for in the Magnuson-Stevens Fishery Conservation and Management Act of 1976 and the 1996 amendments to that act, often referred to as the Sustainable Fisheries Act of 1996.
As described in Chapter 5, the committee's recommendation for more conservative and precautionary management requires that the concept of maximum sustainable yield be interpreted in a broader ecosystem context to take account of species interactions, environmental changes, an array of ecosystem goods and services, and scientific uncertainty. This step, although important, will not by itself sustain marine fisheries and ecosystems at high levels of productivity.
Incorporating Ecosystem Considerations into Management
Fishery Management should take account of known and probable goods and services of marine ecosystems that are potentially jeopardized by fishing. The aim is to sustain the capacity of ecosystems to produce goods and services at local to global scales and to provide equitable consideration of the rights and needs of all beneficiaries and users of ecosystem goods and services.
Dealing with Uncertainty
Fisheries are managed in an arena of uncertainty that includes an incomplete understanding of and ability to predict fish population dynamics, interactions among species, effects of environmental factors on fish populations, and effects of human actions. Therefore, successful fishery management must incorporate and deal with uncertainties and errors. The committee recommends the adoption of a precautionary approach in cases of uncertainty. Management should be risk-averse. Although research and better information can reduce uncertainty to a degree, they can never eliminate it.
Many problems that fishery managers face are issues concerning long-term versus short-term goals and benefits. Uncertainty in stock assessments and in future allocations of those stocks has led to an emphasis on short-term benefits at the expense of long-term solutions. Uncertainties over shares when allocations allow open competition can compel individuals to adopt a short-term horizon for decisions related to fishing effort and investment. Management incentives and institutional structures must counteract these responses to uncertainty that jeopardize sustainability. This is especially true when stock assessments are uncertain, which makes it harder for managers to hold the line on conservation.
Reducing Excess Fishing Capacity and Assignment of Rights
Excess fishing capacity (fishing capacity is the ability to catch fish or fishing power) and overcapitalization (capitalization, related to capacity, is the amount of capital invested in fishing vessels and gear) reduce the economic efficiency of fisheries and usually are associated with overfishing. Substantial global reductions in fishing capacity are the highest priority to help reduce overfishing and to deal with uncertainty and unexpected events in fisheries. Overcapacity is difficult to manage directly, and usually evolves in management regimes that encourage unrestricted competition for limited resources. Consequently, managers and policy makers should focus on
A64
developing or encouraging socioeconomic and other management incentives that discourage overcapacity and that reward conservative and efficient use of marine resources and their ecosystems.
At the core of today's overcapacity problem is the lack of, or ineffective, definition and assignment of rights in most fisheries. In addition, subsidies that circumvent market forces have contributed significantly to the overcapacity problem in many fisheries. Therefore, the committee recommends for many fisheries a management approach that includes the development and use of methods of allocation of exclusive shares of the fish resource or privileges and responsibilities (as opposed to open competition) and the elimination of subsidies that encourage overcapacity. A flexible and adaptive approach is essential and careful attention must be given to equity issues associated with such approaches. The committee recommends experimental approaches to community-based fishery management including the development of virtual communities. This would include research into the establishment of management groups in which participation is based on shared interests in a fishery and its associated ecosystem, with diminished emphasis on where participants live or their direct financial interest.
Marine Protected Areas
Where they have been used, marine protected areas-where fishing is prohibited have often been effective in protecting and rebuilding ecosystems and populations of many (but not all) marine species. They often lead to increases in the numbers of fish and other species in nearby waters. Importantly, they can provide a buffer against uncertainty, including management errors. Permanent marine protected areas should be established in appropriate locations adjacent to all U.S. coasts. It will be important to include highly productive areas-that is, areas in which fishing is good or once was-if this management approach is to produce the greatest benefits.
Protected areas will make the most effective contribution to the management of species and ecosystems when they are integrated into management plans that cover the full life cycles and geographic ranges of the species involved. Smaller, fixed protected areas will be most effective for species with life stages that are spent in close association with fixed topography, such as reefs, banks, or canyons. For other species, the degree of effectiveness of protected areas will be related to the importance of fixed topography in various stages of their lives. Wholly or largely pelagic species move according to ocean currents or other factors that are not necessarily related to fixed topographic structures and are thus likely to benefit less from small protected areas.
The design and implementation of marine protected areas should involve fishers to ensure that they believe the resulting systems will protect their long- term interests and to improve operational integrity. Because attempts to develop marine protected areas in the United States have been strongly opposed by some fishers, the broad involvement of users is a key strategy. Current theory and experience make clear that marine protected areas must be established over a significant portion of the fishing grounds to have significant benefits. Recent calls for protecting 20 percent of potential fishing areas provide a worthwhile reference point for future consideration, and emphasize the importance of greatly expanding the areas currently protected.
Marine protected areas are not alternatives to other techniques of fishery management and to the other recommendations in this report. They should be considered as only one of a suite of important ecosystem approaches to achieve sustainable fisheries and protect marine ecosystems. For marine protected areas to be most successful as fishery-management tools, their intended purposes must be clearly defined.
Bycatch and Discards
Bycatch and discards add to fishing mortality and should be considered as part of fishing activities rather than only as side effects. Estimates of bycatch should be incorporated into fishery-management plans and should be taken into account in setting fishing quotas and in understanding and managing fishing to protect ecosystems and nonfished ecosystem components. Reducing fishing intensity on
A65
target species can reduce bycatch, often with no long-term reduction in sustainable yield. In some cases, technological developments and careful selection of fishing gear (e.g. bycatch-reduction devices) can be effective in reducing bycatch, and those options should be encouraged, developed, and required where appropriate. More information is needed on discards and on bycatch and their fate (i.e. whether bycatch is retained or discarded and whether discards survive or die).
Institutions
Effective fishery management requires structures that incorporate diverse views without being compromised by endless negotiations or conflicts of interest. The committee recommends developing institutional structures that promote:
effective and equitable reduction of excess capacity,
sustainable catches of targeted species,
expansion of the focus of fishery management to include all sources of environmental degradation that affect fisheries,
consideration of the effects of fishing on ecosystems,
development and implementation of effective monitoring and enforcement, and
the collection and exchange of vital data.
To achieve these goals, the spatial and temporal scales at which the institutional structures operate should better match those of important processes that affect fisheries. Participation in management should be extended to all parties with significant interests in marine ecosystems that contain exploited marine organisms. Institutions should allocate shares in or rights to fisheries, rather than allowing openly competitive allocations. The clear explication of management goals and objectives is a prerequisite to achieving effective and equitable management.
Information Needs
Better understanding is needed of the structure and functioning of marine ecosystems, including the role of habitat and the factors affecting stability and resilience. This includes attempting to understand mechanisms at lower levels of organization (i.e. populations and communities), long-term research and monitoring programs, development of models that incorporate unobserved fishing mortality and environmental variability (e.g. El Nino events) into fishery models, multispecies models, and trophic models. More research is also needed on the biological effects of fishing, such as the alteration of gene pools and population structures as a consequence of fishing. More research is needed on the conditions under which marine protected areas are most effective, and marine protected areas themselves should be used as research tools as well as for conservation.
More information is needed on the effects and effectiveness of various forms of rights-based management approaches and other management regimes, on the way people behave in response to different economic and social incentives, and on barriers to cooperation and sharing of information. The committee recommends research into the roles of communities in fisheries management, including the use of community-based quotas and other assignments of rights to communities, and explorations into the feasibility of granting management responsibilities to those engaged in a particular fishery, regardless of their geographical community (“virtual communities”).
The need for more information should not be used as an excuse for inaction; that excuse has contributed significantly to current problems. Enough is known to begin taking action now.
A66
Appendix 19. Extract from the Executive Summary of the Ecosystem Principles Advisory Panel Report (NRC 1999b)
Ecosystem-based management can be an important complement to existing fisheries management approaches. When fishery managers understand the complex ecological and socioeconomic environments in which fish and fisheries exist, they may be able to anticipate the effects that fishery management will have on the ecosystem and the effects that ecosystem change will have on fisheries. However, ecosystem-based management cannot resolve all of the underlying problems of the existing fisheries management regimes. Absent the political will to stop overfishing, protect habitat, and support expanded research and monitoring programs, an ecosystem-based approach cannot be effective.
A comprehensive ecosystem-based fisheries management approach would require managers to consider all interactions that a target fish stock has with predators, competitors, and prey species; the effects of weather and climate on fisheries biology and ecology; the complex interactions between fishes and their habitat; and the effects of fishing on fish stocks and their habitat. However, the approach need not be endlessly complicated. An initial step may require only that managers consider how the harvesting of one species might impact other species in the ecosystem. Fishery management decisions made at this level of understanding can prevent significant and potentially irreversible changes in marine ecosystems caused by fishing.
Recognizing the potential of an ecosystem-based management approach to improve fisheries management, Congress requested that the National Marine Fisheries Service (NMFS) convene a panel of experts to: 1) assess the extent to which ecosystem principles are currently applied in fisheries research and management; and 2) recommend how best to integrate ecosystem principles into future fisheries management and research. In response, NMFS created the National Marine Fisheries Service Ecosystem Principles Advisory Panel (Panel). The Future of Ecosystem Approaches in U.S. Fisheries Management
Fisheries scientists and managers are beginning to grasp the potential of ecosystem-based fishery management to improve the sustainability of fisheries resources. Given the depressed state of many U.S. fisheries, this awareness must be expanded and actions taken to implement this approach. Our management recommendations and research actions provide a pragmatic framework within which to apply the ecosystem Principles, Goals, and Policies. The success of this approach depends on full implementation of measures already underway as a result of the passage of the Magnuson-Stevens Fishery Conservation and Management Act (MSFCMA) (NMFS 1996), particularly the essential fish habitat (EFH) requirements and strengthened national standards. The recommendations contained in this report provide the required next steps.
While some of the recommended actions can start immediately, we believe that legislation is required to implement measures like the FEP. Given that legislative processes may require three to five years to enact the proposed regulations, we recommend interim actions by the Secretary of Commerce to develop demonstration FEPs and to encourage voluntary adoption by management Councils of the Principles, Goals, and Policies proposed herein. We also are aware that these new tasks will require additional human and financial resources for full implementation.
The benefits of adopting ecosystem-based fishery management and research are more sustainable fisheries and marine ecosystems, as well as more economically-healthy coastal communities. We have
A67
identified the actions required to realize these benefits. We urge the Secretary and Congress to make those resources available.
Summary of Recommendations
Fisheries management and policy recommendations are directed toward Congress for implementation by NMFS and the Councils. Interim measures and research recommendations are directed toward the Secretary of Commerce for implementation by NMFS and other appropriate agencies.
Develop a Fisheries Ecosystem Plan (FEP)
Require each Council to develop an FEP for the ecosystem(s) under its jurisdiction. The FEP is an umbrella document containing information on the structure and function of the ecosystem in which fishing activities occur, so that managers can be aware of the effects their decisions have on the ecosystem, and the effects other components of the ecosystem may have on fisheries.
Each FEP should require the Councils to take, at least, the following eight actions:
1. Delineate the geographic extent of the ecosystem(s) that occur(s) within Council authority, including characterization of the biological, chemical, and physical dynamics of those ecosystems, and “zone” the area for alternative uses.
2. Develop a conceptual model of the food web.
3. Describe the habitat needs of different life history stage for all plants and animals that represent the “significant food web” and how they are considered in conservation and management measures.
4. Calculate total removals-including incidental mortality-and show how they relate to standing biomass, production, optimum yields, natural mortality, and trophic structure.
5. Assess how uncertainty is characterized and what kind of buffers against uncertainty are included in conservation and management actions.
6. Develop indices of ecosystem health as targets for management.
7. Describe available long-term monitoring data and how they are used.
8. Assess the ecological, human, and institutional elements of the ecosystem which most significantly affect fisheries, and are outside Council/Department of Commerce (DOC) authority. Included should be a strategy to address those influences in order to achieve both FMP and FEP objectives.
Measures to Implement FEPs
The following are general recommendations to ensure effective development and implementation of FEPs:
1. Encourage the Councils to apply ecosystem Principles, Goals, and Policies to ongoing activities.
2. Provide training to Council members and stuff.
3. Prepare guidelines for FEPs.
A68
4. Develop demonstration FEPs.
5. Provide oversight to ensure development of and compliance with FEPs.
6. Enact legislation requiring FEPs.
Research Required to Support Management
Require and provide support for NMFS and other appropriate agencies to initiate or continue research on three critical research themes which will provide the information necessary to support ecosystem-based fisheries management. Theses themes are:
1. Determine the ecosystem effects of fishing.
2. Monitor trends and dynamics in marine ecosystems (ECOWATCH).
3. Explore ecosystem-based approaches to governance.
CONTACT: David Detlor, Office of Science and Technology, National Marine Fisheries Service.
A69
Appendix 20. Extract from the Executive Summary of the NRC Study on Improving the Collection, Management, and Use of Marine
Fisheries Data (NRC 2000)
FINDINGS AND RECOMMENDATIONS
Broader Data Collection, Use, and Management
The committee believes that all the participants in fisheries management should take actions to improve the collection, management, and use of fisheries data. The committee developed the following recommendations to Congress, NMFS, the regional councils, interstate commissions, and commercial and recreational fishermen with the objective of improving fisheries data and thereby fisheries management.
Recommendations to Congress
The U.S. Congress affects fisheries science and policy in two primary ways. First, Congress is the architect of the centerpiece of federal fisheries legislation, the Magnuson-Stevens Act. At present, Congress is formulating legislation to reauthorize the Magnuson-Stevens Act, whose funding authority expires on October 1, 2000. The committee recommends several ways in which the reauthorization could improve fisheries data collection, management, and use in the United States.
Second, Congress appropriates funding for NMFS, the regional councils, and interstate and international commissions to carry out their activities related to fisheries science and management. The committee highlights several items for which additional funding could improve fisheries data collection, management, and use and, consequently, fisheries management. Funding for more capable research vessels and for planning a Fisheries Information System are recent examples of positive congressional steps toward modernization of fisheries data.
Fisheries management is based on ad hoc methods of data collection developed over the past 25 years that may no longer lead to the best management. Congress should support and encourage NMFS to reevaluate its systems of data collection, management, and use, and to conduct research to increase the effectiveness of these activities. Another important need is for a fishery-by-fishery analysis of the costs and benefits associated with data collection and fisheries management.
In the most recent reauthorization of the Magnuson-Stevens Act, Congress requested that NMFS develop a preliminary design for a Fisheries Information System. The committee believes that such a system could improve and standardize the management of U.S. marine fisheries data and thereby help managers understand regional trends and how they fit into the national context. The committee believes that the Fisheries Information System should be funded on an experimental basis for a fixed term, perhaps 10 years, with quantifiable and measurable objectives that can be evaluated at the end of that period.
Congress should continue to support the acquisition and calibration of new NMFS fishery research vessels that are more effective in data collection and handling than the vessels currently available in the aging NMFS fleet. The so-called "fish for research" programs used by NMFS and regional fishery management councils have proven to be a useful means of involving commercial fishermen in research and sampling. Congress should continue to support such programs, with the details of implementation left to the discretion of regional councils.
Congress should amend the Magnuson-Stevens Act to limit the confidentiality of commercial data. By providing better access to commercial data, such a step would help managers and scientists better understand the biology, sociology, and economics of fisheries. Sunset periods on confidentiality are logical outcomes of the public ownership of marine fish resources and the public trusts responsibilities
A70
of NMFS and the regional councils in fisheries management. The proprietary periods may vary by data type (e.g. they may be shorter for fishing locations than for economic data) and by specific fishery, and these periods should be determined cooperatively between fishery managers and stakeholders. As part of the effort to gather and disseminate needed data, Congress should lift the prohibitions in the Magnuson-Stevens Act on collection of economic data (Sec. 303[b][7] and 402[a]).
Recommendations to NMFS
NMFS has many, in some cases conflicting, responsibilities. NMFS and the regional fishery management councils often suffer from a credibility problem and are more or less continuously engaged in conflicts with commercial and recreational fishermen and environmental advocates who disagree with fishery management plans or other aspects of fisheries management. These conflicts range from criticism voiced in regional council meetings and other public meetings to legal challenges to fishery management plans approved by the councils and NMFS. Some of these conflicts are probably unavoidable results of the dynamics of the regulator-regulated relationship between NMFS and fishermen and their different perceived objectives–such conflict is to be expected. Nevertheless, NMFS and fishermen do share a fundamental objective: the long-term sustainable use of marine living resources and the acquisition of whatever data are necessary to achieve this objective. NMFS and fishery stakeholders should work together to resolve their conflicts to achieve "win-win" solutions. Conflicts might be reduced by greater cooperation between NMFS and fishermen in data collection, so that NMFS develops trust in data from commercial and recreational fisheries and fishermen become confident that NMFS provides accurate data and assessments.
NMFS should continue to explore more cost-effective ways of obtaining the fisheries data it needs, including implementing new remote sensing techniques (e.g., hydro-acoustics); implementing electronic logbooks and vessel monitoring systems; increasing observer coverage where needed; developing adaptive sampling in appropriate fisheries; and, especially, finding ways to improve commercial data to make it more useful for stock assessments and finding ways to estimate recreational catch more quickly to allow in-season management of recreational fisheries. NMFS also should consider creating mechanisms to obtain advice from commercial and recreational fishermen related to specific data collection policies and procedures. This could be accomplished through a combination of national meetings to discuss national -level policies and regional meetings to discuss data collection in specific fisheries, possibly through each regional council's scientific and statistical committee.
The Marine Recreational Fisheries Statistics Survey (MRFSS) should be fully funded and include all coastal states and territories that request inclusion. NMFS should invest in research related to MRFSS and investigate new ways to enlist recreational fishermen in data collection for routine monitoring and special studies, but only if the agency intends also to fund implementation of the results of the research. It appears that MRFSS funding and staff levels are adequate only to maintain the existing survey and conduct a minimal amount of research, the results of which are not always implemented in a timely manner. Some recommendations have been implemented (e.g., changes in variance estimates), whereas others remain to be implemented (e.g., retention of previously contacted anglers in subsequent surveys).
NMFS should standardize the data sets and protocols included in the proposed Fisheries Information System, using the standards for spatial and other data established by the Federal Geographic Data Committee. The agency should consider moving away from proprietary data management software to software that is available from many vendors and for which data access and analysis routines can be written easily.
NMFS should evaluate the success of commercial data management firms in providing real-time value-added data products for specific operational purposes, and should determine ways to encourage such entrepreneurial activities. At the same time, NMFS should endeavor to obtain useful data from such sources.
A71
The committee identified a number of data collection activities that merit special attention from fishery scientists with both NMFS and the academic community:
Developing methods for evaluating the ecological benefits of fish stocks and their role in marine ecosystems.
Determining how to minimize changes in the relationship of actual abundance to indices of abundance (e.g., survey, commercial, or recreational catch per unit effort) and misreporting when management systems are changed.
Testing adaptive sampling for data collection for both NMFS and industry.
Linking environmental, economic, and social data, as well as climate forecasts, to stock assessments.
Improving understanding of the functioning of marine ecosystems affected by fishing activities by studying important non-target species to determine their feeding habits, their distribution, and their prey and predators.
Gaining a greater understanding of the economic and social motivations of fishermen so that data from commercial and recreational fisheries can be interpreted correctly.
Validating procedures for determining fish ages and identifying stocks.
Recommendations to Regional Fishery Management Councils Regional councils should be more proactive and innovative in developing mechanisms within fishery management plans that encourage NMFS to work more effectively with commercial and recreational fishermen in data collection. Councils should play a major role in promoting greater use of data from commercial and recreational fisheries by including programs for collecting and using such data in fishery management plans, and working with NMFS to design appropriate mixtures of data collection approaches (e.g., vessel monitoring systems, observers, logbooks). The design and implementation of fishery management plans should include consideration of how data quality might be enhanced and whether data of the required accuracy and precision are available or could be collected in a cost-effective manner. If sufficient data quality is unlikely to be achievable at a reasonable cost for a particular type of management, councils should consider alternative, less data-intensive management systems. Councils should give serious consideration to new "fish for research" programs that could engage fishermen in data collection and research. Councils should obtain the data needed to conduct in-season management of recreational fisheries or, conversely, manage recreational fisheries conservatively enough so that in-season data are not necessary. They should work with NMFS to improve outreach to commercial and recreational fishermen, and should encourage independent review of data collection and stock assessments on a regular basis.
Recommendations to Interstate Commissions
Interstate commissions should find ways to increase the standardization of state survey data used in federal stock assessments, consistent with important state uses of the data. Commissions should work with NMFS and the states to create and maintain regional databases, and coordinate them through the proposed Fisheries Information System.
Recommendations to Commercial Fishermen
Commercial fishermen are a critical source of data about the fish stocks they depend on, and more generally, about marine ecosystems. Under most existing management systems, however, commercial fishermen have many incentives to misreport catch data and few incentives to provide accurate and complete data. Although the extent of misreporting is hard to quantify, anecdotal evidence suggests
A72
that it does occur. Many improvements in fisheries management will require active participation of commercial fishermen in data collection, including more extensive cooperation in sampling and a reduction in misreporting of commercial data. Commercial fishermen should work with NMFS to obtain accurate and precise measures of the relative abundance of fish stocks, both through commercial data and research surveys. Commercial fishermen could help improve both and it would be to their benefit to do so-the fish stocks on which they depend are more likely to be sustained if both fishermen and managers share the same accurate view of the abundance of fish stocks.
Recommendations to Recreational Fishermen
Recreational fishermen presently play a relatively small and passive role in data collection, although the interest of anglers in participating in fish-tagging studies have been well demonstrated through the efforts of the American Littoral Society and others to tag sportfish. Angler organizations should increase their cooperation with NMFS and academic scientists to assist in routine data collection and scientifically designed, targeted studies, in order to improve the recreational catch data that are needed in stock assessments. Although scientifically designed tagging studies demand careful implementation, they are crucial to the accurate assessment of fish mortality and movement. Angler assistance is particularly important in fisheries that have a significant recreational component, such as the summer flounder fishery.
CONCLUSION
The future of fisheries management will be based on complementary data from fishery-independent surveys, commercial fishermen, and recreational fishermen. A particular need is to improve the quality of data from commercial and recreational fisheries, so that stock assessment scientists can be justifiably confident about using such data in their models. Commercial and recreational sources could provide large quantities of data important for stock assessments and for understanding the social and economic aspects of marine fisheries, but these data are not always useful in their present form. The sustainable use of marine fish resources, and concomitant protection of marine environments, will require new levels of commitment by the public and their representatives in Congress and federal and state governments to fund and carry out appropriate data collection and management.
A73
Appendix 21. List of Relevant National Marine Fisheries Service Partnerships
Academic Institutions
Auburn University Albion College Bethune-Cookman College Boston University Bridgeport Aquaculture High School California State University (Chico, Humboldt, Long Beach, Monterey Bay, San Diego,
San Francisco, San Jose) Cape Fear Community College Central Connecticut University College of the Atlantic College of Charleston Colorado State University Columbia University Cornell University Coastal Carolina University Dartmouth University Dillard University Duke University East Carolina University East Tennessee State University Eckerd College Fairfield University Florida A&M University Florida Atlantic University Florida Institute of Technology Florida International University Florida Marine Research Institute Florida Memorial College Florida State University Hampton University Harvard University Hawaii Preparatory Academy Iona College Iowa State University Jackson State University Kutztown University Louisiana State University Marine Biological Laboratory (Woods Hole) Massachusetts Institute of Technology McNeese State University Monmouth University Montana State University North Carolina State University Nova Southeastern University Old Dominion University Oregon Health & Science University Oregon State University Rutgers University St. Georges School, RI
A74
St. Mary's College, CA Savannah State University Sonoma State University State University of New York (Stony Brook) Texas A&M University Texas Tech University The Sound School, CT Universidad Metropolitana, Puerto Rico University of Alaska University of California (Berkeley, Davis, Irvine, San Diego, Santa Barbara, Santa Cruz) University of Charleston University of Colorado University of Connecticut University of Delaware University of Florida University of Hawaii University of Idaho University of Kansas University of Maine University of Maryland University of Massachusetts University of Miami University of Minnesota University of New Hampshire University of North Carolina University of Puerto Rico University of Rhode Island University of South Alabama University of South Florida University of Southern Mississippi University of Tennessee University of Texas University of Virginia University of West Florida University of Washington University of Western Carolina Virginia Institute of Marine Sciences Virginia Polytechnic Institute and State University William and Mary (College of) Worcester Polytechnic Institute Yale University
Federal Agencies
Yale University Bonneville Power Administration National Aeronautical and Space Administration National Research Council National Science Foundation Regional Fishery Management Councils (8) Smithsonian Institute
- American Museum of Natural History U.S. Army Corps of Engineers U.S. Department of Agriculture U.S. Department of Commerce
- National Oceanic and Atmospheric Administration
A75
U.S. Department Of Defense- Civil Applications Committee- Navy
- Naval Research Laboratory- Fleet Numerical Meteorology and Oceanography Center- Naval Postgraduate School- Office of Naval Research
U.S. Department of Energy- Brookhaven National Laboratory- Oak Ridge National Laboratory
U.S. Department of the Interior- Bureau of Reclamation- Fish and Wildlife Service- Geological Survey- Minerals Management Service- National Park Service
U.S. Department of State U.S. Department of Transportation
- Coast Guard- Maritime Administration
U.S. Environmental Protection Agency U.S. Marine Mammal Commission
State Agencies
Alabama Department of Natural Resources Alaska Beluga Whale Committee Alaska Department of Fish and Game Alaska Department of Environmental Conservation Alaska North Slope Borough Atlantic States Marine Fisheries Commission California Dept. of Water Resource
- Interagency Ecological Program California Dept. of Fish and Game Commission California Health Department Connecticut Department of Environmental Protection Connecticut-New York Long Island Sound Habitat Restoration Committee Delaware Department of Fish and Game Exxon Valdez Oil Spill Trustee Council Florida Department of Environmental Protection Florida Department of Natural Resources Florida Fish and Wildlife Resources Commission Georgia Department of Natural Resources Gulf States Marine Fisheries Commission Hawaii Coastal Zone Management Program Hawaii Department of Business, Economic Development and Tourism Long Island Sound Lobster Mortality Working Group Hawaii Department of Land and Natural Resources Idaho Department of Fish and Game Louisiana Department of Wildlife and Fisheries Maine Department of Marine Resources Maine Water Resource Resources Authority Maryland Department of Natural Resources Massachusetts Department of Natural Resources Mississippi Bureau of Marine Resources New Hampshire Fish and Game Department
A76
New Jersey Department of Environmental Protection New Jersey Fish, Game and Wildlife New York Department or Environmental Protection North Carolina Department of Environmental and Natural Resources North Carolina Department of Transportation North Carolina Maritime Museum North Carolina Sea Grant North Carolina Shellfish Sanitation North Carolina Wildlife Resources Commission Oregon Department of Fish and Wildlife Pacific States Marine Fisheries Commission Puerto Rico Department of Natural Resources Puget Sound Water Quality Action Team Rhode Island Department of Environmental Management South Carolina Department of Natural Resources South Carolina Marine Resources Department South Florida Water Management District Texas Parks and Wildlife Department Virgin Islands Department of Planning and Natural Resources Virginia Marine Resources Commission Virginia Marine Science Museum Virginia Sea Grant Consortium Washington Department of Fish and Wildlife Washington State Board of Technical & Community Colleges Waterford East Lyme Shellfish Commission
Fishing Vessels
Alaska Draggers Association, Al Burch, F/V Hazel, Lorraine, Hickory Wind At-Sea Processors Association, Trevor McCabe, F/V Katie Ann Einar Peterson, Tim Cosgrove, F/V Vesteraalen Groundfish Forum Inc., John Gauvin, F/V American No. 1 Fisherman’s Marketing Association (Fishing vessels determined by bid) Ocean Prowler Partnership, F/V Ocean Prowler Morning Star LP, David Stanchfield, F/V Morning Star Trident Seafoods,Jim McManus, F/V Aldebaran, Arcturus, Dominator
Industry
AIRSTAR Communication American Bureau of Shipping Aquaseed, Inc. Aquatic Farms, Hawaii ARIS Corporation Atlantic Offshore Lobster Association Bandon Pacific Seafoods Beaufort Fisheries, Inc. Bornstein’s Seafoods Browning-Ferris Industries Inc. Cedar Island Marina, CT C&C Technologies Coastal Biomarine Daybrook Fisheries Inc. Downeast Lobster Association Destron-Fearing Fisherman’s Marketing Association
A77
Fishing Family Assistance Centers (New Bedford & Gloucester) Florida Power and Light (St. Lucie Power Plant) Garden State Seafood Association Gloucester Fishermen’s Wives Association Gulf and South Atlantic Fishery Development Foundation Hallmark Seafoods International Gamefish Association Jersey Coast Anglers Association Johnson Controls Kaman Aerospace Corp. Lotek Marine Technologies Inc. Makai Animal Clinic Maine Lobster Association Midwater Trawlers Association Monroe County Commercial Fisherman’s Association National Geographic Ocean Futures Natural Resources Consultants Inc. NET Systems Inc. North Carolina Power Company North Carolina Coastal Federation, Inc. Ocean Imaging Co. Ocean Technology Foundation Omega Protein Inc Pacific Shrimp, Inc. Pacific Whiting Conservation Cooperative Pyrcon, Inc. Reed Mariculture Rhode Island Saltwater Anglers Association Science Applications International Corporation Scientific Fisheries Systems, Inc. Sea World of Texas Seafood Processor’s Association Simrad Inc. Sunbeam Sport Fishing Fleet Virginia Power Company Washington Fish Growers Association World Services, Inc.
Private & Non-Profit Organizations
American Fisheries Society American Institute of Fishery Research Biologists Audubon Society Bald Island Conservation Center for Marine Conservation Chelonia, Inc. Children’s Hospital Coastal conservation Association COMPASS-COMunication PArtnership for Science and Sea Consortium for Oceanographic Research and Education Dolphin Ecology Project, Florida Keys Environmental Defense Fund Gulf of Maine Council on the Marine Environment Harbor Branch Oceanographic Institute Heinz Center Hubbs-Sea World Research Institute
A78
Jekyll Island Authority Karen Beasley Sea Turtle Rescue & Rehabilitation Center Marine Fish Conservation Network Monterey Bay Aquarium Monterey Bay Aquarium Research Institute Mote Marine Laboratory Nags Head Dolphin Watch National Fish and Wildlife Foundation National Aquarium in Baltimore National Geographic Society National Fisheries Institute Natural Resources Defense Council Nature Conservancy New England Aquarium Pacific Aquaculture Caucus Pacific Ocean Conservation Network Reef Environmental Education Foundation Regional Association for Research on the Gulf of Marine Savannah Science Museum Sierra Club-National Marine Fisheries & Habitat Commission The Dolphin Project Whale Acoustics, WY Woods Hole Oceanographic Institute World Wildlife Fund
Indian Nations & Groups
Quilleute Tribe Nez Perce Tribe Northwest Indian Fish Commission Suquamish Tribe Yakama Indian Nation Northwest Indian College
International Agencies & Academic Institutions
Asian-Pacific Economic Cooperation Forum (APEC) Australia
- Commonwealth Scientific and Industrial Research Organization (CSRIO)- James Cook University - Murdoch University - South Australia Fisheries Department - University of New England- University of Queensland
Brazil- National Institute for Research on the Amazon
Canada- British Columbia Ministry of Environment Lands and Parks- Dalhousie University - Department of Fisheries and Oceans- McGill University - Queens University- University of New Brunswick
Chile- Instituto de Fomento Pesquero- Unversidad de Concepcion
A79
China- Overseas Fisheries Development Council- Chinese Academy of Sciences
Denmark- Danish Institute of Marine Fisheries
France- IFREMER
Ghana- Fisheries Laboratory
Grand Cayman Island- Cayman Turtle Farm
Greece- National Centre for Marine Research
Ireland- Marine Institute of Ireland - University of Cork
Israel- Limnological and Oceanographic Society
Italy- University of Padua
Japan - Fisheries Agency of Japan- Hokkaido University
Mexico- Centro de Investigacion Cientifica y de Edcacion Superior de Ensenada
(CICESE)- Instituto Nacional de la Pesca (INP)- Investigaciones Mexicanas de la Corriente de California (IMECOCAL)- Universidad Nacional Autonoma de Mexico (UNAM)
Morocco- Fisheries Research Institute
Mozambique- Fisheries Research Institute
New Zealand- National Institute of Water and Atmospheric Research- University of Otago
Nigeria- Institute for Oceanography & Marine Research
Norway- Akvaforsk- Institute of Marine Research (Bergen)- University of Bergen
Portugal- Unviersidade da Maderia
Russia- Pacific Research Institute of Fisheries and Oceanography (TINRO) Laboratory
Senegal- Center for Research in Oceanography
South Africa- Sea Fisheries Institute of South Africa- Natal Sharks Board
Spain- Instituto Espanol de Oceanografia - Ministerio de Agricultura, Pesca y Alimentaction
Taiwan- National Taiwan University
A80
United Kingdom- Medical Research Center (Edinburg)- Natural Environment Research Council- Southampton University- University of Cambridge - University of Durham - University of Oxford
Ukraine - Ukraine Southern Scientific Research Institute of Marine Fisheries and
Oceanography (YUGNIRO)
International – Commissions
Commission for the conservation of Antarctic Marine Living Resources (CCAMLR) Inter-American Tropical Tuna Commission (IATTC) Intergovernmental Oceanographic Commission (IOC) International Council for the Conservation of Atlantic Tunas (ICCAT) International Council for the Exploration of the Sea (ICES) International Institute for Fisheries Economics and Trade (IIFET) International Pacific Halibut Commission (IPHC) International Whaling Commission (IWC) North Pacific Anadromous Fish Commission (NPAFC) North Pacific Marine Science Organization (PICES) Northwest Atlantic Fisheries Organization (NAFO) Secretariat of the Pacific Community, Oceanic Fisheries Program (SPC) South Pacific Forum Fisheries Agency The World Bank United Nations
- Food and Agriculture Organization (FAO)- Development Program - Development Organization- Educational, Scientific and Cultural Organization
United States – South African Bilateral Commission
CONTACT: Bonnie Ponwith, Office of Science and Technology, National Marine Fisheries Service.
A81
Appendix 22. Cooperative Research Programswith the Fishing Industry
Increasingly, there is interest among fishers to participate more directly in the collection of information relevant to the status of exploited fishery resources. Traditionally, information collected from fishing operations has been utilized to characterize catches, discards and fishery-dependent abundance indices based on CPUE. However, improvements in technology to monitor fishing gear performance and to collect and transmit near real-time information on ship location and other positional and catch data present new opportunities to reevaluated fishers' roles in this process. Several pilot cooperative research projects have already been successfully completed and a number of new regionally-based projects are currently in progress, particularly in the northeastern U.S. A National Cooperative Research Program is currently under development.
Fishery-Dependent Data
Fishery catch data are a key component of stock assessments because these data document minimum mortalities attributable to fishing, biological characteristics of the harvested species and, if taken in time series, trends in relative catch rates and representation of strong and weak year classes. When combined with indices of abundance, they represent a critical element of stock assessments. Collection and analysis of fishery-dependent data remain problematic since it requires a distributed data collection system that must take census and sample data representing numerous fleets, gear types, ports, and target species. Millions of dollars are expended by federal, state and private entities to document fishery catches. Additional data on the discard patterns of fisheries need to be collected from fishing operations to document these mortalities. Traditional methods of paper logbooks, port samplers and hierarchical data systems are problematic because of the time-delays inherent in assembling these data and in the inevitable problems of data accuracy and completeness. Increasingly, managers require more timely information on patterns of catch and relative abundance on a stock-by-stock basis, at increasingly finer scales in time and space (e.g. in support of time/area restrictions on fisheries). Given this need, there is growing consensus to utilize electronic data collection and transmission systems aboard fishing vessels to improve the accuracy and timeliness of such data for fishery stock assessment and management purposes, where feasible. Programs are underway in all regions to test the feasibility of electronic data collection and data transfer systems and, where tested, there seems to be broad-based support by fishers and fishing groups.
Fishery-Independent Surveys
Most fishery independent survey data are currently collected using either government research vessels or those chartered to the government to collect data in survey mode. The key consideration in developing time series of fisheries independent survey data is to assure that changes in survey catches are not the result of changes in gear efficiency or other operational concerns. There is a substantial unmet need, particularly in some regions, to survey stocks not covered by existing programs. Additionally, improvements in the precision of surveys and increases in spatial coverage may be necessary to support some management needs. Fishers are interested in assuming some of these responsibilities, particularly if the issues of survey comparability can be addressed. New technologies offer the ability to document the spatial coverage, bottom contact and other characteristics of towed and fixed gears, thereby offering the potential of addressing some of the gear standardization issues. Increasing fisher involvement in standardized surveys can improve the comprehensiveness of information available for stock assessment, and narrow the basis for disputes regarding stock status. Given the increasing availability of technology to monitor gear performance, and the increasing willingness of fishers to be involved in surveying activities, there appears to be a role for utilizing fishing vessels to improve fishery-independent indices in certain prescribed situations.
CONTACT: Steve Murawski, Northeast Fisheries Science Center, National Marine Fisheries Service.
A82
Appendix 23. Summary of NOAA's Ocean Exploration Program
Purpose:
Specifically designed to involve the diverse research community beyond NOAA as well as participants from many NOAA Line Offices, the Ocean Exploration program endeavors to address a growing national interest in exploring unknown regions, processes, and life within the global ocean as well as an increasing awareness of the oceans' importance to our environment and quality of life.
Ocean Exploration is the search and systematic investigation of the oceans for the purpose of discovery. NOAA's Ocean Exploration Program seeks to bring the best of our nation's ocean scientists to our ocean frontiers to discover new species, ocean processes, cultural antiquities and artifacts, and biological and mineral resources. The Program is about discovery-based science which promotes the collaboration of multi-partners and multi-disciplines and endorses an ethic of ocean stewardship and educational outreach.
In June 2000, a U.S. panel of ocean scientists, explorers, and educators convened to create history's first National Strategy of Ocean Exploration. Their report, "Discovering Earth's Final Frontier: A U.S. Strategy for Ocean Exploration," is a responsible plan to undertake new activities in ocean exploration. NOAA is embarking on this new strategy through its Ocean Exploration Program, and desires to partner with public, private, and academic ocean exploration programs outside of NOAA.
The discovery of living and nonliving ocean resources has the potential to provide great benefit to people the world over. New anti-inflammatory drugs are already being produced from deep-sea organisms. The relatively recent discovery of hydrothermal vent communities within the oceans has resulted in key knowledge about geological processes and plate tectonics.
Developments in biotechnology, telemetry, microcomputers and materials science now permit ocean scientists to aspire to the achievements of astronauts and the space program in our ability to go where we've not gone before. Like true explorers, we can now immerse ourselves in new places with new technologies to study and benefit from the undersea frontier.
Objectives:
By developing coordinated field campaigns aboard NOAA and other partner vessels, NOAA will embark upon several oceanic expeditions. By employing a full array of modern ocean technology, these explorations will survey, characterize, and define diverse marine environments. These innovative expeditions have the potential to rewrite oceanography and marine biology textbooks. Ocean Exploration presents possibilities for new solutions to problems we may face as we move into the 21st century.
In 2002, the regions of exploration include:
Gulf of Mexico
North Pacific off of CA, OR, WA and AK
Northwestern Hawaiian Islands
South Atlantic Bight
Gulf of Maine
Polar regions
A83
The expeditions will weave together five science themes integral to ocean research, which were developed by NOAA scientists and reflect the core science requirements articulated by the U.S. Panel on Ocean Exploration, as follows:
Finding New Ocean Resources
Exploring Ocean Acoustics
Documenting America's Maritime Heritage
The Census of Marine Life
Exploring New Frontiers
Also a vital program component is educational outreach. Ten percent of all funds dedicated to the Ocean Exploration Program will go to education and outreach products. This financial commitment builds on the investments already made via NOAA's existing education programs and partnerships, and it provides the vehicle for bringing ocean discovery to the forefront of the public's imagination.
CONTACT: Margot Bohan, Office of Ocean Exploration, NOAA.
A84
Appendix 24. Summary of the Census of Marine Life Program
The Census of Marine Life (CoML) initiative, formalized in 1997, is an international research program aiming at assessing and explaining the diversity, distribution, and abundance of marine organisms throughout the world's oceans. This ambitious goal is to be reached by stimulating well-coordinated dedicated regional research efforts that together provide significant new information on patterns and processes of marine life on a global scale.
The decade-long global program of research was begun with developmental funding largely from private foundations and input from a variety of international workshops resulting in a scientific plan that addresses three questions: What lived in the oceans? What lives in the oceans? What will live in the oceans? NMFS researchers collaborating in CoML pilot projects are expected to deliver new information having direct relevance to SAIP objectives.
The first CoML objective is to focus on the historical composition of the oceans by attempting to identify and reconstruct species complexes. The intent is to develop baseline time series of population abundance and decline before human influences. This is consistent with NMFS' efforts to improve fisheries-independent data and to examine historical population trends.
The second question addresses what presently lives in the ocean and is the focus of new "pilot projects." These will demonstrate the feasibility of achieving a worldwide census of marine life based on new technologies to gather synoptic and synchronous measurements over large ocean areas.
The forward-looking question focuses on modeling ecosystem dynamics and comports well with SAIP's Tier 3 (Next Generation Assessments). In out-years, NOAA's mandate to begin managing ecosystems, rather than single species, has potential for strong synergies with the CoML.In FY 2001, first-time external (non-NOAA) funding supports three pilot projects:
Pilot Census of Marine Life in the Gulf of Maine will describe the distribution and abundance of individual taxa, relationships of these to each other and to the physical environment, and diversity of organisms [NEFSC].
Tagging of Pacific Pelagics (TOPP) project will employ electronic tags to quantify and improve knowledge of how key ecological species in the North Pacific utilize the pelagic environment [SWFSC and NWFSC].
Pacific Ocean Salmon Tracking (POST) program shares the objectives of TOPP, but for all marine life stages of Pacific salmon in the North Pacific [SWFSC].
NMFS/CoML researchers are expected to receive dedicated funding from the NOAA Office of Ocean Exploration, beginning in FY 2002. Dedicated field activities are scheduled to begin in FY 2003.
Additionally NMFS scientists will participate in the international program:
Patterns and Processes of the Ecosystems of the Northern Mid-Atlantic. This effort contributes to the description and understanding of patterns of distribution, abundance, and trophic relationships of marine life inhabiting the deep waters of the mid-oceanic North Atlantic, and attempts to elucidate and model ecological processes causing variability in these patterns by employing advanced technology and new systematic studies [NEFSC].
CONTACT: Stephen K. Brown, Office of Science and Technology, National Marine Fisheries Service.
A85
Appendix 25. A Non-Exhaustive List of Other Programs and Activities that Could Provide Data and Other Inputs to Help Launch
Stock Assessments Towards Tier 3
The Oceans Commission, which was set up by the Oceans Act of 2000 (S.2327; Public Law 106-256) and is charged with assessing existing and planned ocean-related facilities and technologies, reviewing existing and planned ocean and coastal activities and opportunities, and recommending changes to U.S. law to improve management, conservation, and use of ocean resources.
The GLOBal ocean ECosystems dynamics program (GLOBEC). Contact: [email protected]
Various Global Climate Change Initiatives. Contacts: [email protected]
Report of the National Task Force for Defining and Measuring Fishing Capacity, by J.M. Ward, T. Brainerd, S. Freese, P. Mace, M. Milazzo, D. Squires, J. Terry, E. Thunberg, M. Travis, J. Walden. Study currently under review. Contact: John M. Ward, Office of Science and Technology, NMFS; [email protected]
Identifying harvest capacity and overcapacity in federally managed fisheries: a preliminary and qualitative report. Office of Science and Technology and Office of Sustainable Fisheries, National Oceanic and Atmospheric Administration, Department of Commerce. March 2001. Contact: [email protected]
United States National Plan of Action for the Conservation and Management of Sharks. National Marine Fisheries Service, National Oceanic and Atmospheric Administration, Department of Commerce. February 2001. URL http://www.nmfs.noaa.gov/sfa/Final%20NPOA.February. 2001.pdf
The FWS/NOAA Aquatic Nuisances Program. URL http://anstaskforce.gov/ansrpt-exec.htm