w w w . o r e g o n w a v e . o r g
Distribution and movement patterns of gray whales off central Oregon: Shore-based observations from Yaquina Head during the 2007/2008 migration. Report Prepared By: Joel Ortega-Ortiz and Bruce Mate Oregon State University Marine Mammal Institute Hatfield Marine Science Center 2030 SE Marine Science Dr. Newport, OR 97365
This work was funded by the Oregon Wave Energy Trust (OWET). OWET was funded in part with Oregon State Lottery Funds administered by the Oregon Business Development Department. It is one of six Oregon Innovation Council initiatives supporting job creation and long-term economic growth. Oregon Wave Energy Trust (OWET) is a nonprofit public-private partnership funded by the Oregon Innovation Council. Its mission is to support the responsible development of wave energy in Oregon. OWET emphasizes an inclusive, collaborative model to ensure that Oregon maintains its competitive advantage and maximizes the economic development and environmental potential of this emerging industry. Our work includes stakeholder outreach and education, policy development, environmental assessment, applied research and market development.
Oct 08
Marine Mammal Study
Table of Contents List of Figures......................................................................................................................1
List of Tables .......................................................................................................................1
Introduction..........................................................................................................................2
Methods ...............................................................................................................................4
Scan sampling.............................................................................................................5
Behavioral Observations.............................................................................................6
Results..................................................................................................................................8
Scan Sampling………………………………………………………………………8
Behavioral observations............................................................................................27
Discussion..........................................................................................................................31
Acknowledgements............................................................................................................32
References..........................................................................................................................33
1
List of Figures
Figure 1. Map of Yaquina Head indicating the area covered during scan surveys .............7
Figure 2. Migration timing ..................................................................................................9
Figure 3. Distance from shore for gray whale locations recorded during the different
migration phases ................................................................................................................21
Figure 4. Locations of gray whale groups observed on scan surveys during the
southbound migration ........................................................................................................22
Figure 5. Locations of gray whale groups observed on scan surveys during phase A of the
northbound migration. .......................................................................................................23
Figure 6. Locations of gray whale groups observed on scan surveys during phase B of the
northbound migration ........................................................................................................24
Figure 7. Bottom depth at gray whale locations recorded during the different migration
phases.................................................................................................................................25
Figure 8. Speed of gray whales tracked during the different migration phases. ...............27
Figure 9. Migration path of gray whales tracked during the southbound migration .........28
Figure 10. Migration path of gray whales tracked during phase A of the northbound
migration............................................................................................................................29
Figure 11. Migration path of gray whales tracked during phase B of the northbound
migration............................................................................................................................30
List of Tables Table 1. Scan sampling events, number of whales observed, and wind speed during
observations. ......................................................................................................................10
Table 2. List of focal behavioral observations of migrating whales..................................16
Table 3. Proportion of whale locations inside and outside the Oregon territorial sea during
the different migration phases. ..........................................................................................26
2
Introduction
The growing demand for energy, the rising oil prices, and the need to curb carbon
emissions have stimulated a search for alternative (i.e. non-fossil fuel) sources of energy.
The quest for “clean” energy has resulted in development of technology to produce
electricity by harnessing wind, wave, and solar radiation. The Oregon coast has been
identified as an area with great potential for production of electricity from wave energy.
In 2007 the state legislature appropriated funding to create the Oregon Wave Energy
Trust (OWET), a non-profit organization composed of stakeholders including
representatives from the wave energy industry, fishing, environmental, government and
community groups. OWET has the mission of building and sharing expertise needed to
support and accelerate the responsible development of the wave energy industry in the
State of Oregon. Within the last couple of years, applications have been filed for permits
to develop wave energy facilities in several locations along the Oregon coast. Recent
plans to develop wave energy facilities along the Oregon coast raise the priority of
assessing any potential environmental effects (Boehlert et al. 2008). Assessment of
ecological risk (as defined in US Environmental Protection Agency 1998) of wave energy
facilities requires an estimation of the magnitudes of both exposure and effects on
species, species assemblages or habitats.
Gray whales are a protected species under the U.S. Marine Mammal Protection Act. Two
extant distinct populations are recognized for this species: the Eastern North Pacific
stock, which lives along the west coast of North America, and the Western North Pacific
stock, which lives along the coast of eastern Asia (Rice et al. 1984, Swartz et al. 2006,
Angliss and Outlaw 2008). The majority of the Eastern North Pacific population spends
the summer feeding in the northern Bering and Chukchi Seas, although some gray whales
have been observed feeding in the summer in waters off of Southeast Alaska, British
Columbia, Washington, Oregon, and California (Rice and Wolman 1971, Darling 1984,
Nerini 1984, Rice et al. 1984, Newell and Cowles 2006). Whales observed foraging in
these more southern locations during several summers are referred as “residents” (e.g.
Newell and Cowles 2006). Resident whales have been observed off the Oregon coast
3
from May through October and 28 individuals were observed near Depoe Bay for at least
three successive summers (Newell and Cowles 2006).
Every year, a significant part of the population of eastern gray whales migrates from their
summer feeding grounds towards the calving lagoons in Baja California, Mexico and
back (Rice and Wolman 1971). Segregation has been observed in the migration timing of
whales of different sex, age and reproductive status. The sequence during the southward
migration is: females in late pregnancy, followed by females that recently ovulated, adult
males, immature females, and immature males (Rice and Wolman 1971, Rice et al.
1984). Although it is difficult to define an exact date for the start of the southbound
migration, most whales are migrating out of the northern seas between mid October and
November (Rugh et al. 2001). A series of observations of gray whale migration collected
since 1967 at Granite Canyon, in central California, shows a one-week delay in the
southbound migration after 1980 (Rugh et al. 2001). Calves are born in the Baja lagoons
from early January to mid-February (Rice et al. 1981). The northbound migration begins
in mid-February. Newly pregnant females are the first to leave Baja, followed by
anestrous females, adult males, and immature males and females (Rice et al. 1984). This
first wave is known as “phase A” of the northbound migration. Cows with calves are the
last to leave the lagoons 4-6 weeks later and constitute “phase B” (Poole 1984).
Mother/calf pairs have been observed in San Ignacio Lagoon up into April (Rice et al.
1981).
Previous observations indicated that southbound whales pass by Yaquina Head between
early December and mid February (Herzing and Mate 1984). Peak dates for the
southbound migrations along Yaquina Head were 28 December 1978, 6 January 1980, 1
January 1981 (Herzing and Mate 1984) and 7 January 1999 (Mate and Poff 1999). Phase
A of the northbound migration starts the last week of February and peaks in mid March
while Phase B begins in late April and peaks in mid May (Herzing and Mate 1984).
Gray whale migration along Oregon is primarily coastal. The average distance from shore
for sightings recorded during aerial surveys off the Oregon coast was 9.2 km and the
4
farthest sighting occurred 23 km offshore (Green et al. 1995). Because of their coastal
path, gray whales are well known and appreciated by the public and by visitors to the
Oregon coast. Whale-watching is one of the main attractions offered by tour boat
operators in Depoe Bay and Newport. Whale-watching is also an important attraction at
visitor centers along the Oregon coast (e.g. Yaquina Head Outstanding Natural Area,
Whale Watching Center in Depoe Bay, etc.). However, the coastal migratory path of gray
whales crosses areas where wave energy parks have been proposed.
The objective of this study is to generate accurate, up to date data on distribution
(distance to shore, travel path) and behavior (travel speed, migration timing) of gray
whales migrating along the central Oregon coast. Results from this study will help
estimate potential exposure of migrating gray whales to wave energy facilities in the
Oregon territorial sea. Moreover, the baseline information reported here, combined with
further observations to monitor gray whale behavior after wave energy facilities are
installed, can be used to determine potential effects and to evaluate the need for and
effectiveness of mitigation measures.
Methods
From December 10th, 2007 through May 30th 2008 a team of three observers surveyed for
marine mammals from an observation station next to Yaquina Head lighthouse, Oregon.
The station was located at 44.67675º latitude north and 124.07956º longitude west,
25.395 m above mean sea level. Average eye-height was 1.572 m. Therefore, total height
of the theodolite eye-piece was 26.967 m above sea level and distance to the horizon was
approximately 10 nautical miles (18.65 km).
Observations took place during daylight hours, whenever environmental conditions were
favorable to search for whales: no rain, no fog, wind less than 12 miles per hour and
white caps, if present, not numerous (i.e., Beaufort wind force scale < 4).
5
The observation team consisted of at least three members: one person searching with
70×50 handheld binoculars (Fujinon FMTRC-SX), one person handling a digital
theodolite with a 30× scope (Sokkia DT210, 2 seconds of arc resolution), and one person
recording data into a portable computer. Observers rotated every 30 minutes between the
three positions.
We determined that magnetic declination at the station was 15.199º (east) for the
binoculars’ compass during our study. A reference point (antenna) coincident with zero
in the binoculars’ magnetic compass was used as reference azimuth for the theodolite so
that horizontal angles were equivalent between the two instruments.
Whenever a whale was sighted, observers recorded azimuth (horizontal) and declination
(vertical) angles with the theodolite to estimate distance from the station following the
approximation described by Lerczak and Hobbs (1998). The theodolite was connected to
a computer running the software package Pythagoras (Gailey and Ortega-Ortiz 2002)
which recorded angle measurements, estimated distance to the whale and calculated the
whale’s geographic location. Alternatively, if it was not possible to acquire a theodolite
fix, azimuth and declination angles were measured with a compass and reticle etched into
the eyepiece of the handheld binoculars, applying the conversion factors described by
Kinzey and Gerrodette (2001). Binocular angle measurements were manually entered
into Pythagoras to estimate whale’s location. Magnetic declination was entered into
Pythagoras station set up and accounted for in all location calculations.
Scan sampling
Observers surveyed the area of the ocean included in the sector from 160º to 360º,
clockwise, in the magnetic compass (175.199º to 15.199º degrees true) and from Yaquina
Head to either the horizon or shore line (Figure 1). As part of the sampling protocol,
hereafter referred to as “scan,” all three observers focused in a 5º arc segment for 30
seconds, searching for whales or whale cues such as water splash and spouts or blows. To
prevent duplicate counts, during the southbound migration the survey was conducted
6
clockwise, starting at the south end of the scan sector (160º magnetic) and ending in the
north end (360º magnetic). Conversely, during the northbound migration scan surveys
were conducted counterclockwise, from 360º to 160º magnetic.
Behavioral Observations
In addition to scan sampling, the observers conducted focal follow behavioral
observations. During focal follow observations, also referred as “tracking,” observers
followed individual whales and obtained multiple theodolite fixes to determine speed and
path of whales as they passed by Yaquina Head. Duration of focal follows was variable
but an effort was made to track the whales for as long as possible.
Scans and focal follows were not conducted concurrently. Scan sampling events were
conducted every two hours if weather conditions were favorable and no focal follow was
being performed. An effort was made to conduct at least one scan sampling event and one
focal follow on each observation day.
Whale location data were imported into a geographic information system (GIS) created
with the computer software package ArcMap. The GIS included a bathymetry raster layer
with 500m pixel size and a vector map of Oregon’s coastline scale 1:75,000. A vector
line map of the Oregon territorial sea, defined as 3 nautical miles (5.556 km) off land and
islands, was derived from the coastline map. Bottom depth, distance to shore and
occurrence inside/outside Oregon’s territorial sea were determined for each whale
location.
7
Figure 1. Map of Yaquina Head indicating the area covered during scan surveys (yellow
highlight). Distance to the horizon was approximately 10 nautical miles (18.52
km) from the observation station. Red line indicates the State of Oregon
territorial waters (3 nautical miles or 5.556 km offshore).
8
Results
Observations were possible on 78 days during the period of this study. A total of 256
scan sampling events were completed during 106.3 hours of scan effort (Table 1). Focal
follows were conducted on 120 individual whales during 103.2 hours of tracking effort
(Table 2). A total of 2416 gray whale locations were recorded: 460 locations during scan
sampling and 1956 locations during focal follows.
Scan Sampling
Scan sampling began on December 11, 2007 and continued for four days, after which bad
weather precluded further observations until January 11, 2008. The first whale was
observed on January 11, and the peak of the southbound migration was January 23. . The
first northbound whale was observed on February 26 and the first cow/calf pair was
sighted on April 10. The peak of northbound migration phases A and B was March 30
and April 16, respectively (Fig. 2). The last northbound whale was recorded on May 29.
No whales were observed on May 30, the last day of fieldwork.
9
Figure 2. Migration timing, determined from average number of whales per scan surveys
conducted at Yaquina Head, Oregon, from December 2007 to May 2008.
10
Table 1. Scan sampling events, number of whales observed, and wind speed during observations.
Scan Date Start time
End time
Duration (hours)
Number of whale groups
Total number of whales
Wind speed (km/h)
1 11-Dec-07 13:57 16:33 2.59 0 0 12.9 2 12-Dec-07 12:00 12:53 0.88 0 0 8.0 4 12-Dec-07 13:57 14:30 0.56 0 0 5.0 5 12-Dec-07 14:41 14:57 0.26 0 0 5.0 7 13-Dec-07 10:46 11:06 0.34 0 0 6.6 8 14-Dec-07 10:51 11:25 0.57 0 0 5.3 9 14-Dec-07 12:30 12:55 0.42 0 0 4.0
10 11-Jan-08 08:59 09:21 0.36 0 0 14.0 11 11-Jan-08 10:55 11:48 0.88 1 1 11.3 12 13-Jan-08 08:48 09:23 0.58 4 4 10.1 13 13-Jan-08 11:01 12:08 1.13 3 3 7.0 14 13-Jan-08 13:05 13:49 0.73 0 0 1.2 15 13-Jan-08 14:54 15:25 0.51 3 4 4.8 16 13-Jan-08 15:52 16:19 0.45 3 5 3.7 17 16-Jan-08 08:56 09:20 0.39 3 4 6.9 18 16-Jan-08 10:42 11:22 0.67 7 12 7.3 19 16-Jan-08 13:21 13:46 0.42 2 2 3.4 20 17-Jan-08 08:43 09:13 0.50 2 2 7.0 21 17-Jan-08 10:24 10:57 0.56 4 4 7.0 22 17-Jan-08 11:56 12:27 0.50 1 3 6.2 23 18-Jan-08 08:53 09:21 0.47 2 2 7.1 24 18-Jan-08 10:06 10:36 0.50 4 4 9.4 25 18-Jan-08 12:51 13:20 0.48 2 5 8.1 26 18-Jan-08 14:15 14:41 0.43 2 4 5.9 27 21-Jan-08 08:54 09:17 0.38 6 6 13.2 28 21-Jan-08 11:01 11:25 0.39 3 3 13.1 29 21-Jan-08 14:21 14:39 0.29 5 5 23.7 30 21-Jan-08 15:18 15:45 0.45 5 5 23.8 31 22-Jan-08 08:38 09:01 0.39 4 4 11.2 32 22-Jan-08 10:02 10:31 0.49 7 7 9.8 33 22-Jan-08 12:56 13:21 0.41 4 5 13.1 34 22-Jan-08 14:43 15:13 0.49 8 9 9.3 35 23-Jan-08 08:42 09:10 0.48 3 6 19.8 36 23-Jan-08 11:41 12:11 0.50 7 9 16.4 37 23-Jan-08 13:26 13:48 0.37 3 3 13.5 38 23-Jan-08 15:07 15:36 0.47 5 8 14.3 39 24-Jan-08 08:33 08:57 0.40 0 0 12.3 40 24-Jan-08 09:08 09:40 0.54 2 3 11.7 41 24-Jan-08 10:18 10:47 0.50 3 3 15.7 42 25-Jan-08 09:57 10:32 0.58 9 10 14.0 43 25-Jan-08 14:22 14:43 0.35 0 0 14.2 44 25-Jan-08 15:56 16:23 0.45 6 6 13.0 45 04-Feb-08 15:06 15:31 0.43 0 0 7.9
11
Table 1. Continued.
Scan Date Start time
End time
Duration (hours)
Number of whale groups
Total number of whales
Wind speed (km/h)
41 10-Feb-08 15:28 15:47 0.33 0 0 6.5 42 11-Feb-08 13:01 13:23 0.36 0 0 8.9 44 11-Feb-08 14:54 15:19 0.41 0 0 8.1 45 11-Feb-08 16:01 16:20 0.32 0 0 10.0 46 13-Feb-08 13:23 13:47 0.39 0 0 8.4 47 13-Feb-08 14:20 14:43 0.37 0 0 9.2 48 13-Feb-08 15:43 16:09 0.43 2 2 11.5 49 14-Feb-08 10:52 11:15 0.38 0 0 6.1 50 14-Feb-08 11:16 11:41 0.42 1 1 6.0 51 14-Feb-08 13:59 14:20 0.35 0 0 8.0 52 15-Feb-08 10:00 10:20 0.34 0 0 9.9 54 15-Feb-08 13:10 13:33 0.39 1 1 6.2 55 15-Feb-08 14:16 14:36 0.34 1 1 8.4 56 15-Feb-08 15:04 15:26 0.37 1 1 11.6 57 17-Feb-08 08:44 09:07 0.38 0 0 8.1 58 17-Feb-08 09:53 10:19 0.44 0 0 7.0 59 17-Feb-08 11:18 11:42 0.40 0 0 6.3 60 17-Feb-08 12:25 12:46 0.35 0 0 8.7 61 17-Feb-08 13:35 13:56 0.35 0 0 8.7 62 17-Feb-08 14:42 15:03 0.35 0 0 10.6 63 17-Feb-08 15:41 16:01 0.33 0 0 11.4 64 18-Feb-08 10:01 10:23 0.37 0 0 7.0 65 18-Feb-08 10:59 11:25 0.43 1 1 6.0 66 18-Feb-08 12:07 12:31 0.39 1 4 7.2 67 18-Feb-08 13:15 13:37 0.36 0 0 9.5 68 18-Feb-08 14:13 14:35 0.37 0 0 10.6 69 18-Feb-08 14:58 15:21 0.39 0 0 9.0 70 20-Feb-08 11:06 11:29 0.37 0 0 5.0 71 20-Feb-08 12:13 12:35 0.37 0 0 4.1 72 20-Feb-08 13:20 13:40 0.33 0 0 4.1 73 20-Feb-08 14:24 14:46 0.37 1 3 3.6 74 20-Feb-08 15:26 15:48 0.35 0 0 4.3 75 23-Feb-08 12:22 12:42 0.33 0 0 13.6 76 23-Feb-08 13:27 13:51 0.40 0 0 10.7 77 23-Feb-08 14:31 14:55 0.41 1 2 8.5 78 24-Feb-08 08:26 08:48 0.36 0 0 11.5 79 24-Feb-08 09:38 10:01 0.39 0 0 10.7 80 24-Feb-08 11:18 11:41 0.39 0 0 8.0 81 24-Feb-08 11:45 12:08 0.39 0 0 8.0 82 25-Feb-08 09:00 09:26 0.43 0 0 7.0 83 25-Feb-08 10:33 10:57 0.40 0 0 8.2 85 25-Feb-08 11:59 12:22 0.38 2 4 5.1
12
Table 1. Continued.
Scan Date Start time
End time
Duration (hours)
Number of whale groups
Total number of whales
Wind speed (km/h)
86 25-Feb-08 14:20 14:43 0.38 0 0 4.4 87 25-Feb-08 15:23 15:46 0.38 0 0 4.7 88 26-Feb-08 08:25 08:50 0.41 0 0 7.2 89 26-Feb-08 09:43 10:09 0.43 2 3 8.2 90 26-Feb-08 10:47 11:11 0.41 0 0 3.2 91 26-Feb-08 13:27 13:50 0.37 0 0 4.6 92 26-Feb-08 14:38 14:56 0.29 2 2 2.9 93 26-Feb-08 16:05 16:31 0.43 0 0 4.8 94 02-Mar-08 09:11 09:29 0.29 1 1 7.4 95 02-Mar-08 09:40 10:03 0.38 0 0 6.4 96 02-Mar-08 11:27 11:48 0.35 0 0 6.0 97 02-Mar-08 12:58 13:23 0.41 0 0 9.4 98 02-Mar-08 14:04 14:26 0.37 0 0 8.9 99 02-Mar-08 15:11 15:32 0.35 0 0 11.8
100 04-Mar-08 09:53 10:18 0.41 1 1 3.9 101 04-Mar-08 11:03 11:28 0.42 2 7 6.0 102 04-Mar-08 14:20 14:42 0.36 0 0 10.6 103 05-Mar-08 09:29 09:54 0.41 0 0 8.9 104 05-Mar-08 10:33 10:56 0.39 0 0 9.5 105 05-Mar-08 11:34 11:59 0.42 2 14 8.8 106 06-Mar-08 09:34 09:58 0.39 0 0 6.0 107 06-Mar-08 10:34 11:00 0.43 1 1 6.6 108 06-Mar-08 12:46 13:08 0.37 0 0 9.6 109 06-Mar-08 14:20 14:43 0.38 0 0 6.0 110 06-Mar-08 16:10 16:33 0.39 3 3 5.7 111 08-Mar-08 08:25 08:48 0.38 2 2 0.0 112 08-Mar-08 10:13 10:38 0.41 4 8 2.4 113 08-Mar-08 11:39 12:04 0.41 2 3 3.3 115 08-Mar-08 14:34 14:57 0.38 3 3 9.1 116 08-Mar-08 15:32 15:58 0.43 4 6 10.6 117 11-Mar-08 14:27 14:46 0.32 1 1 6.0 118 11-Mar-08 15:29 15:50 0.35 1 2 7.9 119 11-Mar-08 16:35 16:55 0.33 0 0 10.6 120 12-Mar-08 09:25 09:48 0.38 1 1 4.2 121 12-Mar-08 10:33 10:56 0.38 0 0 5.8 123 16-Mar-08 09:34 10:00 0.43 1 1 1.0 124 16-Mar-08 13:56 14:21 0.41 1 1 7.1 125 16-Mar-08 15:01 15:24 0.38 2 2 5.1 126 16-Mar-08 16:08 16:35 0.44 3 5 3.9 127 18-Mar-08 15:21 15:45 0.39 3 5 7.0 128 19-Mar-08 10:16 10:40 0.41 1 1 7.5 129 19-Mar-08 11:46 12:09 0.39 0 0 12.1 130 19-Mar-08 12:33 12:55 0.36 0 0 15.9
13
Table 1. Continued.
Scan Date Start time
End time
Duration (hours)
Number of whale groups
Total number of whales
Wind speed (km/h)
131 21-Mar-08 11:11 11:34 0.37 0 0 9.1 132 21-Mar-08 12:05 12:31 0.43 4 5 9.8 133 21-Mar-08 14:41 15:05 0.40 3 4 6.0 134 21-Mar-08 16:30 16:50 0.34 7 10 4.1 135 22-Mar-08 10:19 10:44 0.41 6 7 9.3 136 22-Mar-08 13:10 13:36 0.44 6 7 9.4 137 22-Mar-08 15:31 15:55 0.41 2 3 5.6 138 24-Mar-08 09:25 09:48 0.39 1 2 3.8 139 24-Mar-08 10:44 11:09 0.41 1 1 5.7 140 24-Mar-08 11:38 12:01 0.37 1 1 6.4 141 24-Mar-08 15:08 15:32 0.40 6 9 4.8 142 24-Mar-08 16:46 17:07 0.37 5 6 2.9 143 25-Mar-08 09:05 09:29 0.40 3 3 5.4 144 30-Mar-08 10:28 10:54 0.43 8 13 6.5 145 30-Mar-08 12:31 12:56 0.42 8 10 6.5 146 30-Mar-08 14:41 15:03 0.36 5 5 7.7 147 30-Mar-08 16:08 16:31 0.39 11 18 8.1 148 31-Mar-08 09:33 09:58 0.41 3 6 4.9 149 31-Mar-08 10:39 11:05 0.42 4 5 4.8 150 31-Mar-08 11:36 12:02 0.43 7 10 5.6 151 31-Mar-08 15:22 15:41 0.32 5 7 15.3 152 31-Mar-08 15:46 16:07 0.35 8 9 15.7 153 01-Apr-08 08:26 08:49 0.39 3 5 7.6 154 01-Apr-08 10:44 11:08 0.40 4 9 11.3 155 03-Apr-08 08:27 08:51 0.40 4 6 2.7 156 03-Apr-08 11:28 11:56 0.46 3 4 10.9 157 07-Apr-08 14:06 14:30 0.39 5 8 8.2 158 07-Apr-08 15:21 15:49 0.46 9 9 9.5 159 07-Apr-08 16:34 16:57 0.39 10 13 7.8 160 08-Apr-08 11:10 11:35 0.42 7 9 9.1 161 08-Apr-08 13:48 14:13 0.41 6 8 11.7 162 08-Apr-08 16:27 16:53 0.44 10 11 9.7 163 09-Apr-08 08:30 09:00 0.50 7 10 8.0 164 09-Apr-08 12:16 12:40 0.39 4 6 10.5 165 09-Apr-08 14:19 14:43 0.41 5 5 10.9 166 10-Apr-08 09:36 09:59 0.40 2 2 11.1 167 10-Apr-08 11:35 11:58 0.39 3 3 9.5 168 10-Apr-08 13:14 13:38 0.41 2 2 9.7 169 10-Apr-08 15:22 15:46 0.40 1 2 8.1 170 10-Apr-08 16:21 16:42 0.35 2 3 10.3 171 11-Apr-08 08:31 08:55 0.41 5 6 9.0 172 11-Apr-08 11:24 11:51 0.44 3 8 8.7 173 12-Apr-08 10:23 10:49 0.43 1 1 8.4
14
Table 1. Continued.
Scan Date Start time
End time
Duration (hours)
Number of whale groups
Total number of whales
Wind speed (km/h)
174 12-Apr-08 11:24 11:48 0.41 3 3 10.2 175 12-Apr-08 12:23 12:52 0.48 5 5 10.8 176 12-Apr-08 14:07 14:29 0.37 0 0 13.0 177 12-Apr-08 15:04 15:24 0.33 1 1 12.7 179 15-Apr-08 12:14 12:39 0.41 3 5 11.8 180 16-Apr-08 10:48 11:15 0.45 9 16 3.1 181 16-Apr-08 12:16 12:40 0.41 8 8 5.1 182 16-Apr-08 14:52 15:17 0.41 10 20 13.5 183 16-Apr-08 15:54 16:17 0.39 6 8 14.9 184 17-Apr-08 08:30 08:54 0.39 4 4 9.6 185 17-Apr-08 11:15 11:41 0.43 6 8 15.8 186 21-Apr-08 08:49 09:11 0.38 4 4 8.2 187 25-Apr-08 08:25 08:48 0.39 1 1 6.0 188 25-Apr-08 08:52 09:19 0.44 1 2 6.0 190 25-Apr-08 10:33 10:58 0.42 2 3 6.8 191 25-Apr-08 12:01 12:25 0.40 1 1 8.8 192 26-Apr-08 10:13 10:38 0.40 0 0 6.6 193 26-Apr-08 10:40 11:04 0.41 0 0 5.7 194 26-Apr-08 12:27 12:52 0.41 0 0 4.8 195 26-Apr-08 14:04 14:28 0.40 1 1 4.5 196 26-Apr-08 16:16 16:39 0.39 0 0 4.1 197 27-Apr-08 08:35 08:58 0.38 0 0 4.5 198 27-Apr-08 09:44 10:08 0.39 1 1 5.5 199 27-Apr-08 11:25 11:48 0.39 0 0 6.0 200 27-Apr-08 13:02 13:26 0.41 1 1 6.2 201 27-Apr-08 14:15 14:37 0.37 1 1 6.3 202 27-Apr-08 15:18 15:43 0.40 0 0 6.4 203 27-Apr-08 16:25 16:47 0.37 0 0 6.5 204 30-Apr-08 08:25 08:48 0.39 0 0 5.5 205 30-Apr-08 11:02 11:25 0.37 0 0 2.9 206 30-Apr-08 12:15 12:39 0.40 1 2 2.9 207 30-Apr-08 14:29 14:52 0.39 2 3 2.8 208 30-Apr-08 15:30 15:51 0.36 0 0 2.8 209 30-Apr-08 16:20 16:39 0.33 0 0 2.8 210 02-May-08 08:38 09:02 0.40 0 0 4.0 211 02-May-08 09:40 10:04 0.40 1 1 7.0 212 02-May-08 11:01 11:22 0.35 0 0 5.1 213 02-May-08 12:11 12:38 0.44 1 1 5.4 214 02-May-08 13:44 14:08 0.40 0 0 5.8 215 02-May-08 15:53 16:17 0.40 0 0 6.3 216 04-May-08 08:45 09:07 0.38 0 0 8.0 217 04-May-08 09:43 10:06 0.38 0 0 14.0 218 09-May-08 08:31 08:55 0.39 0 0 5.5
15
Table 1. Continued.
Scan Date Start time
End time
Duration (hours)
Number of whale groups
Total number of whales
Wind speed (km/h)
219 09-May-08 10:01 10:24 0.39 0 0 8.0 220 09-May-08 11:12 11:30 0.30 0 0 8.4 221 09-May-08 12:30 12:53 0.40 1 1 9.9 222 12-May-08 11:08 11:31 0.38 0 0 7.0 223 12-May-08 12:14 12:36 0.37 0 0 7.5 224 12-May-08 13:19 13:43 0.39 0 0 8.9 225 13-May-08 10:57 11:19 0.38 0 0 10.9 226 13-May-08 11:52 12:14 0.38 0 0 9.2 227 13-May-08 12:58 13:20 0.36 1 3 9.9 228 14-May-08 10:50 11:12 0.38 0 0 6.7 229 14-May-08 13:20 13:43 0.38 0 0 11.6 230 14-May-08 14:42 15:05 0.38 0 0 7.3 231 14-May-08 16:03 16:25 0.36 0 0 18.1 232 16-May-08 13:45 14:09 0.39 0 0 3.6 233 16-May-08 14:57 15:19 0.36 0 0 7.8 234 16-May-08 16:05 16:28 0.39 0 0 6.7 235 17-May-08 10:32 10:54 0.38 0 0 8.8 236 17-May-08 12:00 12:23 0.39 1 1 7.0 237 17-May-08 13:11 13:34 0.38 0 0 5.3 238 19-May-08 11:58 12:23 0.42 0 0 4.1 239 19-May-08 13:13 13:37 0.40 0 0 2.7 240 19-May-08 14:34 14:58 0.39 1 1 3.2 241 24-May-08 14:33 14:57 0.40 0 0 4.9 242 24-May-08 15:57 16:19 0.37 0 0 5.9 243 25-May-08 14:48 15:11 0.37 0 0 8.9 244 25-May-08 16:04 16:27 0.38 0 0 12.8 245 27-May-08 11:26 11:48 0.36 0 0 5.9 246 27-May-08 12:30 12:52 0.37 1 1 7.5 247 27-May-08 15:18 15:42 0.39 3 3 11.7 248 29-May-08 09:15 09:39 0.41 1 1 1.9 249 29-May-08 09:41 10:05 0.41 0 0 1.9 250 29-May-08 11:38 12:03 0.42 0 0 7.0 251 29-May-08 12:55 13:18 0.38 0 0 8.0 252 29-May-08 14:02 14:23 0.35 0 0 7.0 253 29-May-08 15:19 15:42 0.38 0 0 7.0 254 29-May-08 16:30 16:54 0.40 0 0 7.0 255 29-May-08 17:28 17:50 0.38 0 0 7.0 256 30-May-08 08:28 08:52 0.39 0 0 4.8 257 30-May-08 09:37 10:01 0.40 0 0 9.2 258 30-May-08 10:48 11:12 0.40 0 0 10.9 259 30-May-08 12:02 12:23 0.35 0 0 11.2 260 30-May-08 12:59 13:21 0.38 0 0 14.0
16
Table 2. List of focal behavioral observations of migrating whales recorded from Yaquina Head.
Track Num. Start Date-Time Group
size Duration (hours)
Track Length
(km)
Num. of
Fixes
Average Speed (km/h)
Average Distance to shore
(km)
Average Depth
(m) Notes Migration
phase
1 2008-01-13 12:29 3 0.42 5.53 10 75.9 9.3 63 Southbound 2 2008-01-16 09:22 1 0.25 6.48 3 30.6 2.3 28 Southbound 3 2008-01-16 09:57 2 0.57 4.75 6 8.5 7.0 57 Southbound 4 2008-01-16 11:30 1 0.68 4.89 3 8.7 7.0 59 Southbound 5 2008-01-16 12:14 3 0.07 0.55 4 8.3 11.1 64 Southbound 6 2008-01-16 12:35 6 0.64 4.77 8 7.8 9.5 67 Southbound 7 2008-01-17 09:48 2 0.41 1.54 4 6.7 4.8 42 Southbound 8 2008-01-17 11:06 2 0.81 13.97 9 53.3 8.2 63 Southbound 9 2008-01-17 14:03 1 0.43 4.04 3 9.7 5.2 47 Southbound
10 2008-01-18 11:07 1 0.89 5.20 9 6.1 3.8 41 Southbound 11 2008-01-18 13:37 5 0.35 1.38 4 5.4 9.8 57 Southbound 12 2008-01-18 13:59 1 0.06 0.87 2 13.5 10.5 59 Southbound 13 2008-01-18 14:45 3 0.43 4.16 10 10.1 9.7 64 Southbound 14 2008-01-18 15:24 5 0.39 2.43 8 6.6 6.7 50 Southbound 15 2008-01-21 09:35 3 0.56 3.35 4 5.5 4.4 42 Southbound 16 2008-01-21 10:13 3 0.43 3.45 8 8.2 5.4 52 Southbound 17 2008-01-21 11:41 2 0.67 3.70 11 7.2 4.1 44 Southbound 18 2008-01-21 14:53 3 0.18 1.31 7 6.9 7.4 50 Southbound 19 2008-01-21 15:04 2 0.21 0.95 3 3.8 5.3 46 Southbound 20 2008-01-21 15:48 4 0.48 3.92 7 8.2 6.2 55 Southbound 21 2008-01-22 10:38 2 0.67 3.66 9 6.1 7.8 62 Southbound 22 2008-01-22 11:28 3 0.50 4.14 6 8.2 8.2 61 Southbound 23 2008-01-22 13:32 2 0.47 3.73 14 8.1 5.9 53 Southbound 24 2008-01-22 14:04 1 0.39 2.62 10 6.5 7.7 52 Southbound 25 2008-01-22 15:25 1 0.09 2.71 2 31.5 9.4 60 Southbound 26 2008-01-22 15:57 1 0.93 6.65 23 7.1 4.9 46 Southbound 27 2008-01-23 09:11 5 0.53 3.29 9 6.5 7.8 52 Southbound
16
17
Table 2. Continued
Track Num. Start Date-Time Group
size Duration (hours)
Track Length
(km)
Num. of
Fixes
Average Speed (km/h)
Average Distance to shore
(km)
Average Depth
(m) Notes Migration
phase
28 2008-01-23 10:18 3 1.16 7.14 23 6.5 5.2 48 Southbound 29 2008-01-23 13:49 1 0.01 0.46 3 50.8 6.1 60 Southbound 30 2008-01-23 13:55 1 0.00 0.00 1 6.4 60 Southbound 31 2008-01-23 13:57 1 0.39 3.13 4 7.4 7.4 61 Southbound 32 2008-01-23 14:26 2 0.52 3.92 19 7.8 7.8 61 Southbound 33 2008-01-23 15:36 1 0.06 8.57 3 192.3 5.6 49 Southbound 34 2008-01-24 11:34 1 0.65 5.16 4 7.8 6.3 53 Southbound 35 2008-01-25 08:46 4 1.10 6.15 20 5.3 1.9 24 Southbound 36 2008-01-25 10:33 1 0.28 1.55 3 3.2 1.3 20 Resident 37 2008-01-25 10:57 3 2.26 15.24 32 6.8 7.2 56 Southbound 38 2008-01-25 15:19 3 0.62 2.49 7 5.7 3.2 40 Southbound 39 2008-01-25 16:24 4 0.66 4.76 21 6.9 3.5 34 Southbound 40 2008-02-04 15:31 1 0.15 1.07 5 6.6 1.0 20 Resident 41 2008-02-23 15:05 2 1.89 12.97 32 6.2 4.9 47 Southbound 42 2008-02-24 10:25 2 0.56 3.17 8 4.6 5.4 45 Southbound 43 2008-02-24 13:00 1 1.14 5.64 15 5.2 3.0 38 Southbound 44 2008-02-24 15:11 3 1.10 7.86 25 7.1 6.4 54 Southbound 45 2008-02-25 12:31 2 1.04 6.95 11 6.9 8.5 63 Southbound 46 2008-02-26 11:51 1 0.99 5.56 9 5.3 6.7 49 Southbound 47 2008-02-26 15:01 2 1.00 5.71 21 6.0 3.2 40 Northbound-A 48 2008-03-04 11:38 4 0.22 1.24 9 5.8 8.1 52 Northbound-A 49 2008-03-04 12:04 1 1.09 7.08 20 5.3 1.9 23 Northbound-A 50 2008-03-04 14:50 1 0.28 1.08 2 3.8 3.0 35 Northbound-A 51 2008-03-05 12:05 3 1.27 6.55 76 5.4 3.7 42 Northbound-A 52 2008-03-06 11:09 3 1.55 10.07 40 6.5 4.0 40 Northbound-A 53 2008-03-06 14:51 2 1.22 7.97 23 6.6 2.5 30 Northbound-A 54 2008-03-06 16:50 1 0.18 1.26 9 6.7 2.6 35 Northbound-A
17
18
Table 2. Continued
Track Num. Start Date-Time Group
size Duration (hours)
Track Length
(km)
Num. of
Fixes
Average Speed (km/h)
Average Distance to shore
(km)
Average Depth
(m) Notes Migration
phase
55 2008-03-08 08:57 3 1.23 7.79 22 6.5 3.0 33 Northbound-A 56 2008-03-08 10:46 2 0.79 3.84 8 5.6 4.3 47 Northbound-A 57 2008-03-08 13:28 2 0.84 6.13 15 7.0 4.9 48 Northbound-A 58 2008-03-08 15:00 7 0.45 2.99 25 6.9 8.2 63 Northbound-A 59 2008-03-08 16:02 3 0.39 2.36 11 5.9 4.2 37 Northbound-A 60 2008-03-11 15:00 2 0.39 1.84 4 5.4 2.5 30 Northbound-A 61 2008-03-11 15:59 2 0.59 4.05 6 7.9 2.8 28 Northbound-A 62 2008-03-12 12:04 3 0.69 4.34 22 6.2 5.0 44 Northbound-A 63 2008-03-16 10:12 3 1.90 10.27 37 6.1 5.1 48 Northbound-A 64 2008-03-16 16:43 3 1.14 4.83 22 4.6 4.6 41 Northbound-A 65 2008-03-18 16:05 3 0.88 4.70 12 6.1 3.8 43 Northbound-A 66 2008-03-19 10:49 1 0.28 1.34 5 6.5 2.2 29 Northbound-A 67 2008-03-19 11:09 1 0.56 2.75 9 6.7 1.7 24 Northbound-A 68 2008-03-21 12:46 3 0.31 0.92 3 4.7 3.3 40 Northbound-A 69 2008-03-21 13:07 1 0.25 0.38 2 1.5 1.8 31 Northbound-A 70 2008-03-21 13:34 3 0.68 5.29 8 7.3 3.7 37 Northbound-A 71 2008-03-21 15:12 1 0.64 4.66 8 7.1 2.5 34 Northbound-A 72 2008-03-21 15:55 1 0.55 3.59 9 6.9 4.1 46 Northbound-A 73 2008-03-22 10:49 3 2.04 12.67 24 6.8 5.2 49 Northbound-A 74 2008-03-22 13:46 4 1.69 11.29 62 6.3 6.3 51 Northbound-A 75 2008-03-24 10:01 2 0.66 4.26 8 6.9 5.3 52 Northbound-A 76 2008-03-24 12:07 3 1.46 10.44 46 7.6 5.9 51 Northbound-A 77 2008-03-24 15:40 3 1.05 6.54 27 6.1 3.5 37 Northbound-A 78 2008-03-24 17:20 2 0.40 2.38 13 6.1 4.2 41 Northbound-A 79 2008-03-25 09:39 2 0.70 3.80 11 6.3 5.6 51 Northbound-A 80 2008-03-30 13:59 1 0.49 2.65 8 5.2 2.4 34 Northbound-A 81 2008-03-30 15:07 2 0.94 5.24 26 6.1 5.6 51 Northbound-A
18
19
Table 2. Continued
Track Num. Start Date-Time Group
size Duration (hours)
Track Length
(km)
Num. of
Fixes
Average Speed (km/h)
Average Distance to shore
(km)
Average Depth
(m) Notes Migration
phase
82 2008-03-31 10:01 3 0.55 2.86 7 6.5 7.4 61 Northbound-A 83 2008-03-31 12:12 2 2.07 12.04 24 6.2 5.8 53 Northbound-A 84 2008-04-01 08:55 5 1.61 8.58 72 5.9 7.0 58 Northbound-A 85 2008-04-01 11:19 1 1.01 4.57 11 4.7 1.2 19 Northbound-A 86 2008-04-03 08:55 2 2.17 15.92 19 7.2 3.2 37 Northbound-A 87 2008-04-03 12:06 2 1.42 10.98 19 7.1 4.3 45 Northbound-A 88 2008-04-07 13:31 2 1.78 3.46 4 4.3 5.9 54 Northbound-A 89 2008-04-08 11:46 2 1.95 12.59 34 6.4 5.8 52 Northbound-A 90 2008-04-08 14:24 3 1.96 12.44 47 6.4 6.3 54 Northbound-A 91 2008-04-09 12:49 3 1.46 8.47 37 6.0 3.8 42 Northbound-A 92 2008-04-10 10:15 1 0.94 6.03 13 6.2 2.2 24 Northbound-A 93 2008-04-10 13:44 3 1.57 7.97 47 5.0 3.4 34 Northbound-A 94 2008-04-10 16:59 2 1.11 5.14 26 5.3 1.3 18 Cow/calf Northbound-B 95 2008-04-11 09:34 3 1.62 8.21 26 5.6 7.2 59 Northbound-B 96 2008-04-11 12:03 1 1.39 5.77 19 4.2 3.0 38 Northbound-B 97 2008-04-12 12:58 1 0.98 4.53 12 5.2 3.6 43 Northbound-B 98 2008-04-15 10:44 3 1.47 7.09 28 5.9 6.8 58 Northbound-B 99 2008-04-15 12:53 1 0.11 1.17 3 10.0 3.2 29 Northbound-B
100 2008-04-16 11:26 1 0.77 4.16 4 5.8 4.5 42 Northbound-B 101 2008-04-16 12:44 3 2.05 14.54 58 6.7 3.3 36 Northbound-B 102 2008-04-17 09:13 2 1.99 9.64 48 4.7 4.0 43 Northbound-B 103 2008-04-25 10:02 3 0.29 1.19 3 4.1 2.0 17 Northbound-B 104 2008-04-25 10:28 1 0.06 1.43 7 28.4 2.0 17 Northbound-B 105 2008-04-26 14:33 2 1.45 8.05 20 5.8 1.4 18 Cow/calf Northbound-B 106 2008-04-27 10:15 1 0.83 6.60 5 7.4 1.5 14 Resident 107 2008-04-25 11:02 1 0.97 3.02 19 2.6 0.4 14 Resident 108 2008-04-30 12:47 2 0.32 2.22 7 6.8 2.7 35 Cow/calf Northbound-B
19
20
Table 2. Continued
Track Num. Start Date-Time Group
size Duration (hours)
Track Length
(km)
Num. of
Fixes
Average Speed (km/h)
Average Distance to shore
(km)
Average Depth
(m) Notes Migration
phase
109 2008-04-30 14:44 1 1.55 3.50 9 3.3 0.8 16 Resident 110 2008-05-02 10:20 2 0.45 1.79 4 5.3 1.9 16 Northbound-B 111 2008-05-02 14:58 1 0.56 2.89 11 5.4 0.7 15 Northbound-B 112 2008-05-09 12:59 1 2.01 9.90 27 4.7 2.4 28 Northbound-B 113 2008-05-12 14:04 1 1.49 6.17 8 4.2 1.3 15 Northbound-B 114 2008-05-13 13:24 2 0.26 1.87 4 7.8 1.4 12 Northbound-B 115 2008-05-14 11:40 2 1.29 5.72 12 5.0 0.8 14 Cow/calf Northbound-B 116 2008-05-14 15:19 2 0.53 2.14 12 4.9 0.8 16 Cow/calf Northbound-B 117 2008-05-17 10:56 3 1.03 6.26 19 5.8 0.9 15 Northbound-B 118 2008-05-19 12:27 1 0.46 2.66 13 6.1 0.7 17 Northbound-B 119 2008-05-19 15:08 1 1.65 8.27 13 4.8 2.3 28 Northbound-B 120 2008-05-27 12:58 1 2.10 7.01 111 3.4 1.1 14 Resident
20
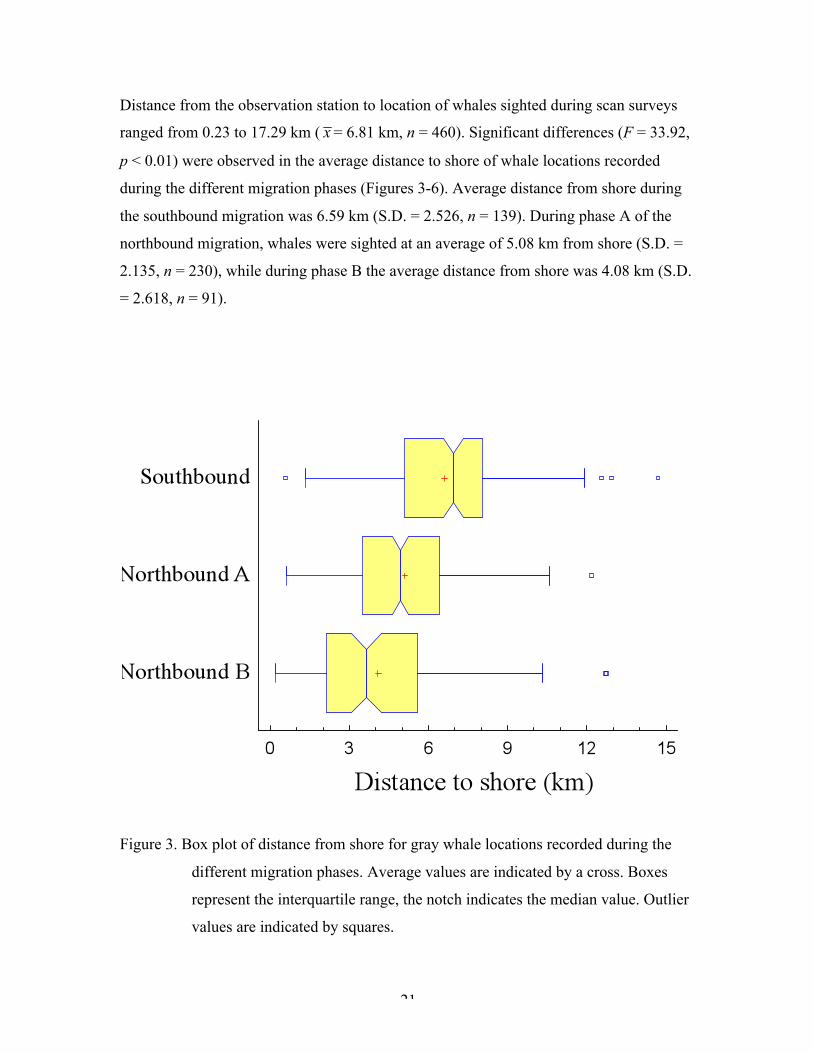
Distance from the observation station to location of whales sighted during scan surveys
ranged from 0.23 to 17.29 km ( = 6.81 km, n = 460). Significant differences (F = 33.92,
p < 0.01) were observed in the average distance to shore of whale locations recorded
during the different migration phases (Figures 3-6). Average distance from shore during
the southbound migration was 6.59 km (S.D. = 2.526, n = 139). During phase A of the
northbound migration, whales were sighted at an average of 5.08 km from shore (S.D. =
2.135, n = 230), while during phase B the average distance from shore was 4.08 km (S.D.
= 2.618, n = 91).
Figure 3. Box plot of distance from shore for gray whale locations recorded during the
different migration phases. Average values are indicated by a cross. Boxes
represent the interquartile range, the notch indicates the median value. Outlier
values are indicated by squares.
21
22
Figure 4. Locations of gray whale groups (yellow circles) observed on scan surveys off
Yaquina Head during the southbound migration (December 2007 – February
25, 2008). Contours indicate 10-80 meter isobaths (every 10 meters). The red
line is the boundary of the State of Oregon territorial sea.
23
Figure 5. Locations of gray whale groups (yellow circles) observed on scan surveys off
Yaquina Head during phase A of the northbound migration (February 26 –
April 9, 2008). Contours indicate 10-80 meter isobaths (every 10 meters). The
red line is the boundary of the State of Oregon territorial sea.
24
Figure 6. Locations of gray whale groups (yellow circles) observed on scan surveys off
Yaquina Head during phase B of the northbound migration (April 10-May 29,
2008). Contours indicate 10-80 meter isobaths (every 10 meters). The red line
is the boundary of the State of Oregon territorial sea.
25
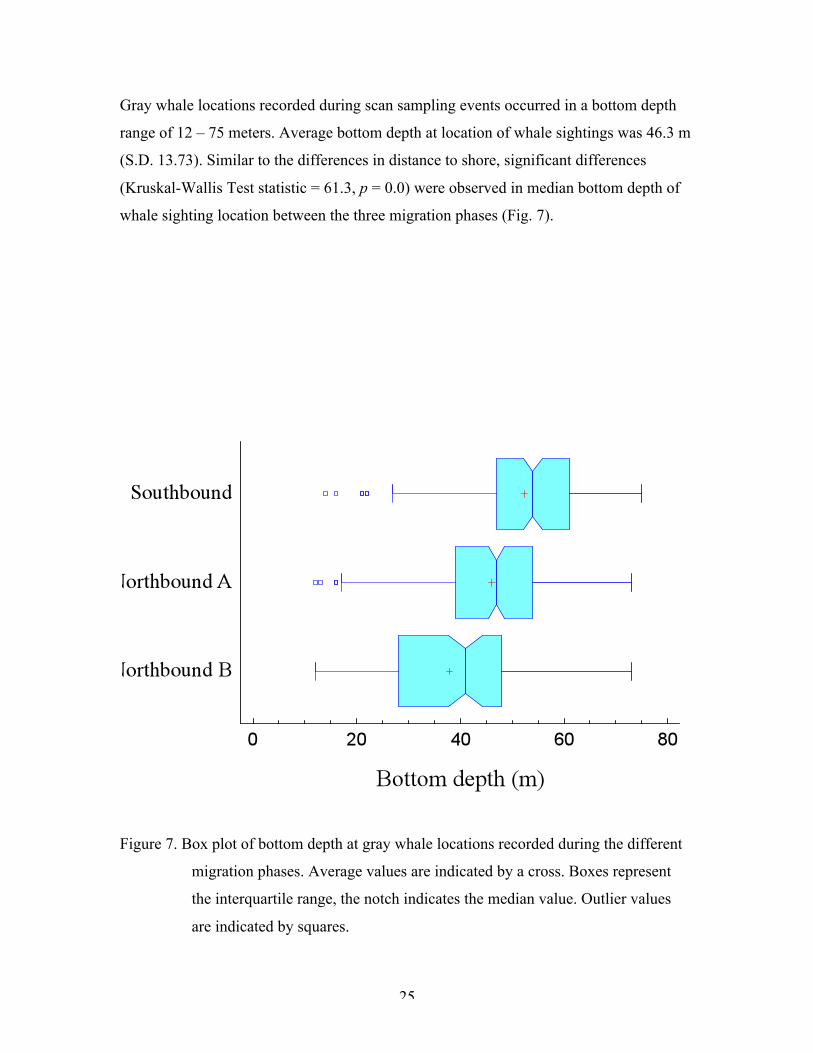
Gray whale locations recorded during scan sampling events occurred in a bottom depth
range of 12 – 75 meters. Average bottom depth at location of whale sightings was 46.3 m
(S.D. 13.73). Similar to the differences in distance to shore, significant differences
(Kruskal-Wallis Test statistic = 61.3, p = 0.0) were observed in median bottom depth of
whale sighting location between the three migration phases (Fig. 7).
Figure 7. Box plot of bottom depth at gray whale locations recorded during the different
migration phases. Average values are indicated by a cross. Boxes represent
the interquartile range, the notch indicates the median value. Outlier values
are indicated by squares.
26
Gray whales observed during this study migrate within the Oregon territorial sea,
particularly during the northbound migration (Table 3). Migratory paths of some, but not
all whales, pass through areas of currently proposed wave energy development.
Table 3. Proportion of whale locations (scan survey data) inside and outside the Oregon
territorial sea (OTS) during the different migration phases.
Migration phase Number of locations Inside OTS Outside OTS Southbound 139 57 41.0% 82 59.0% Northbound - Phase A 230 155 67.4% 75 32.6% Northbound - Phase B 91 71 78.0% 20 22.0%
Total 460 283 61.5% 177 38.5%
27
Behavioral observations
Distance from the observation station to tracked whales ranged from 0.28 to 13.56 km (
= 5.02 km, n = 1956). Out of the 120 focal observations, only 110 tracked whales had
enough data to conduct further behavior analysis. Significant differences were observed
in the average speed of gray whales tracked during the different migration phases (F =
8.04, p = 0.0006, Fig. 8). Average speed of tracked whales was 6.74 km/h (S.D.= 1.382,
n = 37) during the southbound migration, 6.05 km/h (S.D.= 1.094, n = 47) during phase
A of the northbound migration, and 5.42 km/h (S.D.= 1.529, n = 26) during phase B. The
migration paths of tracked whales are shown in figures 9-11.
Figure 8. Box plot of speed of gray whales tracked during the different migration phases. Average values are indicated by a cross. Boxes represent the interquartile range, the notch indicates the median value. Outlier values are indicated by squares.
28
Figure 9. Migration path of gray whales tracked off Yaquina Head during the southbound
migration (January 13-February 25, 2008). Contours indicate 10-80 meter
isobaths (every 10 meters). The red line is the boundary of the State of Oregon
territorial sea.
29
Figure 10. Migration path of gray whales tracked off Yaquina Head during the phase A of
the northbound migration (February 26-April 9, 2008). Contours indicate 10-
80 meter isobaths (every 10 meters). The red line is the boundary of the State
of Oregon territorial sea.
30
Figure 11. Migration path of gray whales tracked off Yaquina Head during phase B of the
northbound migration (April 10-May 29, 2008). Contours indicate 10-80
meter isobaths (every 10 meters). The red line is the boundary of the State of
Oregon territorial sea.
31
Discussion
This study presents up-to-date results on the migratory behavior of gray whales along the
central Oregon coast. These results are in accordance with previous studies (e.g. Herzing
and Mate 1984, Green et al. 1995) and add quantitative measurements of behavior that
can be used as a baseline for future monitoring studies.
Shore-based observations are limited to the field of view, which is determined by
distance to the horizon and obstructions in the area. The observation station at Yaquina
head has an acceptable 180º field of view, with no obstructions and horizon estimated to
be approximately 18 km (10 nautical miles). Gailey et al. (2007) limited their behavioral
observations to within 4 km of their observation platforms which had a maximum height
above sea level of 16 m. We conducted calibration tests by fixing a boat with the
theodolite and comparing the location estimated by Pythagoras to the boat’s GPS reading.
At a distance of 7.6 km, the difference between the theodolite fix and the GPS was 232
m. Therefore, we consider that the elevation at Yaquina Head (26.9 m above mean sea
level) allow reliable observations up to 8 km away from the station. Details about
theodolite fixing related errors are discussed in Würsig et al. (1991). While limitations of
the field of view at Yaquina Head are relevant for census studies (Green et al. 1995), we
think that the coverage is appropriate for behavioral studies within the Oregon territorial
sea. The 8 km from the station criterion was applied when choosing whales to be tracked
and is reflected in a lower number of tracks further offshore, particularly during the
northbound migration. The bias to track whales closer to the station must be considered
before drawing conclusions from tracking location data. That is the reason why distance
to shore, depth and percentage of locations within the Oregon territorial sea are only
analyzed for scan sampling locations.
Some tracklines had very high speed estimates which were likely the result of theodolite
fix errors. This problem was more prevalent during the first two months of the study as
observers became familiar with the method. Nevertheless, the majority of the tracking
data during the northward migration produced speed estimates well within the range of
32
values reported in previous studies (e.g. Harvey and Mate 1984, Mate and Urban-
Ramirez 2003).
The migration paths of tracked whales seem to follow a constant depth (isobath) rather that
following exactly the shoreline. For example, some whales that we started tracking more than
3 kilometers away from the observation point maintained a straight path even as they
approached Yaquina Head. Linearity of their path continued as they moved away from the
Head. Nevertheless, we observed variability in the isobath followed by different whales
within the same migration phase. Green et al. (1995) also observed this variability and
mention that the migration corridor off the Oregon and Washington coasts is seasonally and
annually “elastic”.
Our results indicate that, as expected, the migration paths of some gray whales cross through
areas of proposed wave energy development. Deployment of structures for wave energy
facilities (buoys, cables, mooring systems, etc.) in the migratory path of gray whales raises
the possibility of collision, entanglement or displacement of the whales (Boehlert et al.
2008). Future observations can use the data presented here as a baseline to determine
potential effects of wave energy facilities on the migratory path of gray whales off the
Oregon coast.
Acknowledgements
This study was funded by a contract from the Oregon Wave Energy Trust. We thank the
observers, Dalin D’Alessandro, Holland Banks, Julie House, and Barb Lagerquist for their
fieldwork. We are very grateful to Joe Ashore and all the personnel from the Bureau of Land
Management, Yaquina Head Outstanding Natural Area for the logistical support provided
during our fieldwork. We appreciate the support and feedback from Justin Klure, OWET.
Thanks to Bonnie Anderson-Becktold, Eunice Jenson, and Kathy Minta for administrative
support for this project.
33
References
ANGLISS, R. P. and R. B. OUTLAW. 2008. Alaska Marine Mammal Stock Assessments, 2007. NOAA Technical Memorandum NMFS-AFSC-180. 252 pp. Available from U.S. Department of Commerce, National Oceanic and Atmospheric Administration, National Marine Fisheries Service.
BOEHLERT, G. W., G. R. MCMURRAY and C. E. TORTORICI, Eds. 2008. Ecological effects of wave energy in the Pacific Northwest. U.S. Dept. Commerce, NOAA Tech. Memo. NMFS-F/SPO-92.
DARLING, J. D. 1984. Gray whales off Vancouver Island, British Columbia. Pages 267-287 in M. L. Jones, S. Swartz and S. Leatherwood, eds. The Gray Whale: Eschrichtius robustus. Academic Press, Orlando, Fla.
GAILEY, G. and J. G. ORTEGA-ORTIZ. 2002. A note on a computer-based system for theodolite tracking of cetaceans. Journal of Cetacean Research and Management 4:213–218.
GAILEY, G., B. WÜRSIG and T. L. MCDONALD. 2007. Abundance, behavior, and movement patterns of western gray whales in relation to a 3-D seismic survey, Northeast Sakhalin Island, Russia. Environmental Monitoring and Assessment 134:75-91.
GREEN, G. A., J. J. BRUEGGEMAN, R. A. GROTEFENDT and C. E. BOWLBY. 1995. Offshore distances of gray whales migrating along the Oregon and Washington coasts, 1990. Northwest Science 69:223-227.
HARVEY, J. T. and B. R. MATE. 1984. Ocean movements of radio-tagged gray whales. Pages 577-589 in M. L. Jones, S. Swartz and S. Leatherwood, eds. The Gray Whale: Eschrichtius robustus. Academic Press, Orlando, Fla.
HERZING, D. L. and B. R. MATE. 1984. Gray Whale Migrations along the Oregon Coast, 1978-1981. Pages 289-307 in M. L. Jones, S. Swartz and S. Leatherwood, eds. The Gray Whale: Eschrichtius robustus. Academic Press, Orlando, Fla.
KINZEY, D. and T. GERRODETTE. 2001. Conversion factors for binocular reticles. Marine Mammal Science 17:353-361.
LERCZAK, J. A. and R. C. HOBBS. 1998. Calculating sighting distances from angular readings during shipboard, aerial, and shore-based marine mammal surveys. Marine Mammal Science 14:590-598.
MATE, B. R. and A. POFF. 1999. The southbound migration of gray whales, winter 1998/99. NOAA Technical Memorandum NMFS-AFSC-103:48.
MATE, B. R. and J. URBAN-RAMIREZ. 2003. A note on the route and speed of a gray whale on its northern migration from Mexico to central California, tracked by satellite-monitored radio tag. Journal of Cetacean Research & Management 5:155-157.
NERINI, M. 1984. A review of gray whale feeding ecology. Pages 423-450 in M. L. Jones, S. Swartz and S. Leatherwood, eds. The Gray Whale: Eschrichtius robustus. Academic Press, Orlando, Fla.
34
NEWELL, C. L. and T. J. COWLES. 2006. Unusual gray whale Eschrichtius robustus feeding in the summer of 2005 off the central Oregon Coast. Geophysical Research Letters 33:L22S11.
POOLE, M. M. 1984. Migration corridors of gray whales along the central California coast, 1980-1982. Pages 389-407 in M. L. Jones, S. Swartz and S. Leatherwood, eds. The Gray Whale: Eschrichtius robustus. Academic Press, Orlando, Fla.
RICE, D. W. and A. A. WOLMAN. 1971. The life history and ecology of the gray whale, Eschrichtius robustus. Am. Soc. Mammal. Special Publication 3. 142 pp.
RICE, D. W., A. A. WOLMAN and H. W. BRAHAM. 1984. The gray whale, Eschrichtius robustus. Marine Fisheries Review 46:7-14.
RICE, D. W., A. A. WOLMAN, D. E. WITHROW and L. A. FLEISCHER. 1981. Gray whales on the winter grounds in Baja California. Report of the International Whaling Commission 31:477-493.
RUGH, D. J., K. E. W. SHELDEN and A. SCHULMAN-JANIGER. 2001. Timing of the gray whale southbound migration. Journal of Cetacean Research & Management 3:31-39.
SWARTZ, S. L., B. L. TAYLOR and D. J. RUGH. 2006. Gray whale Eschrichtius robustus population and stock identity. Mammal Review 36:66-84.
US ENVIRONMENTAL PROTECTION AGENCY. 1998. Guidelines for Ecological Risk Assessment. US Environmental Protection Agency, Risk Assessment Forum. EPA/630/R-95/002F. 188 pp., Washington, D.C.
WÜRSIG, B., F. CIPRIANO and M. WÜRSIG. 1991. Dolphin movement patterns: Information from radio and theodolite tracking studies. Pages 79-111 in K. Pryor and K. S. Norris, eds. Dolphin societies: Discoveries and puzzles. University of California Press, Berkeley, CA.