The Ecosystem-Based Fishery Management in the Bay of Bengal 149 Marine Resource Surveys by Drift Gill Net in the Bay of Bengal Phithak Chaidee 1 , Narupon Darumas 1 , Opas Chamasont 2 , Md. Nasiruddin Sada 3 , Rankiri P. P. Krishantha Jayasinghe 4 , Kattawatta Siriwarnage Dharana Chinthaka 4 , U Aung Win Sein 5 , Jagannath Nalla 6 and Thanitha Thapanand-Chaidee 7 1 Deep Sea Fishery Technology Research and Development Institute, Department of Fisheries, Samutprakarn 10270, THAILAND 2 Upper-Gulf Fisheries Research and Development Center, Department of Fisheries, Samutprakarn 10130, THAILAND 3 Fish Inspection and Quality Control, Department of Fisheries, 209 Muradpur(NM Khan Hill) P.O. Amin Jute Mill, Chittagong, BANGLADESH 4 National Aquatic Resource Research and Development Agency, Crow Island, Colombo 15, SRI LANKA 5 Department of Fisheries, Insein Rd, West Gyoton, Insein Township, Yangon, MYANMAR 6 Office of the Zonal Director, Visakhapatnam Base of Fishery Survey of India, Fishing Harbor, Beach Road, Vusakhapatnam-530001, INDIA 7 Department of Fishery Biology, Faculty of Fisheries, Kasetsart University, Bangkok 10900, THAILAND Abstract This paper presented the first time survey of marine resources in the Bay of Bengal in terms of catch composition; Catch per unit effort (CPUE) and catch per unit area (CPUA) by drift gill net (DGN). The survey was conducted in eight stations of three sub-areas during October–December 2007 under the mission of BIMSTEC collaborative project. The fishery research vessel, M.V. SEAFDEC (cruise No. 75-1/2007) was deployed in the proposed survey. A total catch of 137.60 kg from 108 fishing hours composed of 15 fish species (99.60% by weight) and one piece of diamondback squid (Thysanoteuthidae: Thysanoteuthis rhombus) was captured (0.40% by weight). The highest catch species of marine resources was skipjack tuna, Katsuwonus pelamis, (42.96% by weight). The CPUE was ranged from 0.15 to 2.08 kg h -1 and gave the average of 1.22 kg h -1 . The CPUA was ranged from 1.297x10 -4 to 1.651x10 -3 kg m -2 of net area and gave the average of 8.809x10 -4 kg m -2 of net area. Average catch was not shown significant different among the three survey areas. Skipjack tuna was also the most important economical species (66.72% IRI) and widely distributed in the survey area especially in area A. Silky shark (Carcharhinus falciformis), which was the second important (10.55% IRI), was distributed only in area C whereas frigate tuna (Auxis thazard thazard), which was the third important (7.47% IRI), was distributed only in area A. Key words: catch composition, marine resources, drift gill net, Bay of Bengal, BIMSTEC Introduction Drift netting is a fishing technique where nets, called drift nets, are allowed to drift free in a sea or lake. Usually a drift net is a gill net with floats attached to a rope along the top of the net, and weights attached to another rope along the foot of the net. Drift net can range in length from 25 m to 2.5 miles. (http://en.wikipedia.org/wiki/Drift_net) The nomenclature of drift net or drift gill net depends on the target species. The common species are mackerel, flying fish, tuna and tuna-like, manta ray and other pelagic species. These fish species require different mesh and twin sizes as well as material to maximize catch. For mackerel, flying fish, sardines and other small pelagic species the nets are made of nylon monofilament of 0.20 mm
Transcript
The Ecosystem-Based Fishery Management in the Bay of Bengal
149
Marine Resource Surveys by Drift Gill Net in the Bay of Bengal
Phithak Chaidee1, Narupon Darumas1, Opas Chamasont2, Md. Nasiruddin Sada3, Rankiri P. P. Krishantha Jayasinghe4,
Kattawatta Siriwarnage Dharana Chinthaka4, U Aung Win Sein5, Jagannath Nalla6 and Thanitha Thapanand-Chaidee7
1 Deep Sea Fishery Technology Research and Development Institute,
Department of Fisheries, Samutprakarn 10270, THAILAND 2 Upper-Gulf Fisheries Research and Development Center,
Department of Fisheries, Samutprakarn 10130, THAILAND
3 Fish Inspection and Quality Control, Department of Fisheries, 209 Muradpur(NM Khan Hill) P.O. Amin Jute Mill, Chittagong, BANGLADESH
4 National Aquatic Resource Research and Development Agency, Crow Island, Colombo 15, SRI LANKA
5 Department of Fisheries, Insein Rd, West Gyoton, Insein Township, Yangon, MYANMAR
6 Office of the Zonal Director, Visakhapatnam Base of Fishery Survey of India, Fishing Harbor, Beach Road, Vusakhapatnam-530001, INDIA
7 Department of Fishery Biology, Faculty of Fisheries, Kasetsart University, Bangkok 10900, THAILAND
Abstract
This paper presented the first time survey of marine resources in the Bay of Bengal in terms of catch composition; Catch per unit effort (CPUE) and catch per unit area (CPUA) by drift gill net (DGN). The survey was conducted in eight stations of three sub-areas during October–December 2007 under the mission of BIMSTEC collaborative project. The fishery research vessel, M.V. SEAFDEC (cruise No. 75-1/2007) was deployed in the proposed survey. A total catch of 137.60 kg from 108 fishing hours composed of 15 fish species (99.60% by weight) and one piece of diamondback squid (Thysanoteuthidae: Thysanoteuthis rhombus) was captured (0.40% by weight). The highest catch species of marine resources was skipjack tuna, Katsuwonus pelamis, (42.96% by weight). The CPUE was ranged from 0.15 to 2.08 kg h-1 and gave the average of 1.22 kg h-1. The CPUA was ranged from 1.297x10⁻⁴ to 1.651x10⁻³ kg m-2 of net area and gave the average of 8.809x10⁻⁴ kg m-2 of net area. Average catch was not shown significant different among the three survey areas. Skipjack tuna was also the most important economical species (66.72% IRI) and widely distributed in the survey area especially in area A. Silky shark (Carcharhinus falciformis), which was the second important (10.55% IRI), was distributed only in area C whereas frigate tuna (Auxis thazard thazard), which was the third important (7.47% IRI), was distributed only in area A. Key words: catch composition, marine resources, drift gill net, Bay of Bengal, BIMSTEC
Introduction Drift netting is a fishing technique where nets, called drift nets, are allowed to drift free in a sea or lake. Usually a drift net is a gill net with floats attached to a rope along the top of the net, and weights attached to another rope along the foot of the net. Drift net can range in length from 25 m to 2.5 miles. (http://en.wikipedia.org/wiki/Drift_net) The nomenclature of drift net or drift gill net depends on the target species. The common species are mackerel, flying fish, tuna and tuna-like, manta ray and other pelagic species. These fish species require different mesh and twin sizes as well as material to maximize catch. For mackerel, flying fish, sardines and other small pelagic species the nets are made of nylon monofilament of 0.20 mm
The Ecosystem-Based Fishery Management in the Bay of Bengal
150
to 0.40 mm diameter with mesh size from 25 mm to 90 mm. For tuna species, the material is nylon multifilament PA 210/12 to 210/18 in the main webbing whole iron rings and/or thicker multifilament nettings (210/30 to210/36) are used as weights. The mesh size ranges from 50 mm to 90 mm. There are 10 to 20 meshes of thicker netting acting as weights in the lower portion of the webbing. ( http://map.seafdec.org/Monograph project/gill_net_2.php ) Drift nets have been commonly used by many countries in the coastal waters. This type of net was heavily used by many Japanese, South Korean and Taiwanese fishing fleets on the high seas in the 1980s to target tunas. Generally, fish which are smaller than the meshes of the gill nets are able to pass through unhindered, while those which are too large to push their heads through the meshes as far as their gills are not retained. This gives a selectivity ogive which is skewed towards medium size fish, unlike active fishing gears such as trawl nets in which the proportion of fish entering the nets which are retained increases with length. Although highly selective with respect to size class of the fish captured, practically gill nets are blamed for the impact on non-target species particularly dolphins, turtles and seabirds. In 1993 gill nets were banned by the United Nations in international waters, although their use is still permitted within 200 nautical miles (400 km) of a coast. ( http://en.wikipedia.org/wiki/Gillnet ) However, in international waters which generally cover deep water areas, there are only a few types of fishing gear suitable for harvesting fishery resources. The important fishing gears suitable for fishing in deep water areas are purse-seine, pelagic longline and drift gill net (DGN). For pelagic fish commonly distribute in the upper layer, drift gill nets are widely deployed to catch these fishes because of the simplicity in operating. Thus, DGN is chosen to be one of the 3 types of fishing gear, besides pelagic longline and automatic squid jigging, for the survey and study of marine fishery resources in the Bay of Bengal and being the rationale of the sub-project on Marine Resource Surveys by Drift Gill Net in the Bay of Bengal. This sub-project aims to assess the potential of marine fishery resources captured by DGN in terms of species and catch composition, catch per unit effort (CPUE) and stock abundance in term of index of relative importance (IRI). The result from this research will support a useful background for effective fishery resource management in the Bay of Bengal. Furthermore, it will improve capabilities in fish stock assessment of the biologists and researchers in the member countries as well as to develop the academic ability in training the staff of the Faculty of Fisheries, Kasetsart University and establish a good collaboration among member countries in research and academic activities.
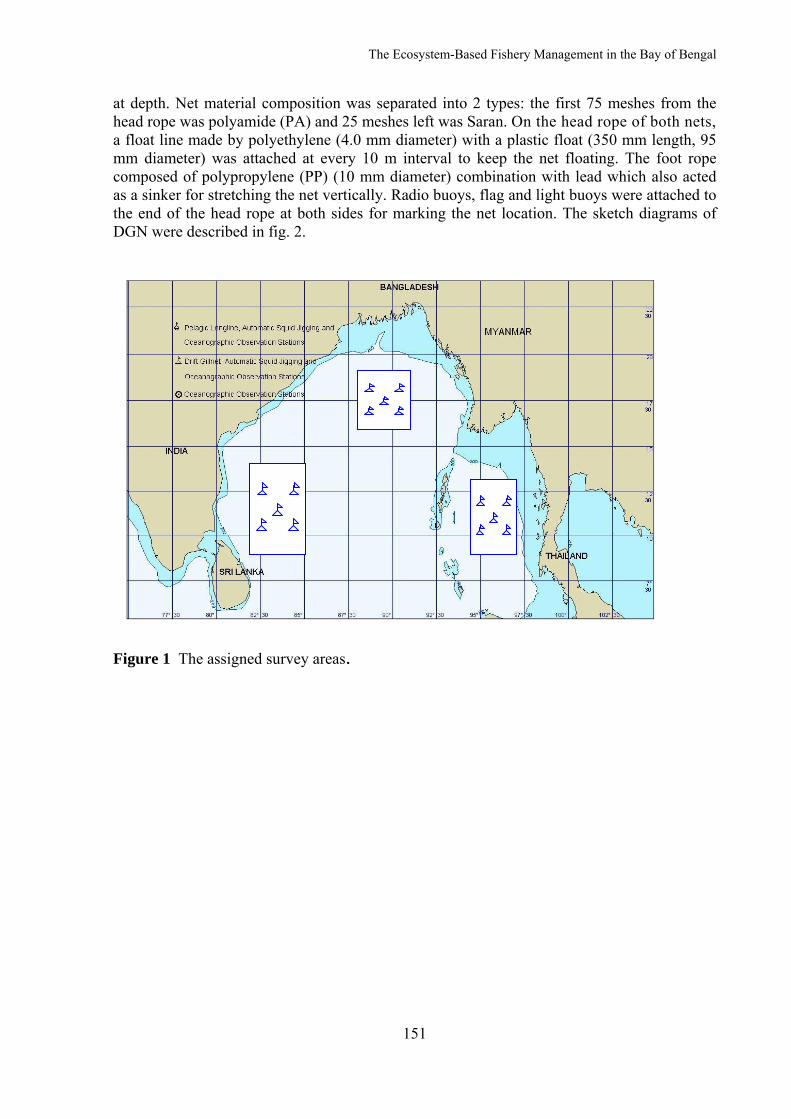
Materials and Methods Area of Fishing Operation The study was carried out in the Bay of Bengal during 25 October to 21 December 2007. Three sub-areas were defined namely area A: latitude 16°N-19°N and longitude 88°E-91°E (5 stations); area B: latitude 9°N-14°N and longitude 82°E-85°E (5 stations); and area C: latitude 10°N-12°N and longitude 95°E -97°E (5 stations) (Fig. 1). Fishing Gear The fishery research vessel, M.V. SEAFDEC, of the Southeast Asian Fisheries Development Center (SEAFDEC) was used in this study. Field sampling was conducted using two types of net materials for drift gill net (DGN), monofilament and multifilament nylon twines. Total length of monofilament DGN was 2,200 m with 100 mm of mesh size and 93 meshes at depth. Multifilament DGN was 2,500 m with 160 mm of mesh size and 100 meshes
The Ecosystem-Based Fishery Management in the Bay of Bengal
151
at depth. Net material composition was separated into 2 types: the first 75 meshes from the head rope was polyamide (PA) and 25 meshes left was Saran. On the head rope of both nets, a float line made by polyethylene (4.0 mm diameter) with a plastic float (350 mm length, 95 mm diameter) was attached at every 10 m interval to keep the net floating. The foot rope composed of polypropylene (PP) (10 mm diameter) combination with lead which also acted as a sinker for stretching the net vertically. Radio buoys, flag and light buoys were attached to the end of the head rope at both sides for marking the net location. The sketch diagrams of DGN were described in fig. 2.
Figure 1 The assigned survey areas.
The Ecosystem-Based Fishery Management in the Bay of Bengal
152
DGN was started shooting at the sun down and leaved overnight. The hauling was started in the next morning around 6.00 A.M. Depth of each sampling station and the immersion period were recorded. Field Work and Data Collection After marine resources were on board, identification was made at the species level. Overall fish size: total length (TL), fork length (FL), standard length (SL), head length (HL) and girth length (GL) were measured to the nearest 0.1 cm. and body weight (BW) was also recorded to the nearest 0.1 g. Primary sexual characters of the fishes were determined by dissecting. Testes were classified into two stages whereas ovaries were classified at least four stages of development. Ripening ovaries were collected in zip-log bags and deep frozen for further analyzed at laboratory. The data were recorded separately by sampling stations and areas.
Figure 2 Drift gill net diagrams.
PA MONO Ø 0.4100 mm 93
PE Ø
4 mm
, 10 m
Float
line
Float 10 m
2,200 m, PP Ø 6 mm, S+Z
PP with lead Ø 10 mm, S+Z
2.2 kg, Buoyancy
160 mm, SN
PA 210/18160 mm 75
PE Ø
4 mm
, 10 m
Float
line
Float 10 m
2,500 m, PP Ø 8 mm, S+Z
25
2.2 kg, Buoyancy
The Ecosystem-Based Fishery Management in the Bay of Bengal
153
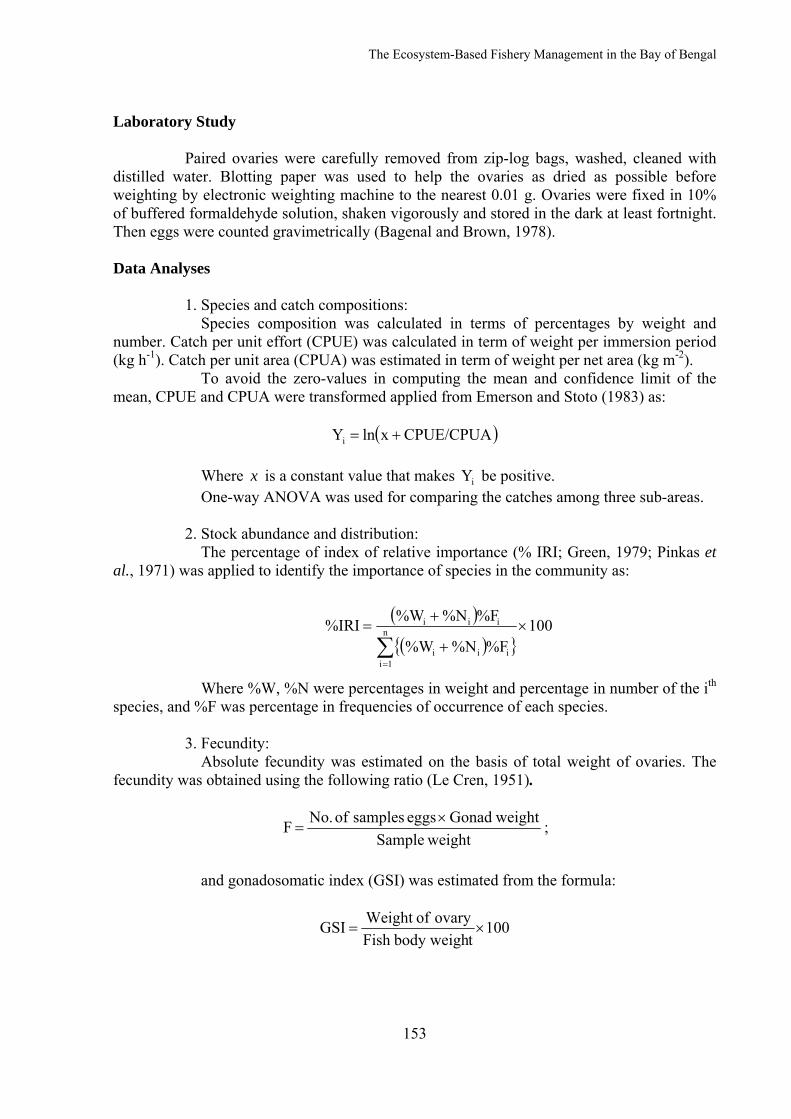
Laboratory Study Paired ovaries were carefully removed from zip-log bags, washed, cleaned with distilled water. Blotting paper was used to help the ovaries as dried as possible before weighting by electronic weighting machine to the nearest 0.01 g. Ovaries were fixed in 10% of buffered formaldehyde solution, shaken vigorously and stored in the dark at least fortnight. Then eggs were counted gravimetrically (Bagenal and Brown, 1978). Data Analyses 1. Species and catch compositions: Species composition was calculated in terms of percentages by weight and number. Catch per unit effort (CPUE) was calculated in term of weight per immersion period (kg h-1). Catch per unit area (CPUA) was estimated in term of weight per net area (kg m-2). To avoid the zero-values in computing the mean and confidence limit of the mean, CPUE and CPUA were transformed applied from Emerson and Stoto (1983) as:
( )CPUE/CPUAxlnYi +=
Where x is a constant value that makes iY be positive. One-way ANOVA was used for comparing the catches among three sub-areas. 2. Stock abundance and distribution: The percentage of index of relative importance (% IRI; Green, 1979; Pinkas et al., 1971) was applied to identify the importance of species in the community as:
( )( ){ }
100%F%N%W
%F%N%W%IRI n
1iiii
iii ×+
+=
∑=
Where %W, %N were percentages in weight and percentage in number of the ith
species, and %F was percentage in frequencies of occurrence of each species. 3. Fecundity: Absolute fecundity was estimated on the basis of total weight of ovaries. The fecundity was obtained using the following ratio (Le Cren, 1951).
weightSample weightGonad eggs samples of No.F ×
= ;
and gonadosomatic index (GSI) was estimated from the formula:
100tbody weighFish
ovary ofWeight GSI ×=
The Ecosystem-Based Fishery Management in the Bay of Bengal
154
Results and Discussion At the first 15 stations, five stations per sub-areas, were assigned to operate by DGN. During the survey, the cyclone disaster ‘Sidr’ affected to the sea condition so rough that the survey stations hade been skipped out for safety. Practically DGN could only be operated in eight sampling stations: three in area C, four in area A and one in area B, respectively (Fig. 3). Multifilament net was operated only both at the first and the second stations. According to the lack of sinkers in multifilament net, it was found that the net could not fully expand. Consequently, the monofilament net was used in the left six stations.
Figure 3 The practical DGN survey stations. Species Composition Total catch from this study was separated into two major groups: fishes and invertebrate. For fish composition, 15 species in 9 families were identified. For invertebrate, only one piece of diamondback squid, Thysanoteuthis rhombus Troschel, 1857 was identified (Table 1).
The Ecosystem-Based Fishery Management in the Bay of Bengal
155
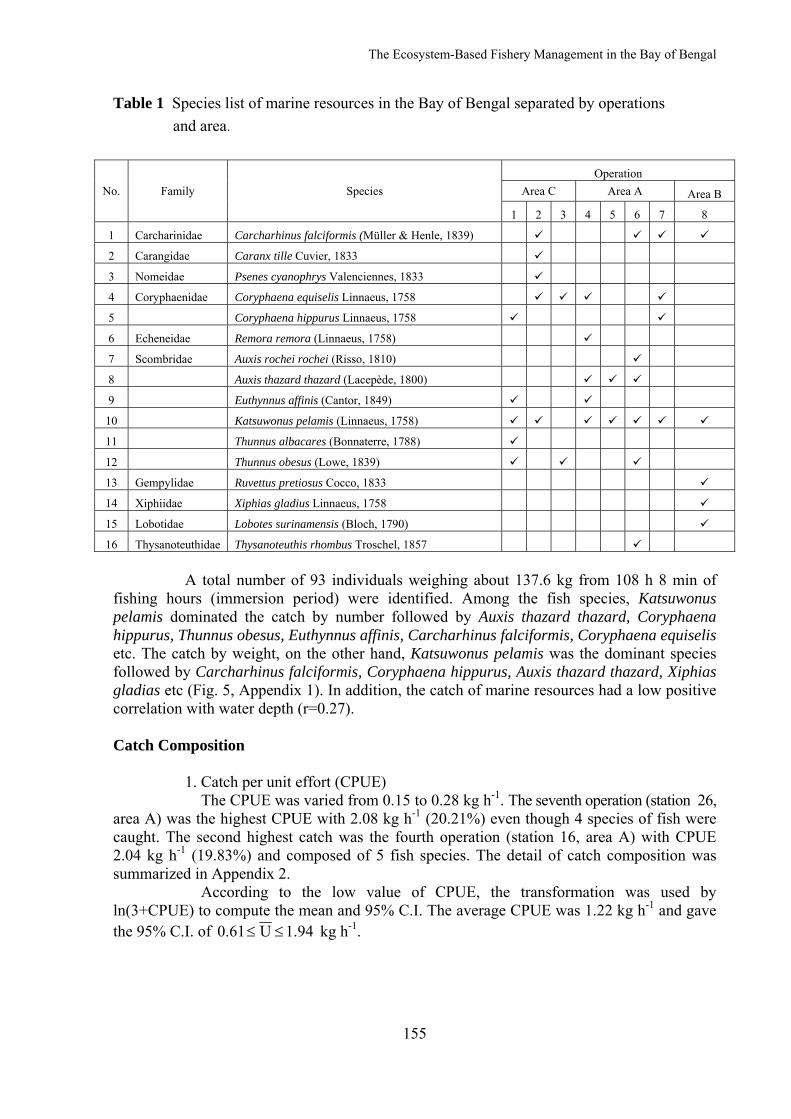
Table 1 Species list of marine resources in the Bay of Bengal separated by operations and area.
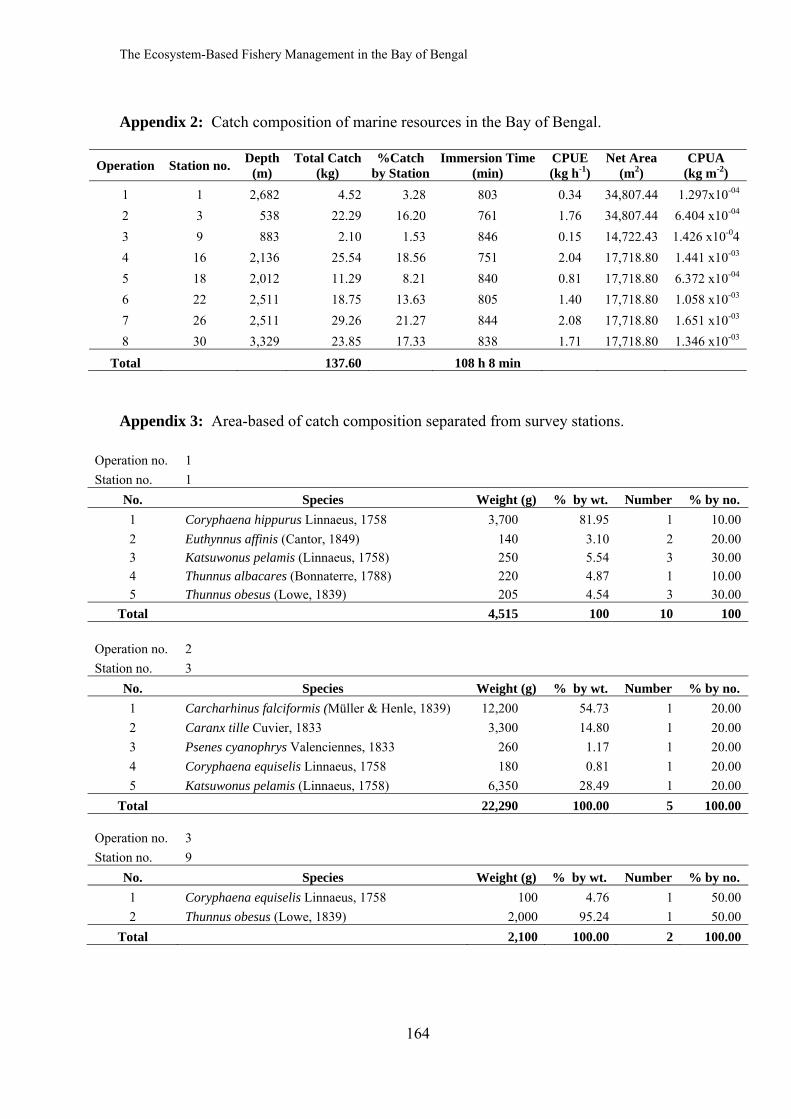
A total number of 93 individuals weighing about 137.6 kg from 108 h 8 min of fishing hours (immersion period) were identified. Among the fish species, Katsuwonus pelamis dominated the catch by number followed by Auxis thazard thazard, Coryphaena hippurus, Thunnus obesus, Euthynnus affinis, Carcharhinus falciformis, Coryphaena equiselis etc. The catch by weight, on the other hand, Katsuwonus pelamis was the dominant species followed by Carcharhinus falciformis, Coryphaena hippurus, Auxis thazard thazard, Xiphias gladias etc (Fig. 5, Appendix 1). In addition, the catch of marine resources had a low positive correlation with water depth (r=0.27). Catch Composition 1. Catch per unit effort (CPUE) The CPUE was varied from 0.15 to 0.28 kg h-1. The seventh operation (station 26, area A) was the highest CPUE with 2.08 kg h-1 (20.21%) even though 4 species of fish were caught. The second highest catch was the fourth operation (station 16, area A) with CPUE 2.04 kg h-1 (19.83%) and composed of 5 fish species. The detail of catch composition was summarized in Appendix 2. According to the low value of CPUE, the transformation was used by ln(3+CPUE) to compute the mean and 95% C.I. The average CPUE was 1.22 kg h-1 and gave the 95% C.I. of 94.1U61.0 ≤≤ kg h-1.
The Ecosystem-Based Fishery Management in the Bay of Bengal
156
Figure 4 Species composition of dominant marine resources in the Bay of Bengal. a. percentage by weight (top-ten) b. percentage by number (top-six)
The Ecosystem-Based Fishery Management in the Bay of Bengal
157
2. Catch per unit area (CPUA) The net area of DGN in this study was estimated by rectangular area (length x depth). For the estimation of the net depth (D), hanging ratio (h) and number of meshes (n) was used as the following formula (Prado and Dremiere, 1990).
( ) ( )mnh1D 2 ××−=
The hanging ratio of PA both in multifilament and monofilament were 0.5 while Saran was 0.47. Hence, the net area of multifilament was 34,807.44 m2. The net area of monofilament, however, was 14,722.43 m2 for the net length of 1,700 m and 14,722.43 m2 for the net length of 2,200 m. The CPUA was ranged from 1.297x10⁻⁴ to 1.651x10⁻³ kg m-2 of net area. According to the low value of CPUA, the transformation was used by ( )CPUA7ln + for computing the mean and 95% C.I. of mean. The average CPUA was 8.809x10⁻⁴ kg m-2 and gave the 95% C.I. of 34 101.369A103.923 −− ×≤≤× kg m-2. 3. Area-based of catch composition Overall, area-based of catch composition separated from survey stations were shown in appendix 3.
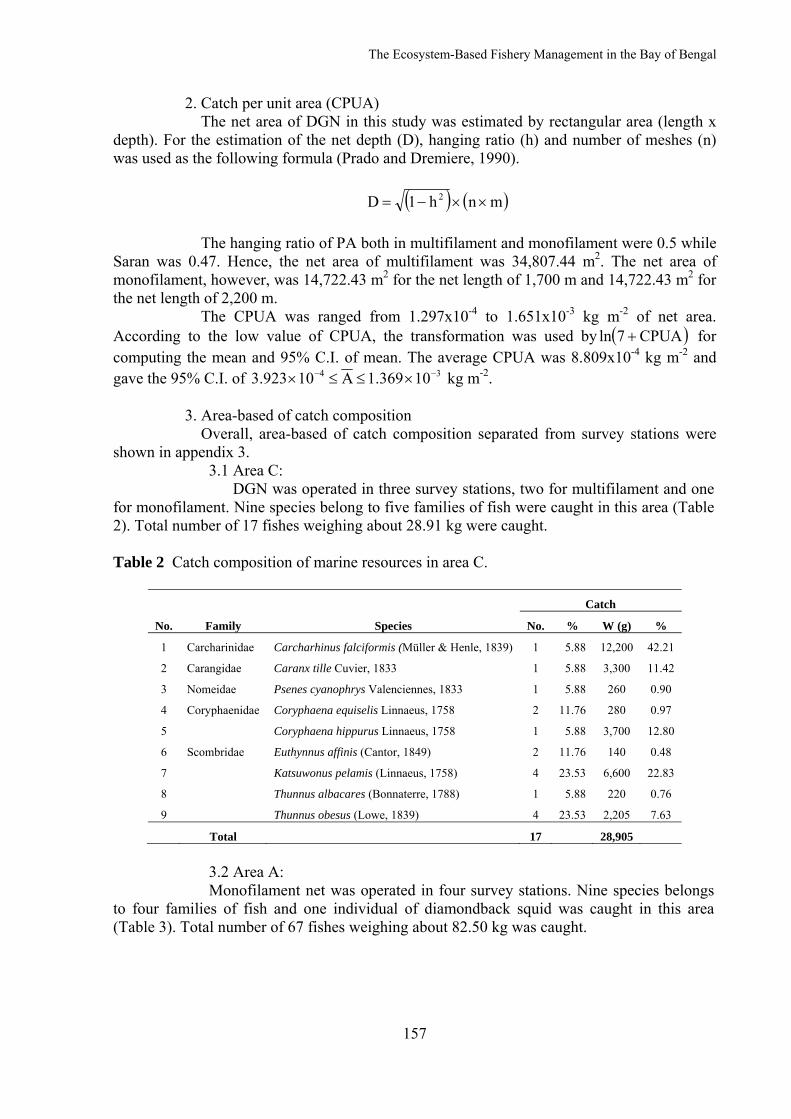
3.1 Area C: DGN was operated in three survey stations, two for multifilament and one
for monofilament. Nine species belong to five families of fish were caught in this area (Table 2). Total number of 17 fishes weighing about 28.91 kg were caught.
Table 2 Catch composition of marine resources in area C.
Total 17 28,905 3.2 Area A: Monofilament net was operated in four survey stations. Nine species belongs to four families of fish and one individual of diamondback squid was caught in this area (Table 3). Total number of 67 fishes weighing about 82.50 kg was caught.
The Ecosystem-Based Fishery Management in the Bay of Bengal
158
Table 3 Catch composition of marine resources in area A.
Total 68 83,050 3.3 Area B: Monofilament DGN was operated in only one survey station due to stormy
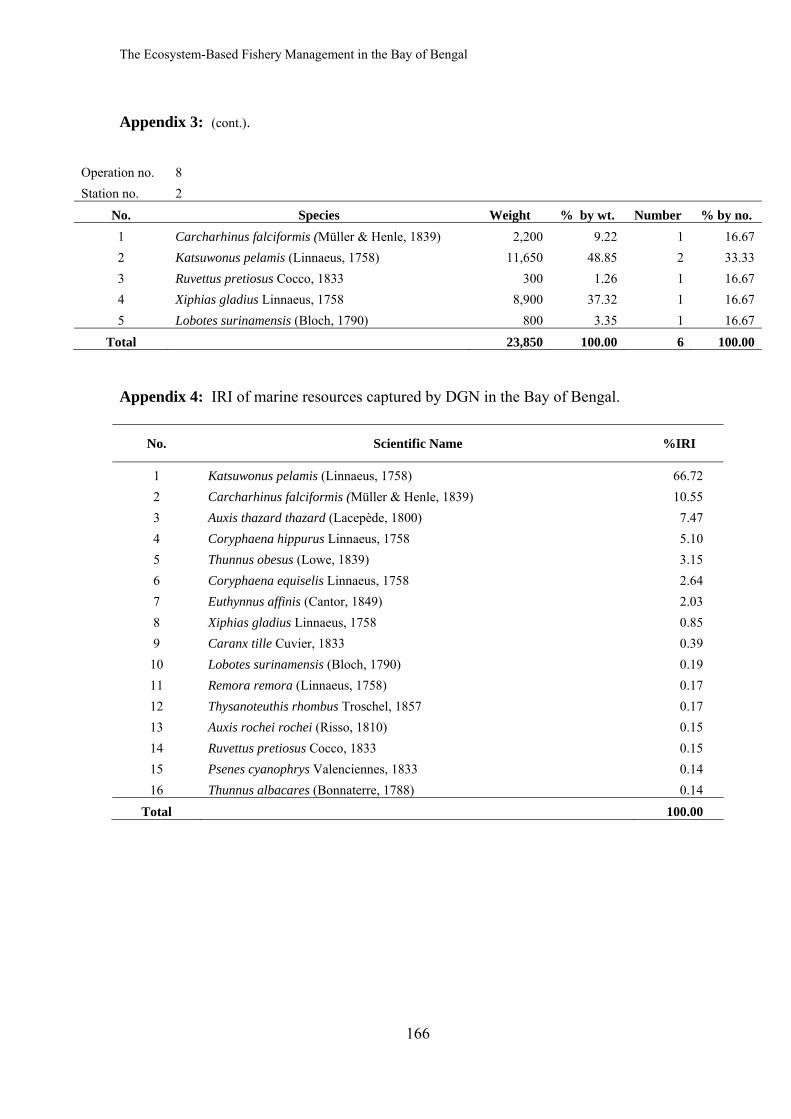
sea conditions. In one operation six species belong to six families of fish were caught in this area (Table 4). Total number of 6 fishes weighing about 23.85 kg were caught. Table 4 Catch composition of marine resources in area B.
Total 6 23,850 An ANOVA (single factor) was used to test the different catch among three sub-areas in term of CRD with unequal replication (Steel and Torrie, 1986). The result was not shown significantly different among the three sub-areas (p>0.05).
Abundance and Distribution
Index of relative importance (IRI) was the first mentioned in the study on feeding ecology (Green, 1979; Pinkas et al., 1971). This index shows how importance of food items in fish stomach followed by trophic level. Nowadays, the IRI was applied to explain how important of fish species in the community by multi-dimensions: percentage of weight, number and frequency of occurrence at the same time. IRI also applies for describing spatial stock abundance and distribution.
In this study, the IRI was used to examine the importance of marine resources captured by DGN both in holistic and station-based conditions. For holistic condition, IRI was estimated by summing the catch of all survey stations as represent to the Bay of Bengal
The Ecosystem-Based Fishery Management in the Bay of Bengal
159
(Appendix 4). The top-eight important species in the Bay of Bengal was described as follow (Fig. 5):
Figure 5 The top-eight important marine resources in the Bay of Bengal. The result from fig. 5 revealed that, skipjack tuna was the most important species for DGN fishery in the Bay of Bengal. It can be occurred in every part of the survey area except in station 9 (area C). Silky shark was the second important species. It can be found in 4 survey stations from 3 sub-areas; area C in station 3, area A in station 22 and 26, and area B in station 30, respectively. In holistic view point, most of the important species in the Bay of Bengal were economic fishes. The station-based IRI of the top-eight important species was explained as the following (Fig. 6):
Figure 6 The station-based, top-eight important marine resources in the Bay of Bengal.
Unit: percent
The Ecosystem-Based Fishery Management in the Bay of Bengal
160
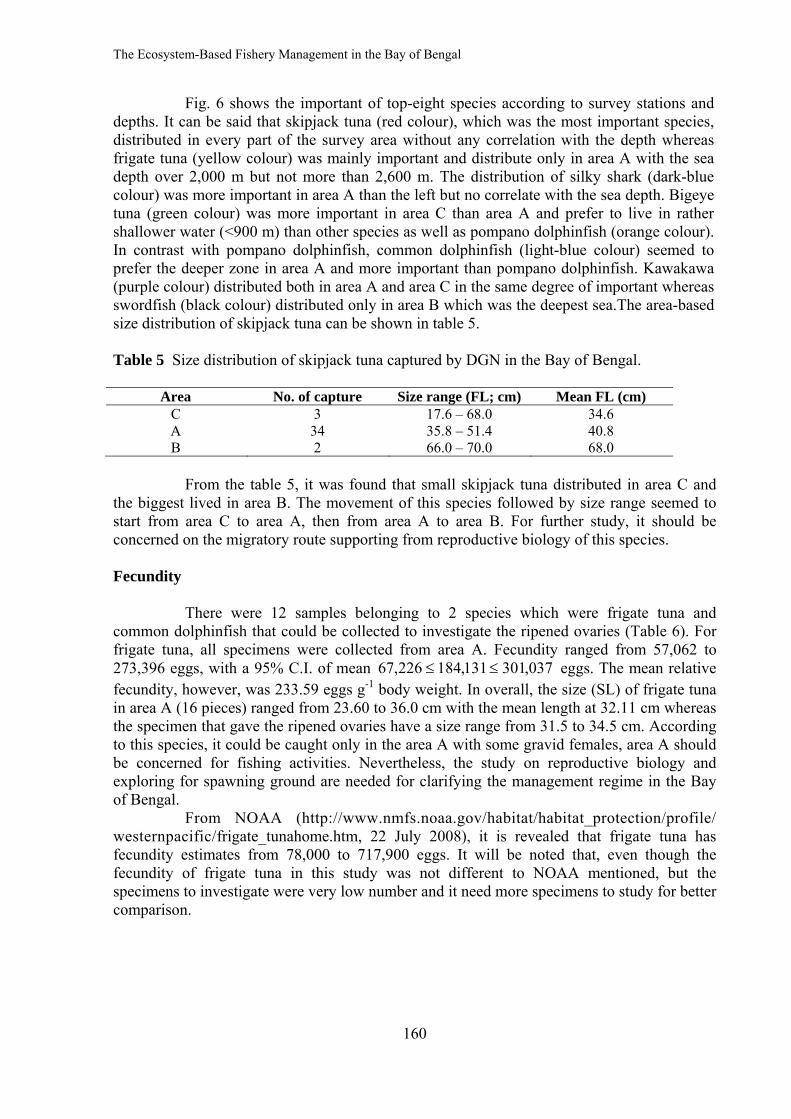
Fig. 6 shows the important of top-eight species according to survey stations and depths. It can be said that skipjack tuna (red colour), which was the most important species, distributed in every part of the survey area without any correlation with the depth whereas frigate tuna (yellow colour) was mainly important and distribute only in area A with the sea depth over 2,000 m but not more than 2,600 m. The distribution of silky shark (dark-blue colour) was more important in area A than the left but no correlate with the sea depth. Bigeye tuna (green colour) was more important in area C than area A and prefer to live in rather shallower water (<900 m) than other species as well as pompano dolphinfish (orange colour). In contrast with pompano dolphinfish, common dolphinfish (light-blue colour) seemed to prefer the deeper zone in area A and more important than pompano dolphinfish. Kawakawa (purple colour) distributed both in area A and area C in the same degree of important whereas swordfish (black colour) distributed only in area B which was the deepest sea.The area-based size distribution of skipjack tuna can be shown in table 5. Table 5 Size distribution of skipjack tuna captured by DGN in the Bay of Bengal.
Area No. of capture Size range (FL; cm) Mean FL (cm) C 3 17.6 – 68.0 34.6 A 34 35.8 – 51.4 40.8 B 2 66.0 – 70.0 68.0
From the table 5, it was found that small skipjack tuna distributed in area C and the biggest lived in area B. The movement of this species followed by size range seemed to start from area C to area A, then from area A to area B. For further study, it should be concerned on the migratory route supporting from reproductive biology of this species. Fecundity There were 12 samples belonging to 2 species which were frigate tuna and common dolphinfish that could be collected to investigate the ripened ovaries (Table 6). For frigate tuna, all specimens were collected from area A. Fecundity ranged from 57,062 to 273,396 eggs, with a 95% C.I. of mean 037,301131,184226,67 ≤≤ eggs. The mean relative fecundity, however, was 233.59 eggs g-1 body weight. In overall, the size (SL) of frigate tuna in area A (16 pieces) ranged from 23.60 to 36.0 cm with the mean length at 32.11 cm whereas the specimen that gave the ripened ovaries have a size range from 31.5 to 34.5 cm. According to this species, it could be caught only in the area A with some gravid females, area A should be concerned for fishing activities. Nevertheless, the study on reproductive biology and exploring for spawning ground are needed for clarifying the management regime in the Bay of Bengal. From NOAA (http://www.nmfs.noaa.gov/habitat/habitat_protection/profile/ westernpacific/frigate_tunahome.htm, 22 July 2008), it is revealed that frigate tuna has fecundity estimates from 78,000 to 717,900 eggs. It will be noted that, even though the fecundity of frigate tuna in this study was not different to NOAA mentioned, but the specimens to investigate were very low number and it need more specimens to study for better comparison.
The Ecosystem-Based Fishery Management in the Bay of Bengal
161
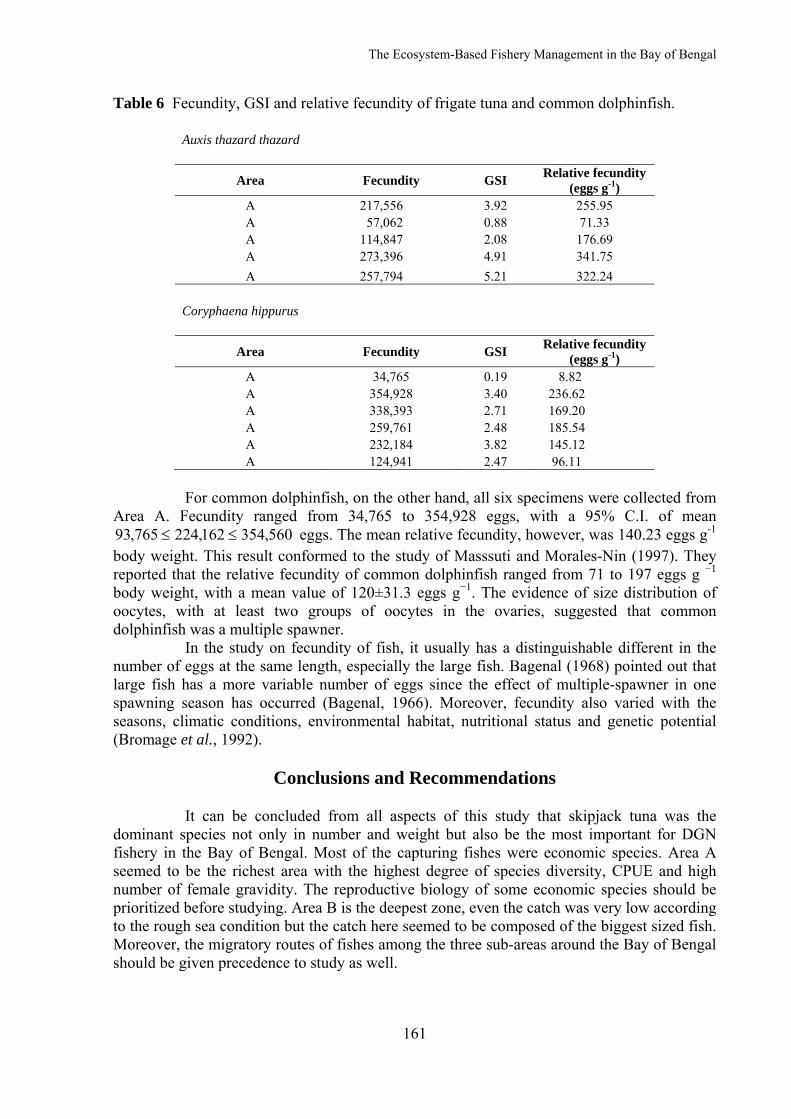
Table 6 Fecundity, GSI and relative fecundity of frigate tuna and common dolphinfish.
Auxis thazard thazard
Area Fecundity GSI Relative fecundity (eggs g-1)
A 217,556 3.92 255.95 A 57,062 0.88 71.33 A 114,847 2.08 176.69 A 273,396 4.91 341.75 A 257,794 5.21 322.24
Coryphaena hippurus
Area Fecundity GSI Relative fecundity (eggs g-1)
A 34,765 0.19 8.82 A 354,928 3.40 236.62 A 338,393 2.71 169.20 A 259,761 2.48 185.54 A 232,184 3.82 145.12 A 124,941 2.47 96.11
For common dolphinfish, on the other hand, all six specimens were collected from Area A. Fecundity ranged from 34,765 to 354,928 eggs, with a 95% C.I. of mean
560,354162,224765,93 ≤≤ eggs. The mean relative fecundity, however, was 140.23 eggs g-1 body weight. This result conformed to the study of Masssuti and Morales-Nin (1997). They reported that the relative fecundity of common dolphinfish ranged from 71 to 197 eggs g −1 body weight, with a mean value of 120±31.3 eggs g−1. The evidence of size distribution of oocytes, with at least two groups of oocytes in the ovaries, suggested that common dolphinfish was a multiple spawner. In the study on fecundity of fish, it usually has a distinguishable different in the number of eggs at the same length, especially the large fish. Bagenal (1968) pointed out that large fish has a more variable number of eggs since the effect of multiple-spawner in one spawning season has occurred (Bagenal, 1966). Moreover, fecundity also varied with the seasons, climatic conditions, environmental habitat, nutritional status and genetic potential (Bromage et al., 1992).
Conclusions and Recommendations It can be concluded from all aspects of this study that skipjack tuna was the dominant species not only in number and weight but also be the most important for DGN fishery in the Bay of Bengal. Most of the capturing fishes were economic species. Area A seemed to be the richest area with the highest degree of species diversity, CPUE and high number of female gravidity. The reproductive biology of some economic species should be prioritized before studying. Area B is the deepest zone, even the catch was very low according to the rough sea condition but the catch here seemed to be composed of the biggest sized fish. Moreover, the migratory routes of fishes among the three sub-areas around the Bay of Bengal should be given precedence to study as well.
The Ecosystem-Based Fishery Management in the Bay of Bengal
162
The magnitude of the importance of marine resources from this study will serve the understanding of pelagic community in the Bay of Bengal. It will also be beneficial to the DGN fishery management in the future.
Acknowledgements The authors would like to acknowledge the Ministry of Foreign Affairs and Department of Fisheries, Ministry of Agriculture and Cooperatives, Kingdom of Thailand for providing the research expenses under the BIMSTEC collaborative research project. We are also indebted to SEAFDEC/TD for supporting the research vessel, M.V. SEAFDEC and all the ship crews for their kind hospitality and smoothly management during the research survey. Thanks are also due to Mr. Montri Sumontha (Thai DOF.) for collecting ovarian samples and Miss Jeerawat Thammaratsuntorn (Department of Fishery Biology, Faculty of Fisheries, KU.) for fecundity counting. We are also forwarded our thanks to whom that may concern for editing this manuscript.
References Bagenal, T. B. 1966. The ecological and geographical aspects of fecundity of plaice.
J. Mar. Biol. Assoc. UK. 46:161-186. Bagenal, T. B. 1968. Eggs and early life history-fecundity. In: Ricker, R.E. (ed.). Methods for Assessment of Fish Production in Fresh Waters. I. B. P. Handbook no. 3, Blackwell Scientific Publications Ltd., Oxford. 313 p. Bagenal, T. B. and E. Brown. 1978. Eggs and early life history. In: Bagenal, T. B. (ed.). Methods for the Assessment of Fish Production in Fresh Water. Blackwell Scientific Publications Ltd., Oxford. p. 165-201. Bromage, N., J. Jones, C. Randal, M. Thrush, B. Davies, J. Springate, J. Duston and G. Baker. 1992. Brood stock management, fecundity, egg quality and the timing of egg production in the rainbow trout (Oncorhynchus mykiss). Aquaculture 100:141-166. Green, R. H. 1979. Sampling Design and Statistical Methods for Environmental Biologists. John Wiley and Son Inc., New York. 257 p. Emerson, J. D. and M. A. Stoto. 1983. Transforming data. In: Hoaglin, D. C., F. Mosteller
and J. W. Tukey. (eds.). Understanding Robust and Exploratory Data Analysis. John Wiley and Son Inc., New York. p. 97-128.
Le Cren, E. D. 1951. The length-weight relationship and seasonal cycle in gonad weight and condition in the perch (Perca fluvitalis). J. Anim. Ecol. 20:201-219. Massutí, E. and B. Morales-Nin. 1997. Reproductive biology of dolphin-fish (Coryphaena hippurus L.) off the island of Marjorca (western Mediterranean). Fish. Res. 30:57-65. Pinkas, L., M. S. Oliphant and I. L. K. Iverson. 1971. Food habits of albacore, blue-fin tuna and bonito in California waters. Fish Bulletin 152:1-105. Prado, J. and P. Y. Dremiere. 1990. Fishermen’s Workbook. Fishing News Book, UK. 187 p. Steel, R. G. D. and J. H. Torrie. 1986. Principles and Procedures of Statistics: A Biometrical Appproach, 2nd edition. McGraw-Hill, Singapore. 633 p.
The Ecosystem-Based Fishery Management in the Bay of Bengal
163
Appendix 1: Species composition of marine resources by number and weight.


![FEDERATED STATES OF MICRONESIA ANNOTATED …Title_24]_0.pdf · TITLE 24 – MARINE RESOURCES T24-7 (21) “Drift net” means a gillnet or other net or arrangement of nets which is](https://static.documents.pub/doc/80x56/5ae7e7927f8b9a870490038d/federated-states-of-micronesia-annotated-title240pdftitle-24-marine.jpg)


