46

BAY OF BENGAL PROGRAMME BOBP/INF/4
Development of Small-Scale Fisheries (GCP/RAS/040/SWE)
MARINE SMALL-SCALE FISHERIES OF ANDHRA PRADESH: BOBP/INF/4A GENERAL DESCRIPTION
Executing Agency: Funding Agency:
Food and Agriculture Organisation Swedish Internationalof the United Nations Development Authority
Development of Small-Scale Fisheries in the Bay of BengalMadras, India, June 1983

PREFACE
Thispaper attempts a brieffactual presentation of data and baselineinformationon the main features of marine small-scale fisheries in Andhra Pradesh.
It may serve as an introduction to the subject, leading to deeper studies; asa source of general information; or as a background document for use indiscussions on planning and programming of development assistance.
The paper revises and updates an April 1978 document issued by the FAO/ UNDP Project for Development of Small-Scale Fisheries in South WestAsia, RAS/74/031. That document was partly financed by the preparatoryphase of the FAO/SIDA Bay of Bengal Programme.
This document has been prepared in cooperation with the Directorate of Fisheries, Andhra Pradesh. It is a working paper and has not been officiallycleared by the Government or the FAO.

CONTENTS
1. Introduction 1
2. Fishery resources 1
3. Fishing fleet 2
4. Infrastructure and service facilities 4
5. Production 5
6. Handling and processing 6
7. Distribution and marketing 7
8. Export and import 8
9. Coastal aquaculture 9
10. Socio-economics 11
11. Fisheries administration and institutions 12
11 .1 Fisheries administration 12
11 .2 Research and development institutions 13
11 .3 Training institutions 13
1 2. Industry organisation 14
1 2.1 Fisheries corporations 14
12.2 Fisheries cooperative societies 14
13. Government policy 15
14. Development plans 15
15. Bibliography 16
Tables:
5.1 Fish landings by month 5
5.2 Contribution of non-mechanised and mechanised craft to fishlandings 6
7.1 Coastal marketing units of APFC 7
8.1 Value and quantity of fish exports, 1 972-79 8
8.2 Composition of fish exports, 1977-79 9
9.1 Brackishwaters with aquaculture potential 9
9.2 Shrimp/fish seed availability at Kakinada 10
12.2 Membership and share capital of AFCCS Ltd. 1979/80 14
Appendices:
1 .1 An administrative-cum-coastal map of Andhra Pradesh 1 7
1.2 State data 18
2.1 Andhra Pradesh coastal districts and the continental shelf 21
3.1 Distribution of traditional marine fishing craft owned/shared by fishermen 22
3.2 Distribution of mechanised fishing craft owned/shared by fishermen 22
3.3 Distribution of fishing gear owned/shared by fishermen 23
3.4 Economics of operation of a 10 m mechanised boat 24
4.1 Distribution of freezing, frozen storage and ice-making facilities in the coastal districts 26
5.1 Fish landings in Andhra Pradesh 1970-80 26
5.2 Composition of marine fish landings, 1972-79 27
5.3 Landings of selected fish species by months (1977) 29
5.4 Some important commercial marine fish species of Andhra Pradesh 30
7.1 Demand for marine fish (1977) 31
7.2 Comparison of fish prices at various levels (1977-78) 32
10.1 Fisherfolk population (1980) 33
11 .1(a) Fisheries in national and state administrations 34
11 .1(b) Administrative set-up of Directorate of Fisheries 35
12.1 Organisation chart of Andhra Pradesh Fisheries Corporation (APFC) 36
14.1 Fisheries development schemes (1951-79) 37
14.2 Proposed fisheries development projects during the sixth five year
plan (1980/81-1984/85) 38
Publications of the Bay of Bengal Programme 40
The state of Andhra Pradesh is situated between latitudes 1 3°40’N and 1 9°N andlongitudes 80°Eand 85°E.It is bordered by the Bay of Bengal in the east, Orissa andMadhya Pradesh in the north, Maharashtra in the north-west, Karnataka in the west andsouth-west, and Tamil Nadu in the south. The state is divided into 23 revenue districts;nine of the districts are coastal. An administrative map is given in Appendix 1 .1. Somesocio-economic indicators are given in Appendix 1 .2.
The continental shelf is estimated to be 31 ,000 km2 and is 32 km wide on the average. The 0-50 m depth range area covers about 16,000 km2.
Andhra Pradesh accounted for more than 6% of India’s total marine landings and 23% ofthe marine landings of the east coast states in 1979. Pelagic fish contributed 46% anddemersal 54% to the total landings. About 84,000 fishermen earn their livelihood whollyor partially from marine fishing. Some 36,000 craft are engaged in sea fishing, of whichover 99% are traditional and non-mechanised, mostly kattumarams. Motorisation of fishing craft was first attempted in the late 50’s but there are only a few hundredmotorised marine fishing boats. Synthetic twine has almost replaced cotton twine formaking fish nets. At least 70% of the catch is landed by the non-mechanised traditionalcraft from waters hardly beyond 40 m depth.
Fishermen have a low caste status. They are classified a “backward class” and belong tothe socially and economically weaker section of the population. The fishing villages are toa large extent geographically isolated : adequate infrastructure facilities, proper roadcommunication and sufficient fresh water supplies are lacking. The standard of housing isusually very low, a fact aggravated by frequent fires and cyclones.
In view of the increased demand for fish and the scope offered by the resource potential for increasing catch, the government envisages expansion of the fishing fleet as well asincrease of its operational range — by means of fleet improvements and diversification,provision of improved landing facilities, better marketing and transport infrastructure. Thegovernment is also focussing its attention on the development of potential brackishwaterareas for fish and shrimp farming.
The Sixth Five-Year Plan (1980/81-1984/85) aims at increasing marine landings up to134,000 tonne per annum by 1984/85.
Besides increasing production, the government aims at securing reasonable prices for fishproducers and at improving the socio-economic status of fisherfolk.
2. FISHERY RESOURCES
Andhra Pradesh generally has a warm climate. Summer and winter temperatures in thecoastal districts may vary between 43°Cand 15°C.The effects of both monsoons are feltbut greater rainfall is experienced during the southwest monsoon of July-September,particularly in the northern part. The northeast monsoon of October-December brings rainespecially along the southern part of the coastal belt. The average annual rainfall is 90-1 20cm. Cyclones with speeds of 90-130 km/hr are quite common during October-November.January-April is the calm season and the best for fishing. During October-December,cyclonic weather hinders fishing. Occasional gales interspersed with calm periods areexperienced during May-September.
Comprehensive oceanographic data are not available for the region. On the entire eastcoast, the circulation of water along the coast is greatly influenced by the patterns of wind associated with the summer monsoons. Around February, a clockwise circulation sets inand becomes stronger during the southwest monsoon period. After October, the current reverses due to the northeast monsoon and an anti-clockwise circulation takes place from

November to about the beginning of February. The average value of salinity rangesbetween 30 ppt and 34 ppt and the surface temperature is between 27°Cand 29°C.Salinity in the bay comes down significantly during the monsoons because of dilution by the heavy discharge of fresh water from the Godavari and Krishna rivers.
The bottom of the continental shelf up to 70 m depth is predominantly flat with notrenches or sudden slopes and is hence suitable for trawling. Continuous echo-soundingsurveys off Visakhapatnam have revealed several interesting topographic features such asterraces, pinnacles and reefs between 70 m water depth and the edge of the continentalshelf. Deep water trawl nets often get entangled in these structures and suffer damage. Ofthe total area of the continental shelf about 53% is in the 0-50 m depth range. Appendix2.1 (map) shows the coastal districts and the depth contours of the continental shelf.
Exploratory survey data collected during 1958-78 was analysed by Rao and Rajkumar in1979. The analysis showed that the seasonal abundance of various groups of fishes indifferent zones remained more or less the same over the entire period. Six importantgroups of fish predominated : sharks; skates and rays; cathsh; miscellaneous big (largerthan 30 cm) including mainly Pomadasys hasta, Stromateus niger and Muraenesox spp; miscellaneous small (smaller than 30 cm) including mainly Leiognathus spp, Upeneus spp,Johnius aneus, Nemipterus japonicus, Trichiurus spp, and Saurida tumbelit; and prawns.
The analysis showed that the average annual percentage of catch composition for the siximportant groups of fish in three depth zones (0-30 m, 31-40 m, 41-70 m) showed littlevariation; 55-60% of the catch was composed of the miscellaneous-small category.Catfish comprised 21-24% of the catch, sharks and rays from 5 to 7% and prawn 2 to3%; catfish showed an inverse relationship with the miscellaneous fish in their monthlyabundance. In some years, about 40% of the total shrimp catch was landed during July - August; the average catch rate in the depth zone 0-30 m was about 130 kg/hr, in the31-40 m 100 kg/hr, and 110kg/hr in the 41-70 m zone.
There are no estimates of the overall resource potential of the continental shelf.
An analysis of the results of exploratory surveys carried out in areas lying betweenlatitude zones 1 5°40’N and 19°40’N and in depths ranging from 10 m to 90 m for theperiod 1 972-78 indicates that the richest latitude zones for elasmobranchs were 16°40’ and 1 8°40’; catfish were abundant south of Visakhapatnam; the highest catch ratefor shrimp was in 1 8° 10’; the miscellaneous small fish were most abundant in thelatitude zones 15°40’, 18°10’ and 18°40’; and the 16°10’, 16°40’ and 15°40’zones were seen to be the richest when the catch rate of all fish was considered.
The analysis further showedthat rays, catfishand miscellaneous-big abound at the 60-70 mdepth; shrimp prefer shallower depths of 10-20 m; the miscellaneous-small category isconcentrated at depths 20-30 m and 30-40 m and that, in general, the 60-70 m depthzone represents the most productive area.
3. FISHING FLEET
Fishing craft
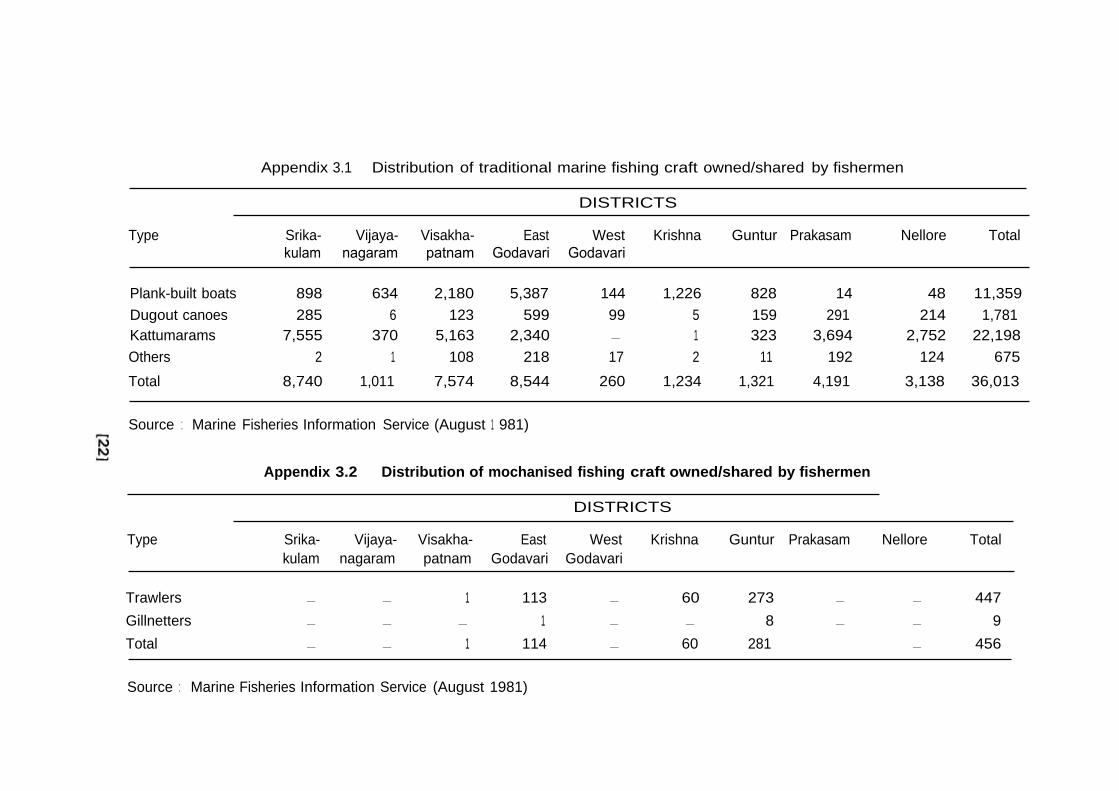
The all-India census of marine fishermen, craft and gear, 1 980, made a count of about36,500 marine fishing craft in Andhra Pradesh. The figure included about 450 mechanisedboats out of a total of 580 constituting less than 2% of the total number of craft. Of the traditional craft, the major component consisted of kattumarams accounting for 62%.The distribution of the mechanised boats and traditional craft owned/shared by fishermenby type and district is given in Appendices 3.1 and 3.2 respectively.
The traditional craft consist of kattumarams, masula boats, navas, dinghies and dhonies.Srikakulam and Visakhapatnam districts have the largest number of kattumarams.Dinghies are found almost exclusively in Krishna district while dhonies are common inEast Godavari and Guntur.
[2]

The kattumaram is made up of 4 or 5 solid logs lashed together in two or three pieces.When assembled they take a boat form with a rockered bottom, sharp stem and anarrow stern. The dimensions are : length 4.5-7.5 m and beam 1 .0-1 .5 m. Wood with good buoyancy is preferred for construction and includes Melia dubia and Albizziastipulata. The paddles, oars and other accessories are usually made from bamboo andcasuarina. It is propelled by oars or paddles while crossing the surf and by sail in the opensea. The cost of a kattumaram is Rs.2,500 - 5,000 depending on the wood used, size,type of accessories, etc. It operates up to 35 km from the shore and up to 50 m depth,carrying a crew of 3-5 persons. Fishing methods used are mostly small-mesh gillnetting,line fishing and boat seining; and the main species caught are sardine, small mackerel,ribbon fish, silver belly, shrimp, etc. The craft has a life of 5-10 years, shorter whenconstructed with cheap wood.
The nava is a craft made of teak wood planks. Its dimensions are usually length 5-10 m,beam 1 to 2 m, depth 0.75 m. It operates all year round except during days of very rough weather. The craft is prominent in the East Godavari and Krishna districts. It isused for bottom set/gillnetting, drift/gillnetting, stake netting and beach seining. Thecost is Rs. 5,000-10,000 and thc service life approximately 10 years.
The Kakinada nava is a bigger version of the nava. It is 9-1 2 m long, 2 m broad, 1 mdeep, and is operated by a crew of 8 to 1 0.
The Kothapa/em nava is a modified version of the Kakinada nava, used mainly along theGuntur coast. It has a transom stern while the Kakinada nava is double-ended.
The masula or padava is generally made of mango wood planks stitched together withreeds and coir rope. The spaces between the planks are caulked with pitch and coir.Being keelless, the craft can be easily pulled ashore. It is used only for shore seining,mostly in Srikakulam, Visakhapatnam, Guntur and in smaller numbers in East Godavari,Prakasam and Nellore districts.
Mechanisation of fishing craft in Andhra Pradesh started in 1954-55, when the stategovernment, in collaboration with FAO experts, introduced the first mechanised boats.Thesizes of the mechanised boatsvary from 9 m to 11 m, the most popular size being 10 m.Most of these boats are used for shrimp trawling.
Mechanised boats generally have uninsulated holds with a capacity of 3 tonne. The holds,however, are generally not used and the fish is dumped on the deck.
The horsepower of the engines generally varies between 50 HP and 80 HP. The hulls aremade mostly of wood and often sheathed with aluminium to protect the wooden hulls frommarine borer attack. Chemical wood preservatives with toxic ingredients are also used toprotect the wood from decay, marine borers and other biofoulants.
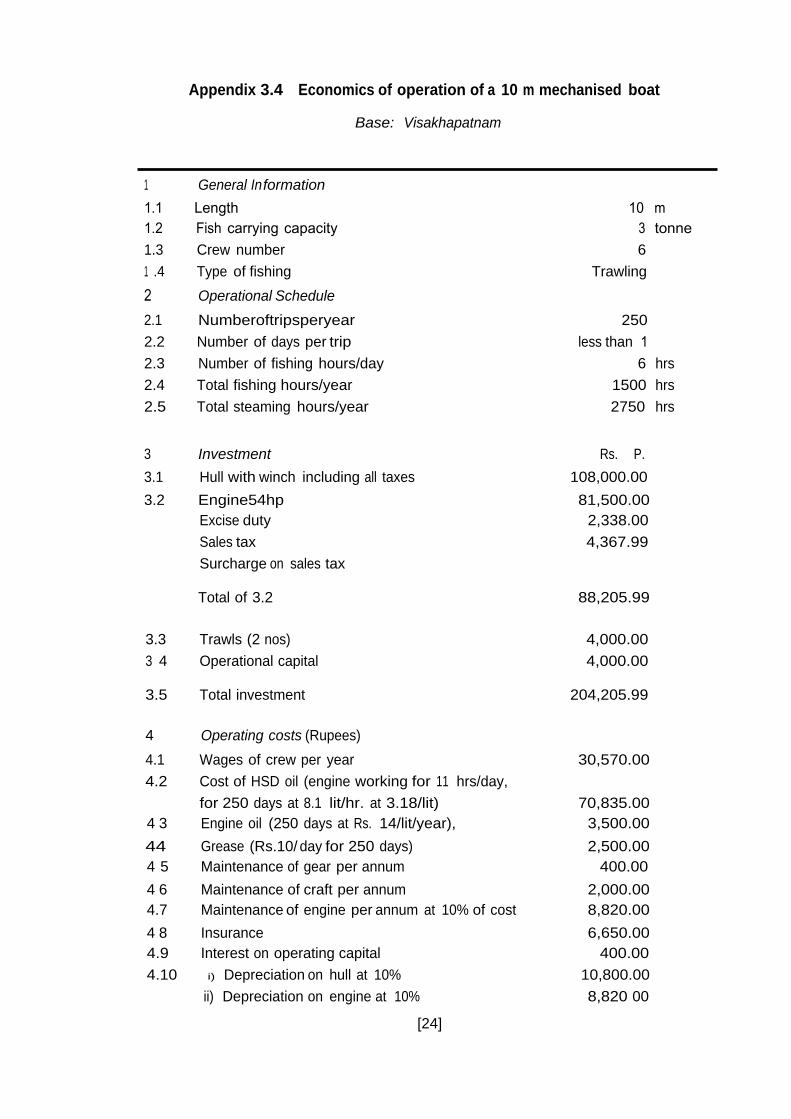
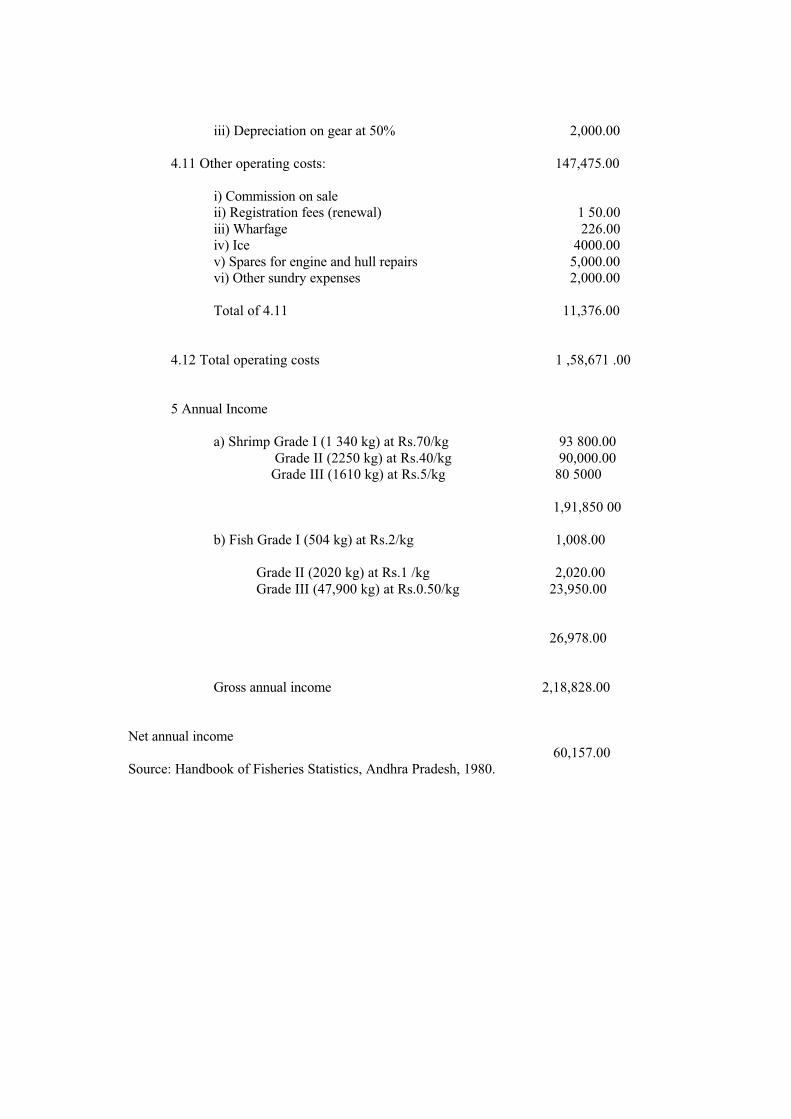
Mechanised boats are not expected to operate within 5 km from the coast, as this strip ofwater is reserved for non-mechanised craft. The mechanised boats usually do not fishbeyond the 40 m depth line. Vessels of 25 gross tonnage, or more, which have to beoperated by certified skippers, are not expected to fish within the 10 km line. Theeconomics of operation of a 10 m trawler based in Visakhapatnam aregiven in Appendix 3.4.
As a rule, all mechanised boats have to be registered with the state’s port departmentunder the harbour craft rules.
In addition to the 9-1 1 m mechanised boats, there are about 66 foreign built trawlersengaged in commercial shrimp trawling. Their length ranges between 21 and 30 m, themost popular size being 23 m.
The Andhra Pradesh Fisheries Corporation (APFC) owns and operates two 23 m trawlers;the private sector operates the rest. The APFC plans to procure and operate six more trawlers during the Sixth Plan Period.
2 [3]

Fishing gear
A variety of fishing gear is used in Andhra Pradesh. These include shore seines, boatseines,gillnets, drag nets, cast nets and traps. The distribution of fishing gear owned/sharedby fishermen according to the count taken in the all-India census of marine fishermen, craft and gear of 1 980, is shown in Appendix 3.3.
The bo3t seine (iragavala) is made of 20 count cotton yarn. The cod end is made of jute fibre. The mesh size varies from 1 2.5 to 250 mm — smallest at the cod end and graduallyincreasing in size at belly and wings. It is operated from a kattumaram by 4 or 5 fishermen.it costs Rs. 1,500-2,000
The shore seine (Ally/va/a) is made of 20 count cotton yarn. The head and foot ropes are made of hemp. Long coir ropes are attached to the wings on either side. The mesh size at the wings is about 300 mm and at the bag 12.5 mm. In the “chinna (small) alivivala”,however, the mesh size is the same throughout. Floats are attached to the head ropes.Lead or stone sinkers are used with the “pedda (big) alivivala” whereas no sinkers areused with the chinna alivivala. The pedda alivivala has a bag and is operated by 40 to 50 men while the chinna alivivala has only a loose central portion which acts as a bag, and isoperated by about 20 men.
Gillnets (Vaddivala/Kaftavala) are used as drift or bottom set nets, according to the seasonand the type of fish caught. The mesh size varies from 50 mm to 1 50 mm. Cotton/hempnets are being replaced by nylon nets in recent years.
Napuvala is a type of nylon gilinet with the head rope and foot rope (8 mm PP-PE)measuring 1 8 m and 16 m respectively. Local wooden floats called tilla karra or chilapakarra are used. Sinkers are not used. They are generally operated from Kothapalem navas,each craft carrying 60 to 80 units.
Kasula va/a is a prawn gillnet made of nylon twine and operated from kattumarams.Length of head/foot rope is 42 to 44 m of 2 or 3 mm of PP-PE rope. Wooden floats and 5-7 cm diameter cement or stone sinkers are used. Each kattumaram carries 8-10 units ofthis net.
A stake net made of 20 count cotton yarn is generally used in shallow areas and operatedfrom dinghies, small Kothapalem navas and dhonies. Mesh size is 75 mm at the mouth and1 2 mm at the cod end. This conical shaped bag net with a rectangular mouth is fixed tocasuarina poles or palmyrah trunks driven into the bottom of the sea.
Longlines with 800-1 000 hooks fastened to lines of twisted cotton yarn are sometimesoperated from kattumarams.
4. INFRASTRUCTURE AND SERVICE FACILITIES
There are about 450 coastal fishing villages and about 380 fish landing centres. There areformal landing facilities for mechanised boats only at two places, Visakhapatnam andKakinada. The fishing harbour at Visakhapatnam, established in 1 976, has a slipway andrepair facilities. The harbour provides services for a fleet of 300 mechanised boats and 56trawlers. Kakinada has a fishing harbour basin 180 m long and 22 m wide. Thoughdesigned to accommodate 75 10 m mechanised boats, it now handles about 300 vessels.A second harbour at Kakinada is being planned. The APFC is responsible for the establishmentand operation of these harbours.
South of Kakinada, there are no landing facilities for regular use by mechanised boats. Theestablishment of three more harbours — one at Nizampatnam (Guntur district) for about50 boats, one at Krishnapatnam (Nellore district) for 250 boats and one at Bhavanapadu(Srikakulam district) for 200 boats — is proposed during the Sixth Five-Year Plan.
[4]

Most of the freezing and frozen storage and a substantial portion of the ice-makingfacilities used for fisheries are in Visakhapatnam and East Godavari districts. The totalcapacity of the ice plants is 583 tonne/day. Freezing and frozen storage capacities are1 57.7 tonne and 2560 tonne respectively. Distribution of these facilities by districts isindicated in Appendix 4.1.
At a large number of places along the coast, traditional fishing craft are constructed byartisanal boatbuilders without elaborate boatyard facilities. Talarevu in East Godavaridistrict and Machilipatnam in Krishna district are two very important centres for this typeof boatbuilding.
The APFC operates a boatyard for the construction of mechanised boats at Kakinada. Theyard’s original capacity was 60 10-12 m boats a year; it was recently expanded to 120 boats a year.
Repair and service facilities for mechanised boats are available only at Visakhapatnam andKakinada. The APFC operates a fuel supply point at Kakinada to supply diesel, lubricants,etc., at reasonable rates for fishing boats. There is no net-making plant in the state.
Development of access roads in the fishing villages is a long-felt need. Specific plans existto construct roads or improve the existing ones in four of the coastal districts, viz.Visakhapatnam, East Godavari, Guntur and Nellore, with foreign aid. A total of about 350km of road is to be constructed under two projects.
5. PRODUCTION
The estimated fish production in 1 980 from marine waters was about 11 6,000 tonne andrepresents 48.7% of the total landings from inland and marine sources. Andhra Pradeshranks sixth among the eight maritime states of India and second among the four eastcoast states in marine fish production. The state’s fish landings for 1970-80 are shown inAppendix 5.1.
Fish production statistics show a sharp increase in 1974 of nearly 60% from the previous year. Increases were maintained till 1976; landings returned thereafter to the pre-1974 level. The reason for the sudden increase in production is not known but was notapparently linked with fishing pressure. The composition of marine fish landings from1972 to 1979 is shown in Appendix 5.2.
In 1979, the clupeid species constituted 22% of the total marine landings. The otherimportant forms were elasmobranchs, penaeid shrimp, sciaenids, ribbon fish, mackerel,catfish and carangids.
Monthwise total fish landings for two years are shown in Table 5.1.
Table 5.1Fish landings by month
MONTHS
Year Jan Feb Mar Apr May
1976 18.4 16.5 11.9 11.5 11.6
1977 7.3 8.0 16.4 12.6 9.1
Jun Jul Aug
8.0 7.0 9.2
7.9 10.3 6.5
Sep
9.8
6.3
Oct Nov Dec Total
6.2 8.5 12.7 131.3
4.4 5.0 6.9 100.7
Monthwise landings of selected fish species in 1977 are indicated in Appendix 5.3.
[5]
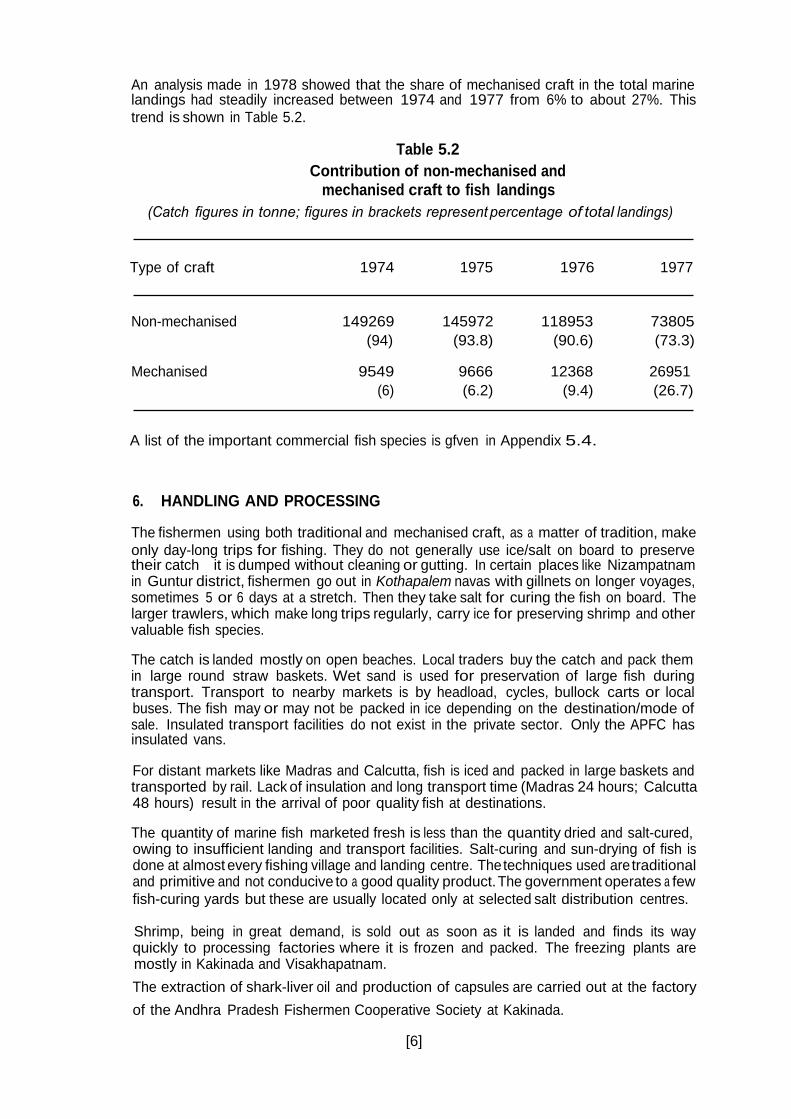
An analysis made in 1978 showed that the share of mechanised craft in the total marinelandings had steadily increased between 1974 and 1977 from 6% to about 27%. Thistrend is shown in Table 5.2.
Table 5.2Contribution of non-mechanised and
mechanised craft to fish landings(Catch figures in tonne; figures in brackets representpercentage of total landings)
Type of craft 1974 1975 1976 1977
Non-mechanised 149269 145972 118953 73805(94) (93.8) (90.6) (73.3)
Mechanised 9549 9666 12368 26951(6) (6.2) (9.4) (26.7)
A list of the important commercial fish species is gfven in Appendix 5.4.
6. HANDLING AND PROCESSING
The fishermen using both traditional and mechanised craft, as a matter of tradition, makeonly day-long trips for fishing. They do not generally use ice/salt on board to preservetheir catch it is dumped without cleaning or gutting. In certain places like Nizampatnamin Guntur district, fishermen go out in Kothapalem navas with gillnets on longer voyages,sometimes 5 or 6 days at a stretch. Then they take salt for curing the fish on board. The larger trawlers, which make long trips regularly, carry ice for preserving shrimp and othervaluable fish species.
The catch is landed mostly on open beaches. Local traders buy the catch and pack themin large round straw baskets. Wet sand is used for preservation of large fish duringtransport. Transport to nearby markets is by headload, cycles, bullock carts or localbuses. The fish may or may not be packed in ice depending on the destination/mode of sale. Insulated transport facilities do not exist in the private sector. Only the APFC hasinsulated vans.
For distant markets like Madras and Calcutta, fish is iced and packed in large baskets andtransported by rail. Lack of insulation and long transport time (Madras 24 hours; Calcutta48 hours) result in the arrival of poor quality fish at destinations.
The quantity of marine fish marketed fresh is less than the quantity dried and salt-cured,owing to insufficient landing and transport facilities. Salt-curing and sun-drying of fish isdone at almost every fishing village and landing centre. Thetechniques used aretraditionaland primitive and not conducive to a good quality product.The government operates a fewfish-curing yards but these are usually located only at selected salt distribution centres.
Shrimp, being in great demand, is sold out as soon as it is landed and finds its wayquickly to processing factories where it is frozen and packed. The freezing plants are mostly in Kakinada and Visakhapatnam.
The extraction of shark-liver oil and production of capsules are carried out at the factory
of the Andhra Pradesh Fishermen Cooperative Society at Kakinada.
[6]

A canning plant was established at Kakinada by the fisheries department in 1 974, with an installed capacity of a thousand 4 lb cans/shift. There being no demand for cannedproducts, the operation of the plant was stopped. The APFC plans to revive the factoryfor the canning of fish and crab meat. The APFC is setting up the following processingfacilities:— a fish-meal plant at Lawson’s Bay in Visakhapatnam district with capacity to process
five tonne of raw material/day.— two fish drying plants, one at Visakhapatnamand the other at Krishnapatnam in Nellore
district, each having capacity to process 1 tonne of raw material/day.— three fish filleting and mincing plants at Visakhapatnam, Machilipatnam and Krishna-
patnam.
7. DISTRIBUTION AND MARKETING
Very little marketing information and consumer survey data are available. It is estimatedthat about 36% of the marine catch is consumed fresh and the bulk of the balance driedor salted. It is also estimated that a considerable portion of the latter is fed to animals orsometimes wasted due to the inefficiency of the existing handling, distribution andmarketing systems. The portion of the catch that is frozen for export is negligible.
The per capita availability of fish in 1 976/77 in Andhra Pradesh was 4.95 kg if the entirepopulation is taken into account or 6.2 kg in relation to the meat and fish eatingpopulation. Though slightly better than the all-India average of 4.93 kg, consumption isstill much below the requirement according to nutritional standards.
A study carried out in 1977 by the Consulting and Applied Research Division (CARD) ofthe Administrative Staff College of India for the APFC indicates that consumer preference for freshwater fish is greater in the urban centres. In these centres, however, certainmarine species such as pomfret, seer and catfish fetch competitive prices. Appendix 7.1gives an indication of the demand for some selected fish species as worked out by theCARD study.
The existing marketing system involves both public and private sectors. APFC representsthe public sector in the marketing system. It has so far been primarily concerned with theprocurement and marketing of prawns for export. The APFC has 10 coastal marketingunits located in seven districts. These are shown in Table 7.1.
Table 7.1 Coastal marketing units of APFC
District Location of marketing unit
Nellore K D Reservoir, Nellore, KavaliPrakasam Ongole, ChiralaGuntur NizampatnamKrishna VijayawadaWest Godavari EluruEast Godavari KakinadaVisakhapatnam Visakhapatnam
To supply these marketing units, the APFC has set up 27 fish procurement centres along the coast to procure fish directly from the artisanal fishermen. The aim is to offer the fishermen a reasonable price for their catch so that they are not exploited by middlemen. The APFC has also opened 36 sales booths and five canteens at various places in the state.From its inception in 1974 to March 1981 the APFC procured 2,014 tonne of fish of which 1,092 tonne was sold within the state and the rest to other states.
[7]

The APFC operates insulated vans to carry fish and prawns from the procurementcentresto the marketing units. Rail transport is also used to someextent. The private sector has themajor share of fish marketing. A large number of private traders, small and big, handle themarketing in a complex labour-intensive operation.
Most of the fresh fish is sold on the beach. Bargains are struck through a multitude of hawkers and small vendors, many of them women. The fish is then taken in baskets byheadload, cycles and local buses to markets and sold directly to the consumer. Ingeneral, there are no separate wholesale and retail fish markets in the coastal areas. Thefish is sold either to consumers directly or to other vendors, who in turn retail the fish inthe same or in other markets. In villages with reasonable road/rail communication links,bigger traders buy certain species of fish and send them to wholesale markets in Madras,Calcutta, etc. The bulk of the dried fish is salt-cured and/or sun-dried by local fisher-women. It is taken to the weekly shandies in the neighbouring agricultural villages andsold directly to the consumers, or to visiting vendors (many of them women) whotransport it to the inland wholesale/retail markets. The bigger wholesale/retail marketsalso sell dried fish imported from other states (Kerala, Maharashtra).
Prawns are purchased mainly by petty wholesalers who sell them to wholesalers-cum-processors. Some wholesalers have contracts with a number of fishermen for supply of prawns against interest-free loans. The price paid by these traders is usually not belowthe price the APFC pays the fishermen. During the peak season and at certain importantlanding centres, the prawn catch is bought directly by wholesalers-cum-processors ortheir agents and taken by own/hired lorry to the processing plant. After processing, theprawns are sent either directly from Andhra Pradesh or via Tamil Nadu and Kerala toforeign markets.
There is generally a large gap between the price paid by the consumer and the price paidto the fishermen. Appendix 7.2 gives an indication of marketing mark-ups betweenproducer and retail prices for some important species of fish during 1 977-78.
8. EXPORT AND IMPORT
The state’s fish exports in 1979 amounted to nearly 4% and 9% respectively of the total quantity and value of fish exported from India.
Data available for a period of eight years from 1972 shows a continuous upward trendboth in quantity and value of fish exports except for 1975 (Table 8.1).
Table 8.1
Value and quantity of fish exports, 1972-79
Year Quantity Percentage of Value Percentage of(tonne) total exports (million) total exports
from India Rs. from India
1972 202 0.53 5.00 0.861973 336 0.69 10.97 1.511974 356 0.76 10.77 1.411975 162 0.3 5.4 0.481976 1461 2.35 80.09 4.451977 2556 3.93 117.68 6.551978 3094 3.97 162.83 7.68
1979 3651 3.96 234.59 8.94
From 1 976 fish exports increased considerably and the upward trend is expected tocontinue. Frozen shrimp constituted the bulk of the products exported.
[8]
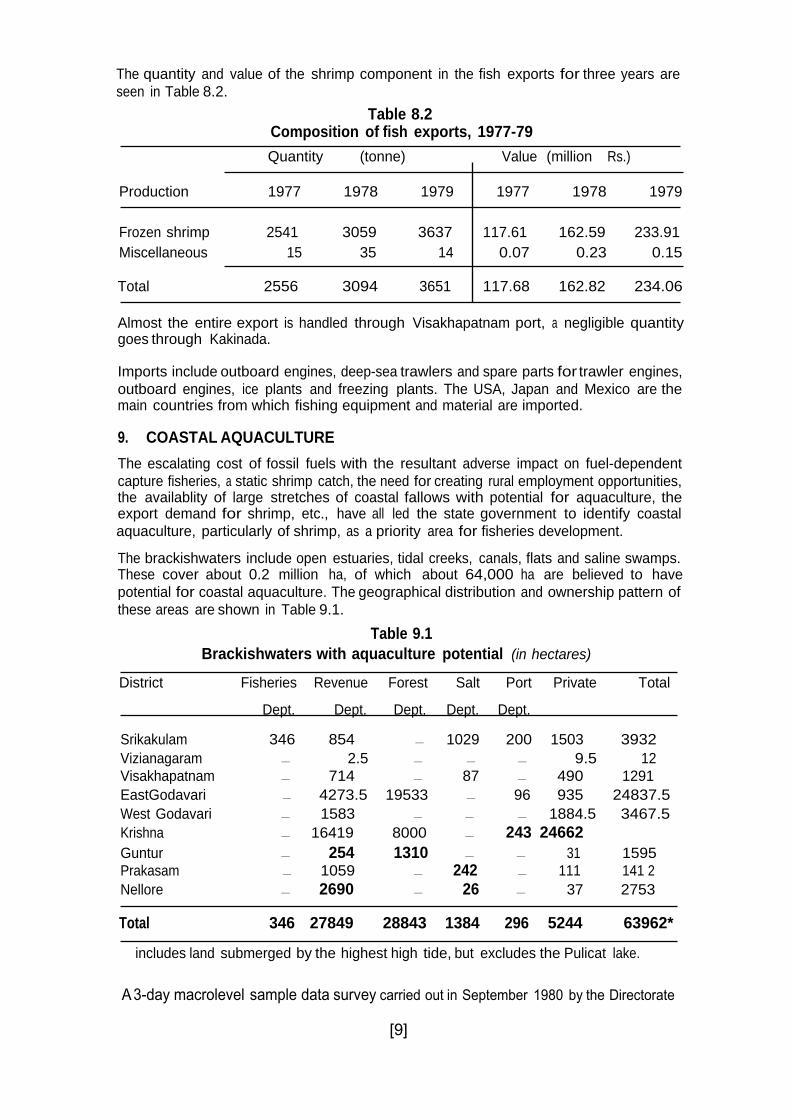
The quantity and value of the shrimp component in the fish exports for three years areseen in Table 8.2.
Table 8.2Composition of fish exports, 1977-79
Quantity (tonne) Value (million Rs.)
Production 1977 1978 1979 1977 1978 1979
Frozen shrimp 2541 3059 3637 117.61 162.59 233.91Miscellaneous 15 35 14 0.07 0.23 0.15
Total 2556 3094 3651 117.68 162.82 234.06
Almost the entire export is handled through Visakhapatnam port, a negligible quantitygoes through Kakinada.
Imports include outboard engines, deep-sea trawlers and spare parts for trawler engines,outboard engines, ice plants and freezing plants. The USA, Japan and Mexico are themain countries from which fishing equipment and material are imported.
9. COASTAL AQUACULTURE
The escalating cost of fossil fuels with the resultant adverse impact on fuel-dependentcapture fisheries, a static shrimp catch, the need for creating rural employment opportunities,the availablity of large stretches of coastal fallows with potential for aquaculture, theexport demand for shrimp, etc., have all led the state government to identify coastalaquaculture, particularly of shrimp, as a priority area for fisheries development.
The brackishwaters include open estuaries, tidal creeks, canals, flats and saline swamps.These cover about 0.2 million ha, of which about 64,000 ha are believed to havepotential for coastal aquaculture. The geographical distribution and ownership pattern ofthese areas are shown in Table 9.1.
Table 9.1Brackishwaters with aquaculture potential (in hectares)
District Fisheries Revenue Forest Salt Port Private Total
Dept. Dept. Dept. Dept. Dept.
Srikakulam 346 854 — 1029 200 1503 3932Vizianagaram — 2.5 — — — 9.5 12Visakhapatnam — 714 — 87 — 490 1291EastGodavari — 4273.5 19533 — 96 935 24837.5West Godavari — 1583 — — — 1884.5 3467.5Krishna — 16419 8000 — 243 24662Guntur — 254 1310 — — 31 1595Prakasam — 1059 — 242 — 111 141 2Nellore — 2690 — 26 — 37 2753
Total 346 27849 28843 1384 296 5244 63962*
includes land submerged by the highest high tide, but excludes the Pulicat lake.
A 3-day macrolevel sample data survey carried out in September 1980 by the Directorate
[9]

of Fisheries simultaneously in the nine coastal districts resulted in an estimate that anarea of about 17,000 ha could be immediately developed for coastal aquaculture.
The Andhra Pradesh coast is generally characterised by a low tidal amplitude which doesnot exceed 1 .6 m under normal conditions. In many areas, the tidal amplitude is lower.Srikakulam, West Godavari and East Godavari districts have a tidal amplitude of 1 .2 to1 .6 m, Krishna district up to 0.9 m, while in Nellore district it does not exceed 0.8 m.
For optimum economic operation of a brackishwater fish farm, a location which permitsthe maintenance of a water depth of about a metre in the ponds by means of tidal riseand fall alone, is desirable. In order to satisfy this requirement, the daily tidal amplitude atthe site should be in the 1-2 m range. The pond bottoms should be a little above the mean low water neap tide level permitting complete draining at any low tide. Such idealconditions of tidal fluctuation and land elevation do not exist in Andhra Pradesh. The tidalfluctuation being low, the tidal inundation on any potential site during even the spring tide ranges only from 0.07 m to 0.44 m in Krishna district, 0.08 m to 0.80 m in WestGodavari district and 0.02 m to 0.09 m in East Godavari district. Thus, construction of tide-fed ponds involves excavation of thick layers of top soil to obtain an adequate depth of tidal water in the ponds by gravitational flow. An alternative method is to use relativelylight excavation and construct a dyke surrounding an area. This will, however, involveconstant use of pumps for initial filling and subsequent replenishment of water. Both methods entail high costs and technical uncertainties.
The soil textures in Andhra Pradesh range from sandy loam to clayey loam in Srikakulam,sandy clay to silty clay in East Godavari, sandy clay to clayey loam in West Godavari andKrishna, and sandy to sandy loam in Nellore district. Clay, clayey loam and sandy claysoils are suitable for fish ponds. Suitable soil pH of 7.5 to 8.5 is found in most areas,though slightly higher and lower values are also occasionally encountered in someplaces.
In general, most of the potential sites in East Godavari district have mangrove vegetationof varying density supplying natural food and shelter to the post-larval and young shrimpand fish. In Krishna district also, mangrove vegetation is common. The shrub Avicennia isthe predominant species while Rhizophora is occasionally found. The other coastaldistricts have little or no mangrove vegetation.
A systematic quantitative survey of the seed resources as to their seasonal and geographicaloccurrence and abundance has not been made. A few localised studies, however, seemto show that the supply of seed of Penaeus monodon, P. indicus, P. merguiensis, Metapenaeus monoceros, and Mugil spp. is plentiful particularly in the low salineGodavari-Krishna estuaries. Some information on the seasonal availability of seed atKakinada obtained from the Department of Fisheries Science of the Andhra PradeshAgricultural University is given in Table 9.2
Table 9.2Shrimp/fish seed availability at Kakinada
Species Peak season
P. monodon June-SeptemberP. indicus April-June & SeptemberMetapenaeus monoceros April-May, September-Dec.Chanos chanos May, June, Aug., Dec.
Mugil cephalus November, December
Commercial seed production in hatcheries is yet to be introduced. The Central Instituteof Fisheries Education (CIFE) fish farm at Kakinada has laboratory facilities for inducedmaturation and spawning of shrimp, mainly for training purposes.
[10]

With regard to natural fish farming, the activities are still mainly publicsector experimentalactivities. At Kakinada, CIFE’s fish farm occupies an area of 7.5 ha with a 2.6 hawaterspread. Water supply and drainage are partly by gravitation, partly by pumping. Onthe basis of the results achieved in experimental work in a small water area, CIFE considers that a production rate of 20,000 kg/ha of fish and shrimp is possible. AnAndhra Pradesh Agricultural University project is reported to have produced 430 kg/haof shrimp in two crops under monoculture. Production to the extent of 1,063 kg/ha of mullet, chanos and shrimp under polyculture during a 10-month culture period at thiscentre has also been reported. The APFC has an experimental farm with 23 ponds, each1 or 1.25 ha in extent. The performance of the farm has not yet been assessed.
APFC plans to construct large-scale brackishwater farms in different districts, lease themmainly to fishery cooperatives, provide technical assistance and purchase the product.
A few individuals from Visakhapatnam, East Godavari, Ongole and Nellore districtsrecently started brackishwater fish/shrimp farms but no critical assessment of their success or failure has been attempted.
The state government’s declared policy is to use suitable state-owned coastal fallows forshrimp and fish culture, primarily through cooperatives of poor fishermen. Less suitableareas will be developed through richer classes of people who can invest capital of theirown and introduce new and improved techno!ogy.
10. SOCIO-ECONOMICS
According to the all-India census of marine fishermen conducted by CMFRI in 1980,there are nearly 84,000 active fishermen in a total fisherfolk population of about325,000.
The population is concentrated in Srikakulam, Visakhapatnam and East Godavari districts,which together account for 68% of the total. The composition and distribution of the fisherfolk population is shown in Appendix 10.1.
The fisherfolk are almost at the bottom of the social ladder. They belong to the threefishermen castes—Vadabalaji, Jallari and Aqnikulakshatriya. These are “backward classes”,and fishing is considered to be a low-status occupation.
The joint extended family pattern of the traditional Indian agricultural community nolonger exists among the Andhra Pradesh fisherfolk. The trend now is the nuclear family,i.e. husband, wife and children. The size of a household varies considerably—the averagenumber of members in a household is six. Most members of the family including thewomen generally take part in fishery activity. The women engage themselves actively insorting the catch, processing and marketing; the children mostly mend nets.
"Sangams” or associations of fishermen deal with social and religious affairs in fishingvillages. Worshippers of a particular deity meet regularly for worship and help one an-other in times of emergency or need such as death, sickness or marriage.
Tribal leadership, where the position is exclusively inherited, is still in practice among thefisherfolk communities. The caste headman with a group of elders constitutes this informal system which generally concerns itself with solving problems connected withcaste, family, marriage, divorce and other intra-village affairs. This informal systemcomplements the formal system of administration, consisting of the “panchayat” with anelected president (sarpanch) and the elected members of the council. Their activitiescentre on problems of physical infrastructure and the village’s relations in the widerpolitical and administrative set-up of the “taluk samithi” and zilla parishad. Both systemsare to some extent identical as far as members and representatives are concerned—e.g.office holders in the formal set-up are often members of the informal system.
3 [11]

Only a few fishermen own gear and/or craft. Many of them work for the gear/craftowners in return for a cash wage or a share of the catch. Earnings from fishing vary withthe type of craft and gear used and ownership status. The average income ranges fromRs. 2,500 to 3,000 per annum for a household of five members. While in the southand the north, fishing is usually the sole source of income, fisherfolk in the central area(Guntur, Krishna and Godavari districts) earn additional income from agriculture (paddy,tobacco, coconut) and salt production. A major portion of the daily income is spent onfood and liquor.
Housing in most fishing villages is similar to that of most agricultural communities orcrowded agglomerations in the outskirts of towns — of poor standard, without basicamenities. However, the housing situation is aggravated by factors like the exposure offishing villages to extreme climatic conditions (cyclones, floods) and the scarcity ofhousing sites along the coast, which lead to congested settlements where fire is aconstant threat.
The daily diet of the fisherfolk consists of coarse rice, millet and fish. People usuallysuffer from severe vitamin deficiencies. Malnutrition is common among children. This, inaddition to low hygienic standards in the villages and lack of proper water supply, is themain reason for the frequent occurrence of maladies. Medical services in the villages areeither lacking or of very poor quality.
The literacy level among the fisherfolk is low. Facilities for primary education exist;however, enrolment is low. Invariably the children do not go to school as families makethe children earn from an early age.
Feeder roads, transport facilities to nearby market towns, drinking water supply, healthservices, etc., are some of the immediate needs of fisherfolk communities.
11. FISHERIES ADMINISTRATION AND INSTITUTIONS11.1 Fisheries administration
At the state level, a Cabinet Minister is in charge of fisheries. He is assisted by a Secretaryto Government who is the administrative head of the Department of Forests and RuralDevelopment. The administrative set-up of fisheries at national and state levels is shownin Appendixi 1.1(a).
The Directorate of Fisheries, established in 1 959, is responsible for the development offisheries in the state. The department has its headquarters at Hyderabad and is headedby a director who is also the registrar of the fishermen’s cooperatives. He is assisted atheadquarters by an additional director, three joint directors, a deputy registrar of cooperatives and other technical and administrative staff.
For administrative purposes, the state is divided into six zones, viz. Guntur, Kakinada,Visakhapatnam, Nizamabad, Kurnool and Warangal. The first three are coastal zones. Sixdeputy directors coordinate and supervise fisheries activities in these regions/zones.They are assisted by 30 assistant directors posted at the district level. Fisheries inspectorsand extension officers assist the assistant directors. Fisheries extension officers work atthe block level. Though there are 324 blocks in the state, extension officers have beenassigned only in 51 blocks.
The total personnel strength of the directorate is 1,120, of which 109 are posted at theheadquarters. An organisational chart of the Directorate is set out in Appendix 11 .1(b).
The directorate of fisheries extends its development support to the following areas
harbour development; mechanisation of craft; manufacture and supply of gear; processingand marketing; inland fisheries and coastal aquaculture; credit and cooperatives; educationand training and integrated fisheries development in particular regions.
[12]

11.2 Research and development institutions
The Central Marine Fisheries Research Institute has research centres at Waltair andKakinada,which were established in 1956. They are engaged in the study of the biologyof commercially important species, demersal fish, hydrology of inshore waters and thetagging of catfish.
The Visakhapatnam base of the Exploratory Fisheries Project (EFP), which is centrallysponsored, conducts experimental fishing in the offshore waters off the Visakhapatnamcoast.
The Kakinada unit of the Central Institute of Fisheries Technology (CIFT) evaluates gear designs and is also concerned with post-harvest technology, including product develop-ment.
The following ICAR units operate in Andhra Pradesh — the prawn breeding unit atKakinada working on the possibilities of breeding freshwater prawn in confined waters;the prawn culture unit at Tadepalligudam (West Godavari) for culture of Macrobrachiumrosenbergii; the coordinated project on composite fish culture at Badampudi for polycultureof katla, rohu, mrigala, silver carp and grass carp; the coordinated research sub-stationfor reservoirs at Nagarjunasagar (Guntur).
The brackishwater fish farm, Kakinada, was originally established in 1 976 under thestate government and was partly financed by ICAR. It has now been transferred to theAgricultural University for polyculture and monoculture of shrimp and finfish.
A freshwater biological research station of the Agricultural University, Rajendranagar (Hyderabad), has its headquarters at Kakinada.
11.3 Training institutions
The Central Fisheries Extension Training Centre, Hyderabad, of the Central Institute of Fisheries Education (CIFE) was established in 1973. The centre conducts a 10-monthcourse (June-March) every year for 25 in-service personnel selected from various statefisheries departments. Trainees from other developing countries are also accommodated.The areas of training include extension techniques and methods, fish farm engineering and fish culture. A wide range of audio-visual equipment/methods is used in teaching.The professional staff consists of a principal, two lecturers, four senior instructors andseven junior instructors.
The CIFE operates a fish farm at Balabhadrapuram (East Godavari) to provide training incarp breeding. The institute also operates a brackishwater fish farm at Kakinada whichaims at developing new techniques for brackishwater fish farming, besides trainingfisheries officers and private fish farmers.
The Fish Farmers Development Agency, Government of India, has two fish culturedemonstration units, one each in Karimnagar and Kurnool districts. Established in 1 979,they aim at spreading fish culture practices among the fishermen.
The Fisheries Training Institute of the A.R fisheries directorate at Kakinada was establishedin 1958. It conducts 1 2-month courses in fishing methods, gear technology, elementaryprinciples of navigation, and the operation and maintenance of internal combustionengines for fishermen who have studied up to the seventh standard in school and havefive years of seagoing experience. Seventy-five candidates, mostly from the coastaldistricts, are enrolled in each batch of trainees. Till 1 978, more than 700 fishermen hadbeen trained in this institute. Trained candidates are given preference in the allocation ofmechanised boats.
The Fisheries Training Institute of the fisheries directorate at Machilipatnam was establishedin 1979. The annual enrolment capacity is 20.
[13]

12. INDUSTRY ORGANISATION
12.1 Fisheries Corporations
The APFC was established in 1974 under the Companies Act (1 956) with headquarters at Kakinada. It took over the industrial activities of the fisheries department and has itsheadquarters at Visakhapatnam. It has an authorised capital of Rs. 30 million and a paid-up share capital of Rs.10.1 million. All the shares are owned by the Andhra PradeshGovernment. It currently has more than 500 employees.
A Member of Parliament representing the state is appointed chairman of the corporation.There are a vice chairman-cum-managing director and a chief general manager. whobelong to the Indian Administrative Service. There are five main technical divisions —
trawler operations, boat-building, marketing, aquaculture and engineering, each headedby either a general manager or a deputy general manager. There are separate wings forpersonnel management, administration and finance. An organisation chart is provided inAppendix 12.1
The main activities of the corporation are: boat building, shrimp processing and export;deep-sea fishing; organisation and expansion of internal marketing; brackishwater fishfarming; freshwater fish farming; diversification of fishery products; supply of inputs —
high-speed diesel oil, outboard motors, ice, etc.
The boatbuilding yard and the ice and freezing plants at Visakhapatnam account forabout 70% of the APFC staff. Its fishing fleet consists of two Mexican type refrigeratedtrawlers. The APFC also operates a brackishwater fish farm at Kakinada.
Infrastructure and fish processing facilities established by the Corporation are referredto in sections 4 & 6.
Between July 1976 and March 1981, the Corporation exported 1 ,400 tonne of frozen shrimp valued at about Rs.75.2 million.
12.2 Fisheries cooperative societies
The formation of fishermen’s cooperative societies in Andhra Pradesh dates back to the days before Indian independence, but it was in the 1 96Os and 1 970s that most of the existing cooperatives were established.
In 1 960, a central society for the Andhra region known as the Andhra Fishermen Central Cooperative Society (AFCCS) Ltd. was registered, with headquarters at Chirala. Theheadquarters is now at Kakinada. The Collector of East Godavari is the chairman of the society and a joint director of fisheries is the managing director. The society covers allthe districts of coastal Andhra and Rayalaseema. Its membership and share capital areshown in Table 1 2.2.
Table 12.2: Membership and share capital of AFCCS Ltd, 1979/80
No. of members Share capital (Rs.)
Government of Andhra Pradesh 1 1 ,052,000
Institutional members, i.e. primaryfishermen cooperative societies 387 44,975
Individual members associated withfisheries activities 343 8,600
[14]

The main functions of the primary fishermen’s cooperative societies are to
— obtain bank loans for members to purchase improved fishing gear and craft;— market the catch of the fishermen on better terms, i.e. bypassing the private fish
merchants;
— deal in fishing requisites, spare parts, diesel oil, etc.;— provide consumer goods to the members at a low price;
— generally improve the socio-economic conditions of the fisherfolk.
To further the above objectives, the central society supplies items of fishery requisitessuch as nylon yarn, rope, floats, steel wire ropes, engine spares, etc., to fishermenmembers. These are exempt from sales tax. It also engages in activities such as theoperation of a high-speed diesel supply point at the Kakinada harbour; operation of ashark-liver oil extraction and refining plant and vitamin capsule factory at Kakinada; andthe implementation of a scheme to distribute 4510 m mechanised boats and 50 navas to fishermen. Other ongoing or proposed activities include the operation of an oil bowser,fish carrier transport, construction of a godown, and establishment of brackishwater fishfarms.
Most of the primary cooperative societies concentrate on obtaining loans — for thepurchase of yarn and twine to fabricate nets, for the purchase of fishing craft. (There arevarious loan schemes in operation in the state).
13. GOVERNMENT POLICY
The policy of the government is to accelerate the exploitation of existing resources byimproving the available facilities, creating new facilities and taking proper care of allclasses of people earning their livelihood from the fishery sector.
Besides aiming at higher production, it is also the government’s policy to ensureproducers good prices for their fish. Accordingly, much attention is being paid toimprove the internal marketing system and fish landing and other infrastructure facilities.
The government’s strategy in the marine sector to achieve higher production targets is toestablish new fishing harbours; expand the mechanised fishing fleet for coastal fishing;introduce more deep-sea trawlers; diversify fishing techniques; and assist traditionalfishermen by providing subsidies for fishing craft, nylon twine and other fishing implements.In the inland fresh waters, the strategy is to accelerate carp seed production; establishnew fish seed farms; and augment fish production in reservoirs and tanks.
In coastal aquaculture, the strategy is the phased conversion of suitable brackishwaterareas into shrimp and fish farms, particularly through the poorer sections of the coastalpopulation.
The major steps taken so far to develop marine fisheries have been the introduction offishing boats of improved design, motorisation of traditional country craft with outboardengines, establishment of fish harbours, boatyards, and processing and preservationfacilities.
14. DEVELOPMENT PLANS
Development plans are prepared for five-year periods. The current five-year plan is the
sixth running from 1980/81 to 1984/85.
The detailed budgeting of proposed development schemes is made in annual plans for
those schemes selected for financing from the five-year plan.
The main activities undertaken during the past plan periods and the plan-wise financialallocations and expenditures are shown in Appendix 14.1.

The Sixth Five-Year Plan aims at increasing total fish production to 281 ,500 tonne by thelast year of the plan. The contribution of marine fisheries to this target would be1 34,000 tonne, the remainder coming from the inland fisheries including aquaculture infreshwaters and brackishwaters.
Appendix 14.2 lists the sixth five-year plan schemes with their allocations.
Institutional financing agencies have been playing an important role in the developmentplans. They provide assistance to fishermen in the form of credit. The following are someof these agencies : Agricultural Refinance Development Corporation (ARDC), National Cooperative Development Corporation (NCDC), Integrated Rural Development Programme(IRDP), Drought Prone Area Programme (DPAP), Small Farmers Development Agency (SFDA), Scheduled Castes and Backward Castes Committee (SC & BC), and commercialbanks.
15. BIBLIOGRAPHY
1. Bureau of Economics & Statistics, Government of India : Handbook of Statistics,Andhra Pradesh 1978/79, Hyderabad 1979.
2. Central Marine Fisheries Research Institute : All India Marine Fisheries CensusFrame Survey 1973-77. Marine Fisheries Information Service, No. 3, Cochin 1978.
3. Central Marine Fisheries Research Institute: Trends in total marine fish productionin India. Marine Fisheries Information Service, No.22, Cochin 1979.
4. Central Marine Fisheries Research Institute: Industrial Fisheries off Visakhapatnamcoast based on exploratory surveys during 1972-78. Marine Fisheries Information Service, No. 15,Cochin 1980.
5. Directorate of Fisheries, Government of Andhra Pradesh, Hyderabad: Handbookof Fisheries Statistics, Andhra Pradesh 1980.
6. Disney, J.G., J.R. Shaw, D.G. Pagan and J. Graham: A feasibility study of afisheries development project in India. Part A — summary, conclusions and recom-mendations. Tropical Products Institute, Ministry of Overseas Development, London1978.
7. Disney, J. G., J. R. Shaw, D. G. Pagan andJ. Graham : A feasibility study of a fisheriesdevelopment project in India. Part B — Andhra Pradesh Fisheries Corporation : Fishmarketing. Tropical Products Institute, Ministry of Overseas Development, London1978.
8. Department of Fisheries, Government of Andhra Pradesh: Draft Sixth Five-YearPlan, 1980/81 — 1984/85. Hyderabad 1980.
9. Exploratory Fisheries Project: Government of India : Area-wise, depth-wise andmonth-wise abundance of six important varieties of fishes in waters north and southoff Visakhapatnam, Exploratory Fisheries Project Newsletter Vol. Il, No.1, Bombay1979.
10. Ministry of Information and Broadcasting, Government of India : India, a referenceannual. Publications Division, New Delhi 1979.
11. Ministry of Agriculture, Government of India: Handbook of Fisheries Statistics,New Delhi 1981.
12. Rao, V. V. & Rajkumar, S.A. : Area-wise, depth-wise and month-wise abundance ofsix important varieties of fishes in waters north and south off Visakhapatnam.Exploratory Fisheries Project Newsletter Vol. II, No.1, Bombay 1979.
[16]

13. Menon, T.R. : Inventory of kattumarams and their fishing gear in Andhra Pradeshand Tamil Nadu, BOBP/WP/2, FAO, Madras 1981.
14. Williams P.P. Present status of small-scale (traditional) fisheries in Andhra Pradesh.In (Ed. E.G. Silas) “Present status of small-scale fisheries in India, Cochin 1978.”
APPENDIX- 1.1AN ADMINISTRATIVE CUM COASTAL
MAP OF ANDHRA PRADESH
DISTRICTS DISTRICT HEADQUARTERS
I SRIKAKULAM DISTRICT SRIKAK U L AM2 VISAKHAPATNAM DISTRICT VISAKHAPATN AM3 EAST GODAVARI DISTRICT KAKINADA4 WEST GODAVARI DISTRICT ELURU5 KHAMMAM DISTRICT KHAMMAM6 WARANGAL DISTRICT WARAN GAL7 ADILABAD DISTRICT ADILABAD8 KARIMNAGAR DISTRICT KARIMNAGAR9 NIZAMABAD DISTRICT N IZAMABAD10 MEDAK DISTRICT SANGAREODI11 HYDERABAD DISTRICT HYDERABAD12 NALGONDA DISTRICT NALGONDA13 MAHBUBNAGAR DISTRICT MAHBUBNAGAR14 GUNTUR DISTRICT OUNTUR15 KRISHNA DISTRICT MACHILIPATNAM6 PRAKASAM DISTRICT ONGOLE
17 KURNOOL DISTRICT KURNOOL18 ANANTAPUR DISTRICT ANA NTA PUR19 CUDDAPAH DISTRICT C UPDAPA H20 MEL LORE DISTRICT NELLORE21 CHITTOOR DISTRICT CHITTOOR
NOTE TWO NEWLY FORMED DISTRICTS HAVE NOT BEEN SHOWN
[17]

Appendix 1.2 STATE DATA
Andhra Pradesh India
1. Size: Area Districts
277,000 km2
23(8.4%)
Revenue taluks 308Revenue villages 27,221Coastline 942 km (12.5%)Continental shelf (200 m
depth) 31,044 km2 (7.5%) 2. Population: Total (1981 census) 53,592,605 (7.81%)
Urban 23.25 % N.A.Rural 76.75 % N.A.Density per km2 195 221 Growth rate (1971-81) 23.19% 24.75%
Birth rate (1979) perthousand
Rural 32.4 34.3Urban 28.9 27.8
Death rate (1979) perthousand
Rural 13.7 13.9Urban 8.0 8.2
Infant mortality (1977) perthousand
Rural 134.7
Urban 61.6130(1978)
Life expectancy (1976-81)Male 51.5 46.4
Female 51 .0(1960-70)
44.7
3. Education : Literacy rate (1 981)Total 29.72% 36.17%Male 39.03 % 46.74%Female 20.18% 24.88%
* Figures in this column give state share (%) of all-India or all-India figures as applicable.
School enrolment : Level Age group Age group as percentageof population
Andhra Pradesh India(1969/70) (1979/80)
PrimarySchool 6-11 45.7 84.01 MiddleSchool 11-14 30.5 39.07SecondarySchool 14-17 34.1 16.09College/University 17-24 2.4 4.41
[18]

4. Health Population per doctor 12825 (1980/81) 3700 (1978/79) (allopathic) Population per hospital bed 2153 (1978/79) 1200
5. Nutrition : Caloric intake as % of 78 77.8requirement (2,000 cal/day)Per capita protein intake 40 gm/day 40-52 gm/day (60 gm/day)
6. Employment: Population by category of workers (1971)
% of total population % of total workers
Category Andhra India Andhra India
Pradesh Pradesh
1. TotalWorkers 41.4 32.9 100 100
i. Cultivators 13.3 14.3 32.3 43.3 ii. Agricultural labourers 1 5.7 8.6 37.9 26.3 iii. Livestock, forestry, fishing, 1.4 0.8 3.3 2.4
hunting, plantations, orchards
iv. Mining and quarrying 0.2 0.2 0.5 0.5 v. Manufacturing, processing, 3.7 3.1 9.1 9.5
service, repairsvi. Construction 0.7 0.4 1 .6 1 .2vii. Trade and commerce 2.3 1 .8 5.4 5.6 viii. Transport, storage, and 0.9 0.8 2.2 2.5
communicationsix. Other services 3.2 2.9 7.8 8.7
2. Non-Workers 58.6 67.1 — —
7. Net (State) Product (1978/79)
NNP at constant 1970/7 1 prices (As. million) 33526NNP at current prices (Rs.million) 53608NNP per capita at constant 1970/7 1 price (As.) 677.58NNP per capita at current prices (Rs.) .1 083.41
8. TradeExports (1978-79)
Commodities Value % of each commodity‘000 Rs. in total
1. Iron ore 754,895 37.282. Manganese ore 58,526 2.893. Ferro products 89,890 4.434. Pig iron 7,263 0.365. Steelrails 146,175 7.226. Steel billets 115,008 5.687. Other manufactures of iron and
steel materials 128,620 6.358. Alumina 76,403 3.77
[19]

9. Myrobalan 2,272 0.1110. Wheat 133,746 6.6011. Sugar 317,445 15.6812. Shrimp 191,705 9.4713. Others 3,150 0.16
Total export value 2,025,098 100.00
Source.: Statistical Bulletin 1978-79Research and Planning Department, VisakhapatnamPort Trust, VisakhapatnamData relate to exports through Visakhapatnam Port onlyExport data in respect of minor ports are not available.
Imports (1978-79)
Commodities Value % of each commodity
000 Rs. in total 1. Urea 413,578 10.902. Ammonium sulphate 48,498 1.283. Diammonium phosphate 93,041 2.454. Calcium ammonium nitrate 11 ,51 1 0.305. Muriate of potash 39,816 1 .056. Ammonium nitrate 1,151 0.037. Sulphur 62,080 1 .638. Rock phosphate 90,363 2.389. Zinc concentrate 87,712 4.01
10. Cooking coal 34,427 0.9111. Total petroleum and petroleum
products 1,844,660 48.6012. Manufactures of iron and steel
including machinery 590,695 15.5613. Electrical goods 68,085 1.7914. Refractories 21,204 0.5615. Magnesium clinker 11 ,021 0.2916. Cement 146,605 3.8617. Edible oils 201,046 5.3018. Others 30,099 0.80
Total imports 3,795,592
Source: Statistical Bulletin 1978-79 Research and Planning Department, VisakhapatnamPort Trust, VisakhapatnamData relate to imports through Visakhapatnam Port only Import data in respect of minor ports are not available.
[20]

APPENDIX-2 1
ANDHRA PRADESH COASTAL DISTRICTSAND THE CONTINENTAL SHELF
COASTAL DISTRICTS*
SRIKAKULAM DISTRICT
VISAXHAPATNAM DISTRICT
EAST GODAVARI DISTRICT
WEST GODAVARI DISTRICT
KRISHNA DISTRICT
GUNTUR DISTRICT
PRAKASAM DISTRICT
NELLORE DISTRICT
THE RECENTLY FORMED VIJAYANAGARAMDISTRICT IS NOT SHOWN IN THE MAP
[21]
Appendix 3.1 Distribution of traditional marine fishing craft owned/shared by fishermen
DISTRICTS
Type Srika- Vijaya- Visakha- East West Krishna Guntur Prakasam Nellore Totalkulam nagaram patnam Godavari Godavari
Plank-built boats 898 634 2,180 5,387 144 1,226 828 14 48 11,359
Dugout canoes 285 6 123 599 99 5 159 291 214 1,781Kattumarams 7,555 370 5,163 2,340 — 1 323 3,694 2,752 22,198
Others 2 1 108 218 17 2 11 192 124 675
Total 8,740 1,011 7,574 8,544 260 1,234 1,321 4,191 3,138 36,013
Source : Marine Fisheries Information Service (August 1 981)
Appendix 3.2 Distribution of mochanised fishing craft owned/shared by fishermen
DISTRICTS
Type Srika- Vijaya- Visakha- East West Krishna Guntur Prakasam Nellore Totalkulam nagaram patnam Godavari Godavari
Trawlers — — 1
Gillnetters — — —
Total — — 1
113 — 60 273 — — 447
1 — — 8 — — 9
114 — 60 281 — 456
Source : Marine Fisheries Information Service (August 1981)

Appendix 3.3 Distribution of fishing gear owned/shared by fishermen
— DISTRICTS
Type Srika-kulam
Vijaya-nagaram
Visakha-patnam
EastGodavari
WestGodavari
Krishna Guntur Prakasam Nellore Total
Trawl net — 128 —
Drift/gillnet 13,060 1,570 10,818
Boat seine 2,821 592 2,648Fixed bag net 830 — 288Hooks and lines 4,769 974 2,871
Shore seines 926 245 907
Traps — — 125
Scoop nets 55 43 276Others 3,828 537 2,450
367 1 130 197 — — 8235,753 164 1,344 1,510 3,448 4,718 42,385
1,953 58 — 46 949 671 9,7384,412 98 4,181 2,862 413 1,533 14,617
341 — 302 50 1,164 281 10,752
284 21 24 201 281 153 3,042
— — 5 — — — 130
1 .380 2 921 3 19 226 2,9259,128 5,490 5,485 3,233 4,628 2,420 37,199
Source : Marine Fisheries Information Service (August 1981)
Appendix 3.4 Economics of operation of a 10 m mechanised boat
Base: Visakhapatnam
1 General Information
1.1 Length 10 m 1.2 Fish carrying capacity 3 tonne 1.3 Crew number 6
1 .4 Type of fishing Trawling
2 Operational Schedule
2.1 Numberoftripsperyear 250
2.2 Number of days per trip less than 1 2.3 Number of fishing hours/day 6 hrs
2.4 Total fishing hours/year 1500 hrs
2.5 Total steaming hours/year 2750 hrs
3 Investment Rs. P.
3.1 Hull with winch including all taxes 108,000.00
3.2 Engine54hp 81,500.00Excise duty 2,338.00
Sales tax 4,367.99
Surcharge on sales tax
Total of 3.2 88,205.99
3.3 Trawls (2 nos) 4,000.00
3 4 Operational capital 4,000.00
3.5 Total investment 204,205.99
4 Operating costs (Rupees)
4.1 Wages of crew per year 30,570.00
4.2 Cost of HSD oil (engine working for 11 hrs/day,
for 250 days at 8.1 lit/hr. at 3.18/lit) 70,835.004 3 Engine oil (250 days at Rs. 14/lit/year), 3,500.00
44 Grease (Rs.10/ day for 250 days) 2,500.004 5 Maintenance of gear per annum 400.00
4 6 Maintenance of craft per annum 2,000.004.7 Maintenance of engine per annum at 10% of cost 8,820.00
4 8 Insurance 6,650.004.9 Interest on operating capital 400.00
4.10 i) Depreciation on hull at 10% 10,800.00
ii) Depreciation on engine at 10% 8,820 00
[24]
iii) Depreciation on gear at 50% 2,000.00
4.11 Other operating costs: 147,475.00
i) Commission on sale
ii) Registration fees (renewal) 1 50.00
iii) Wharfage 226.00
iv) Ice 4000.00
v) Spares for engine and hull repairs 5,000.00
vi) Other sundry expenses 2,000.00
Total of 4.11 11,376.00
4.12 Total operating costs 1 ,58,671 .00
5 Annual Income
a) Shrimp Grade I (1 340 kg) at Rs.70/kg 93 800.00
Grade II (2250 kg) at Rs.40/kg 90,000.00
Grade III (1610 kg) at Rs.5/kg 80 5000
1,91,850 00
b) Fish Grade I (504 kg) at Rs.2/kg 1,008.00
Grade II (2020 kg) at Rs.1 /kg 2,020.00
Grade III (47,900 kg) at Rs.0.50/kg 23,950.00
26,978.00
Gross annual income 2,18,828.00
Net annual income
60,157.00
Source: Handbook of Fisheries Statistics, Andhra Pradesh, 1980.
Appendix 4.1 Distribution of freezing, frozen storage and ice-making facilitiesin the coastal districts
Freezing capacity Frozen storage Ice productionDistricts (tonne) capacity (tonne) tonne/day
Private Public Private Public Private Publicsector sector sector sector sector sector
Srikakulam 30 — — — — —
Visakhapatnam 71 5 1770 100 196 20
East Godavari 19 2.7 600 50 81.5 10
West Godavari — — — 10 81.5 6
Krishna — — — — 100 —
Guntur — — — 10 36 5
Prakasam — — — — 20 —
Nellore 20 10 — 20 27 —
Total 140 17.7 2370 190 542 41
Grand total 157.7 2560 583
Source : Directorate of Fisheries
Appendix 5.1 Fish landings in Andhra Pradesh,1970-80 (In tonne)
Year Marine Inland Total
1970 74,459 85,691 160,1501971 84,010 88,320 172,330
1972 84,480 94,081 178,561
1973 99,544 89,613 189,157
1974 158,818 99,733 258,551
1975 155,638 94,943 250,581
1976 131,321 104,339 235,660
1977 100,756 119,013 219,769
1978 82,116 119,850 201,966
1979 91,426 116,566 207,992
1980 116,013 121,893 237,906
[26]
Appendix 5.2 Composition of marine fish landings 1972-1979 (in tonne)
SI:No. Name of fish 1972 1973 1974 1975 1976 1977 1978 1979
1. Elasmobranchs 7400 8354 11394 9977 6688 2. Eels 110 270 451 1837 2053. Catfish 3651 10780 15890 9824 61314. Chirocentrus 2248 2635 2281 2920 18375. a. Oil sardine — 125 564 131 112
b. Lesser sardines 7587 11928 31520 32994 23220c. Hilsa ilisha 220 45 — 70 280d. Other Hilsa 3087 2783 2347 930 1815e. Anchoviella 2005 4865 9869 7037 11309f. Thrissocles 1111 2486 1895 1776 1763 g. Otherclupeids 8892 9184 10195 7536 8410
6. a. Harpodon nehereus 297 221 125 359 214 b. Saurida & Saurus 504 386 267 242 166
7. Hemirhamphus&Belone 17 3 194 24 148. Flying Fish 52 105 2 1 —
9. Perches 1485 1470 2213 4888 175110. Red Mullets 447 220 305 721 55311. Polynemids 2185 1393 2231 1836 1813 12. Sciaenids 7277 7576 12358 11682 1089113. Ribbonfish 3585 3761 11834 11701 1244314. a. Caranx 2425 2589 2901 3498 3047
b. Chorinemus 552 1056 1620 1790 1820c. Trachynotus 6 1
d. Other carangids 6 5e. Coryphaena 106 36 101 251 89f. Elacate 38 56 2 25 14
6450 8704 6994 438 1082 245
5662 3281 37991217 1262 976
— —
10972 7685 6180 41 2 78
1654 1349 10928947 7810 58881398 1824 34332363 1794 2518960 1099 717875 1057 1379135 60 100 84 65 71
2727 1945 3095315 335 426 698 1075 1412
10182 5597 88258546 5505 6337 4003 2000 3185
530 665 444 —
78 87 56 137 24 7
7 53 —

15. a. Leiognathus 2971 2806 4830 11268 3876 5903 2174 3585b. Gazza 1 3 12 101 48 — — —
16. Lactarius 1396 982 1914 2513 1718 1132 684 94517. Pomfret 4165 4087 3945 5697 4088 2529 2445 206918. Mackerel 5396 2519 1734 1593 2084 1040 2520 262119. Seerfish 5830 4054 4438 5277 3412 3261 2600 554720. Tunnies 495 141 683 664 334 449 328 43721. Sphyraena 88 18 19 119 187 108 43 6222. Mugil 118 255 1848 954 892 170 237 15923. Bregmaceros24. Soles 21 5 187 220 305 56 680 347 610
25. a. Penaeid prawns 5145 8170 9857 7152 8833 6266 8031 8697b. Non-penaeid prawns 437 669 2842 3523 2275 5109 1532 3117c. Lobsters 102 3 2 20 33d. Crabs & other crustaceans 279 364 934 605 329 719 477 1109
26. Cephalopods 67 61 165 151 242 408 297 52327. Miscellaneous 2596 2901 4818 3552 8353 4561 6021 4655
Total 84480 99544 158818 155638 131321 100756 82116 91426
Source : Central Marine Fisheries Research Institute.

Appendix 5.3 Landings of selected fish species by months (1977) (in tonne)
Species Jan Feb Mar Apr May June July Aug Sep Oct Nov Dec Total
Elasmobranchs
Catfish
Non-oil sardinesAnchoviellaMiscellaneous
clupeids
Sciaenids
Ribbon fish
Leiognathus
Pomfrets
Mackerel
Seer fish
Perches
Polynemids
Penaeidshrimps
Allotherspecies
Total
651 372 345 733 649 782 910 652 501 433 94 328 6,450
319 789 560 251 881 392 776 287 352 287 428 340 5,662
1093 440 1813 1566 1125 628 612 171 402 416 1154 1552 10,972187 441 3797 2514 51 655 91 74 182 81 88 786 8,947
320 267 116 170 150 207 317 78 342 95 187 114 2,363
438 584 1461 1151 2581 857 939 530 417 393 377 454 10,182
130 192 1107 830 1015 429 1174 703 1990 206 147 623 8,546
202 1294 1202 1233 408 216 298 342 288 74 130 216 5,903
424 88 502 389 178 128 262 277 75 42 58 106 2,529
78 104 205 209 166 11 5 14 12 6 5 124 2 1,040
534 203 , 506 180 163 202 829 154 167 67 158 98 3,261 450 287 514 360 233 87 54 219 48 34 201 240 2,727
158 110 79 101 24 18 48 23 12 25 51 49 698
223 360 793 568 212 914 318 541 177 270 184 223 4,783
2104 2502 3408 8319 1268 2231 3644 2465 1327 2010 1637 1778 26,693
7311 8033 16408 12574 9104 7861 10286 6528 6286 4438 5018 6909 100,756
Appendix 5.4 Some important commercial marine fish species of Andhra Pradesh
SI. No. English name Scientific name Telugu/local name
1. Whitepomfret Stromateus Tellachanduva 2. Blackpomfret S.niger Nallachanduva 3. Seer Scomberomorous Konema
commersoni4. Seer S. guttatum Vanjaram5. Sardine Sardinella longiceps Kavallu6. Rainbow sardine Kowala koval Morava7. Anchovy Thrissocles sp. Poorava8. Whitebait Anchoviella sp. Nethallu9. Hilsa Hilsa ilisha Killalu
10. Thread fin Polynemus sp. Maga11. Ribbon fish Trichiurus sp. Savallu1 2. Catfish Tachysurus sp. JelIa1 3. Mackerel Rastrelliger kanagurta Kanagarthalu1 4. White fish Lactarius Sadumi1 5. Jewfish Sciaenids Gorasa or Goraka1 6. Perch Saranus sp. Chamallu
Lutjanus sp. Kataili17. Horse mackerel Carangids Para18. Silver belly Leiognathus Kara19. Seabass Lates calcarifer Pandugoppa20. Milk fish Chanos chanos Palabontha21. Bombay duck Harpodon nehereus Vanamattalu22. Shark Scoliodon sp. Sora23. Saw-fish Pristis Yalla24. Skate Rhinobatis Ulava25. Ray Dasyatis sp. Teki, Belugiri, Tenku26. Crab Neptunus, etc. Peetha27. Shrimp Metapenaeus brevicornis Royyalu
M. dobsoniiM. monocerosPenaeus spp.Acetes spp.
[30]

Appendix 7.1 Demand for marine fish (1977)
Demand in 78 Demand inSpecies selected urban all urban
centres (t) centres (t)
Pomfret 6,259 7,510
Seer 3,495 4,193Polynemus 2,992 3,590
Jewfish 1,387 1,664
Lates 1,435 1,721
Catfish 3,144 3,652
Chanos 725 870
Lacanius 1 ,008 1 ,209
Mullet 2,261 2,713
Mackerel 2,498 2,997Rock cod 692 830
Source: Consumer preference and demand survey for fish in Andhra Pradesh, 1977,conducted by CARD, Administrative Staff College of India, Hyderabad.
[31]

Appendix 7.2 Comparison of fish prices at various levels (1977-78)
Species Producer
priceRs/kg
Wholesale
priceRs/kg
Guntur Hyderabad
Retail
Madras
price Rs/kg
Calcutta Rourkela Kharagpur
Averageretail
priceRs/kg
Retailprice in %
of produ-cer price
Lates 2.50 2.70 3.20 4.50 4.50 6.00 5.50 5.50 4.90 196
Polynemus 2.25 2.50 3.00 3.75 3.75 5.25 4.75 4.75 4.20 187
Seer 2.25 2.50 3.00 3.75 3.75 5.25 4.75 4.75 4.20 187Pomfret 2.50 2.75 3.25 4.00 4.00 5.50 5.00 5.00 4.50 180
Lactarius 2.00 2.25 3.00 3.50 3.50 5.00 4.50 4.50 4.00 200
Jewfish 2.00 2.25 2.75 3.00 3.00 4.50 4.00 4.00 3.50 175Eels 1.50 1.75 2.50 3.00 3.00 4.50 4.00 4.00 3.50 233
Mugils 1 .75 2.00 2.50 3.25 3.25 4.75 4.25 4.25 3.70 211
Clupeids 0.80 1.00 2.25 2.50 2.50 3.75 3.75 3.25 3.00 375
Sharks and rays 0.40 0.60 1 .50 2.00 2.00 3.50 3.25 3.25 2.60 650Bombayduck 0.40 0.60 1.25 1.50 1.50 3.00 2.50 2.50 2.00 500

Appendix 10.1 Fisherfolk population (1980)DISTRICTS
Item Srika- Vijaya- Visakha- East West Krishna Guntur Prakasam Nellore Totalkulam nagaram patnam Godavari Godavari
No. of fishing villages 105 16 62 84 14 28 22 60 62 453
No. of landing centres 86 15 50 75 10 26 9 52 56 379No. of fisherman households 16,026 2,195 11,472 20,045 2,328 4,658 3,960 6,939 5,379 72,862Fishermenpopulation:Male 21,362 3,694 17,661 25,812 2,822 5,921 4,892 8,777 6,423 97,364
Female 23,291 2,953 17,515 24,957 2,919 5,588 4,624 8,325 6,287 96,459
Children 31,577 4,456 24,969 34,442 3,399 6,945 6,337 11,373 8,983 132,481Total 76,230 11,103 60,145 85,211 9,140 18,454 15,853 28,475 21,693 326,304
Educational statusPrimary 5,974 97 2,004 5,432 1,253 1,285 1,167 1,721 1,453 20,386
Secondary 1,779 4 239 683 165 220 176 226 70 3,562Above Secondary 201 — 20 75 34 25 21 50 3 429Total 7,954 101 2,263 6,190 1,452 1,530 1,364 1,997 1,526 24,377
No. of fishermen engaged
in actual fishingFulltime 12,279 3,164 14,716 20,368 1,798 4,125 3,570 7,273 6,213 73,506
Parttime 427 294 500 1,643 316 569 994 146 21 4,910
Occasional 1,400 143 834 997 416 796 473 384 44 5,487
Total 14,106 3,601 16,050 23,008 2,530 5,490 5,037 7,803 6,278 83,903
Source : Marine Fisheries Information Service.

APPENDIX -11.1(a) APPENDIX -11.1(a)
FISHERIES IN NATIONAL AND STATE ADMINISTRATIONS FISHERIES IN NATIONAL AND STATE ADMINISTRATIONS
GOVERNMENT OF INDIAGOVERNMENT OF INDIA
MINISTRY OF AGRICULTUREMINISTRY OF AGRICULTURE
DEPARTMENT OF AGRICULTURE & COOPERATIONDEPARTMENT OF AGRICULTURE & COOPERATION
GOVERNMENT OF ANDHRA PRADESH GOVERNMENT OF ANDHRA PRADESH
FISHERIES DIVISIONFISHERIES DIVISION
MINISTER OF FISHERIES AND SERICULTUREMINISTER OF FISHERIES AND SERICULTURE
DEPARTMENT OF FORESTS AND RURAL DEVELOPMENT DEPARTMENT OF FORESTS AND RURAL DEVELOPMENT
DIRECTORATE OF FISHERIESDIRECTORATE OF FISHERIES

ADMINISTRATIVE SET—UP OF DIRECTORATE OF FISHERIESDIRECTOR
ADDL.DIRECTOR
ZONES ASST. DIRECTORS
APPENDIX -11.1(b)
i VISAKHAPATNAM VISAKHAPATNAM,SRIKAKULAM,VIJAYANAGARAM (3)ii KAKINADA RAJAHMUNDRY, KAKINADA ,ELU RU MACHILIPATNAM (4)III GUNTUR GUNTUR,ONGOLE,NELLORE (3)iv KURNOOL KURNOOL,ANANTAPUR ,CHITTOOR,CUDAPPAH,NANDYAL (5)v WARANGAL WARANGAL ,KHAMMAM, KARIMNAGAR, ADILABAD (4)vi HYDERABAD NIZAMABAD,HYDERABAD,MAH BUBNAGAR,MEDAK,NALGONDA,RANGAREDDI (6)

APPENDIX -12.1
ORG4NIZATION CHART OF ANDHRA PRADESH FISHERIES CORPORATION (A P F C)
CHAIRMAN AND BOARD
OF DIRECTORS
MANAGING DIRECTOR
CHIEF GENERAL MANAGER
GENERAL MANAGER GENERAL MANAGER (TRAWLER (BOATBUILDING) OPERATIONS)
FINANCIAL GENERAL MANAGERADVISER (BRACKISHWATER
FARMING)
DY. GENERAL DY.GE NERAL MANAGER MANAGER
(FRESH WATER (PERSONNEL FISH FARMS) & ADMINIS-
TRATION)
DY. GENERAL OFFICER ON COMPANYMANAGER SPECIAL DUTY SECRETARY(MARKETING) (WORLD BANK
PROJECTS)
TWO MEXICAN TWO FRESH BOATBUILDING PERSONNEL ACCOUNTS PROCUREMENT BRACKISH- ICE PLANTS TWO FREEZINGTRAWLERS, WAYER YARD & ADMINIS— & MARKETING WATER DIVERSIFIED PLANTS,VIJAYANAGARKAKATEEYA
FISH FARMS,KAIKALURUPOCHAMPAD
(KAK INADA)SECONDBOATBUILDING
TRATION OF FISH &PRAWN
FISH FARM(KAKINADA)
FISHERYPROJECTS
KAKINADAVISAKHAPATNAM
YARDKAK INADA)
GENERAL MANAGER (PLANTS&EXPORTS
Appendix 14.1 Fisheries development schemes (1951-1979)
Plan Plan Actual Main activitiesoutlay expenditure
First Five-Year Plan 10.49 10.39(1951-56)
Second Five-Year Plan 70.28 63.61(1956-61)
Third Five-Year Plan 131.22 141.53 (1961-66)
Annual Plans1966-67 43.82 44.25 1967-68 42.32 37.97 1968-69 32.19 22.32
Fourth Five-Year Plan 223.40 1 80.30(1969-74)
-
Fifth Five-Year Plan 316.00 301 .53(1974-79)
Motorisation of indigenous fishing craft, intro-duction of synthetic fishing twine, supply ofsalt for fish Curing, fish seed collection anddistribution
Intensification of motorisation programme,organisation of fish seed collection, produc-tion and distribution, establishment of trainingcentre forfishermen, conducting of deepwaterfishingexperiments,establishmentof boatyard,supply of fishery requisites and staff forsurveyand development of inland fishery resources inthe Telengana area
Establishment of ice plants, cold storage, fishfarms,smallfishing harbourat Kakinada, supplyof synthetic fishing twine and establishment ofboatbuilding yard.
The same schemes as in the third Five-YearPlan were continued these three years.
Exploitation of marine fishery resources bymechanised fishing, special scheme for pro-viding drinking water facilities, roads, bridges,fish curing yards, supplyof nylon yarn and con-struction of nurseries for production of fishseed, etc. in backward areas, pilot survey forevolving a methodology for estimating inlandfisheries production under the guidance of the National Sample Survey Organisation.
Scheme for freshwater prawn culture at Kovvali.I.C.A.R. schemes involving research on brac-kishwater farmingat Kakinada and culture of air-breathing fishes at Palair, survey of Pulicatlake. Starting of an Inland Training Centre atKurnool and increasing the capacity of theFisheries Training Institute. Kakinada, from 20 to 75 candidates per annum. An integratedmarine fisheries project with credit assistancefrom the World Bank.
[37]

Appendix 14.2 Proposed fisheries development projects during the sixthfive-year plan (1980/81 — 1984/85)
Sixth SourcesSchemes allocation of
(As. million) finance
Marine Fishers
1. Integrated marine fisheries project
— harbour— fishing vessels— connecting roads
fish processing facilities — water supply to Nizampatnam
2. Fishing harbour, Bhavanapadu
3. Integrated marine fisheries project
— fishing harbour at Krishnapatnam connecting roads
— share capital for deep-sea trawlers— fish processing facilities— marketing facilities
4. Token provision for acquiring site and grantingmargin money for processing plants
Share capital contribution to APFC for acquiring deep-sea trawlers Share capital assistance to APFC for acquiringtrawlers from Gujarat Agro Marine Products
Share capital for acquiringcold storage and processing plantsConstruction of a buildingat Vizag for marine fishermenMarine Fisheries Training Institute, Machilipatnam
Construction of a bridge on Buckingham canalIntroduction of fibreglass boats
Total
Coastal Aquaculture1. Assistance to APFC for brackishwater fish
farming2. Joint Director of Fisheries and his staff3. Brackishwater fish farming including survey
staff4. Visit of Indonesian TCDC mission
[38]
64.149 World Bank
Centrallysponsored
7.452 Centrally
sponsored33.66 1 U K
(Pipeline)
0.300 SIDA(Pipeline)
0.300
2.000
0.800
0.1201.791
0.3000.225
111.098
0.6600.289
2.2350.010
3.194
Publications of the Bay of Bengal Programme (BOBP)
Development of Small-Scale Fisheries (GCP/RAS/040/SWE)
Reports (BOBP/REP/....)1. Report of the First Meeting of the Advisory Committee.
Colombo, Sri Lanka, 28-29 October 1976. (Published as Appendix 1 of IOFC/DEV/78/44.1, FAO, Rome, 1978)
2. Report of the Second Meeting of the Advisory Committee. Madras, India, 29-30 June 1 977. (Published as Appendix 2 of IOFC/DEV/78/44.1, FAO, Rome, 1978)
3. Report of the Third Meeting of the Advisory Committee.Chittagong, Bangladesh, 1-10 November 1978. Colombo, Sri Lanka, 1978.(Reissued Madras, India, September 1 980)
4. Role of Women in Small-Scale Fisheries of the Bay of Bengal. Madras, India, October 1 980.
5. Report of the Workshop on Social Feasibility in Small-Scale Fisheries Development.Madras, India, 3-8 September 1979. Madras, India, April 1980.
6. Report of the Workshop on Extension Service Requirements in Small-ScaleFisheries.Colombo, Sri Lanka, 8-1 2 October 1979. Madras, India, June 1980.
7. Report of the Fourth Meeting of the Advisory Committee.Phuket, Thailand, 27-30 November 1 979. Madras, India, February 1 980.
8. Pre-Feasibility Study of a Floating Fish Receiving and Distribution Unit for DublaChar, Bangladesh. G. Eddie, M. T. Nathan. Madras, India, April 1980.
9. Report of the Training Course for Fish Marketing Personnel of Tamil Nadu.Madras, India, 3-14 December 1979. Madras, India, September 1980.
1 0.1 Report of the Consultation on Stock Assessment for Small-Scale Fisheries in theBay of Bengal. Chittagong, Bangladesh, 16-21 June 1980. Volume 1 Proceedings. Madras, India, September 1 980.
10.2 Report of the Consultation on Stock Assessment for Small-Scale Fisheries in theBay of Bengal. Chittagong, Bangladesh, 16-21 June 1980.Volume 2 : Papers. Madras, India, October 1 980.
11. Report of the Fifth Meeting of the Advisory Committee. Penang, Malaysia, 4-7 November 1980. Madras, India, January 1981.
1 2. Report of the Training Course for Fish Marketing Personnel of Andhra Pradesh.Hyderabad, India, 11-26 November 1980. Madras, India, September 1981.
1 3. Report of the Sixth Meeting of the Advisory Committee. Colombo, Sri Lanka, 1-5 December 1981. Madras, India, February 1982.
14. Report of the First Phase of the “Aquaculture Demonstration for Small-ScaleFisheries Development Project” in Phang Nga Province, Thailand.Madras, India, March 1982.
[40]
1 5. Report of the Consultation-cum-Workshop on Development of Activities forImprovement of Coastal Fishing Families. Dacca, Bangladesh, October 27-November 6, 1981. Madras, India, May 1982.
16. Report of the Seventh Meeting of the Advisory Committee. New Delhi, India, January 1 7-21, 1983. Madras, India, April 1983.
Working Papers (BOBP/WP/..1. Investment Reduction and Increase in Service Life of Kattumaram Logs.
A. Balan. Madras, India, February 1980.
2. Inventory of Kattumarams and their Fishing Gear in Andhra Pradesh and Tamil Nadu. G. Pajot. Madras, India, October 1980.
3. Improvement of Large-Mesh Driftnets for Small-Scale Fisheries in Sri Lanka.G. Pajot. Madras, India, June 1980.
4. Inboard Motorisation of Small G.R.P. Boats in Sri Lanka. Madras, India, September 1 980.
5. Improvement of Large-Mesh Driftnets for Small-Scale Fisheries in Bangladesh.G. Pajot. Madras, India, September 1 980.
6. Fishing Trials with Bottom-Set Longlines in Sri Lanka.G. Pajot, K. T. Weerasooriya. Madras, India, September 1980.
7. Technical Trials of Beachcraft Prototypes in India.0. Gulbrandsen,G. P. Gowing, R. Ravikumar. Madras, India, October 1 980.
8. Current Knowledge of Fisheries Resources in the Shelf Area of the Bayof Bengal.B. T. Antony Raja. Madras, India, September 1980.
9. Boatbuilding Materials for Small-Scale Fisheries in India. Madras, India, October 1980.
10. Fishing Trials with High-Opening Bottom Trawls in Tamil Nadu, India.G. Pajot, John Crockett. Madras, India, October 1980.
11. The Possibilities for Technical Cooperation between Developing Countries (TCDC)in Fisheries. E. H. Nichols. Madras, India, August 1981.
1 2. Trials in Bangladesh of Large-Mesh Driftnets of Light Construction.G. Pajot, T. K. Das. Madras, India, October 1981.
1 3. Trials of Two-Boat Bottom Trawling in BangladeshG. Pajot, J. Crockett. Madras, India, October 1981.
14. Three Fishing Villages in Tamil Nadu. Edeltraud Drewes. Madras, India, February 1982.
1 5. Pilot Survey of Driftnet Fisheries in Bangladesh.M. Bergstrom. Madras, India, May 1982.
1 6. Further Trials with Bottom Longlines in Sri Lanka. Madras, India, July 1982.
1 7. Exploration of the Possibilities of Coastal Aquaculture Development in AndhraPradesh. Soleh Samsi, Sihar Siregar and Martono of the Directorate-General ofFisheries, Jakarta, Indonesia. Madras, India, August 1 982.
[41]

18. Review of Brackishwater Aquaculture Development in Tamil Nadu.Kasemsant Chalayondeja and Anant Saraya of the Department of Fisheries,Thailand. Madras, India, September 1982.
1 9. Coastal Village Development in Four Fishing Communities of Adirampattinam,Tamil Nadu, India. F W Blase. Madras, India, December 1982.
20. Further Trials of Mechanized Trawling for Food Fish in Tamil Nadu.G. Pajot, J. Crockett, S. Pandurangan, P. V. Ramamoorthy. Madras, India, December 1 982.
21. Improved Deck Machinery and Layout for Small Coastal Trawlers.G. Pajot, J. Crockett, S. Pandurangan, P. V. Ramamoorthy. Madras, India, June 1 983.
22. The Impact of Management Training on the Performance of Marketing Officersin State Fisheries Corporations.U. Tietze. Madras, India, June 1983.
Miscellaneous Papers (BOBP/MIS/ ....)
1. Fishermen’s Cooperatives in Kerala : A Critique. John Kurien. Madras, India, October 1980.
Newsletters (Bay of Bengal News)
January 1981, May 1981, September 1981, December 1981, March 1982,March 1982, June 1982, September 1982, December 1982, March 1983.
Information Documents: (BOBP/INF/....)
1. Women and Rural Development in the Bay of Bengal Region Information Sources. Madras, India, February 1 982.
2. Fish Aggregation Devices Information Sources. Madras, India, February 1 982.
3. Marine Small-Scale Fisheries of India : A General Description. Madras, India, March 1983.
4. Marine Small-Scale Fisheries of Andhra Pradesh : A General Description.Madras, India, June 1983.
Published by the Bay of Bengal Programme, FAO, 91, St. Mary’s Road, Abhiramapuram,Madras 600 018, India. Printed at Amra Press, Madras 600 041.


