450
Government of India Ministry of Shipping January, 2011 MARITIME AGENDA : 2010 - 2020
| Date post: | 07-Nov-2014 |
| Category: |
Documents |
| Upload: | mayank-nisarta |
| View: | 231 times |
| Download: | 8 times |
Government of India
Ministry of ShippingJanuary, 2011
MARITIME AGENDA : 2010 - 2020
Preface The Logistics Sector in India needs to develop rapidly to synchronize with the dynamic growth of the Indian Economy. The Ports infrastructure and Shipping have vital roles as parts of the logistics chain. The Ministry of Shipping has been continuously engaged in designing and implementing various projects for the development of the sector. Based on inputs received from various sources, it is felt that the pace of growth has to be increased, that the whole efficiency of the delivery system has to be substantially improved and that the concern for the environment has to be stronger. The Maritime Agenda 2010-20 is part of the effort to identify the areas for attention during the 10 year period from 2010-11 to 2019-20. This 10 year period covers the last two years of the Eleventh Five Year Plan, the full five years of the Twelfth Five Year Plan and the first three years of the Thirteenth Five Year Plan. Obviously, 10 years is too long a period for identification of specific areas of action in a fast changing world. It is, therefore, imperative that the Maritime Agenda is not seen as a static document; it does need to be reviewed periodically. I must make it clear that the various observations and statements in the document do not always reflect the accepted official position of the Government. Many of the policies, programmes and projects listed have not been formally approved, nor have they gone through the normal process of decision - making in the Government. This document basically presents an agenda for consideration. On each of the Agenda items, there has to be a separate scrutiny and decision making. In other words, this is more an Agenda for consideration and decision rather than an Agenda for action. At the same time, many of the listed activities are statements of obvious intentions and all concerned have to be working towards achieving these goals. Many of the agenda items fall in the domain of other Ministries of the Central Government, or in the domain of the State Governments; several items are for the Industry to act. Some of the identified activities may be taken up only during the later years of the decade, although the time frame has not been specified for some of the activities. This will be refined further. As part of the monitoring process, it would be useful to have an annual assessment of the action taken on the recommendations contained in Part IV and come out with a report card. It would be possible to decide on deletions, additions and modifications depending on the circumstances then prevailing. This exercise has had the full involvement of several officers at various levels from the Ministry of Shipping as well as from the field organizations. It would not have been possible to develop such a document without the dynamic leadership of the Hon’ble Minister of Shipping, Shri G.K. Vasan. I believe this Maritime Agenda 2010-20 would serve as a key support document in our efforts to develop the Indian Maritime Sector.
K. Mohandas Secretary to the Government of India
I
Contents
PART – I
INTRODUCTION
Chapter-1 Introduction 1-3
PART – II
PORTS
Chapter-2 Global Overview of the Maritime Sector 4-11
Chapter-3 Emerging Scenario 12-18
Chapter-4 Overview of the Port Sector in India 19-32
Chapter-5 Existing Policy Framework 33-36
Chapter-6 Analysis of Traffic Projections made by various Agencies 37-46
Chapter-7 Traffic Projections and Capacity Estimation for Major Ports and 47-82 maritime States upto 2020
Chapter-8 Hinterland Connectivity 83-95
Chapter-9 Ports’ Efficiency – Quest to achieve International Standards 96-104
Chapter-10 Category-wise Projects and funding pattern for Major Ports and 105-126 Maritime States upto 2020
Chapter-11 Information and Communication Technology (ICT) Perspective in 127-133 Indian Ports
Chapter-12 Future Policy Milestones and Way Forward 134-148
ANNEXURES TO PART - II
Annexure No.
List of Annexure Page No.
I. List of Major and Non-Major Ports 149 – 152
II. Commodity-wise Traffic handled at Major Ports during 2009-10 & 2008-09
153
III. Commodity-wise Capacity available at Major Ports as on 31.03.2010
154
IV. Commodity-wise Traffic handled at Non-Major Ports during 2009-10 & 2008-09
155

II
V. List of Projects under Private Sector Participation 156 – 158
VI. Port wise & Commodity wise Traffic Projections for Major Ports from 2011-12 to 2019-20
159 – 166
VII. Port wise & Commodity wise Capacity Estimation for Major Ports from 2011-12 to 2019-20
167 – 171
VIII. State wise & Commodity wise Traffic Projections for Non-Major Ports from 2011-12 to 2019-20
172 – 176
IX (i & ii) State wise Capacity Estimation for Non-Major Ports from 2011-12 to 2019-20
177 – 180
X. Summary of Commodity wise overall Traffic Indian Projection for Major Ports, Non-Major Ports and All Ports (Major + Non Major Ports) from 2011-12 to 2019-20
181 – 183
XI. Summary of ongoing Projects and Projects to be under taken for Major Ports in Phases I, II & III and their funding pattern
184 – 191
XII. Summary of investments to be made at Maritime States for various development Projects in Phase I, Phase II & Phase III
192 – 202
XIII. Port wise list of ongoing Projects and Projects to be under taken for Major Ports in Phases I, II & III and their funding pattern
203 – 302
PART – III
SHIPPING
Chapter-13 Overview of the Shipping Sector 303-305
Chapter-14 Shipping 306-329
Chapter-15 Human Resources Development 330-356
Chapter-16 Coastal Shipping 357-362
Chapter-17 Aids to Navigation 363-382
Chapter-18 Shipbuilding and Ship repair 383-411
Chapter-19 Inland Waterways 412-424
Chapter-20 Proposed Policy measures, Initiatives and Expected Outcome 425-431
PART – IV
AGENDA FOR THE DECADE
Chapter-21 Agenda for the decade 432-441

PART - I
INTRODUCTION

1
CHAPTER -1
INTRODUCTION
1.1 India is a major maritime nation by virtue of its long coast line of around 7517
Kms on the western and eastern shelves of the mainland and also along the islands,
bejewelled with 13 major and 176 non-major ports, strategically located on the world’s
shipping routes, its long tradition of seafaring with a large pool of trained maritime
personnel, and its dynamic and rapidly globalizing economy with a vast potential to
expand its participation in trade and development.
1.2 India has been an emerging and vibrant economy with a huge market, a billion
plus population and strong GDP growth rates of over 9% for three consecutive years up
to 2008-09. However, due to the global melt-down and recession, the GDP growth
slowed down to 6.7% in 2008-09. But, with global recovery under way and backed by
strong decisive policy responses, the economy performed better in 2009-10 and
achieved growth rate of 7.1% , it is likely to grow at 9.2% during 2010-11. As forecast
made by many global institutions, India along with China will lead Asia’s economic
expansion from 2010 onwards.
1.3 Ports play a vital role in the overall economic development of the country. About
90% by volume and 70% by Value of the country’s international trade is carried on
through maritime transport. Development of India’s ports and trade related infrastructure
will continue to be critical to sustain the success of accelerated growth in the Indian
economy. Despite record growth rates, the merchandise trade intensity of India’s GDP
is still below 30 per cent. This indicates that there is still a lot of untapped potential for
trade growth, and consequently the demands on the country’s ports and trade
infrastructure will continue to mount as trade diversifies and grows. Hence, there is a
need to expand the Country’s ports in a timely and efficient manner.
1.4 India’s ports comprise of 13 major ports including Port Blair Port Trust which was
declared as a Major Port on 1-06-2010 and around 176 non-major ports along the coast
and islands. The Major Ports are under the Union List (Schedule VII) while the Non-
Major Ports are under the Concurrent List (Schedule VII) of the Constitution of India.
2
The 13 major ports are administered by the Central Government under Ministry of
Shipping. The remaining ports which are referred to as Non-major ports are
administered by the nine maritime States and three Union territories within their
respective coastlines. A list indicating Major Ports, Non-Major Ports and Ports under
Union Territories in India is given as Annexure I.
1.5 The total volume of traffic handled by all the Indian Ports during 2009-10 was
849.9 million tonnes. Non-major ports account for around one-third of the total sea-
borne trade. The growth in cargo handled at Major and Non-major Ports in 2009-10 was
5.8% and 35.4% respectively as compared to 2.2% and 3.3% achieved in 2008-09.
1.6 In order to achieve the coveted goal of transforming Indian Ports into world class
facilities suited to the requirements of the future economy of India, the Ministry of
Shipping, Government of India has initiated many path-breaking measures which will
facilitate enhanced private investment, improve the service quality and promote
competitiveness, apart from achieving the expansion of capacities in the country. Such
measures include formulation of Maritime Policy, revision of various operational policies,
preparation of Perspective Plans for the major ports, commissioning of two more major
ports one each on the East Coast & the West Coast, introduction of Port Community
System (PCS), paperless regime, etc.
1.7 Although a Maritime Policy was attempted at the national level sometime in 2004
and a draft hosted on the web-site of the Ministry of Shipping, it could not be finalised
due to various reasons. A comprehensive policy is necessary as a foundation for an
ambitious development plan; it provides the right frame-work for the development of the
sector. Keeping in view the above perspective, Policy framework and Policy issues are
formulated and provided in the subsequent chapters. Of course, each State
Government is also having a maritime policy of its own and an endeavour has been
made to assimilate the spirit of such policies also into this document while preparing the
Maritime Agenda, 2010 - 2020. Similarly, future policy milestones which are foreseeable
priority deliverables have also been identified and incorporated.
1.8 Some time ago, as decided in the meeting of Committee of Infrastructure headed
by the Honb’le Prime Minister, the major ports had been asked to prepare a long-
3
perspective Business plan of each port with the help of international consultants.
Accordingly, each major port has got its Business Plans prepared. All those plans have
been co-ordinated at Central level by the Indian Ports Association, New Delhi by
engaging the Port of Rotterdam Authority and a consolidated business plan, combining
the projections of traffic and development plans was prepared.
1.9 But, such consolidated plan is only for the major ports and does not take into
consideration of the needs of non-major ports which are large in number irrespective of
their volumes. The Planning Commission also, in its mid-term appraisal document, has
strongly suggested having a comprehensive document for the development of the Port
Sector that includes non-major ports, and also a monitoring system for assessing the
overall port capacities including those of the non-major ports on a regular basis.
1.10 Moreover, when perspective business plans were prepared, the maritime sector
was growing at a brisker pace and those plans took into consideration the prospective
growth rates. But, unfortunately, with the global slow-down and recession, the major
global economies have taken a tumble in every sector. Shipping and Ports are no
exception. Accordingly, cargo traffic which had been growing at a rate of approximately
11% annually has shown lower growth rates. Although India has succeeded in
effectively surviving the slowdown with the fundamental strength of the economy and
the systems and with the various policy measures, achieving the earlier growth rates
still remains a challenge for the economy. The current economic indicators clearly point
to a robust growth of the Indian economy.
1.11 It is in this context that the Ministry of Shipping embarked upon the very
challenging task of preparing an ambitious Maritime Agenda for the decade, 2010 -
2020 to create, build and sustain the maritime infrastructural needs of the Country for
the next decade. This document aims to navigate and steer the Indian maritime sector
realistically into the premier maritime nations of the world.

PART – II
PORTS
4
CHAPTER- 2
GLOBAL OVERVIEW OF THE MARITIME SECTOR
2.1 Introduction
2.1.1 International trade is a cornerstone of the global economy. Exchange of goods
amongst countries widen the choice of supply and ensures that production takes place
where it is cheapest and best. This is reflected in the intensification of globalization and
the fact that world trade is growing faster than the world output. World trade relies on
cheap and secure transport. Maritime transport, enabled by, inter alia, technological
developments and competitive transport costs, is estimated to handle over 80 % world
trade by volume and over 70 % by value. As trade grows, the demand for maritime
transport also grows. Technological developments in bulk and container transport have
made maritime transport cheaper. Bulk transport involves shipping one homogeneous
commodity (e.g. grain, ore etc) at any one time, but in large quantities; in contrast,
container transport entails transporting different goods at the same time, but in standard
containers that are easy to load and unload. However, the slower growth in world sea-
borne trade compared to world trade in general reflects that the weight of the goods
transported increases at a slower rate than their value due to rising trade in processed
goods like electronic items, medicines, apparel, gems and jewellery etc. Besides,
greater use of lighter materials and lower material intensity in the manufacturing process
has also led to slower increase in weight.
2.1.2 In 2008 international seaborne trade increased @ 3.6% to reach 8.17 billion
tones. The volume of 8.17 billion tonnes comprised of 2.75 billion tonnes of tanker cargo
(33.7%) and 5.42 billion tonnes of dry cargo (66.3%). Tanker trades (crude oil and
products) posted marginal growth of 1.6 % in 2008 in an environment of weak demand.
The tanker Cargo, in turn, consisted of 1834 million tonnes (66.7%) of crude oil and 915
million tonnes (33.3%) of petroleum products. Dry bulk trade, the main driver of the
shipping industry over the past few years, is driven, inter alia, by industrial production
and growth requirements. These shipments accounted for more than two-third of total

5
world goods loaded. Dry bulk consisted of 2.10 billion tonnes of the five traditional dry
bulk types (iron ore, coal, food grains, and bauxite/alumina and rock phosphate) and
other dry cargo of 3.32 billion tonnes which showed an increase of 4.1 % and 5 %
respectively.
2.1.3 The 2008 financial crisis has been widely described as unprecedented and
unforecast, which is disastrous from a risk management perspective. Container
volumes in 2009 dipped abruptly by between 15% and 30% year-on-year, depending on
the location, in a world that had never before experienced such severe and sustained
negative growth.
2.1.4 In response to the drop in volumes and revenues, terminal operators and
shipping lines have scrambled to renegotiate their commitments. Many lines have tried
to postpone or cancel part of their vessel new building programmes and to renegotiate
charter rates. In May 2010 it was reported that a South Korean shipyard had received a
$70M cancellation fee for not building three container ships. Lines have also reportedly
achieved drastic reductions in terminal tariffs. Terminal operators, too, have tried to
reduce their exposure by renegotiating some of the components of their concession
agreements with port operators, such as volume guarantees, deadlines and royalty
levels. It can take 10 years to get a greenfield terminal project fully up and running.
2.2 Challenges Ahead
2.2.1. The recent past has been unprecedented in the history of container shipping, as
traffic volumes have collapsed, freight rates have plummeted and practically all capital
investment programmes have been curtailed. Everybody has been affected, with most
ocean carriers reporting record financial losses, box ports and terminals posting losses
due to decline in throughput for the first time in their histories and international terminal
operators (ITOs) postponing or cancelling new projects and renegotiating contracts
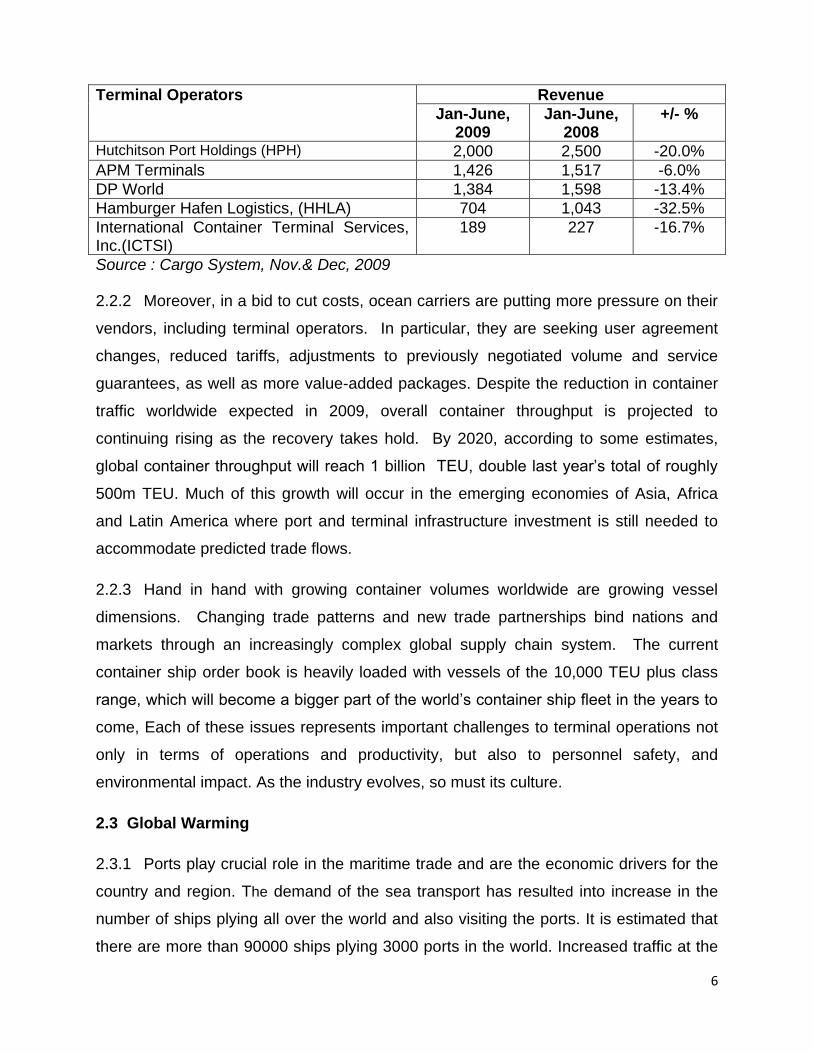
agreed when the market was at its height. The following table needs no explanation for
top operators about the loss in revenues:
6
Terminal Operators Revenue
Jan-June, 2009
Jan-June, 2008
+/- %
Hutchitson Port Holdings (HPH) 2,000 2,500 -20.0%
APM Terminals 1,426 1,517 -6.0%
DP World 1,384 1,598 -13.4%
Hamburger Hafen Logistics, (HHLA) 704 1,043 -32.5%
International Container Terminal Services, Inc.(ICTSI)
189 227 -16.7%
Source : Cargo System, Nov.& Dec, 2009
2.2.2 Moreover, in a bid to cut costs, ocean carriers are putting more pressure on their
vendors, including terminal operators. In particular, they are seeking user agreement
changes, reduced tariffs, adjustments to previously negotiated volume and service
guarantees, as well as more value-added packages. Despite the reduction in container
traffic worldwide expected in 2009, overall container throughput is projected to
continuing rising as the recovery takes hold. By 2020, according to some estimates,
global container throughput will reach 1 billion TEU, double last year‘s total of roughly
500m TEU. Much of this growth will occur in the emerging economies of Asia, Africa
and Latin America where port and terminal infrastructure investment is still needed to
accommodate predicted trade flows.
2.2.3 Hand in hand with growing container volumes worldwide are growing vessel
dimensions. Changing trade patterns and new trade partnerships bind nations and
markets through an increasingly complex global supply chain system. The current
container ship order book is heavily loaded with vessels of the 10,000 TEU plus class
range, which will become a bigger part of the world‘s container ship fleet in the years to
come, Each of these issues represents important challenges to terminal operations not
only in terms of operations and productivity, but also to personnel safety, and
environmental impact. As the industry evolves, so must its culture.
2.3 Global Warming
2.3.1 Ports play crucial role in the maritime trade and are the economic drivers for the
country and region. The demand of the sea transport has resulted into increase in the
number of ships plying all over the world and also visiting the ports. It is estimated that
there are more than 90000 ships plying 3000 ports in the world. Increased traffic at the

7
ports gives rise to increase in the chain of related activities like shipping activities viz.,
towing, mooring, berthing, piloting, marine survey, sea patrolling etc. involving use of
harbour crafts such as tugboats and launches; bunkering and transhipment / lighterage
operations etc. In addition, cargo handling, vehicular traffic, movement of cargo to and
from ports through heavy duty trucks and rails, deployment of dredgers to deepen the
drafts etc. also result in environmental pollution at the ports in the form of air emission.
Air pollution is causing severe threat to the health of the nearby residents of the port
and hence measures in the direction of reducing emission to improve the air quality and
also fight against global warming are necessary. Shipping-related PM emissions take
horrific toll on coastal population and are responsible for approximately 60,000
cardiopulmonary and lung cancer deaths annually. 3.8 % of all global premature deaths
are due to exposure to PM. It is estimated that with the expected growth in shipping
activity, annual mortalities could increase by 40% by 2012. 94% of the Diesel exhaust
emission coming from ‗mobile sources‘ in the port accounts for approximately 84% of
the cancer risk. Marine fuel bunkering fumes also cause toxic emission leading to
nausea and breathing difficulties.
2.3.2 The largest air pollutant amongst the above sources for CAC1 is ships which
contribute almost 40% followed by heavy duty vehicles 38%. Contribution by harbour
crafts, cargo handling equipments and rail locomotives is 7%, 8% and 7% respectively.
The main pollutants amongst the CAC for ships are SOx, NOx, PM and acid rains
where as for heavy duty vehicles they are NOx, PM and CO. For the GHG2, maximum
contribution of pollution of 48% is by heavy duty vehicles followed by ships 25%,
harbour crafts 5%, cargo handling equipments 14% and rail locomotives 8%. The major
pollutant amongst the GHGs is CO2 followed by CH4.
2.3.3 It is pertinent to mention that the World Ports Climate Initiative (WPCI) initiated
by the International Association of Ports and Harbours (IAPH) is supported by 55 major
ports in the world with the objective of reducing greenhouse gas emissions through
developing a GHG emissions inventory and developing a collaborative approach toward
collecting information, estimating emissions and developing plans to reduce the footprint

8
of port operations. The mission of the WPCI is to raise awareness in the port and
maritime community of need for action; to initiate studies, strategies and actions to
reduce GHG emissions and improve air quality; to provide a platform for the maritime
port sector for the exchange of information thereon; and to make available information
on the effects of climate change on the maritime port environment and measures for its
mitigation.
2.3.4 IMO incorporated Annex VI to MARPOL Convention to control air pollution
sources by ships looking to the growing concern toward air pollution triggered by marine
industry. Convention recommends control of –
(i) SOx and PM emission through fuel oil and combustion equipments. It also
defines the Emission Control Areas (ECA) and specifies the sulphur content of
fuel oil to be used inside and outside the area3. Sample of the fuel oil is required
to be maintained on board the ship to know the fuel quality.
(ii) NOx by prescribing emission limits by the different engine speeds and ship
construction date.
(iii) Ozone depleting substances by stoppage of their production and use.
(iv) VOC through Vapor Emission Control System (VECS).
2.4 Productivity Aspects
2.4.1 Normally productivity is defined as metrics and measures of output from
production processes per unit of input. Depending on how a terminal‘s performance
indexes are defined, productivity can refer to containers per hour, moves per hour or
cost per container, for example. It is not all that difficult to measure containers or moves
per hour, system suppliers can help a terminal to operate its dockside cranes faster.
2.4.2 Automation, training, service and support, spare parts, crane information
management systems, preventive maintenance and integration are examples of some
of the areas are of focus which is to be looked into in the future. Port and terminal
operators will have to implement best practice and cost-cutting initiatives, lean
9
organisations and lean operation processes are better prepared for longer periods of
decreasing volumes and rates than the ones that have not adapted.
2.4.3 During the rapid growth of the container market in the recent years, most terminal
operators did not think it necessary to streamline operations in line with rising in line
with rising wages and increasing equipment manning. The current crisis has amplified
the importance of cost compositeness, reliability and performance, and has created
greater demand for improving performance, enhancing reliability and the use of
measurement standards. Global and independent operators have already faced the fact
that, over a very short time horizon, they had to reduce costs and improve performance.
So far, this has mainly been done by cutting expenditure on training and investment and
major staff reductions. Experience in other industries suggests that such measures can
only last a short time, as the business is not geared to run with such a low costs without
going through a significant process improvement programme.
2.5 Encouraging Future
2.5.1 All ports were hit by the recession, but not all cargo flows were affected to the
same extent, and competitive positioning of ports has changed. The economic crisis is
forcing us to prepare better for the future. Lower growth in consumption, more interest
in energy and energy security, and a continuing focus on sustainability are
characteristics of the post-crisis landscape. The year 2010 has brought favourable
economic news. The World Bank has raised its projected growth rate for the global
economy from 2.0% to 2.7%. A prominent consulting group has upped its estimate for
growth in US GDP to 2.6% from 2.2%. China posted spectacular growth of 10.7% for
4Q/2009, and one forecast indicates that China‘s GDP will expand by 9.5% in 2010.
Some ports in developed countries showed robust container throughput recovery in the
second half of 2009. Overall, it is expected that a better economic environment for
ports this year.
2.5.2 Economists and analysts have begun to speak with some degree of confidence
about signs of economic recovery, and this is good news. For those in the container
terminal business, however, it is not simply a case of waiting for things to return to
normal. It is facing the reality of what has become the ‗new normal‘. It is necessary to
10
recognise the fundamental changes in the industry in terms of expectations of growth,
investment and demand and should respond to these changes assertively and sensibly.
2.5.3 International containerised liner trade began on the trans-Atlantic routes just over
four decades ago. The centre of gravity of containerised trade gradually shifted to the
trans-Pacific services as new global trading patterns evolved. This evolutionary process
continues. By 2009, China had overtaken Germany and the US as the leading exporting
nation, having already surpassed Germany as the third largest economy in the world in
2007. Asia has become the new hub of global container trade. The brightest sports in
the container industry are now in the container industry are now in the economically
emerging markets of southeast Asia, the Indian subcontinent, sub-Saharan Africa, Latin
America and the Middle East.
2.5.4 Lack of port and transportation infrastructure in these regions persists. This
simple fact emphasises the major role that established container terminal developers
and operators will continue to play. We serve as crucial catalysts in the global economy
by providing access to new markets and the benefits of international trade. Make no
mistake, we are still in the game and we are playing to win. The long term development
of ports is therefore determined to a great extent by the following factors; their
distinctiveness vis-à-vis their rivals, the extent to which they can attract high-growth
cargo segments, the quality of their hinterland connections and their concern for the
compete, and such competition is healthy, especially when there is a level playing field.
But given the above challenges, co-operation between ports and with port business will
become increasingly important.
2.6 Indian Port Scenario
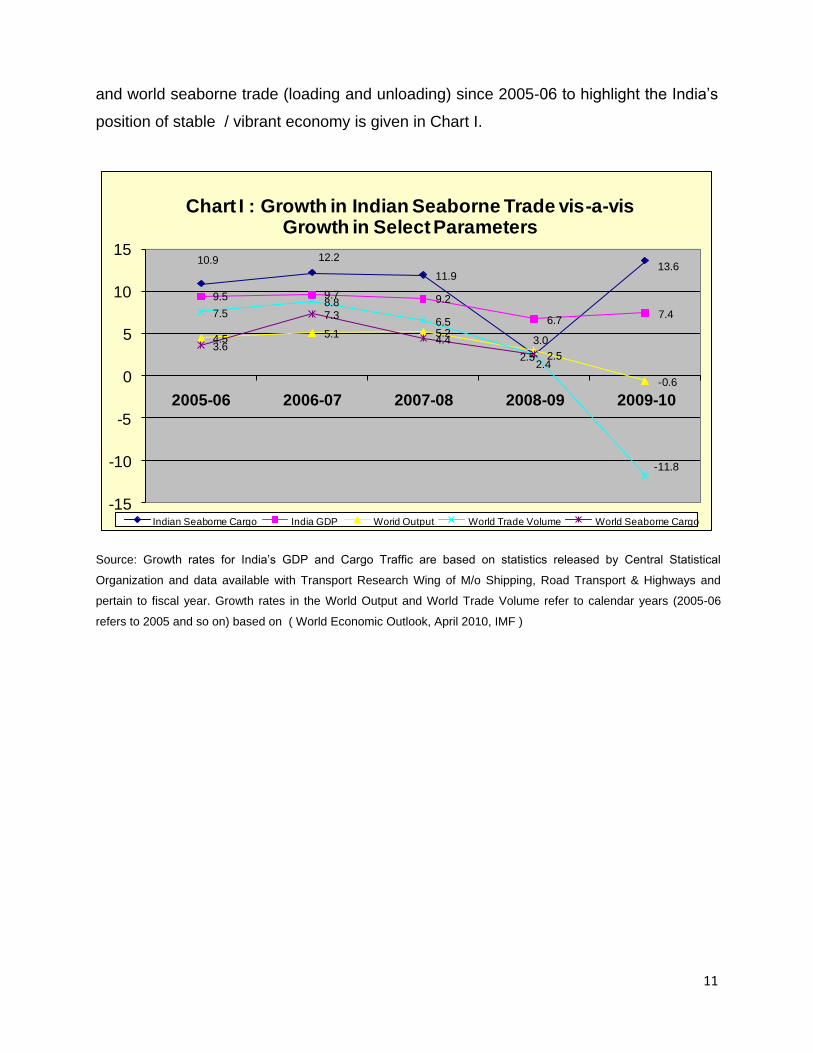
2.6.1 As already discussed earlier, the growth in cargo handled at Major and Non-
major ports in 2009-10 was 5.8% and 35.4% respectively compared to 2.2% and 3.3%
achieved in of 2008-09, The robust overall growth in India‘s seaborne cargo traffic in
2009-10 reflects fairly strong recovery in India‘s growth during the course of 2009-10.
The growth in India‘s GDP, Port traffic and growth in world output, world trade volume
11
and world seaborne trade (loading and unloading) since 2005-06 to highlight the India‘s
position of stable / vibrant economy is given in Chart I.
10.9 12.2
11.9
2.5
13.6
9.5 9.7 9.2
6.77.4
4.5 5.1 5.23.0
-0.6
7.58.8
6.5
2.4
-11.8
3.6
7.3
4.4
2.5
-15
-10
-5
0
5
10
15
2005-06 2006-07 2007-08 2008-09 2009-10
Chart I : Growth in Indian Seaborne Trade vis-a-vis Growth in Select Parameters
Indian Seaborne Cargo India GDP Worid Output World Trade Volume World Seaborne Cargo
Source: Growth rates for India‘s GDP and Cargo Traffic are based on statistics released by Central Statistical
Organization and data available with Transport Research Wing of M/o Shipping, Road Transport & Highways and
pertain to fiscal year. Growth rates in the World Output and World Trade Volume refer to calendar years (2005-06
refers to 2005 and so on) based on ( World Economic Outlook, April 2010, IMF )

12
CHAPTER-3
EMERGING SCENARIO
3.1 Introduction
3.1.1 The emerging global economy has opened up new avenues in all the
sectors in general and maritime sector in particular. The maritime sector through
economic liberalization, competition, upgraded technology, application of
modern information technology is being talked about world-wide. The impact has
been very positive in India as also GDP growth rate attained newer height during
the recent past and projected to achieve 9% growth rate during the 11th Plan
period. Globally also, apart from the last two years of economic meltdown, the
overall emerging scenario is becoming very aggressive which has been described
in the following paragraphs.
3.2 Economic Liberalisation
3.2.1 Opening up of the economy results in increase in the volume of imports and
exports. The mid term strategy outlined by the Export Import (EXIM) Policy of the
Government of India envisages an increase in India‘s share in world trade from the
current 0.80 percent to 1.5 percent. To meet such ambitious target, cost and speed
have to be the essential factors in the movement of cargo. Inefficient port operation and
inadequate port capacity not only increase the total transportation cost but also hinder
the smooth flow of traffic through the port. Port congestion or detention to a vessel in
the port retards the speed of cargo movement. Fast movement of cargo through ports is
of vital importance to a shipper. The primary consideration of port users in the selection
of port for movement of cargo is the quality service provided at the least cost.
3.2.2 Liberalisation of trade has also resulted in the globalization of the manufacturing
process, which in turn has led to a massive increase in trade, with the majority of these
13
manufactured goods moving in containers. As competition increases, manufacturers
and shippers strive to minimize transport costs. At the same time, they want guaranteed
delivery time and the ability to know the location of their goods on a real time basis.
Port users have been putting enormous pressure on authorities to improve cargo
handling efficiency, reduce port costs, and provide facilities to meet the changing
demands of the ships and cargoes. Liberalisation has brought in competition in the
provision of efficient and customer based services by the port management. The ports
which will be able to meet the challenges posed by the competition will emerge as
winners and will flourish in the long run.
3.3 Competition
3.3.1 Indian economy is at the threshold of a golden age of growth. Goldman Sachs
economists say that over the next 50 years, what they call the BRIC economies (Brazil,
Russia, India and China) could become a much larger force globally. The Goldman Sachs
economists predict that India will overtake Italy in 2015, France in 2020, Germany in 2023
and Japan in 2032. China‘s economy will be larger than everybody else by 2016 and
even larger than the US economy in 2041. Also they say: ―India has the potential to grow
the fastest over the next 30 to 50 years.‖ Its GDP growth rate will stay above 5 per cent till
2050; China‘s will drop to 5 per cent by 2020 and to around 3.5 per cent in the mid –
2040s.
3.3.2 Global Competition has changed the world and therefore, the business, whether
large and small today search the entire world for customers, suppliers, labour, know-how,
technical expertise, finance, etc. This has resulted in merger and amalgamation and joint
ventures. Dubai Port International renamed as Dubai World had taken over world-wide
rights of P&O operations. Shipowners now group themselves to form a consortia to
reduce the cost and increase the capacity which results in enhanced market penetration.
3.3.3 Globalisation has its impact on the developments of ports in India. There is a
clear trend towards the global ownership and management of port terminals as
witnessed by the entry of P&O Lines, Dubai Ports, Maersk Lines and PSA in certain
Major Ports. It also means port operators responding to cut throat competition. This has
resulted in transfer of a range of port related activities from mainly publicly owned to
14
privately owned undertakings. Changes in the world economy, shifts in composition,
magnitude and direction of international trade, innovations in shipping, advancements in
cargo handling technology, greater need for multi-modal transport, higher capital
intensity and massive private sector participation have been rapidly transforming the
competitive scenario in the port sector.
3.3.4 In India, the competition has been noticed during the post liberalisation period
due to emergence of large number of State and Private Ports and Private terminals
within major ports. Competition is emerging among the major ports and also in the ports
within and outside the region. This has also compelled the Major Ports to pay more
attention for improvement in productivity. Further, a terminal of the Major Port and that
of BOT operator within the Major Port has made the port terminal to perform better to
meet the competition from the BOT operator. An example of JNPT is worth mentioning.
3.3.5 Another factor that enhances competition is due to the WTO negotiations on
commitments in services, which include port services. Under Maritime Transport
services, negotiations may lead to agreements where foreign firms would be able to
compete for port services including pilotage, towage, stevedoring services, etc. This
would throw open these services to be offered by outside agencies. If these occur, there
would be increased pressure on port authorities to divest some of the services rendered
now.
3.3 .6 To stay competitive, port authorities had to modernize and upgrade port facilities
to meet the needs of the port users. However, the investment required and managerial
capabilities will pose challenges to public port authorities.
3.4 Technological Changes
3.4.1 The shipping and cargo handling technologies are changing rapidly. The ship
size is getting bigger and in tune the harbours need to be deepened and modernized
the superstructure. Cargo handling takes place in many forms: bulk, break bulk, liquid
bulk and in containers. Containerized traffic is the most prominent type in the era of
growing industrial exports. These changes have an influence on the method of working
and labour deployment at the terminals. More mechanization, unitisation of cargo and
15
computerization are becoming imperative. Manning scales have to change. Workforce
needs to be better educated and more skilled.
3.4.2 With the percentage of containerization growing steadily the growth of container
traffic is becoming more and more significant. As per an ESCAP study conducted in
2005, it is estimated that by 2015, Asia‘s share of containerised exports will increase
from 55% of the world total in 2002 to 64%, while the share of containerised imports is
expected to rise from 46% to 53% during the same period. In order to meet this
growing global demand, the Asian ports including ports in India have to adopt the
modern cargo handling technologies.
3.4.3 The biggest container ship deployed has grown at a tremendous rate over the
past few decades. The driving force has been international globalisation. Increased
competition and economy of scale have fuelled the development of ever bigger ships.
In the early 1970s, the biggest ship was about 2,000 TEU, compared to 14,000 TEU
today. Is this development going to continue or will it be curbed by global warming and
the carbon footprint. Large ships are green ships by virtue of the fact that the fuel
consumption per TEU transported is lower. The cost is also lower due to the economy
of scale. Two decades ago, studies were published comparing two 4,000 TEU ships to
one 8,000 TEU ship and showed a reduced total cost per unit. Today, a comparison
between two 8k TEU ships and one 16k TEU shows the same trend. The capital cost for
the bigger ship is in the order of 20% less and the fuel cost around 40% less, the exact
numbers depend on the building price and fuel price. There is a gain to be made by
going for bigger units, in terms of not only the cost, but also the carbon footprint. Slow
steaming will also contribute to lower fuel consumption, even if more ships are needed
in the loop to maintain the service schedule. So, bigger ships going at lower speed are
what the world may be looking for in the years to come.
But, we all know that big ships need to be filled up to be able to reap the benefits. In
times of fluctuating transport volumes, it is prudent to ask if big units provide the best
solution for adjusting the transportation service supply to the demand. To accommodate
such vessels, container hub ports must have access channels of sufficient depth, along
with advanced and highly efficient terminal facilities.
16
3.4.4 Another example in this regard may be quoted about installation of World‘s
largest ship to shore crane at Georgia Port. The 242 tonne crane is 142 m. long 114 m
high with the boom raised. It can span 22 containers across and 6 containers high. The
lift capacity of this crane is 65 tonne under spreader bar and 85 tonne under cargo
beams.
3.5 Global Challenges Ahead
3.5.1 According to a study on Perspective of Changes in the Port Industry, made by
IAPH , based on ESCAP forecasting assumptions, it has been indicated that ―upto 8000
TEU vessel will be in operation by 2006, and upto 12000 TEU vessel size by 2011 on
the major routes. The handling rate is likely to be 160 moves per hour per berth in
future. The Shippers choice will be determined by cost of service, transit time, frequency
and transshipment.‖
3.5.2 Another study titled as ―Regional Shipping and Port Development Strategies‖
conducted by ESCAP in 2005 has made the following findings:
The total volumes of world international container handling will increase to 576.4 million TEU by the year 2015 with an annual average growth rate over the period of 6.9 per cent per annum.
The total volumes in the ports of ESCAP countries will increase from 133.7 million TEU in 2002 to 352.3 million TEU in 2015 at an annual average growth rate of 7.7 per cent.
The study estimates that the world total trans-shipment volume of containers will increase from 58 million TEU in 2002 to 152 million TEU in 2015 at an average growth rate of 7.7 per cent annum.
The study estimates that the total volume of containers trans-shipped within the ESCAP region will increase from an estimated 42.2 million TEU in 2002 to 109.6 million TEU in 2015.
3.6 New Terminals and Global Investments
3.6.1 The ESCAP study further estimated that, in total, 927 new container berths will
be required to meet anticipated world demand in 2015, of which 569 berths will be for
the ESCAP region. The biggest share of this total is accounted for by East Asia, which

17
will require over 270 new berths by 2015. South-East Asia and North Asia will require
148 and 65 new berths, respectively. It is estimated that 66 additional berths will be
needed in the South Asia sub-region.
3.6.2 However, based on typical costs to develop new infrastructure and procure the
handling equipment required to allow the terminal to operate at a satisfactory level of
efficiency, the total capital required has been estimated at approximately US$55 billion,
of which US$36 billion for the ports in ESCAP region.
3.6.3 Another study by UK-based Ocean Shipping Consultants (OSC) analyses the
dramatic development in container-handling activity at East Asian ports (includes North
East, Far East and South East Asia) for the period up to 2020. Under so-called normal
scenarios, OSC forecasts that total container port demand is set to increase by between
102% and 126% over the 2004-15 period, to a maximum threshold of 385 million TEU.
By 2020, a further expansion of 20-27% will take the figure up to 487 million TEU.
Under this increased-risk scenario, total East Asian container port demand is projected
to grow by 88% to 321 million TEU by 2015 and by further 20%, to 386 million TEU by
2020. Despite the increased risks, container port demand growth is still forecast to be
substantial
3.6.4 On all trade routes cargo volumes are rising – and it is ports that are putting in
the investment to make sure that world trade keeps moving. A Ports and Harbour
survey of the world‘s 50 ports found that some $40 Billion is being spent by them on
infrastructure developments. To this conservative estimate must be added huge
investments by terminal operators on equipment. The amount being spent by ports is
probably close to the GNP of a country such as Egypt. Alone this year, $700 Million
worth of investments at other ports has been chronicled. This is only a sample of the
information that gets published – much more is being spent by large and small ports
alike.
3.7 Changes in Information Technology
3.7.1 As a result of fallout of 9/11 incident a number of new technologies have been
introduced to help the implementation of International Ship & Port Security code in
18
various countries. Now, ships tend to have GPS systems which install a satellite station
on a ship. Similarly the use of radio frequency identification (RFID) is gaining ground in
logistics and transport planning and optical character recognition (OCR) is being used
quite cleverly in terminals to speed up the processing of containers in and out.
3.7.2 In latest generation Port, optimization software is giving operators new
opportunities to enhance their asset value. As a result, port planning software have
been developed which enable port operators to discover and overcome any operational
problems before they start. Singapore‘s unchallenged position as a global transport hub
can largely be put down to its geographic good fortune at a cross-road of world trade,
but its astonishing throughput capacity is empowered by complex and innovative
software managing operations at the port. At the heart of this, are PSA‘s Computer
Integrated Terminal Operations System (CITOS) and Portnet. Together, these two
integrated real-time e-commerce systems control all of PSA‘s colossal container-moving
operations world-wide, from booking tug and berth applications to all the way through
stevedoring, loading trucking, tracking and ship-planning and to final billing. As a sign of
how accurate container software-controlled system works is demonstrated by the PSA
Singapore Terminal system which process one truck every 25 seconds and remotely
operates yard cranes at the state-of-the-art Pasir Panjang Terminal. To meet the future
requirements and to ensure its continued smooth handling, PSA has embarked on an
upgradation programme to further streamline CITOS to CITOS21, making use of new
technology.
3.8 Challenges ahead for Indian Ports
3.8.1 In order to meet the challenges emanating from intense global competition,
advancement information & communication technology, technological changes in
shipping and related sectors coupled with stiff demands from trade, ports in India are
required to gear-up themselves by modernizing the port infrastructure, enhancing the
quality of service and increasing the productivity level at par with International
standards.

19
CHAPTER - 4
OVERVIEW OF PORT SECTOR IN INDIA
4.1 Introduction
4.1.1 The developments in International Port and Shipping Sector raise both threats
and opportunities to the Indian Port and Shipping Sector. Indian Ports and Shipping are
becoming increasingly competitive among themselves in India and abroad. On the other
hand, it has opened up new opportunities to deliver quality service of international
standards. Keeping in view the above, an overview of the Indian port sector has been
made which is divided into two parts i.e., Overview of the Major Ports and that of Non-
major ports
4.1.2 During 2009-10, the Major and the Non-major ports in India accomplished a total
cargo throughput of 849.89 million tonnes reflecting an increase of 14.27% over 2008-
09 compared to a marginal increase of 2.5% in 2008-09. The growth in cargo handled
at Major and Non-major ports in 2009-10 was 5.76% and 35.44% respectively
compared to 2.16% and 3.31% achieved in of 2008-09. The robust overall growth in
India‘s seaborne cargo traffic in 2009-10 reflects fairly strong recovery in India‘s growth
during the course of 2009-10. Further analysis of the performance upto 2009-10 for
major & non-major ports is made in the following paragraphs:
4.2 Major Ports – An Overview
4.2.1 A noteworthy feature of the performance of India‘s port traffic during the years
2002-08 in particular has been its much higher growth compared to corresponding
growth in world seaborne trade. To a large extent, the strong growth of India‘s
seaborne cargo traffic reflected buoyancy in India‘s overall Gross Domestic product
(GDP) growth and robust growth in merchandise trade in recent years. As a result,
growth in India‘s seaborne cargo throughput during 2002-08 outstripped growth in both
world trade and output. In the face of uncertain global market conditions and more
challenging domestic market environment, India‘s seaborne cargo traffic grew by a
mere 2.49 per cent in 2008-09 but recovered sharply to 14.27% in 2009-10.
20
Deceleration in the growth of cargo traffic during 2008-09 is attributed to mainly
exogenous factors rooted in global and domestic growth dynamics.
4.2.2 In order to realize this growth potential, a number of policy initiatives have been
taken during the recent past. Attention has been focused on improvement in
infrastructure, modernization of existing facilities, better logistic chain, doing away the
licensing system, more openings in the domestic retail market with entry for the world
class players, increased avenues for Special Economic Zone type of projects etc.
Canalysing system has been done away with. Indian Oil Corporation, Oil Coordination
Committee, have ceased to be the only agency for import of Petroleum crude and
products. State Trading Corporation is no longer the canalysing agent for import of
newsprint, edible oil, sugar and foodgrains. The role of Mineral & Metal Trading
Corporation as the sole canalysing agency for import of fertilizer, rock phosphate and
sulphur has been taken away. In the context of Port sector, Private Sector have been
allowed in development of Port Infrastructure – new berths are being commissioned on
BOT basis. Documentation procedures have become simple. To become globally
competitive, utmost importance has been placed on development of physical
infrastructure like roads, airports, seaports, railways in general and Port Sector in
particular. Single window concept with web based Port Community System has been
introduced in many Ports. Indian Ports, earlier developed to handle bulk and break bulk
cargo, are developing more containerized handling facilities. Development of
International Container Transhipment terminal at Cochin is in the offing. Due to
concerted efforts over the years, Jawaharlal Nehru and Chennai ports are attracting
larger number of mother vessels for containers.
4.2.3 Details of the private sector investments, port development through National
Maritime Development Programme, Traffic growth, capacity creation, overview on non-
major ports etc is given in the following paragraphs.

21
4.3 Private Sector Participation
The Government has been encouraging private sector participation in port
development since1996. The major areas which have been thrown open for
private investment, mainly on Build, Operate and Transfer (BOT) basis with
revenue sharing mechanism which include construction of cargo handling
berths, container terminals and warehousing facilities, installation of cargo
handling equipment, construction of dry-docks and ship repair facilities, etc.
The preferred route for private sector participation is through open
competitive bidding.
Foreign direct investment upto 100% is permitted for construction and
maintenance of ports and harbours.
In order to bring in uniformity and transparency in the PPP Process,
standardized RFQ, RFP and Model Concession Agreements have been put in
place by the Ministry of Shipping, Government of India.
Tariff setting Mechanism for PPP Projects have been modified to herald
upfront fixation before the projects are bid out
4.3.1 Details of PPP projects Commissioned and under implementation
At present, 22 projects with private sector participation (BOT basis or on
captive use basis) are in operation at the Major Ports at a cost of Rs 6335.50
crore and with a capacity of 132.65 million tonnes. There are 21 projects under
implementation at an estimated investment of Rs. 12648.43 crore which are
expected to add 171.45 million tonnes to the capacity at Major Ports. Details are
given at Annexure V (a) and V (b).
4.3.2 Details of PPP Projects awarded during 2009-10
The award of projects on PPP basis has gathered momentum with several
projects being awarded and several others planned for award at the Major Ports.
In the financial year 2009-10, a record of 13 projects have been awarded in the
port sector on Public Private Partnership basis in the major ports of the country
which included construction/development berths and terminals, mechanisation of

22
existing berths etc. These 13 projects envisage an investment of Rs 2653 crores
and a capacity of 65.65 million tonnes. Details are given at Annexure V (c).
4.4 National Maritime Development Programme
4.4.1 Development of Ports is an ongoing process based on the requirement of the
trade and the future projections of traffic. Projects are taken up based on the
requirement of individual ports to cater to the traffic. Recognising the catalytic role
which the maritime sector has to play in India‘s fast growing economy and in fulfilling the
trade objectives the National Maritime Development Programme (NMDP) has been
formulated by the Ministry of Shipping, Govt. of India. Under the Programme, 276
projects to be taken up for implementation over the period from 1.4.2005 to 31.3.2012
have been identified. Total investment involved under the Programme is Rs.1,00,339
crores at 2004-05 prices. Out of this, Rs. 55,804 crores is for the Port Sector and the
balance is for the Shipping and Inland Water Transport Sectors.
4.4.2 In the Major Ports, 276 projects undertaken under National Maritime
Development Programme cover the entire gamut of activities, namely
construction/upgradation of berths (76 nos.), deepening of channels (25 nos.), rail/road
connectivity projects (45 nos.), equipment upgradation/ modernization schemes (52
nos.) and other related schemes (78 nos.) for creation of backup facilities. The objective
is to upgrade and modernize the port infrastructure in India which will enable it to
benchmark its performance against global standards.
4.4.3 Based on the above exercise the projected traffic of the major Ports emerged at
the level of 615.70 million tonnes. To meet the projected traffic of 615.70 million tonnes
by 2011-12, it was estimated that capacity of around 800.41 million tonnes would be
required. After implementation of NMDP schemes, the capacity of major ports which
was 397.50 million tonnes during 2004-05 has increased to 616.73 million tonnes as on
31.03.2010. Some schemes are being implemented and some schemes are under
planning stage.

23
4.5 Port Traffic – Major ports
4.5.1 The major ports have witnessed a lot of ups and downs in the growth pattern of
traffic during the last five decades, but the thirst for upsurge in achieving the new heights
in traffic handling is still continuing. The overall compound Annual rate of Growth (CAGR)
of traffic at major ports during 1950-51 to 2009-10 has been 5.80 percent, whereas during
the post- liberalisation period i.e. from 1991-92 to 2009-10, the CAGR was 7.31 percent.
If the CAGR of traffic growth at major ports is taken into consideration for the last 5 years,
it has been 7.28 percent, whereas it is 10.73 percent if the traffic is taken for the 3 years
before the global economic recession period i.e 2008-09 & 2009-10, which is the highest
growth rate since 1960 . Details of growth rates at various period is given as under :
Year Traffic (In Million Tonnes)
CAGR* (%)
1950-1951 20.10
1959-1960 31.50 5.12
1969-1970 54.43 5.62
1979-1980 77.59 3.61
1989-1990 147.58 6.64
1999-2000 271.92 6.30
2009-2010 561.09 7.51
Period
1951-2010 60 Years 5.80
1992-2010 Post Liberalized Era 7.31
2006-2010 2006-2008
Last 5 Years Excluding recession period
7.28 10.73
20.10 31.50 54.4377.59
147.58
271.92
561.09
0.00
100.00
200.00
300.00
400.00
500.00
600.00
MIL
LIO
N T
ON
NE
S
1950-51 1959-60 1969-70 1979-80 1989-90 1999-00 2009-10
YEARS
TRAFFIC GROWTH AT MAJOR PORTS
24
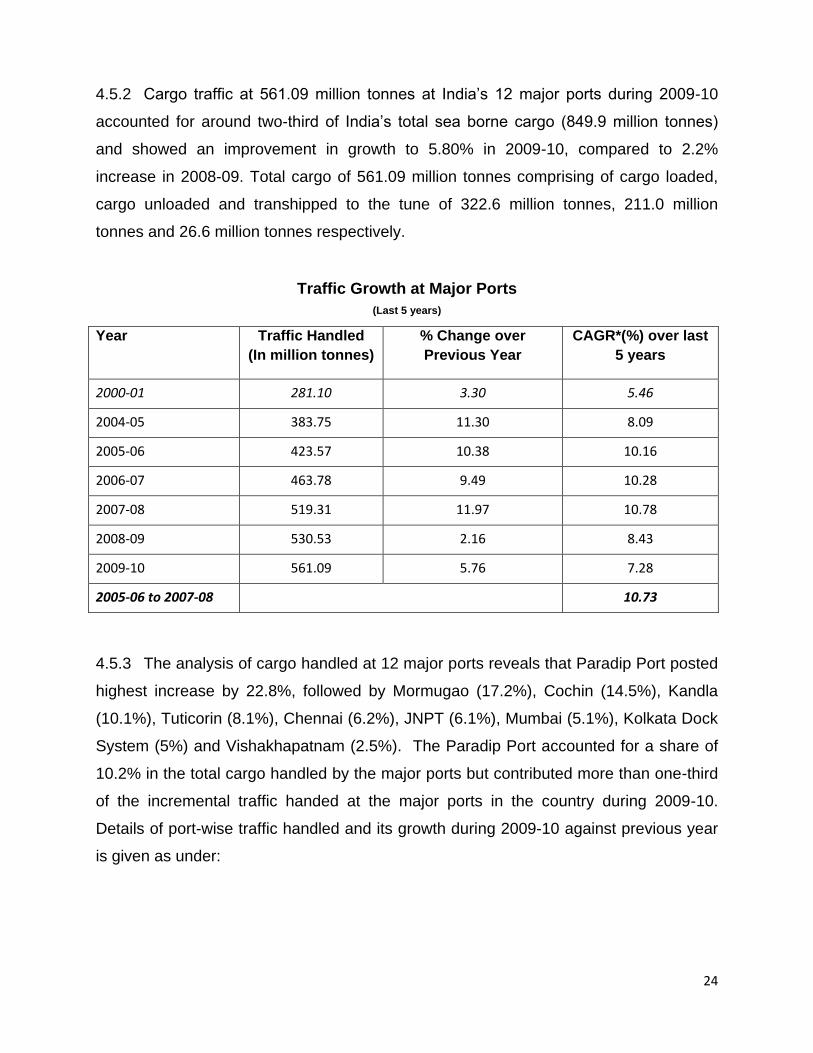
4.5.2 Cargo traffic at 561.09 million tonnes at India‘s 12 major ports during 2009-10
accounted for around two-third of India‘s total sea borne cargo (849.9 million tonnes)
and showed an improvement in growth to 5.80% in 2009-10, compared to 2.2%
increase in 2008-09. Total cargo of 561.09 million tonnes comprising of cargo loaded,
cargo unloaded and transhipped to the tune of 322.6 million tonnes, 211.0 million
tonnes and 26.6 million tonnes respectively.
Traffic Growth at Major Ports
(Last 5 years)
Year Traffic Handled
(In million tonnes)
% Change over
Previous Year
CAGR*(%) over last
5 years
2000-01 281.10 3.30 5.46
2004-05 383.75 11.30 8.09
2005-06 423.57 10.38 10.16
2006-07 463.78 9.49 10.28
2007-08 519.31 11.97 10.78
2008-09 530.53 2.16 8.43
2009-10 561.09 5.76 7.28
2005-06 to 2007-08 10.73
4.5.3 The analysis of cargo handled at 12 major ports reveals that Paradip Port posted
highest increase by 22.8%, followed by Mormugao (17.2%), Cochin (14.5%), Kandla
(10.1%), Tuticorin (8.1%), Chennai (6.2%), JNPT (6.1%), Mumbai (5.1%), Kolkata Dock
System (5%) and Vishakhapatnam (2.5%). The Paradip Port accounted for a share of
10.2% in the total cargo handled by the major ports but contributed more than one-third
of the incremental traffic handed at the major ports in the country during 2009-10.
Details of port-wise traffic handled and its growth during 2009-10 against previous year
is given as under:

25
Traffic handled at Major Ports (2009-10 & 2008-09)
( in million tonnes)
Port Traffic handled during % Variation against previous year
2009-10 2008-09
Kolkata 13.04 12.43 4.96
Haldia 33.38 41.79 (-)20.13
Paradip 57.01 46.41 22.84
Visakhapatnam 65.50 63.91 2.49
Ennore 10.70 11.50 (-)6.93
Chennai 61.06 57.49 6.20
Tuticorin 23.79 22.01 8.07
Cochin 17.43 15.23 14.45
New Mangalore 35.53 36.69 (-)3.17
Mormugao 48.85 41.68 17.19
Mumbai 54.54 51.88 5.14
Jawaharlal Nehru 60.76 57.29 6.06
Kandla 79.50 72.22 10.07
Total 561.09 530.53 5.76
4.6 Commodity- wise Traffic
4.6.1 In terms of Commodity-wise traffic at 12 major ports, the increase during 2009-10
as compared to 2008-09 has been observed in all broad categories of cargo, except
finished Fertilizer & Thermal coal. Amongst the dry bulk categories, fertilizer raw
material (dry) and Iron ore posted robust growth rates of 11.6% and 6.7% respectively.
Coking coal traffic, which is mainly imports, recorded modest growth of 4.6%.
Container traffic which largely reflects trade in manufacturing goods and components
showed significantly growth of 8.7% compared with a small increase of 1.02% in 2008-
09, while ―other cargo‖ traffic increased sharply by 20.9% in 2009-10. Commodity wise
and port wise traffic details for the year 2009-10 and 2008-09 is given in Annexure - II
4.6.2 An attempt has also been made to analyse the CAGR during last five years - for
the each commodity group. As expected the maximum CAGR of 13.05% have been
noticed in container traffic, followed by 9.80% for fertilizer and raw material and 8.18%
for the other miscellaneous cargo. The overall CAGR of the Port traffic has been
7.28%. It is pertinent to note that the last five years include the period of 2 years of
2008-09 and 2009-10 which has affected the growth of the port traffic due to global
26
slowdown and recession. If these two years are not considered and the previous three
years i.e. 2005-06 to 2007-08 are taken in to account, the CAGR reached at a level of
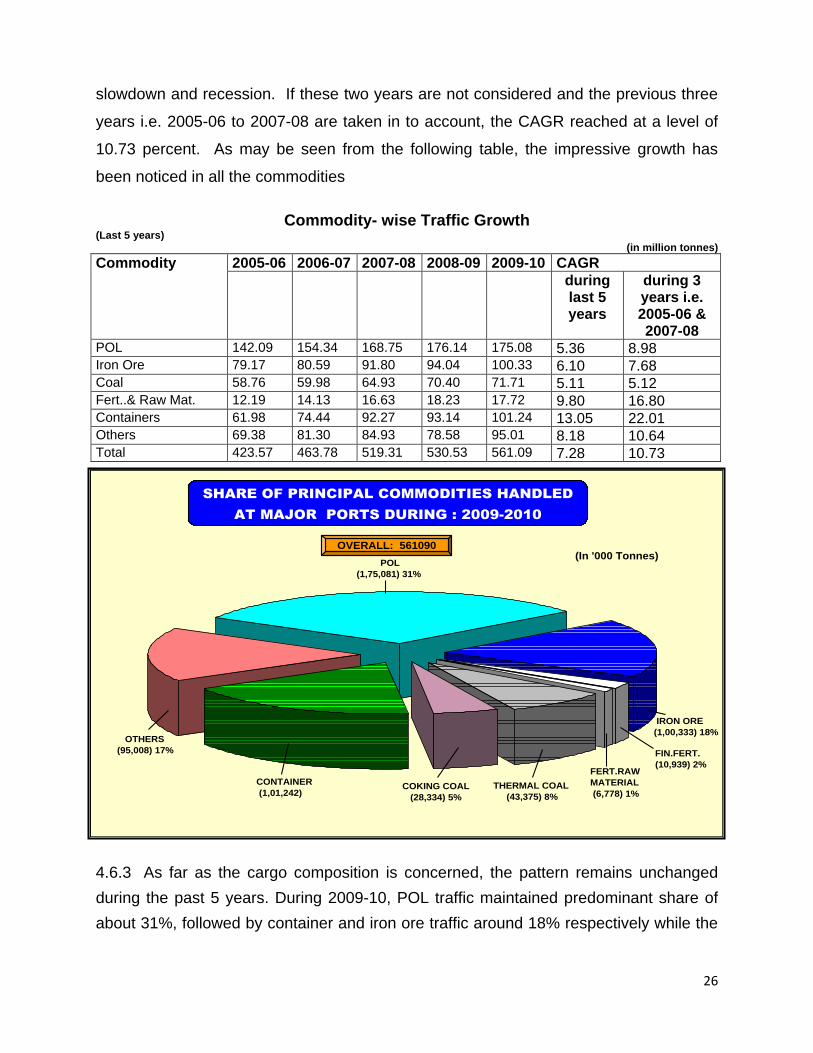
10.73 percent. As may be seen from the following table, the impressive growth has
been noticed in all the commodities
Commodity- wise Traffic Growth (Last 5 years)
(in million tonnes)
Commodity 2005-06 2006-07 2007-08 2008-09 2009-10 CAGR
during last 5 years
during 3 years i.e. 2005-06 & 2007-08
POL 142.09 154.34 168.75 176.14 175.08 5.36 8.98 Iron Ore 79.17 80.59 91.80 94.04 100.33 6.10 7.68 Coal 58.76 59.98 64.93 70.40 71.71 5.11 5.12 Fert..& Raw Mat. 12.19 14.13 16.63 18.23 17.72 9.80 16.80 Containers 61.98 74.44 92.27 93.14 101.24 13.05 22.01 Others 69.38 81.30 84.93 78.58 95.01 8.18 10.64 Total 423.57 463.78 519.31 530.53 561.09 7.28 10.73
4.6.3 As far as the cargo composition is concerned, the pattern remains unchanged
during the past 5 years. During 2009-10, POL traffic maintained predominant share of
about 31%, followed by container and iron ore traffic around 18% respectively while the
POL
(1,75,081) 31%
OTHERS
(95,008) 17%
CONTAINER
(1,01,242)
18%
COKING COAL
(28,334) 5%
FERT.RAW
MATERIAL
(6,778) 1%THERMAL COAL
(43,375) 8%
FIN.FERT.
(10,939) 2%
IRON ORE
(1,00,333) 18%
SHARE OF PRINCIPAL COMMODITIES HANDLED
AT MAJOR PORTS DURING : 2009-2010
(In '000 Tonnes)OVERALL: 561090

27
share of coal traffic was 13.8%. This clearly shows that the investment made at major
ports in modern cargo handling equipment has resulted in growth of traffic over the
years.
4.7 Port Capacity
4.7.1 For the first time, the total cargo handling capacity in the Major Ports exceeded
the actual traffic handled as on 31-3-2001 and the trend is still continuing. The capacity
in the ports as on 31.03.2010 was 616.73 million tonnes against the traffic of 561.09
million tonnes with a capacity utilization of 90.98%, which is incidentally lowest during
the last five years. It shows that the capacity available was more than the traffic at
ports, which is an ideal situation. Commodity wise and port-wise capacity as on
31-03-2010 is given in Annexure – III.
Capacity Utilisation at Ports ( Last 5 years)
Year Traffic Handled (In million tonnes)
Capacity ( in million tonnes)
Percent Utilisation (%)
2000-01 281.10 291.45 96.44
2005-06 423.57 456.20 92.85
2006-07 463.78 504.75 91.88
2007-08 519.31 532.07 97.60
2008-09 530.53 574.77 92.30
2009-10 561.09 616.73 90.98
281.10291.45
423.57456.20
463.78504.75 519.31
532.07 530.53
574.77561.09
616.73
0.00
100.00
200.00
300.00
400.00
500.00
600.00
700.00
MIL
LIO
N T
ON
NE
S
2000-01 2005-06 2006-07 2007-08 2008-09 2009-10
YEARS
CAPACITY UTILISATION
Traffic Capacity
28
4.7.2 The capacity at Major Ports was augmented through construction of new
berths/jetties/terminals and also through mechanization of cargo handling. It may noted
that at the time of formulation of National Maritime Development Programme during
2005, the capacity of all the major ports was at the level of 397.50 million tonnes and it
was estimated that the same will reach to the tune of 800.41 million tonnes by the year
2011-12. Whereas, at the time of formulation of 11th five year plan document for port
sector during March 2007, the total capacity of the Major Ports was at the level of
504.75 million tonnes against the actual traffic handled at level of 463.78 million tonnes.
4.7.3 Keeping in view the robust growth in all the sectors of economy and the GDP
growth at level of about 9%, the total capacity envisaged at Major Ports by the end of
11th plan period is at the level 1016.55 million tonnes, whereas the traffic at Major Ports
is projected at the level of 708.09 million tonnes. A number of initiatives have already
been taken by the Ministry of Shipping and rigorous monitoring are being done by
various wings of the Ministry for formulating and devising programmes for enhancement
of Port Capacity Projects. Private sector investment is being encouraged in the ports
and several Public Private Partnership projects have been envisaged for enhancement
of capacity during the 11th Five Year Plan. The following statement shows the capacity
addition and the traffic growth since 2004-05 till 2009-10:
(in million tonnes)
Items Capacity - Addition Traffic
Actual Achievement - as on 31-03-2005 - as on 31-03-2006
- - as on 31-03-2007 - as on 31-03-2008
- - as on 31-03-2009 - as on 31-03-2010
Projection - - as on 31-03-2012
-
397.50 456.20 - 58.70 504.75 - 48.55 532.07 - 27.32 574.77 - 42.70 616.73 - 41.96 1016.55 (as per XI Plan Document)
383.75 423.57 463.78 519.31 530.36 561.09 708.09
4.8 Non – Major Ports – An Overview
4.8.1 There are 176 non-major ports situated along the peninsular coast-line and sea-
islands. These ports are located in maritime states of Gujarat, Maharashtra, Goa,
Karnataka, Kerala, Tamilnadu, Andhra Pradesh, Orissa, West Bengal and Union
territories of Puducherry, Daman & Diu and Lakshadweep. Out of these ports, only a
29
few ports are well developed and provide all-weather berthing facilities for cargo
handling. In 2008-09, only 60 Ports (including ports of Andaman & Nicobar Islands)
were reported to have handled cargo traffic.
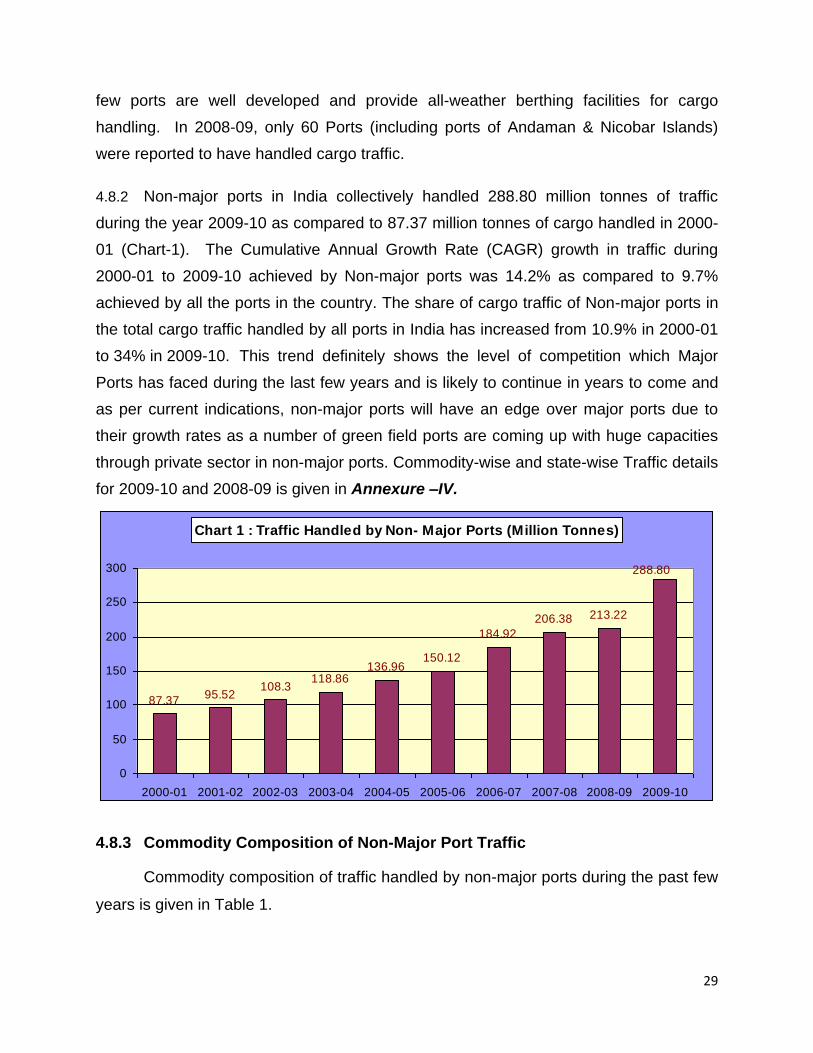
4.8.2 Non-major ports in India collectively handled 288.80 million tonnes of traffic
during the year 2009-10 as compared to 87.37 million tonnes of cargo handled in 2000-
01 (Chart-1). The Cumulative Annual Growth Rate (CAGR) growth in traffic during
2000-01 to 2009-10 achieved by Non-major ports was 14.2% as compared to 9.7%
achieved by all the ports in the country. The share of cargo traffic of Non-major ports in
the total cargo traffic handled by all ports in India has increased from 10.9% in 2000-01
to 34% in 2009-10. This trend definitely shows the level of competition which Major
Ports has faced during the last few years and is likely to continue in years to come and
as per current indications, non-major ports will have an edge over major ports due to
their growth rates as a number of green field ports are coming up with huge capacities
through private sector in non-major ports. Commodity-wise and state-wise Traffic details
for 2009-10 and 2008-09 is given in Annexure –IV.
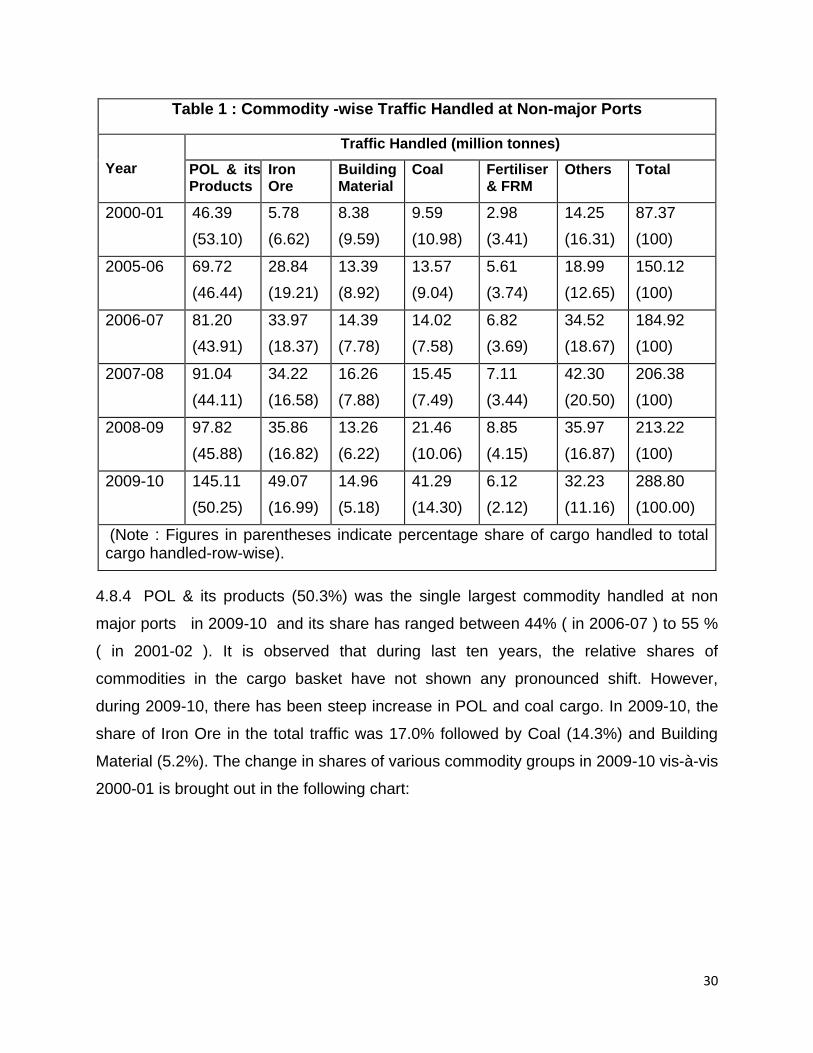
4.8.3 Commodity Composition of Non-Major Port Traffic
Commodity composition of traffic handled by non-major ports during the past few
years is given in Table 1.
Chart 1 : Traffic Handled by Non- Major Ports (Million Tonnes)
87.3795.52
108.3118.86
136.96150.12
184.92
206.38 213.22
288.80
0
50
100
150
200
250
300
2000-01 2001-02 2002-03 2003-04 2004-05 2005-06 2006-07 2007-08 2008-09 2009-10
30
4.8.4 POL & its products (50.3%) was the single largest commodity handled at non
major ports in 2009-10 and its share has ranged between 44% ( in 2006-07 ) to 55 %
( in 2001-02 ). It is observed that during last ten years, the relative shares of
commodities in the cargo basket have not shown any pronounced shift. However,
during 2009-10, there has been steep increase in POL and coal cargo. In 2009-10, the
share of Iron Ore in the total traffic was 17.0% followed by Coal (14.3%) and Building
Material (5.2%). The change in shares of various commodity groups in 2009-10 vis-à-vis
2000-01 is brought out in the following chart:
Table 1 : Commodity -wise Traffic Handled at Non-major Ports
Year
Traffic Handled (million tonnes)
POL & its Products
Iron Ore
Building Material
Coal Fertiliser & FRM
Others Total
2000-01 46.39
(53.10)
5.78
(6.62)
8.38
(9.59)
9.59
(10.98)
2.98
(3.41)
14.25
(16.31)
87.37
(100)
2005-06 69.72
(46.44)
28.84
(19.21)
13.39
(8.92)
13.57
(9.04)
5.61
(3.74)
18.99
(12.65)
150.12
(100)
2006-07 81.20
(43.91)
33.97
(18.37)
14.39
(7.78)
14.02
(7.58)
6.82
(3.69)
34.52
(18.67)
184.92
(100)
2007-08 91.04
(44.11)
34.22
(16.58)
16.26
(7.88)
15.45
(7.49)
7.11
(3.44)
42.30
(20.50)
206.38
(100)
2008-09 97.82
(45.88)
35.86
(16.82)
13.26
(6.22)
21.46
(10.06)
8.85
(4.15)
35.97
(16.87)
213.22
(100)
2009-10 145.11
(50.25)
49.07
(16.99)
14.96
(5.18)
41.29
(14.30)
6.12
(2.12)
32.23
(11.16)
288.80
(100.00)
(Note : Figures in parentheses indicate percentage share of cargo handled to total cargo handled-row-wise).

31
Commodity-wise Traffic Handled at Non-major Ports
2000-01
POL
53%
Iron Ore
7%Fertiliser&
FRM
3%
Coal
11%
Cement
Clinker
10%
Others
16%
2009-10
POL
50.2%
Iron Ore
17.0%
Fertiliser &
FRM
2.12%
Coal
14.3%
Building
Material
5.2%Others
11.16%
4.8.5 Maritime State-wise traffic handled at non-major ports during 2000-01 to 2009-10
given in Table 2:
4.8.6 The overall increase in quantity of cargo handled at non-major ports during
2000-01 to 2009-10 was mainly driven by traffic growth in Gujarat, Andhra Pradesh,
Goa and Maharashtra. The share of traffic handled by non-major ports in the maritime
states is given in Table 3.
Table 2 : Traffic Handled by Non-Major Ports – Maritime State-wise Year Traffic Handled (million tonnes)
Gujarat Mahara-shtra
AP Goa Tamil Nadu
Karnataka Others Total
2000-01 71.26
(52.59)
6.04
(-0.17)
4.84
(-18.24)
3.19
(28.11)
0.33
(63.64)
0.68
(10.29)
1.03
(-13.45)
87.37
(37.85)
2005-06 103.53
(7.69)
11.16
(-8.07)
17.67
(17.23)
11.76
(43.41)
0.71
(-16.47)
4.12
(17.38)
1.17
(11.43)
150.12
(9.61)
2006-07 131.27
(26.79)
11.58
(3.76)
18.61
(5.32)
14.31
(21.68)
0.81
(14.08)
6.56
(59.22)
1.78
(52.14)
184.92
(23.18)
2007-08 150.52
(14.66)
11.36
(-1.90)
19.29
(3.65)
12.83
(-10.35)
0.89
(9.87)
8.90
(35.67)
2.59
(45.50)
206.38
(11.60)
2008-09 152.81
(1.52)
10.42
(-8.27)
29.72
(54.07)
11.90
(-7.25)
0.90
(1.12)
4.97
(-44.16)
2.50
(-3.47)
213.22
(3.31)
2009-10 205.54
(34.51)
12.51
(20.06)
43.62
(46.77)
13.90
(16.81)
1.17
(30.00)
8.55
(72.03)
3.49
(39.60)
288.80
(35.44)
Note: (1) Figures in parentheses indicate the year-on-year percentage growth in each column. (2) ‗Others‘ consists of non-major ports in all other maritime States/UTs
32
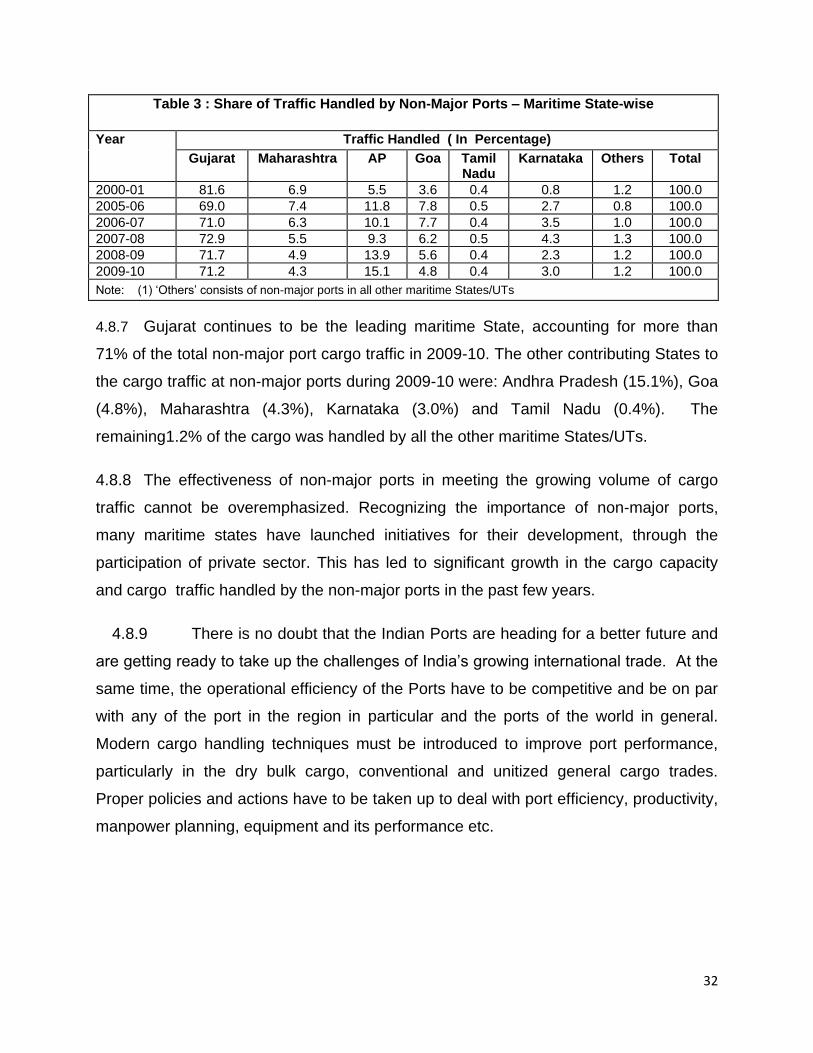
4.8.7 Gujarat continues to be the leading maritime State, accounting for more than
71% of the total non-major port cargo traffic in 2009-10. The other contributing States to
the cargo traffic at non-major ports during 2009-10 were: Andhra Pradesh (15.1%), Goa
(4.8%), Maharashtra (4.3%), Karnataka (3.0%) and Tamil Nadu (0.4%). The
remaining1.2% of the cargo was handled by all the other maritime States/UTs.
4.8.8 The effectiveness of non-major ports in meeting the growing volume of cargo
traffic cannot be overemphasized. Recognizing the importance of non-major ports,
many maritime states have launched initiatives for their development, through the
participation of private sector. This has led to significant growth in the cargo capacity
and cargo traffic handled by the non-major ports in the past few years.
4.8.9 There is no doubt that the Indian Ports are heading for a better future and
are getting ready to take up the challenges of India‘s growing international trade. At the
same time, the operational efficiency of the Ports have to be competitive and be on par
with any of the port in the region in particular and the ports of the world in general.
Modern cargo handling techniques must be introduced to improve port performance,
particularly in the dry bulk cargo, conventional and unitized general cargo trades.
Proper policies and actions have to be taken up to deal with port efficiency, productivity,
manpower planning, equipment and its performance etc.
Table 3 : Share of Traffic Handled by Non-Major Ports – Maritime State-wise
Year Traffic Handled ( In Percentage)
Gujarat Maharashtra AP Goa Tamil Nadu
Karnataka Others Total
2000-01 81.6 6.9 5.5 3.6 0.4 0.8 1.2 100.0
2005-06 69.0 7.4 11.8 7.8 0.5 2.7 0.8 100.0
2006-07 71.0 6.3 10.1 7.7 0.4 3.5 1.0 100.0
2007-08 72.9 5.5 9.3 6.2 0.5 4.3 1.3 100.0
2008-09 71.7 4.9 13.9 5.6 0.4 2.3 1.2 100.0
2009-10 71.2 4.3 15.1 4.8 0.4 3.0 1.2 100.0
Note: (1) ‗Others‘ consists of non-major ports in all other maritime States/UTs

33
CHAPTER - 5
EXISTING POLICY FRAMEWORK
5.1 Introduction
5.1.1 The Maritime sector comprises of Ports, Merchant Shipping, Ship Building/ Ship
Repair and Inland Water Transport. Capacity expansion in the Port sector is being
taken up through several development activities, namely construction/upgradation of
berths, deepening of channels, rail/road connectivity projects, equipment upgradation/
modernization schemes and other related schemes for creation of backup facilities. The
objective is to upgrade and modernize the port infrastructure in India which will enable it
to benchmark its performance against global standards.
5.1.2 With the opening up of the Indian economy, the Government of India has allowed
private sector participation in Major Ports to infuse funds, induct latest technology,
improved management practices and above all addition of capacity. Foreign direct
investment upto 100% is permitted for construction and maintenance of ports and
harbours.
5.1.3 To encourage private sector participation, the Ministry of Shipping has already
put in place guidelines for private sector participation. To ensure uniformity in bidding
documents, Model Request for Qualification (RFQ), Request for Proposal (RFP) and
Model Concession Agreement (MCA) documents have been standardized and adopted.
The Government of India constituted Public Private Partnership Appraisal Committee
(PPPAC) under the Chairmanship of Secretary, Department of Economic Affairs,
Ministry of Finance to appraise the proposals under Public Private Partnership (PPP)
mode. The tariff setting mechanism has also been modified with tariffs being set upfront
by the Tariff Authority for Major Ports (TAMP) before the projects are bid out on a
revenue sharing basis.
5.2 Policy Framework for Development and Modernisation of Ports
5.2.1 In order to augment the capacity and to enhance productivity levels at major
ports, several initiatives in the form of guidelines and policies have been taken in the
recent past as explained in the succeeding paragraphs.
34
5.2.2 Modernisation of port infrastructure is essential to benchmark the performance of
Indian ports against global standards. The Government of India has given the top
priority to the Modernisation of ports, which is undertaken through:
Construction of new berths/terminals
Various expansion/ upgradation projects for berths
Installation of new and modern equipment
Upgradation/ replacement through higher capacity of cargo handling equipment
Mechanisation of cargo handling operations
Various computer aided systems to encourage automation in port operation
Installation of Vessel Traffic Management System (VTMS) for smooth movement of vessels
Implementation of Web- based Port community system
5.3 Expansion of Berth Capacities
Public Private Partnership (PPP) mode is the preferred mode of implementation
of all new berth projects. Port projects are awarded through the competitive bidding
process on revenue sharing model. In addition, requests from port based industries for
construction and operation of facilities for captive use are being considered on a case-
to-case basis.
5.4 Mechanisation:
Mechanisation of cargo handling facilities is of utmost importance for improving
the efficiency of ports. Introduction of high capacity mechanized equipments in the form
of mobile harbour cranes/floating cranes, etc. private sector participation, with a view to
utilizing the latent capacity, as well as for augmenting the cargo handling capacity of
major ports, is encouraged which would go a long way in reducing the handling cost of
cargo at the major ports and will also increase throughput substantially.
5.5 Development and Maintenance of Channels
5.5.1 One of the most important features of modern and more efficient ports is to have
a deep drafted channel to accommodate and navigate longer vessels. Towards this
objective, ports are required to undertake capital and maintenance dredging in the
channel on a regular basis.

35
5.5.2 Presently, most of the dredging requirements of major ports particularly
maintenance dredging are met by the Dredging Corporation of India. As per present
Dredging Policy, Indian dredging companies have the right of first refusal if their offer
falls within 10% of the lowest technically qualifies bid.
5.6 Port Connectivity
5.6.1 All the Major Ports in the country are at present having both road and rail
connectivity. However, the capacity and quality of the existing connectivity require
improvement so that the flow of cargo in and out of the port is smooth and efficient. The
projects on rail and road connectivity are implemented mainly by the National Highways
Authority of India (NHAI) and the Railways, respectively. In a number of instances, the
ports have made significant financial contribution for execution of the road and rail
connectivity projects. Broad objectives for better connectivity and process of
undertaking such projects are given below:
5.6.2 Road Connectivity Projects: Each Major Port will preferably have minimum four
lane road connectivity. Such projects could be taken up through the National Highway
Authority of India (NHAI) and / or on Build, Operate and Transfer (BOT) basis and
formation of Special Purpose Vehicles comprising of all the stakeholders.
5.6.3 Rail Connectivity Projects: Each Major Port should preferably have double line
rail connectivity. Such projects could be taken up by the Railways and / or BOT basis
and through formation of Special Purpose Vehicles in which the port may be an equity
holder.
5.7 Electronic Data Interchange- Port Community System (EDI-PCS)
As a part of Electronic Data Interchange, Centralized Web Based- Port
Community System (PCS) has been introduced at all Major Ports with a view to
transforming Indian Ports to modern Ports and minimizing transaction time and cost to
Indian export-import trade. Computerization by way of Port Community System
including a uniform and centralized web based message exchange hub covering all
stakeholders including ports, customs, banks, railways, Mercantile Marine Department
(MMD), Port Health Organisation, Container Corporation of India (CONCOR) and port

36
users etc. PCS has heralded a paperless regime in Indian Port Business. PCS having
implemented in Major Ports, will be extended to non-Major Ports within a set time frame.
This will greatly reduce the scope of human interface in delivery of services, enable a
single window facility, reduce multiple transactions and ensure that the port users do not
have to visit the Port for transacting routine business. The PCS will be fully implemented
when Customs is linked with the System. The implementation of PCS with its integration
with Customs is expected to reduce a transaction cost at ports and empower Indian
Ports to join the premier league of international technologically advanced e-ports.
5.8 Land Policy:
5.8.1 Land available with the Ports is one of the essential and significant resource for
sustainable growth. It is an established practice globally for ports to allot land for
carrying out economic activity including establishing industry to ensure captive cargo to
the port, thereby enhancing the sustainability of that port. Optimum utilization of land is
a matter of continuing importance to all Ports.
5.8.2 Keeping in mind their specific requirements, ports have to leverage their assets
including their real estate within the framework of the Master Plan for the Port. Ports
may allot their land on License, short lease & long lease upto 30 years period,
depending upon the nature of the Port related activities by following competitive bidding
process. Port lands have also been used to set up Special Economic Zones (SEZ)
aimed at encouraging industrial development in and around the Port.
5.9 In addition to the existing frame-work of policy and initiatives taken up during
the recent past, the Ministry has constituted a high level committee to look into various
policies impinging upon the growth of the sector, especially in the background of
recession and down-turn and the Committee has made their recommendations on each
of the aspects of port management. These recommendations are under examination by
the Ministry and existing policies will be modified/ improvised as considered necessary.
Apart from this exercise, a number of new issues identified as future policy milestone,
required to be taken up on the priority basis for the overall development of the ports
and maritime sector are discussed elaborately in Chapter 12.

37
CHAPTER- 6
ANALYSIS OF TRAFFIC PROJECTIONS BY VARIOUS AGENCIES
Traffic Projections made by various agencies at different points of time have been
analysed for the purpose of correlation and arriving at realistic estimates.
6.1 Consolidated Perspective Plan of Major Ports (2005):
The total traffic in Major Ports was projected to be 510.47 million tonnes, 739.41 million
tonnes and 1595.07 million tonnes in 2007-08, 2011-12 and 2025-26 respectively as per
the consolidated Perspective Plan of respective Major Ports prepared by Indian Ports
Association with the assistance of Rotterdam Port Authority in the year 2005. Against the
forecast of 510.47 million tonnes for the year 2007-08, Indian Major Ports actually
achieved 519.32 million tonnes. The break-up of the above forecast as per the
Perspective Plan of each Port is as follows:
(In Million Tonnes)
NAME OF PORT 2007-08(F) 2007-08(A) 2011-12(F) 2025-26(F)
KANDLA 70.63 64.92 98.13 204.51
MUMBAI 52.38 57.04 76.13 128.61
JAWAHARLAL NEHRU 49.98 55.84 88.77 305.99
MORMUGAO 49.15 35.13 52.25 78.30
NEW MANGALORE 37.41 36.02 52.17 84.14
COCHIN 15.36 15.81 24.63 53.49
TUTICORIN 21.20 21.48 30.80 71.80
CHENNAI 54.75 57.15 64.17 87.11
ENNORE 11.30 11.56 40.64 136.40
VISAKHAPATNAM 57.70 64.60 81.70 146.80
PARADIP 45.60 42.44 71.55 125.60
KOLKATA 45.01 57.33 58.47 172.32
TOTAL 510.47 519.32 739.41 1595.07
F; forecast, A: actual

38
6.2 INDIA: Port Sector Development- Possibilities for Accelerating Growth World Bank (2007) :
6.2.1 The analysis contained in this report shows that four traffic segments viz.,
containers, coal, iron ore and petroleum, make up 80% of India‘s port traffic. This
proportion is likely to increase as container traffic grows with increasing diversification of
India‘s trade basket towards manufacturers and containerization increases its penetration
of general cargo traffic, and coal traffic grows to meet power sector and steel industry
demands for thermal and coking coal imports. Petroleum traffic also is expected to grow
not only for India‘s domestic needs but also to support a growing petroleum products
industry, with India beginning to emerge as a major refining centre for the region. Iron ore
traffic has grown in response to increases in worldwide demand. India has the third
largest reserves of iron ore after Australia and Brazil, but the long term prospects for this
traffic are less certain owing to uncertainties in the international markets as well as a
growing demand from the domestic steel industry.
6.2.2 Container traffic has been shown to exhibit a strong linkage to GDP growth and
most developing countries have demonstrated a high level of correlation between the two.
As the economy expands, and manufacturing output and purchasing power increases,
imports and exports of intermediate and finished goods, which are typically containerize,
would increase. The trend promises to be a large driver for India‘s containerized cargo in
the future. In addition, the containerization level in India at 68% is still low compared to
international levels of around 80% and increased penetration of containerization will also
push traffic volumes and growth rates. Container demand is forecast to grow from the
current 6.5 million TEUs in 2008-09 to about 21 million TEUs by 2015.
6.2.3 As regards to the combined traffic of thermal and coking coal, India presently
imports about 8% of its coal consumption of about 370 million tonnes, however port traffic
also includes coastal movement of domestic thermal coal from the east coast to the west
coast ports. Presently, over 75% of the coal traffic is concentrated along the east coast as
a result of the location of both mining centres and steel making capacity in the east.
Thermal coal traffic at India‘s major ports grew to 43.4 million tonnes in 2009-10. The

39
power sector consumes two thirds of domestic production, with the remainder being for
the steel and cement industries. The large power generation capacity enhancements
proposed will drive a growing level of coal imports and coastal movements. Thermal coal
traffic at the ports is slated to increase by more than two and a half times by 2015 and
much of the increase is expected in the western region ports due to an expected
expansion in power sector demand there. Coking coal imports grew at almost 16% per
annum and reached to a level of 27.1 million tonnes by 2008-09 at major ports. Imports of
coking coal are expected to more than double to 53 million tons by 2015, reflecting a
growing domestic supply. The east coast ports are expected to handle over 75% of future
imports with the ports in Orissa and Andhra Pradesh barring Krishnapatnam accounting
for much of the traffic owing to steelmaking capacity being largely located in this region.
6.2.4 Iron ore traffic at Indian ports grew at 17% p.a. and major ports handled 94
million tonnes by 2008-09, accounting for almost one-fifth of the total traffic. This was
comprised of iron ore exports of 89.4million tons, and coastal traffic of 4.6 million tonnes.
Iron ore traffic is expected to increase to 164 million tonnes by 2015. Ports in Orissa and
Andhra Pradesh (excepting Krishnapatnam) are expected together account for 42% of
this traffic by 2015. However, these projections are subject to some uncertainty due to
slowdown in global demand, growing domestic needs and possible curbs on exports of
high grade ore.
6.2.5 Crude oil and petroleum products (POL) consumption in India has been growing
at 3.7% per year. This is expected to pick up and the reason it has lagged the economy‘s
high growth rates is the introduction of newer more fuel efficient cars that have reduced
the fuel consumption per vehicle kilometre. In future, the fuel economy savings are likely
to persist as the older fuel inefficient fleet is retired. Crude oil imports and petroleum
product shipments are forecast to grow 310 million tonnes in 2015, which may turn out to
be conservative. Also, large refinery capacity developments in Jamnagar have turned
India into an exporter of petroleum products and this too will add to port capacity demand
for both crude and petroleum products. About half of the crude imports in 2015 are
expected to come through unloading terminals in Gujarat, and the Gujarat ports are also
expected to account for about half of petroleum product shipments.
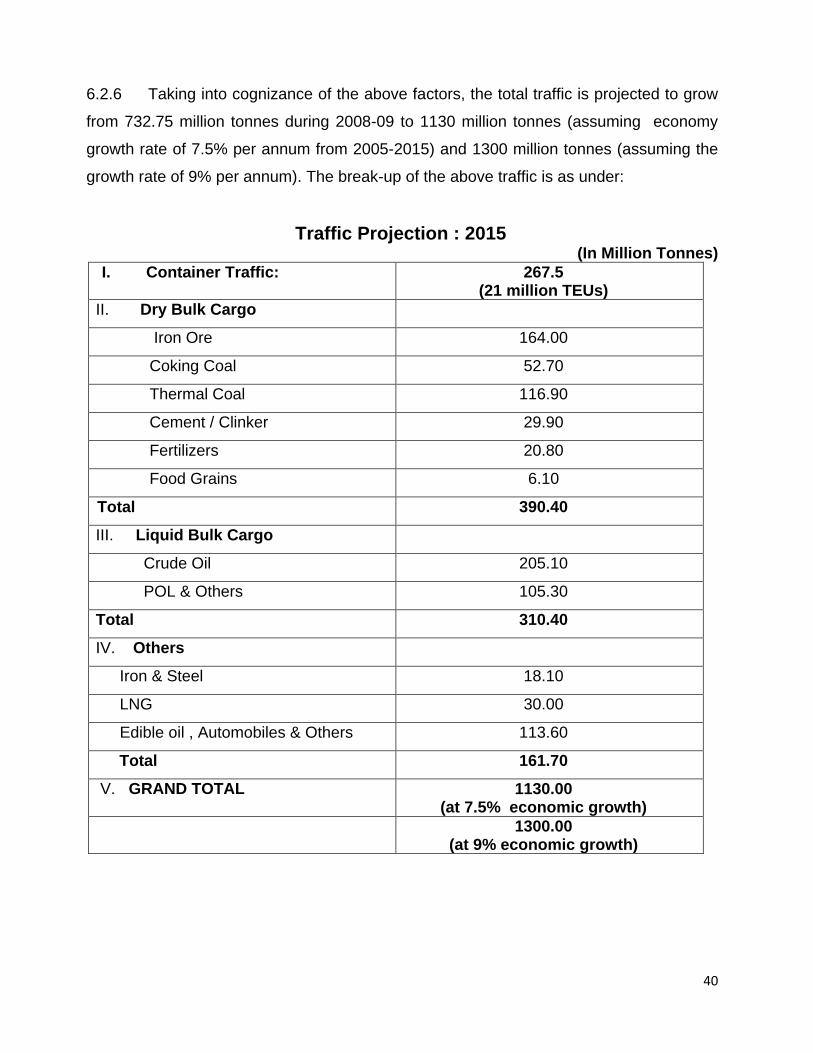
40
6.2.6 Taking into cognizance of the above factors, the total traffic is projected to grow
from 732.75 million tonnes during 2008-09 to 1130 million tonnes (assuming economy
growth rate of 7.5% per annum from 2005-2015) and 1300 million tonnes (assuming the
growth rate of 9% per annum). The break-up of the above traffic is as under:
Traffic Projection : 2015 (In Million Tonnes)
I. Container Traffic: 267.5 (21 million TEUs)
II. Dry Bulk Cargo
Iron Ore 164.00
Coking Coal 52.70
Thermal Coal 116.90
Cement / Clinker 29.90
Fertilizers 20.80
Food Grains 6.10
Total 390.40
III. Liquid Bulk Cargo
Crude Oil 205.10
POL & Others 105.30
Total 310.40
IV. Others
Iron & Steel 18.10
LNG 30.00
Edible oil , Automobiles & Others 113.60
Total 161.70
V. GRAND TOTAL 1130.00 (at 7.5% economic growth)
1300.00 (at 9% economic growth)
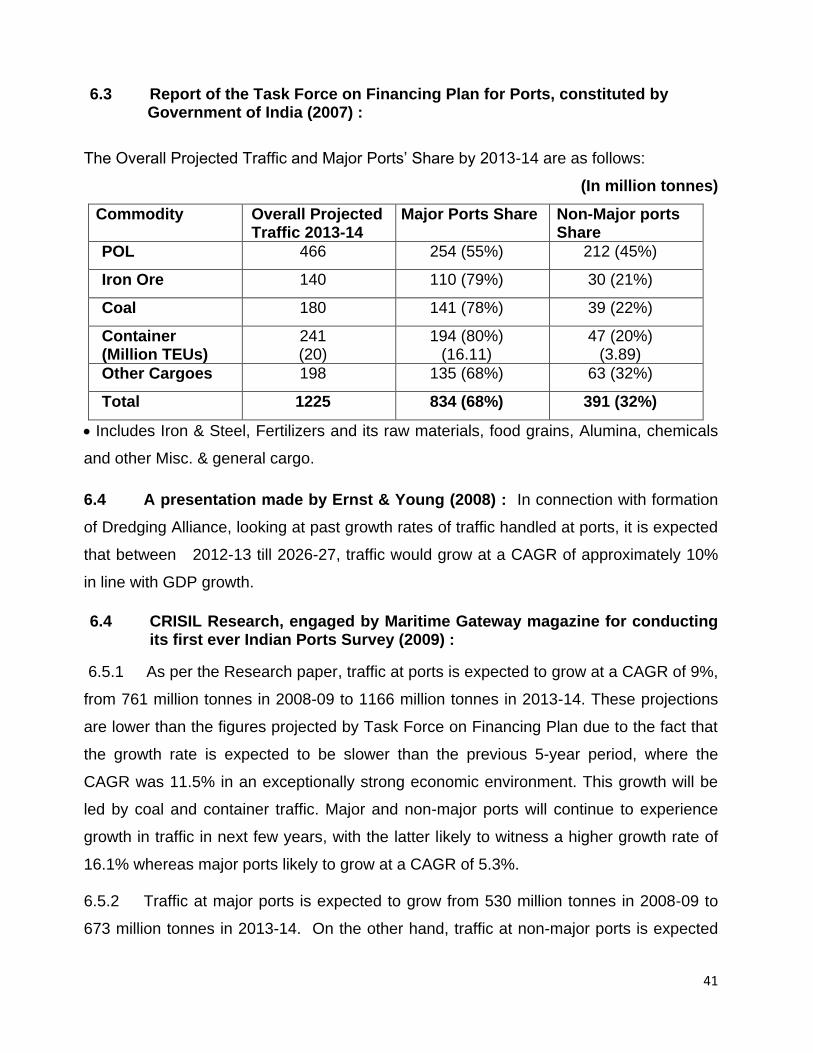
41
6.3 Report of the Task Force on Financing Plan for Ports, constituted by Government of India (2007) :
The Overall Projected Traffic and Major Ports‘ Share by 2013-14 are as follows:
(In million tonnes)
Commodity Overall Projected Traffic 2013-14
Major Ports Share Non-Major ports Share
POL 466 254 (55%) 212 (45%)
Iron Ore 140 110 (79%) 30 (21%)
Coal 180 141 (78%) 39 (22%)
Container (Million TEUs)
241 (20)
194 (80%) (16.11)
47 (20%) (3.89)
Other Cargoes 198 135 (68%) 63 (32%)
Total 1225 834 (68%) 391 (32%)
Includes Iron & Steel, Fertilizers and its raw materials, food grains, Alumina, chemicals
and other Misc. & general cargo.
6.4 A presentation made by Ernst & Young (2008) : In connection with formation
of Dredging Alliance, looking at past growth rates of traffic handled at ports, it is expected
that between 2012-13 till 2026-27, traffic would grow at a CAGR of approximately 10%
in line with GDP growth.
6.4 CRISIL Research, engaged by Maritime Gateway magazine for conducting its first ever Indian Ports Survey (2009) :
6.5.1 As per the Research paper, traffic at ports is expected to grow at a CAGR of 9%,
from 761 million tonnes in 2008-09 to 1166 million tonnes in 2013-14. These projections
are lower than the figures projected by Task Force on Financing Plan due to the fact that
the growth rate is expected to be slower than the previous 5-year period, where the
CAGR was 11.5% in an exceptionally strong economic environment. This growth will be
led by coal and container traffic. Major and non-major ports will continue to experience
growth in traffic in next few years, with the latter likely to witness a higher growth rate of
16.1% whereas major ports likely to grow at a CAGR of 5.3%.
6.5.2 Traffic at major ports is expected to grow from 530 million tonnes in 2008-09 to
673 million tonnes in 2013-14. On the other hand, traffic at non-major ports is expected
42
to grow from 231 million tonnes in 2008-09 to 493 million tonnes in 2013-14. In terms of
share in total traffic, non-major ports are expected to grow from 30% in 2008-09 to 41%
by 2013-14.
6.5.3 In 2008-09, petroleum oil lubricants (POL) constituted the largest chunk of traffic
at Indian Ports. With a minor decrease in its share from 37% to 34%, it may still continue
to form the largest share in total traffic. From 2008-09 to 2013-14, the share of iron ore
traffic is expected to marginally decline from 17% to 15%, while the share of coal is seen
increasing from 13% to 16%. Container traffic is likely to witness a slight rise from 14% to
15%.
6.5.4 Keeping in mind the increased demand for refined products, due to the healthy
growth in the economy, domestic refineries have planned capacity additions to the tune of
47 mtpa between 2008-09 and 2013-14. Further, India is emerging as an important player
for export of refined products, which is expected to lead to higher product movement. All
these factors are seen driving POL traffic at Indian Ports over the next few years. Hence,
POL traffic at Indian Ports will grow at a CAGR of 7.1% from 277.8 million tonnes in 2008-
09 to 392 million tonnes in 2013-14. POL traffic at major ports is likely to grow at a CAGR
of 8% from 176 million tonnes in 2008-09 to 258 million tonnes in 2013-14. At non-major
ports, POL traffic is set to at a CAGR of 12.4%, from 102 million tonnes in 2008-09 to 183
million tonnes in 2013-14. The share of non-major ports in the total POL traffic is
expected to go up from 37% to 42% in the same period; the nearly doubling of the
Jamnagar refinery of Reliance Industries will lead this increase in the share of the total
POL traffic. The non-major port of Sikka is expected to handle higher crude/product traffic
in the years to come.
6.5.5 Domestic demand for steel is set to rise with many infrastructure initiatives being
undertaken in the country. Consequently, the demand for coking coal may go up. On the
other hand, the rise in capacities of coal-based power utilities and cement plants is set to
drive the demand for thermal coal. Total traffic of coal at Indian Ports is expected to grow
at a CAGR of 14%, from 95.4 million tonnes in 2008-09 to 184 million tonnes by 2013-14.
6.5.6 Coal-handling facilities at the operational non-major ports of Gangavaram,
Krishnapatnam, Karaikal and upcoming ports of Dighi, Dhamra and Gopalpur are
43
expected to lead the increase in coal traffic at non-major ports. Coal traffic handled at
non-major ports is likely to grow at a CAGR of 28.1%, from 20.8 million tonnes in 2008-09
to 71.9 million tonnes in 2013-14. With the shift, coal traffic at major ports may get
reduced by 4%, from 71.1 million tonnes to 58 million tonnes during the same period.
The share of non-major ports in the total coal traffic is likely to increase from 23% in 2008-
09 to 55% in 2013-14
6.5.7 With the rise in iron ore demand from key ore-consuming countries like China,
Korea and Japan, Indian iron ore export is expected to continue to grow over the next few
years. Total iron ore traffic to grow at a CAGR of 7.6%, from 131 million tonnes in 2008-
09 to 181 million tonnes in 2013-14.
6.5.8 Traffic at non-major ports is likely to grow by 18.9%, from 37 million tonnes in
2008-09 to 88 million tonnes by 2013-14. On the other hand, ore traffic at major ports is
expected to decline by 0.2% in the same period, from 94 million tonnes to 93.2 million
tonnes. Higher growth rate at non-major ports can be attributed to the traffic increasingly
being handled at the ports of Gangavaram and Krishnapatnam and the upcoming ports
of Dhamra and Dighi. The share of non-major ports in the ore handling traffic is expected
to go up, from 28% in 2008-09 to 46% in 2013-14.
6.5.8 Growth of container traffic mainly depends on items like capital and engineering
goods, textiles and food items, which are essentially carried in containers. The demand
for capital and engineering goods is expected to increase with infrastructure development.
This, coupled with higher exports of food grains and textile, is likely to drive container
traffic in the country. Further, increase in containerisation of bulk cargo is expected over
the next few years. Container traffic at Indian ports is seen growing at a CAGR of 10.9%,
from 106.4 million tonnes in 2008-09 to 171.4 million tonnes in 2013-14.
6.5.9 Container traffic at major ports is likely to grow at a CAGR of 7.9% from 93
million tonnes to 136 million tonnes in this 5 year period. Container traffic at non-major
ports is expected to grow at a higher CAGR of 26.4%, from 13 million tonnes to 43 million
tonnes from 2008-09 to 2013-14. Container capacities coming up at the non-major ports
of Pipavav, Hazira, Kulpi. Dighi and Krishnapatnam will primarily drive the higher

44
container traffic growth at non-major ports. The share of non-major ports in the total
containerised traffic is expected to rise from 12.5% to 24% in the 5-year period. If the
assumed CAGR of 9% as indicated by CRISIL is taken into consideration, the traffic by
2020 by major & non-major ports will reach at the level of 1955.49 million tonnes.
6.5.10 Assumption : India‘s merchandise trade in 2009-10 was $455 billion while
services are likely to be about 4210 billion (assuming services exports of 4115 billion and
imports of $95 billion). The world trade in 2020 is estimated to be of 494 trillion. The
target of increasing our share to 55 of the world trade would result in enhancing our
international trade from $665 billion to $3106 billion in the next 10 years requiring CARG
(compound annual rate of growth) of 16.66%.
6.6 Department of Commerce, Ministry of Commerce & industry (2010) :
6.6.1 Department of Commerce, Ministry of Commerce & Industry has forwarded a
brief statistical analysis of port projections which was prepared by FIEO. In this
connection, a co-relation between the total export traffic and total port traffic has been
made and found to be statistically positive (+0.98) nearing perfect co-relation [Pearson‘s
Co-efficient of Co-relation].
6.6.2 Assuming that the market share of Indian exports as per the Ministry of
Commerce will be 5% of the global market in 2020, projections have been made between
2011 and 2020 giving a CAGR of 16.66%. Basing our data on actual figures between
total trade and port traffic over 2004-05 to 2008-09 and taking the ratio thereof in terms of
the arithmetic mean, projections for port traffic for 2011-2020 were made which are as
given in Table-B. The growth was in the range of 16.61% to 16.70%. This figure also
coincides with the assumptions above.
6.6.3 Table-B (below) gives actual percentage growth of any year vis-à-vis the
previous year. This actual percentage growth varies from 17.88% to 29.3% during years
2004-05, 2005-06, 2006-07, 2007-08 and 2008-09. Corresponding actual percentage
growth in Port Traffic for the same years varies from 2.1% to 11.9%. Table A also gives
ratios between total trade and port traffic for the same years. Actual mean value of these
ratios is 700.

45
TABLE - A
Year (x) In million $ Total Trade
Annual %age
Increase
(Y) Port Traffic in million tonnes
Annual %age
increase
X/Y (Ratio)
2004-05 195023 383.74 508.29
2005-06 252256 29.3% 423.56 10.37% 595.56
2006-07 312149 23.74% 463.78 9.4% 673.05
2007-08 414786 32.88% 519.15 11.9% 798.97
2008-09 488991 17.88% 530.39 2.1% 921.94
Arithmetic Mean 699.56
Y = x____ Say = X____ 699.56 700
6.6.4 Table B (below) gives projected total trade 2009-10 onwards upto 2019-20 on
an assumed growth 2 16.665 (CARG). Table C also gives corresponding projected
increases in port traffic from 2009-10 to 2019-20. These increases are based upon the
actual figures of Total Trade and Traffic during the past years : 2004-05, 2005-06, 2006-
07, 2007-08 and 2008-09. Having made projections based on actual figures of past
known years as given above, the percentage increases in Port Traffic of any year
compared to the preceding year were calculated which work out to be ranging from
16.61% to 16.70%.
TABLE – B
2009-2010 Total 455 billion $ (Export + Import). Compound Annual Rate of Growth [CARG] @ 16.66%
Year Billions $
2010-11 530.80
2011-12 619.20
2012-13 722.30
2013-14 842.60
2014-15 982.90
2015-16 1146.60
2016-17 1337.60
2017-18 1560.40
2018-19 1620.30
2019-20 2123.50

46
Port Projections 2011-2020
Year Total Trade / Arithmetic Mean
(In 4 million)
Total Traffic (In million tonnes)
Annual Increase %
2009-10 4550/7 650
2010-11 5308/7 758 16.61%
2011-12 6192/7 884 16.62%
2012-13 7223/7 1031 16.62%
2013-14 8426/7 1303 16.68%
2014-15 9829/7 1404 16.70%
2015-16 11466/7 1638 16.66%
2016-17 13376/7 1910 16.60%
2017-18 15604/7 2229 16.70%
2018-19 18203/7 2600 16.64%
2019-20 21235/7 3033 16.65%
6.7 CONCLUSION :
6.7.1 Keeping in view the projections made by various agencies at different point of
time for different period as outlined above, the Ministry of Shipping has embarked upon
the assessment of traffic and capacity by various methods / through obtaining information
from primary sources and the realistic projections made in the subsequent chapter.

47
CHAPTER – 7
TRAFFIC PROJECTIONS AND CAPACITY ESTIMATION FOR MAJOR
PORTS AND MARITIME STATES UPTO 2020
7.1 To arrive at realistic Traffic Projections and Capacity Estimation for Port sector,
this chapter is divided into three parts i.e., Assessment of the demand of supply as
made by various Ministries/ Departments/ Studies form time to time for different time
series, projections for Major & Non-major ports by statistical model upto the year 2020
and Projections received from the Major Ports and Maritime States based on their
Capacity addition plans, hinterland development and indication given by various user
agencies upto 2020 .
7.2 The GDP is one of the important aspects which will have impact on various
sectors. IMF in its release on World Economic Outlook update in July-2010 has
projected India‘s GDP growth at 9.4% in 2010 and 8.4% in 2011. The following table
provides the real growth during the various plan periods from 1st five year Plan till the
11th Plan up-to 2008-09.
(Figures In %) Plan Period Real Income Growth Sectoral Growth Report
Targeted
Growth in
terms of
Plan
target
Actual
Growth
Agriculture Industry Services
1st Plan 1951-56 NNP 2.1 3.5 2.9 5.9 3.7
2nd Plan 1956-61 NNP 4.5 4.2 3.2 6.4 4.6
3rd Plan 1961-66 NNP 5.6 2.8 -0.5 6.8 5.0
4th Plan 1969-74 NNP 5.7 3.2 2.6 3.7 4.0
5th Plan 1974-79 GDP 4.4 4.7 3.4 6.3 5.5
6th Plan 1980-85 GDP 5.2 5.5 5.5 6.2 5.4
7th Plan 1985-90 GDP 5.0 5.6 3.4 7.5 7.4
8th Plan 1992-97 GDP 5.6 6.5 3.9 8.0 7.9
9th Plan 1997-02 GDP 6.5 5.5 2.0 4.6 8.1
10th Plan 2002-07 GDP 7.9 7.7 2.3 9.2 9.3
11th Plan 2007-12 GDP 9.0 7.8 4.0 10-11 9-11
Source: 11th Five Year Plan. (Actual Growth rate in terms of GDP at factor cost) Petroleum Planning and Analysis cell.

48
(A) Assessment of Supply & demand Forecast for Various Sectors
7.3 Each Ministry/Department has its projections of various activities. Based on the
available inputs like India Hydro Carbon Vision 2025, Vision Coal 2025, Basic statistics
on Indian Petroleum and Natural Gas (2008-09), the Outlook for Global Container Ports
and Terminals – DREWRY June 2009, Report on Working Group on Port Sector 11th
five year plan, Assessment made for various cargo like Coal, POL, Gas, Containers etc
are tabulated in the following paragraphs. These assessments are based on the vision
of various Ministries/ Departments, which will have an impact on the Indian Maritime
Perspective Plan since Maritime Industry is dependant on the user Industries and the
demand for the Maritime Industry is derived demand and not direct demand.
7.4 Energy Security
7.4.1 Long term projection for energy requirements depends on assumption on growth
of the economy, growth of population, the pace at which commercial energy replaces
non commercial energy, process of energy conservation, process of energy efficiency
as well as changes in life style and in the society. Electrical Energy consumption at 0.3
MTOE (Million Tons of Oil Equivalent) in 1997 is extremely low compared to world per
capita consumption of 1.5 MTOE. China‘s per capita energy consumption is 0.7 MTOE
and North America consumption is 6.3 MTOE.
7.4.2 There is direct correlation between Electricity Consumption and GDP growth. To
accelerate growth, energy consumption has to be increased. The electrical energy
requirement during year 2031-32 is expected to be 3880 BU (billion Units) under 8%
GDP growth rate. The electricity requirement can be made by various alternative fuels
like Coal, Nuclear, Hydro, Gas, Oil and Renewable.

49
7.4.3 The following fuel mix scenario is developed for sources of electricity generation.
(Million Tonnes)
Year Total energy
generation
(BKWHR)
@8%GDP
Hydro Nuclear Wind Thermal Fuel need
Coal N. Gas Oil
2011-12 1097 179 59 8 851 493 25 8
2016-17 1524 226 110 12 1176 656 41 9
2021-22 1983 283 206 15 1479 814 58 12
2026-27 2866 400 301 19 2146 1133 89 14
2031-32 3880 500 441 24 2915 1478 134 17
Source: Coal Vision 2025
7.4.4 The projections are based on certain assumption like exploitation of full Hydro
potential, capacity addition of nuclear and wind forms and generation of electricity using
lignite also. The energy requirement is projected based on the elasticity obtained from
Time series data and cross country data with reference to GDP which gives % change
in energy consumption for 1% change in GDP. The total primary commercial energy
requirement is give below.
Total Primary Commercial Energy Requirement (TPCE)
Year Population in Million
GDP (Rs. Crores @ 1993-94 prices)
Total Primary energy supply (MTOE) GDP @ 8% Falling
elasticity No change
2011-12 1197 2621137 537 508
2016-17 1275 3851310 718 684
2021-22 1347 5858837 961 901
2026-27 1411 8314688 1248 1234
2031-32 1468 12217005 1620 1633
Source: Coal Vision 2025
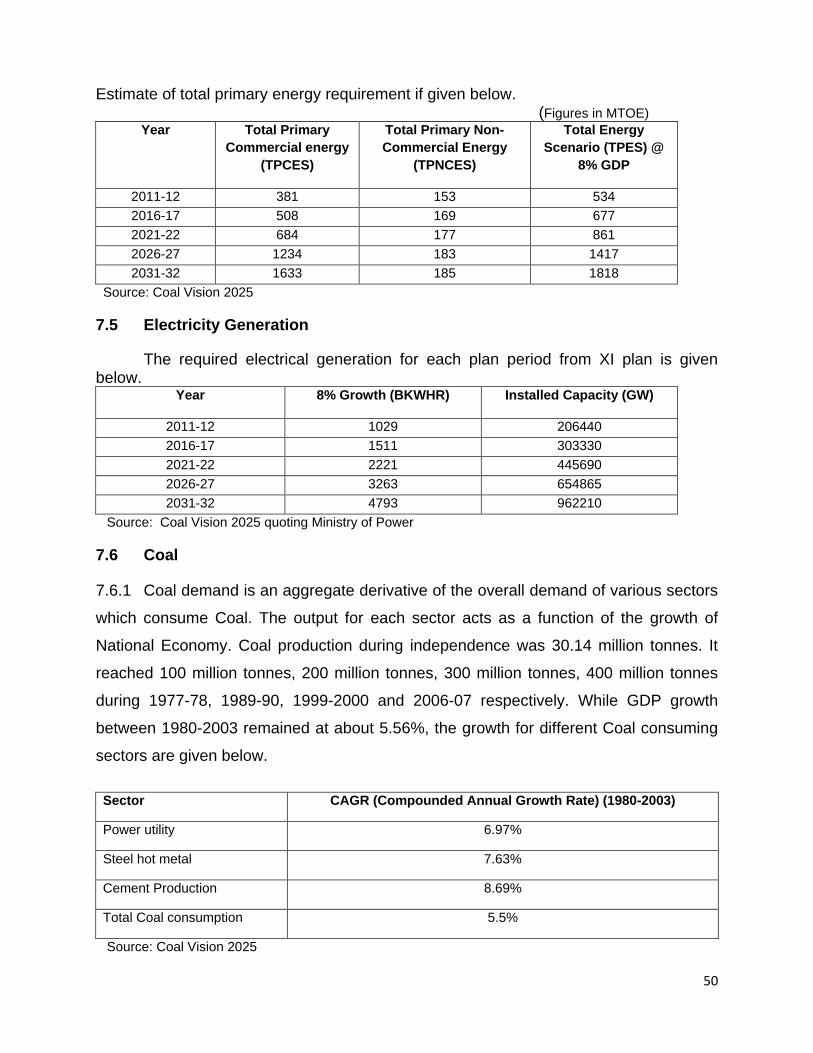
50
Estimate of total primary energy requirement if given below. (Figures in MTOE)
Year Total Primary
Commercial energy
(TPCES)
Total Primary Non-
Commercial Energy
(TPNCES)
Total Energy
Scenario (TPES) @
8% GDP
2011-12 381 153 534
2016-17 508 169 677
2021-22 684 177 861
2026-27 1234 183 1417
2031-32 1633 185 1818
Source: Coal Vision 2025
7.5 Electricity Generation
The required electrical generation for each plan period from XI plan is given below.
Year 8% Growth (BKWHR) Installed Capacity (GW)
2011-12 1029 206440
2016-17 1511 303330
2021-22 2221 445690
2026-27 3263 654865
2031-32 4793 962210
Source: Coal Vision 2025 quoting Ministry of Power
7.6 Coal
7.6.1 Coal demand is an aggregate derivative of the overall demand of various sectors
which consume Coal. The output for each sector acts as a function of the growth of
National Economy. Coal production during independence was 30.14 million tonnes. It
reached 100 million tonnes, 200 million tonnes, 300 million tonnes, 400 million tonnes
during 1977-78, 1989-90, 1999-2000 and 2006-07 respectively. While GDP growth
between 1980-2003 remained at about 5.56%, the growth for different Coal consuming
sectors are given below.
Sector CAGR (Compounded Annual Growth Rate) (1980-2003)
Power utility 6.97%
Steel hot metal 7.63%
Cement Production 8.69%
Total Coal consumption 5.5%
Source: Coal Vision 2025

51
The assessed Coal demand projection at 8% of GDP is given below. Sector Year CAGR %
Share 2010-11 2011-12 2016-17 2021-22 2024-25
Power (Utility) 403.68 427.16 552.56 698.53 804.03 5.22 63.46
Power Captive (Fertilizer)
41.48 44.33 62.96 90.04 111.60 7.23 8.81
Steel 51.67 54.24 69.47 89.52 104.50 5.10 8.25
Cement 36.08 39.39 61.06 94.82 123.47 9.18 9.75
Brick & others 61.56 64.51 82.11 105.62 123.41 5.00 9.74
Total 594.47 629.63 828.16 1078.54 1267.01 5.62 100
Source: Coal Vision 2025
Domestic Coal Production and Demand for various plan period (Million Tonnes)
Domestic Production 11th
Plan 2011-12
12th
Plan 2016-17
13th
Plan 2021-22
14th
Plan 2024-25
Cooking Coal (washed coal) 26(13) 26(13) 35(18) 36(18)
Non-Cooking Coal 582 734 879 1012
Total Production 621 778 942 1086
Source: Coal Vision 2025
Coal Demand Projection (Million Tonnes)
Domestic Production at 8% GDP
11th
Plan 2011-12
12th
Plan 2016-17
13th
Plan 2021-22
14th
Plan 2024-25
Coking Coal 39 (16) 39(16) 48(21) 49(21)
Non-Coking Coal 582 734 879 1012
Total 621 778 942 1086
Domestic Demand at 8% GDP
11th
Plan 2011-12
12th
Plan 2016-17
13th
Plan 2021-22
14th
Plan 2024-25
Coking Coal 54 69 90 105
Non-Coking Coal 576 759 989 1162
Total 630 828 1079 1267
Gap (-) /surplus(+)
Coking -38 (29) -53 (40) -69 (52) -84 (63)
Non-Coking +6 -20* -95 -125
* Equivalent quantity of imported coal with ash content less than 10% either through
coking coal import/ CIL overseas equity. Figures in bracket indicated beneficial coal
with 17% ash level for use in steel sector.
Source: Coal Vision 2025

52
Coal Quantity wise production projection of CIL. (million tonnes)
Plan Year 11th
Plan 12th
Plan 13th
Plan 14th
Plan
Coking Coal 15 14 15 16
Non-Coking Coal (Thermal Grade) 385 482 567 627
Non-Coking Coal (Superior Grade) 73 77 73 72
Total 473 573 655 715
Source: Coal Vision 2025
7.6.2 It is estimated that 47.33% amounting to 514 million tonnes of beneficiated coal +
superior grade coal is likely to be transported through national Rail network/ Rail cum
Sea network for consumers located beyond coal field areas. The transportation of huge
volume of the countries production of about 1061 million tonnes by the end of 2024-25
will be a gigantic task as bulk of the coal has to be transported to power utility and other
industries. In order to enable this vast movement of coal, The Central electricity
Authority has identified through a study by NRSA, 90 potential sites in four states - 31 in
six districts of Gujarat, 23 in two districts of Maharashtra, 27 in eight districts of
Tamilnadu and 9 in three districts of Andhra Pradesh for development of Coastal power
projects. it is imperative that adequate handling facilities are made available in the
Maritime sector.
The share of future energy supply is given below. (In %)
Year Coal Oil Gas Hydro Nuclear
2001-02 50 32 15 2 1
2006-07 50 32 15 2 1
2011-12 53 30 14 2 1
2024-25 50 25 20 2 3
(Source: Up to 2011 from the technical note on energy (Planning Commission)) India Hydro Carbon
Vision 2025
7.6.3 Tentative coal requirement for power sector for XI plan is about 525 million
tonnes of which around 100 million tones will likely to be met through import, 840 million
tonnes during XII plan of which around 135 million tones would likely to be through

53
import and 1478 million tonnes during 2031-32, of which 300-400 million tones will be
through import.
Coal demand for the country is given below. (in million tonnes)
Year X Plan Coal vision @
8%
Hydro Carbon vision 2025
India vision 2020
EIA IEA
2011-12 620 630 - - - -
2016-17 780 828 - - - -
2021-22 981 1079 - - - -
2024-25 1126 1267 1402 659*
971**
611‘
481‖
-
*Best case scenario ** Business as usual ‗ High ― Low
EIA (Energy Information Administration)
IEA (International Energy Agency)
Source: Coal Vision 2025
7.6.4 Expansion of electricity if based only on Coal based development shall result
in total demand for Coal from 175 MTOE in 2004-05 to 1080 MTOE in 2031-32. The
Coal requirement for this various between 415 million tonnes in 2004-05 to 2700 million
tonnes in 2031-32. If 5% generation due to Coal usage with poor quality of Coal
deteriorates then the requirement shall be about 2842 million tonnes by 2031-32. This
will call for a massive import of Coal. It is estimated to import about 300-600 million
tonnes of coal and for this there is necessity for development of Port facilities and
transport logistics.
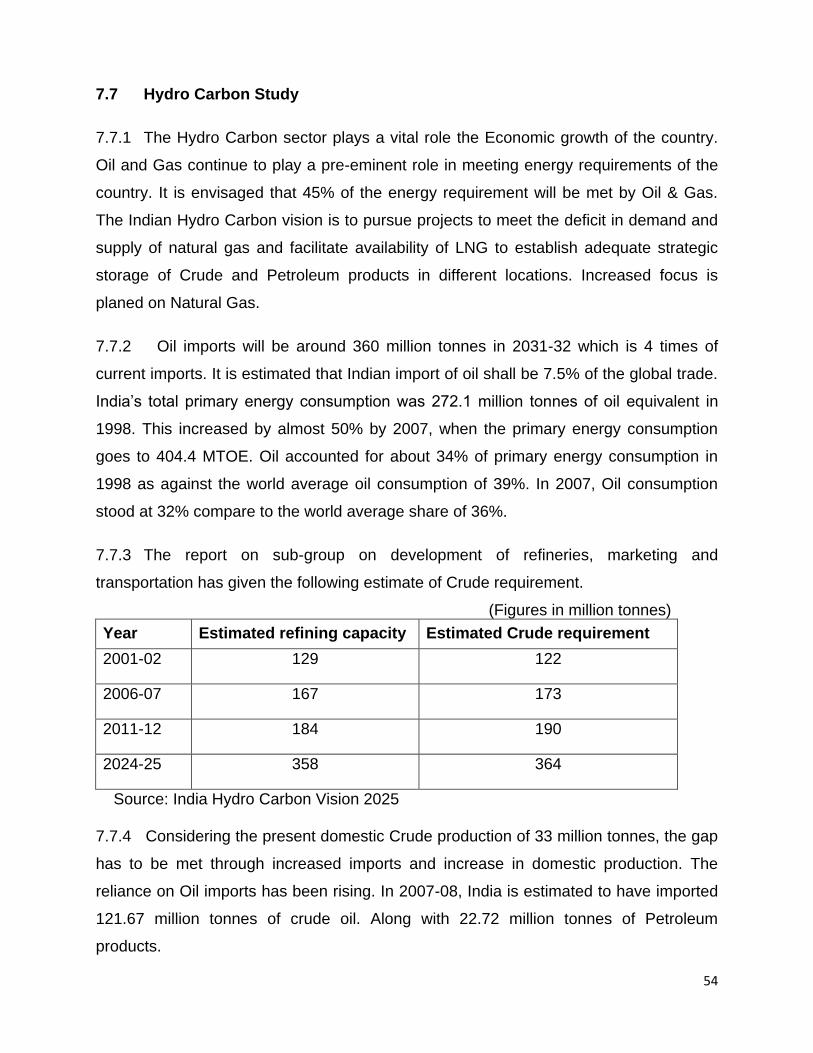
54
7.7 Hydro Carbon Study
7.7.1 The Hydro Carbon sector plays a vital role the Economic growth of the country.
Oil and Gas continue to play a pre-eminent role in meeting energy requirements of the
country. It is envisaged that 45% of the energy requirement will be met by Oil & Gas.
The Indian Hydro Carbon vision is to pursue projects to meet the deficit in demand and
supply of natural gas and facilitate availability of LNG to establish adequate strategic
storage of Crude and Petroleum products in different locations. Increased focus is
planed on Natural Gas.
7.7.2 Oil imports will be around 360 million tonnes in 2031-32 which is 4 times of
current imports. It is estimated that Indian import of oil shall be 7.5% of the global trade.
India‘s total primary energy consumption was 272.1 million tonnes of oil equivalent in
1998. This increased by almost 50% by 2007, when the primary energy consumption
goes to 404.4 MTOE. Oil accounted for about 34% of primary energy consumption in
1998 as against the world average oil consumption of 39%. In 2007, Oil consumption
stood at 32% compare to the world average share of 36%.
7.7.3 The report on sub-group on development of refineries, marketing and
transportation has given the following estimate of Crude requirement.
(Figures in million tonnes)
Year Estimated refining capacity Estimated Crude requirement
2001-02 129 122
2006-07 167 173
2011-12 184 190
2024-25 358 364
Source: India Hydro Carbon Vision 2025
7.7.4 Considering the present domestic Crude production of 33 million tonnes, the gap
has to be met through increased imports and increase in domestic production. The
reliance on Oil imports has been rising. In 2007-08, India is estimated to have imported
121.67 million tonnes of crude oil. Along with 22.72 million tonnes of Petroleum
products.

55
7.7.5 It is observed that while the requirement for Coal for energy supply is about
50% an on average, the Gas requirement is likely to increase to 20%. The following
table gives the installed capacity and refine Crude throughput.
(Figures in 000 tons)
Refinery Installed Capacity
Refined Crude throughput
1.4.2009 2004-05 2005-06 2006-07 2007-08 2008-09
Public Sector 105468 93107 96946 108172 112541 112223
Private Sector 72500 34309 33163 38379 43562 48549
Total 177968 127416 130109 146551 156103 160772
Source: Basic Statistics on Indian Petroleum & Natural Gas, MOPNG, GOI
Public Sector Undertaking/ Pvt. Companies
Imports/ Exports of Crude Oil and Petroleum products. (Figures in 000 tons)
Imports
Year 2005-06 2006-07 2007-08 2008-09
Crude Oil 99409 111502 121672 126155
LNG 5060 6810 8320 8060
Petroleum Products 6181 8005 9485 7950
Total 117909 135972 152453 154500
Exports
Petroleum Products 23461 33624 40339 36932
Net Imports
Crude Oil 99409 111502 121672 128155
LNG 5060 6810 8320 8060
Petroleum Products -10021 -15694 -18318 -18647
Grand Total 94448 102348 111634 117568
Source: Basic Statistics on Indian Petroleum & Natural Gas, MOPNG, GOI Petroleum Planning/ Research Cell

56
Projected Demand for Petroleum products (Figures in Million Tonnes)
Year EIA reference Case (2004)
IEA (2004) IHV-2025 (2000)
India Vision 2020 BAU case(2002)
Working Group 10
th
Plan (2001-02)
Power and Energy Division (2003-04)
Base year 2001 (105 MMT)
2000 (102 MMT)
1998-99 (91 MMT)
1997 (83MMT)
2001-02 (108MMT)
2001-02 (108MMT)
2004-05 119 122 132 121 119 124
2009-10 139 145 175 153 139 147
2014-15 157 171 226 193 164 174
2019-20 219 201 288 245 195 207
2024-25 264 230 368 309 232 246
2029-30 - 271 - - 276 292
EIA (Energy Information Administration) IEA (International Energy Agency) IHV (India Hydro Carbon Vision 2020-25) Source: Integrated Energy Policy Committee report
7.8 Natural Gas
7.8.1 Natural Gas accounted for about 8% of energy mix in 1998, much lower than the
world average share of Gas at 23%. In 2007, Natural Gas accounted for about 9%.
Similarly as against the domestic gas supply is 65 MMSCMD (million standard cubic
meter per day). The gap as projected in the following table has to be met by increased
imports and by increase in domestic production.
(Figures in MMSCMD)
Year Gas Requirement
2001-02 151
2006-07 231
2011-12 313
2024-25 391
Source: Report of the sub-group on development and utilization of natural gas 1999 quoted in India Hydro Carbon Vision 2025

57
Projected Demand for Natural Gas products (Figures In MMSCMD)
Year EIA reference Case (2004)
IEA (2004)
IHV-2025 (2000)
India Vision 2020 BAU case (2002)
Working Group 10
th
Plan (2001-02)
Power and Energy Division (2003-04)
Base year 2001 (62) 2000 (67) 1999-00 (110)
1997 (59) 2003-04 (85)
2001-02 (81)
2004-05 74 91 195 89 93 98
2009-10 93 140 277 115 145 134
2014-15 124 189 329 149 226 183
2019-20 155 228 358 194 356 249
2024-25 195 259 391 258 488 340
2029-30 - 295 - - 667 -
EIA (Energy Information Administration) IEA (International Energy Agency) IHV (India Hydro Carbon Vision 2020-25) Source: Integrated Energy Policy Committee report 7.8.2 Tentative Coal requirement during the 11th plan is about to 525 Million tonnes
which is projected to increase to 840 million tonnes during 12th plan. Considering the
best possible scenario, it is assessed that in the year 2024-25, 1061 million tonnes of
raw coal could be produced. By 2031-32 Coal requirement is estimated as 1478 Million
tonnes. A progressive decline in share of energy from Coal based power stations from
current level of 85% in 2003-04 to 78% in 2031-32 is projected. The demand for Oil for
the year 2025 varies from 231 million tonnes for the best case scenario of India Vision
2020 to 368 million tonnes by India Hydro Carbon Vision 2025. Similarly the demand for
Gas varies from 150 MMSCMD in low case of EIA to 738 MMSCMD in high output
growth of IRADE-PWC for the year 2024-25. It is expected that 20% of power will be
generated with Gas by 2031-32. The end user of Gas shall grow between 7-8% of GDP.
All projected fertilizer (Urea) capacity would be generated only through GAS. Gas
requirement assumes progressive increase to 20%.
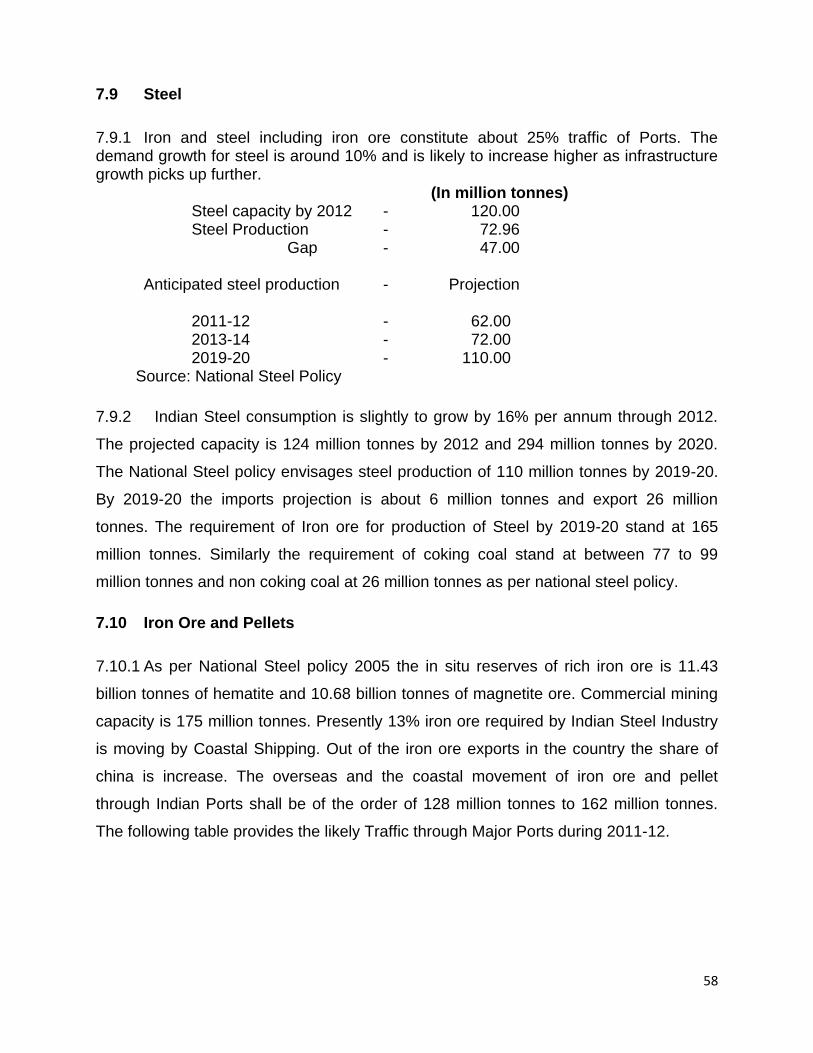
58
7.9 Steel
7.9.1 Iron and steel including iron ore constitute about 25% traffic of Ports. The demand growth for steel is around 10% and is likely to increase higher as infrastructure growth picks up further.
(In million tonnes) Steel capacity by 2012 - 120.00 Steel Production - 72.96 Gap - 47.00 Anticipated steel production - Projection 2011-12 - 62.00 2013-14 - 72.00 2019-20 - 110.00
Source: National Steel Policy
7.9.2 Indian Steel consumption is slightly to grow by 16% per annum through 2012.
The projected capacity is 124 million tonnes by 2012 and 294 million tonnes by 2020.
The National Steel policy envisages steel production of 110 million tonnes by 2019-20.
By 2019-20 the imports projection is about 6 million tonnes and export 26 million
tonnes. The requirement of Iron ore for production of Steel by 2019-20 stand at 165
million tonnes. Similarly the requirement of coking coal stand at between 77 to 99
million tonnes and non coking coal at 26 million tonnes as per national steel policy.
7.10 Iron Ore and Pellets
7.10.1 As per National Steel policy 2005 the in situ reserves of rich iron ore is 11.43
billion tonnes of hematite and 10.68 billion tonnes of magnetite ore. Commercial mining
capacity is 175 million tonnes. Presently 13% iron ore required by Indian Steel Industry
is moving by Coastal Shipping. Out of the iron ore exports in the country the share of
china is increase. The overseas and the coastal movement of iron ore and pellet
through Indian Ports shall be of the order of 128 million tonnes to 162 million tonnes.
The following table provides the likely Traffic through Major Ports during 2011-12.
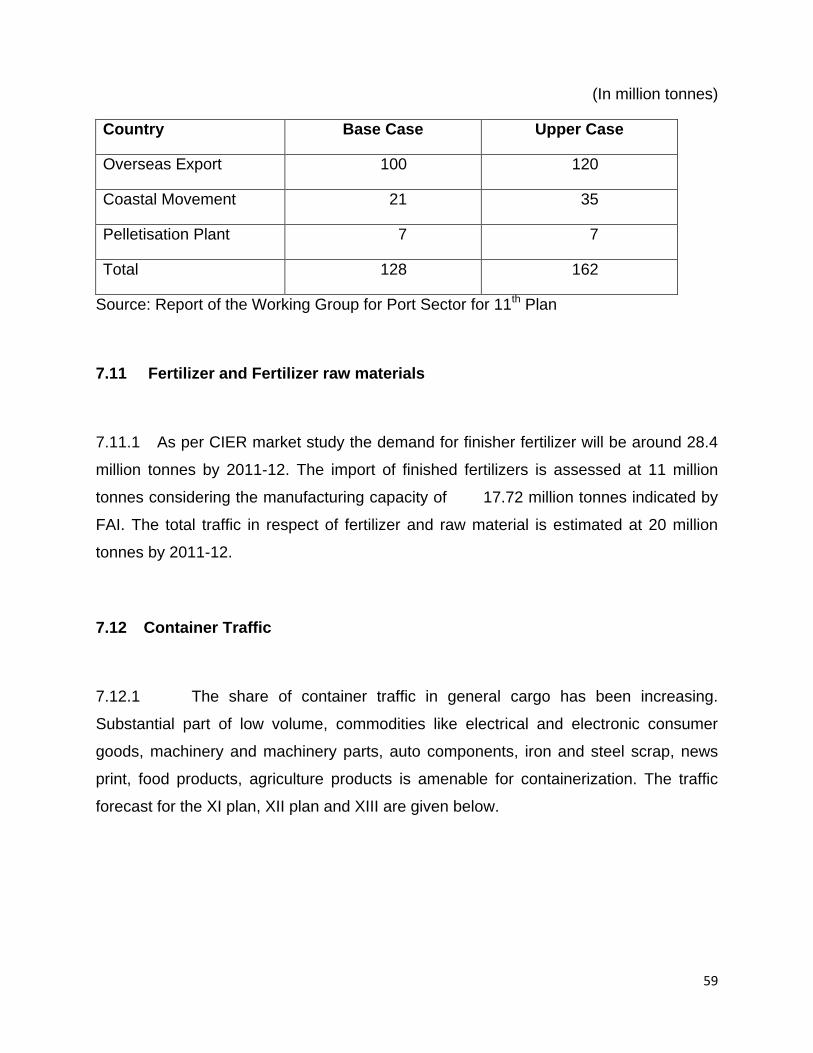
59
(In million tonnes)
Country Base Case Upper Case
Overseas Export 100 120
Coastal Movement 21 35
Pelletisation Plant 7 7
Total 128 162
Source: Report of the Working Group for Port Sector for 11th Plan
7.11 Fertilizer and Fertilizer raw materials
7.11.1 As per CIER market study the demand for finisher fertilizer will be around 28.4
million tonnes by 2011-12. The import of finished fertilizers is assessed at 11 million
tonnes considering the manufacturing capacity of 17.72 million tonnes indicated by
FAI. The total traffic in respect of fertilizer and raw material is estimated at 20 million
tonnes by 2011-12.
7.12 Container Traffic
7.12.1 The share of container traffic in general cargo has been increasing.
Substantial part of low volume, commodities like electrical and electronic consumer
goods, machinery and machinery parts, auto components, iron and steel scrap, news
print, food products, agriculture products is amenable for containerization. The traffic
forecast for the XI plan, XII plan and XIII are given below.

60
Container Traffic Projection
Name of the
Agency
Container Traffic forecast in Million TEUs
2006-07 2011-12 2016-17 2021-22
CII
Low @4.5%
growth in GDP
5.19 8.58 14.23
Normal 5.48 9.97 18.21
High @ 6.5%
growth
5.79 11.58 23.27
Rites vision
2020 (April
2001)
Excluding
transshipment
4.5 8.0 12.0 18.0
Including
transshipment
7.6 13.6 20.6 30.6
10th Plan
working group,
GOI (2001)
5.51
IPA, 2004
Excluding
transshipment
Low @ 7%GDP
5.06 9.24 13.66 19.52
Excluding
transshipment
High @ 8%GDP
5.87 10.9 15.68 23.88
Including
transshipment
Low @ 7%GDP
5.66 10.84 16.08 22.32
Including
transshipment
Low @ 8%GDP
5.87 7.71 18.08 26.26
Level of penetration by CII – 45 to 65% Level of penetration by IPA -64 to 74% Source: IPA Report
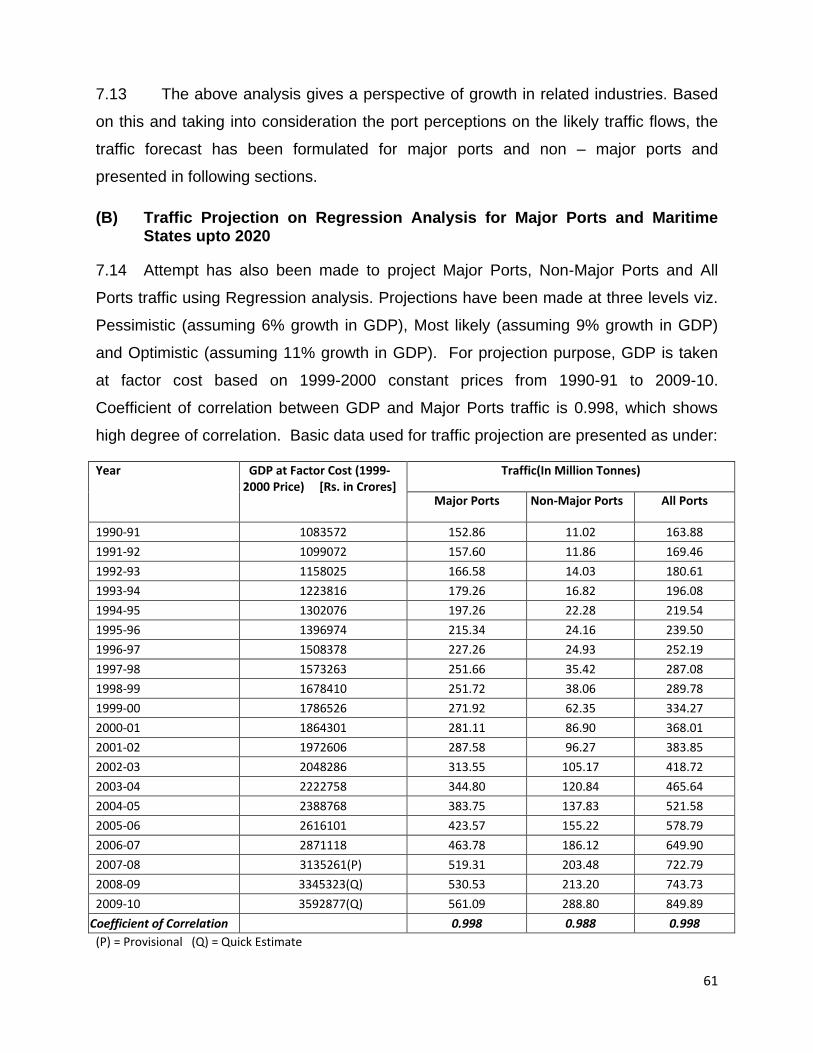
61
7.13 The above analysis gives a perspective of growth in related industries. Based
on this and taking into consideration the port perceptions on the likely traffic flows, the
traffic forecast has been formulated for major ports and non – major ports and
presented in following sections.
(B) Traffic Projection on Regression Analysis for Major Ports and Maritime States upto 2020
7.14 Attempt has also been made to project Major Ports, Non-Major Ports and All
Ports traffic using Regression analysis. Projections have been made at three levels viz.
Pessimistic (assuming 6% growth in GDP), Most likely (assuming 9% growth in GDP)
and Optimistic (assuming 11% growth in GDP). For projection purpose, GDP is taken
at factor cost based on 1999-2000 constant prices from 1990-91 to 2009-10.
Coefficient of correlation between GDP and Major Ports traffic is 0.998, which shows
high degree of correlation. Basic data used for traffic projection are presented as under:
Year GDP at Factor Cost (1999-2000 Price) [Rs. in Crores]
Traffic(In Million Tonnes)
Major Ports Non-Major Ports All Ports
1990-91 1083572 152.86 11.02 163.88
1991-92 1099072 157.60 11.86 169.46
1992-93 1158025 166.58 14.03 180.61
1993-94 1223816 179.26 16.82 196.08
1994-95 1302076 197.26 22.28 219.54
1995-96 1396974 215.34 24.16 239.50
1996-97 1508378 227.26 24.93 252.19
1997-98 1573263 251.66 35.42 287.08
1998-99 1678410 251.72 38.06 289.78
1999-00 1786526 271.92 62.35 334.27
2000-01 1864301 281.11 86.90 368.01
2001-02 1972606 287.58 96.27 383.85
2002-03 2048286 313.55 105.17 418.72
2003-04 2222758 344.80 120.84 465.64
2004-05 2388768 383.75 137.83 521.58
2005-06 2616101 423.57 155.22 578.79
2006-07 2871118 463.78 186.12 649.90
2007-08 3135261(P) 519.31 203.48 722.79
2008-09 3345323(Q) 530.53 213.20 743.73
2009-10 3592877(Q) 561.09 288.80 849.89
Coefficient of Correlation 0.998 0.988 0.998
(P) = Provisional (Q) = Quick Estimate

62
7.15 Based on the above data, traffic projections by regression analysis for the period
2010-11 to 2019-20 for Major Ports, Non-Major Ports and All Ports are as under:
Year Traffic Projection (In Million Tonnes)
Major Ports Non-Major Ports All Ports
P (assuming 6% growth
in GDP)
M (assuming
9% growth inGDP)
O (assuming
11% growth in
GDP)
P (assuming 6% growth
in GDP)
M (assuming
9% growth in
GDP)
O (assuming 11% growth in GDP)
P (assuming 6% growth
in GDP)
M (assuming 9%
growth in GDP)
O (assuming 11% growth in GDP)
2010-11 614 632 644 283 294 301 896 926 945
2011-12 652 691 718 306 331 347 959 1022 1065
2012-13 693 756 799 332 371 398 1025 1126 1197
2013-14 736 826 890 359 415 455 1095 1240 1345
2014-15 782 902 991 387 462 517 1169 1365 1508
2015-16 830 986 1103 417 514 587 1247 1500 1690
2016-17 881 1077 1227 449 571 664 1331 1648 1891
2017-18 936 1176 1364 483 633 750 1419 1809 2115
2018-19 993 1284 1517 519 700 845 1513 1985 2363
2019-20 1055 1402 1687 557 774 951 1612 2176 2638
Note: P = Pessimistic, M = Most likely, O = Optimistic
0
500
1000
1500
2000
2500
2010-11 2011-12 2012-13 2013-14 2014-15 2015-16 2016-17 2017-18 2018-19 2019-20
YEAR
TR
AF
FIC
(MIL
LIO
N T
ON
NE
S)
Major Ports Non-Major Port All Ports

63
(C ) Traffic Projections and Capacity Estimation for Major Ports and Maritime
States upto 2020
7.16 Based on the information received from the Major Ports and Maritime states, an
attempt has been made to assess the existing traffic and capacity vis-à-vis the projected
traffic and capacity at the end of 11th five year plan ( 2011-12), by the terminal year of
12th five year plan (2016-17) and at the end of 2019-20. In this context, traffic and
capacity estimation separately for major ports, non- major ports and the same for all
Indian ports has also been made, which are as follows :-
7.17 Major Ports – Traffic Forecast and Capacity Estimation
Kolkata Port Trust
7.17.1 Details for Kolkata Dock System (KDS) and Haldia Dock Complex (HDC)
separately is given as under:
Kolkata Dock System (KDS)
7.17.2 The projected traffic for KDS at the end of 11th Five Year Plan is 13.69
million tonnes and in 2019-20 is 83.41 million tonnes against the existing traffic 13.05
million tonnes (2009-10). The existing capacity at KDS is 15.90 million tonnes (as on
31-3-2010-excluding 4.5 million tones capacity at anchorage), which has been planned
to increase to 89.0 million tonnes in 2016-17 and 108.6 million tonnes in 2019-20. The
major developments through which capacity and traffic will increase are: - installation of
trans-loading facilities, commissioning of Diamond Harbour Container Terminal by
2013-14, and development of port facilities at Saugor Island by 2014-15. The projects of
Diamond Harbour and Saugor will be completed in phases for which capacity has
differently shown. Further capacity will also be enhanced due to induction of container
handling and other equipment. The commodity wise projected traffic vis-à-vis capacity
is given below :

64
(in million tonnes)
COMMODITY
TRAFFIC CAPACITY
Existing 31.03.2010
2011-12 2016-17 2019-20 Existing 31.03.2010
2011-12 2016-17 2019-20
POL 0.72 0.79 3.20 3.70 3.96 4.60 7.50 7.50
IRON ORE 0.25 0.30 3.50 6.50 - - 4.00 6.80
COAL 0.01 - 17.50 20.95 - - 19.00 21.00
CONTAINER TEUs
6.65 (0.378)
7.60 (0.608)
20.37 (1.629)
27.46 (2.197)
5.50 (0.458)
5.50 (0.440)
34.50 (2.760)
41.50 (3.320)
OTHERS 5.42 5.00 21.40 24.80 6.44 7.00 24.00 31.80
TOTAL 13.05 13.69 65.97 83.41 15.90 17.10 89.00 108.60
Haldia Dock Complex (HDC)
7.17.3 The traffic projected for Haldia Dock Complex the end of 12th Five year
Plan (2016-17) is 66.71 million tonnes and in 2019-20 is 74.178 million tonnes against
the existing traffic of 33.38 million tonnes (2009-10). The existing capacity of HDC is
46.70 million tonnes (as on 31.3.2010) which has been projected to be increased to
85.00 million tonnes in 2016-17 and 91.00 million tonnes in 2019-20. The major share
of increase has been projected in case of coal traffic from the existing 22.6% to 42.7%
in 2016-17and 2019-20. The major developments through which the traffic and capacity
of the Dock will increase are :- commissioning of two (2) riverine jetties by 2012-13, and
development of port facilities at Haldia Dock II (Shalukhali) by 2014-15, construction of
other four riverine jetties, mechanization of cargo handling facilities

65
(in million tonnes)
COMMODITY
TRAFFIC CAPACITY
Existing 31.03.2010
2011-12 2016-17 2019-20 Existing 31.03.2010
2011-12 2016-17 2019-20
POL 9.30 7.92 19.25 20.00 17.00 17.00 22.00 22.00
IRON ORE 7.68 6.00 8.50 11.50 6.00 6.00 9.00 9.50
COAL 7.55 12.20 28.50 31.00 7.00 15.00 33.50 38.00
CONTAINER TEUs
2.07 (0.124)
2.83 (0.227)
3.22 (0.258)
3.42 (0.273)
4.00 (0.333)
4.00 (0.222)
4.00 (0.222)
4.00 (0.222)
OTHERS 6.78 5.53 7.24 11.16 12.70 12.70 16.50 17.50
TOTAL 33.38 34.48 66.71 74.18 46.70 54.70 85.00 91.00
Paradip Port Trust
7.17.4 The traffic of Paradip Port Trust is projected to increase from the existing level of
57.01 million tonnes (2009-10) to 100.00 million tones in 2016-17 at the end of 12th Five
Year Plan and 120.00 million tonnes in 2019-20. The major increase has been
projected in case of POL traffic whose share has been projected to increase from 20.4%
(in 2009-10) to 35% in 2016-17 and 40% in 2019-20, mainly due to transfer of POL
(crude) through Paradip - Haldia Pipeline. The capacity of Paradip Port is projected to
increase from 76.5 million tonnes (as on 31.3.2010) to 157.50 million tonnes in 2016-17
and 157.50 million tonnes in 2019-20. The major developments through which the
capacity and traffic of the Port have been planned to increase are :- Deepening of
channel by 2011-12, construction of one oil jetty by 2013; development of multi purpose
berth on BOT basis by 2014, and installation of 2nd and 3rd SPM by M/s Indian oil
Corporation by 2012-13, modernization of iron ore berth by 2011-12 etc. The existing
capacity vis-à-vis traffic are as under :-
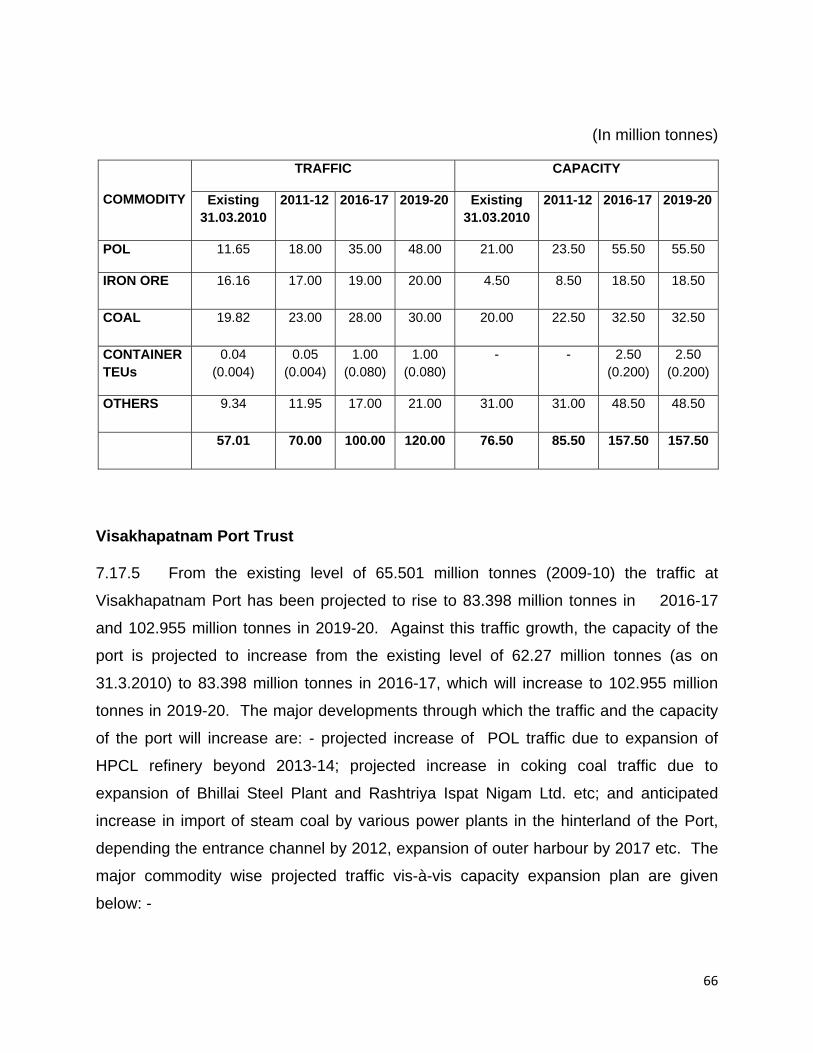
66
(In million tonnes)
COMMODITY
TRAFFIC CAPACITY
Existing 31.03.2010
2011-12 2016-17 2019-20 Existing 31.03.2010
2011-12 2016-17 2019-20
POL 11.65 18.00 35.00 48.00 21.00 23.50 55.50 55.50
IRON ORE 16.16 17.00 19.00 20.00 4.50 8.50 18.50 18.50
COAL 19.82 23.00 28.00 30.00 20.00 22.50 32.50 32.50
CONTAINER TEUs
0.04 (0.004)
0.05 (0.004)
1.00 (0.080)
1.00 (0.080)
- - 2.50 (0.200)
2.50 (0.200)
OTHERS 9.34 11.95 17.00 21.00 31.00 31.00 48.50 48.50
57.01 70.00 100.00 120.00 76.50 85.50 157.50 157.50
Visakhapatnam Port Trust
7.17.5 From the existing level of 65.501 million tonnes (2009-10) the traffic at
Visakhapatnam Port has been projected to rise to 83.398 million tonnes in 2016-17
and 102.955 million tonnes in 2019-20. Against this traffic growth, the capacity of the
port is projected to increase from the existing level of 62.27 million tonnes (as on
31.3.2010) to 83.398 million tonnes in 2016-17, which will increase to 102.955 million
tonnes in 2019-20. The major developments through which the traffic and the capacity
of the port will increase are: - projected increase of POL traffic due to expansion of
HPCL refinery beyond 2013-14; projected increase in coking coal traffic due to
expansion of Bhillai Steel Plant and Rashtriya Ispat Nigam Ltd. etc; and anticipated
increase in import of steam coal by various power plants in the hinterland of the Port,
depending the entrance channel by 2012, expansion of outer harbour by 2017 etc. The
major commodity wise projected traffic vis-à-vis capacity expansion plan are given
below: -
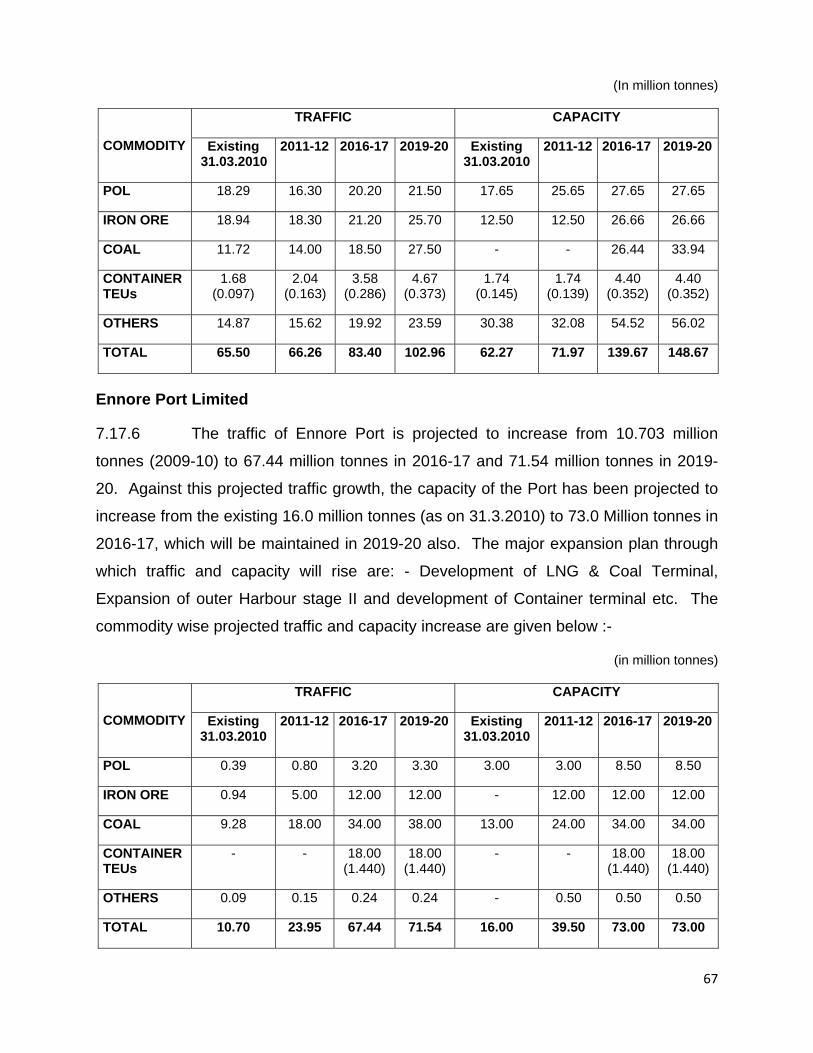
67
(In million tonnes)
COMMODITY
TRAFFIC CAPACITY
Existing 31.03.2010
2011-12 2016-17 2019-20 Existing 31.03.2010
2011-12 2016-17 2019-20
POL 18.29 16.30 20.20 21.50 17.65 25.65 27.65 27.65
IRON ORE 18.94 18.30 21.20 25.70 12.50 12.50 26.66 26.66
COAL 11.72 14.00 18.50 27.50 - - 26.44 33.94
CONTAINER TEUs
1.68 (0.097)
2.04 (0.163)
3.58 (0.286)
4.67 (0.373)
1.74 (0.145)
1.74 (0.139)
4.40 (0.352)
4.40 (0.352)
OTHERS 14.87 15.62 19.92 23.59 30.38 32.08 54.52 56.02
TOTAL 65.50 66.26 83.40 102.96 62.27 71.97 139.67 148.67
Ennore Port Limited
7.17.6 The traffic of Ennore Port is projected to increase from 10.703 million
tonnes (2009-10) to 67.44 million tonnes in 2016-17 and 71.54 million tonnes in 2019-
20. Against this projected traffic growth, the capacity of the Port has been projected to
increase from the existing 16.0 million tonnes (as on 31.3.2010) to 73.0 Million tonnes in
2016-17, which will be maintained in 2019-20 also. The major expansion plan through
which traffic and capacity will rise are: - Development of LNG & Coal Terminal,
Expansion of outer Harbour stage II and development of Container terminal etc. The
commodity wise projected traffic and capacity increase are given below :-
(in million tonnes)
COMMODITY
TRAFFIC CAPACITY
Existing 31.03.2010
2011-12 2016-17 2019-20 Existing 31.03.2010
2011-12 2016-17 2019-20
POL 0.39 0.80 3.20 3.30 3.00 3.00 8.50 8.50
IRON ORE 0.94 5.00 12.00 12.00 - 12.00 12.00 12.00
COAL 9.28 18.00 34.00 38.00 13.00 24.00 34.00 34.00
CONTAINER TEUs
- - 18.00 (1.440)
18.00 (1.440)
- - 18.00 (1.440)
18.00 (1.440)
OTHERS 0.09 0.15 0.24 0.24 - 0.50 0.50 0.50
TOTAL 10.70 23.95 67.44 71.54 16.00 39.50 73.00 73.00
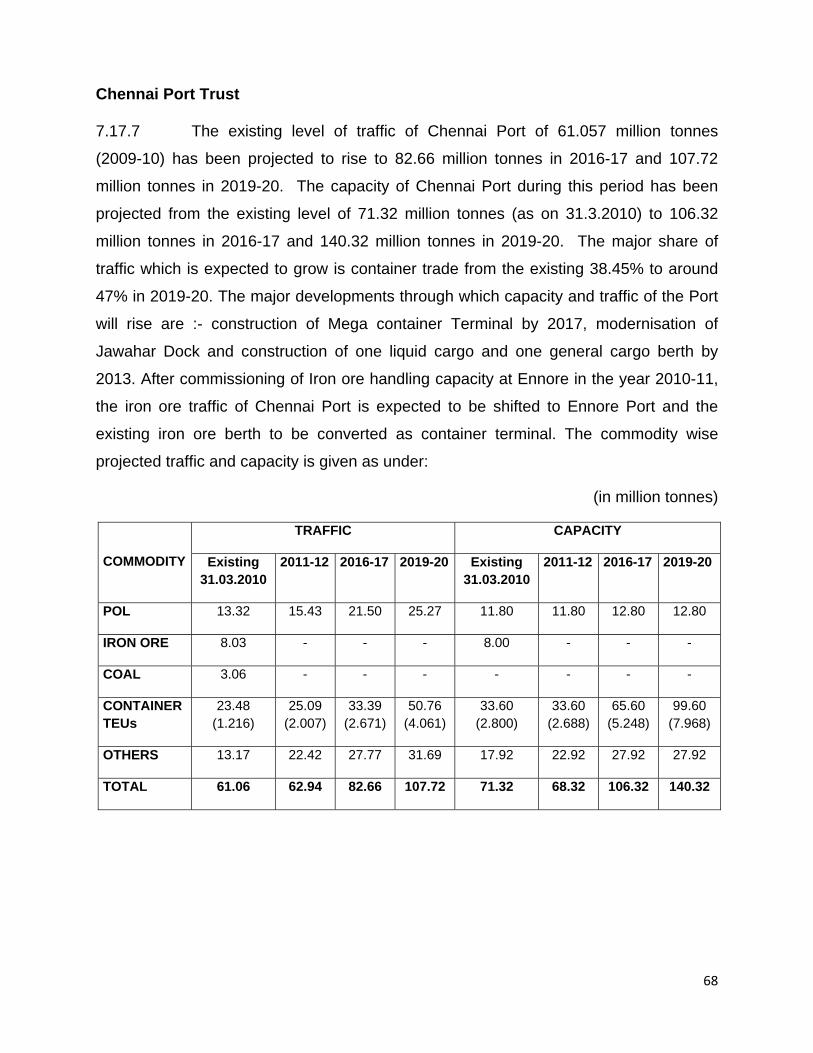
68
Chennai Port Trust
7.17.7 The existing level of traffic of Chennai Port of 61.057 million tonnes
(2009-10) has been projected to rise to 82.66 million tonnes in 2016-17 and 107.72
million tonnes in 2019-20. The capacity of Chennai Port during this period has been
projected from the existing level of 71.32 million tonnes (as on 31.3.2010) to 106.32
million tonnes in 2016-17 and 140.32 million tonnes in 2019-20. The major share of
traffic which is expected to grow is container trade from the existing 38.45% to around
47% in 2019-20. The major developments through which capacity and traffic of the Port
will rise are :- construction of Mega container Terminal by 2017, modernisation of
Jawahar Dock and construction of one liquid cargo and one general cargo berth by
2013. After commissioning of Iron ore handling capacity at Ennore in the year 2010-11,
the iron ore traffic of Chennai Port is expected to be shifted to Ennore Port and the
existing iron ore berth to be converted as container terminal. The commodity wise
projected traffic and capacity is given as under:
(in million tonnes)
COMMODITY
TRAFFIC CAPACITY
Existing 31.03.2010
2011-12 2016-17 2019-20 Existing 31.03.2010
2011-12 2016-17 2019-20
POL 13.32 15.43 21.50 25.27 11.80 11.80 12.80 12.80
IRON ORE 8.03 - - - 8.00 - - -
COAL 3.06 - - - - - - -
CONTAINER TEUs
23.48 (1.216)
25.09 (2.007)
33.39 (2.671)
50.76 (4.061)
33.60 (2.800)
33.60 (2.688)
65.60 (5.248)
99.60 (7.968)
OTHERS 13.17 22.42 27.77 31.69 17.92 22.92 27.92 27.92
TOTAL 61.06 62.94 82.66 107.72 71.32 68.32 106.32 140.32
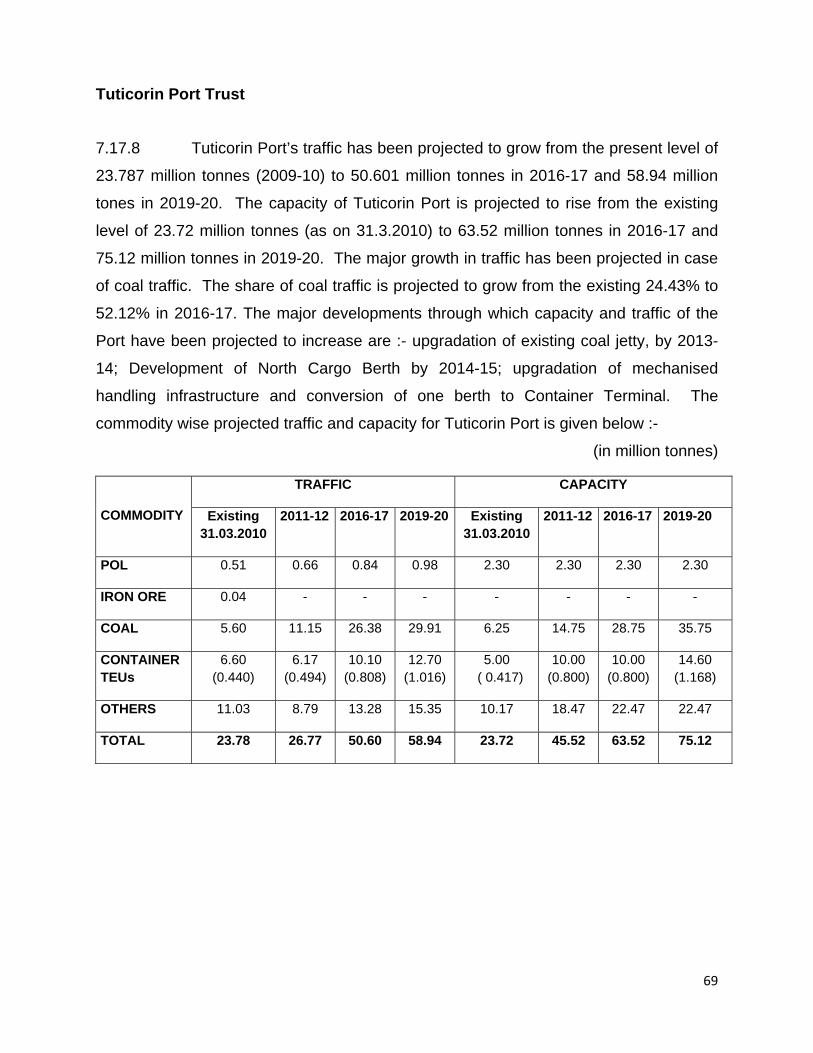
69
Tuticorin Port Trust
7.17.8 Tuticorin Port’s traffic has been projected to grow from the present level of
23.787 million tonnes (2009-10) to 50.601 million tonnes in 2016-17 and 58.94 million
tones in 2019-20. The capacity of Tuticorin Port is projected to rise from the existing
level of 23.72 million tonnes (as on 31.3.2010) to 63.52 million tonnes in 2016-17 and
75.12 million tonnes in 2019-20. The major growth in traffic has been projected in case
of coal traffic. The share of coal traffic is projected to grow from the existing 24.43% to
52.12% in 2016-17. The major developments through which capacity and traffic of the
Port have been projected to increase are :- upgradation of existing coal jetty, by 2013-
14; Development of North Cargo Berth by 2014-15; upgradation of mechanised
handling infrastructure and conversion of one berth to Container Terminal. The
commodity wise projected traffic and capacity for Tuticorin Port is given below :-
(in million tonnes)
COMMODITY
TRAFFIC CAPACITY
Existing 31.03.2010
2011-12 2016-17 2019-20 Existing 31.03.2010
2011-12 2016-17 2019-20
POL 0.51 0.66 0.84 0.98 2.30 2.30 2.30 2.30
IRON ORE 0.04 - - - - - - -
COAL 5.60 11.15 26.38 29.91 6.25 14.75 28.75 35.75
CONTAINER TEUs
6.60 (0.440)
6.17 (0.494)
10.10 (0.808)
12.70 (1.016)
5.00 ( 0.417)
10.00 (0.800)
10.00 (0.800)
14.60 (1.168)
OTHERS 11.03 8.79 13.28 15.35 10.17 18.47 22.47 22.47
TOTAL 23.78 26.77 50.60 58.94 23.72 45.52 63.52 75.12
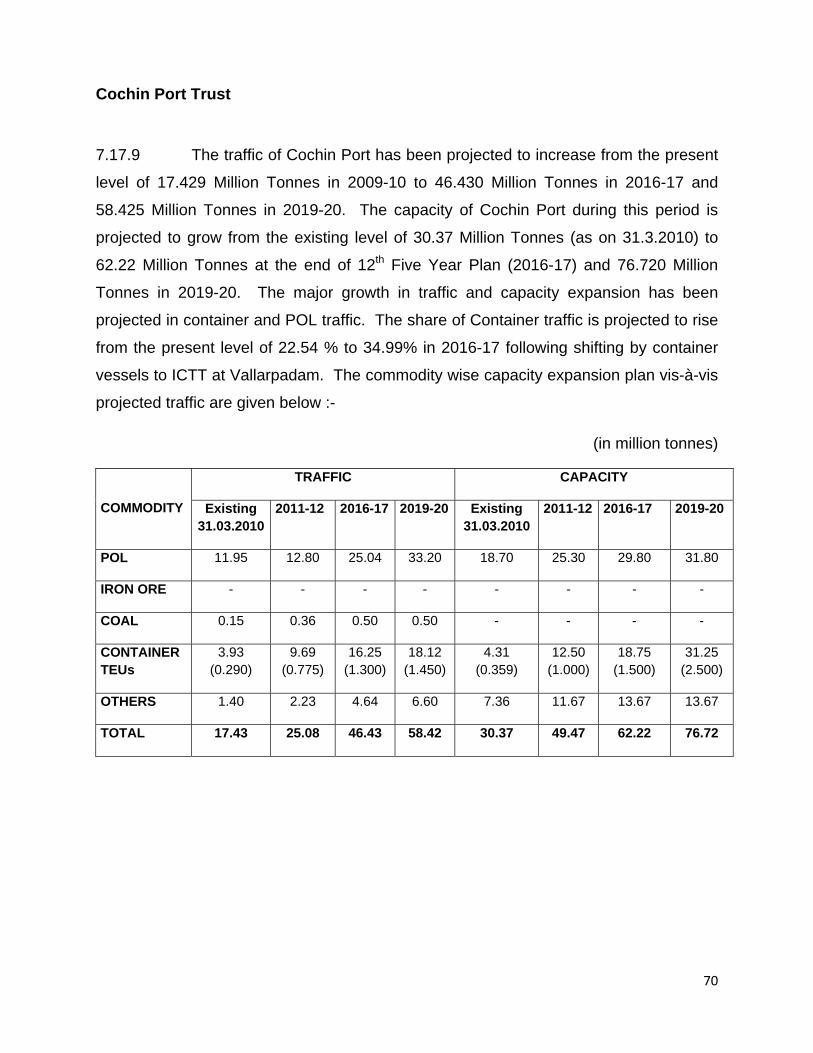
70
Cochin Port Trust
7.17.9 The traffic of Cochin Port has been projected to increase from the present
level of 17.429 Million Tonnes in 2009-10 to 46.430 Million Tonnes in 2016-17 and
58.425 Million Tonnes in 2019-20. The capacity of Cochin Port during this period is
projected to grow from the existing level of 30.37 Million Tonnes (as on 31.3.2010) to
62.22 Million Tonnes at the end of 12th Five Year Plan (2016-17) and 76.720 Million
Tonnes in 2019-20. The major growth in traffic and capacity expansion has been
projected in container and POL traffic. The share of Container traffic is projected to rise
from the present level of 22.54 % to 34.99% in 2016-17 following shifting by container
vessels to ICTT at Vallarpadam. The commodity wise capacity expansion plan vis-à-vis
projected traffic are given below :-
(in million tonnes)
COMMODITY
TRAFFIC CAPACITY
Existing 31.03.2010
2011-12 2016-17 2019-20 Existing 31.03.2010
2011-12 2016-17 2019-20
POL 11.95 12.80 25.04 33.20 18.70 25.30 29.80 31.80
IRON ORE - - - - - - - -
COAL 0.15 0.36 0.50 0.50 - - - -
CONTAINER TEUs
3.93 (0.290)
9.69 (0.775)
16.25 (1.300)
18.12 (1.450)
4.31 (0.359)
12.50 (1.000)
18.75 (1.500)
31.25 (2.500)
OTHERS 1.40 2.23 4.64 6.60 7.36 11.67 13.67 13.67
TOTAL 17.43 25.08 46.43 58.42 30.37 49.47 62.22 76.72

71
New Mangalore Port Trust
7.17.10 From the existing level of traffic of 35.528 million tonnes (2009-10) New
Mangalore Port is expected to increase its traffic to 69.14 million tonnes in 2016-17and
91.93 Million Tonnes in 2019-20. The capacity of the port during this period has been
projected to increase from 44.20 million tonnes (as on 31.3.2010) to 97.52 Million
Tonnes in 2016-17 which will remain at the same level in 2019-20. The major
developments through which traffic and capacity of the port will increase are :-
commissioning of one fertiliser berth by 2015; commissioning of one 6 Million Tonnes
coking coal berth by 2015; installation of SBM facilities for POL traffic by 2015 and
setting up of one oil berth by 2012. The commodity wise projected capacity vis-à-vis
projected traffic are under below:-
(in million tonnes)
COMMODITY
TRAFFIC CAPACITY
Existing 31.03.2010
2011-12 2016-17 2019-20 Existing 31.03.2010
2011-12 2016-17 2019-20
POL 21.34 23.45 34.74 38.52 22.00 22.00 47.80 47.80
IRON ORE 7.06 7.40 10.20 11.31 7.50 14.12 14.12 14.12
COAL 2.81 4.00 8.50 11.40 - 5.40 11.40 11.40
CONTAINER TEUs
0.48 (0.032)
0.54 (0.043)
3.00 (0.240)
4.50 (0.360)
- - 4.50 (0.360)
4.50 (0.360)
OTHERS 3.84 12.20 12.70 16.20 14.70 14.70 19.70 19.70
TOTAL 35.53 47.59 69.14 81.93 44.20 56.22 97.52 97.52
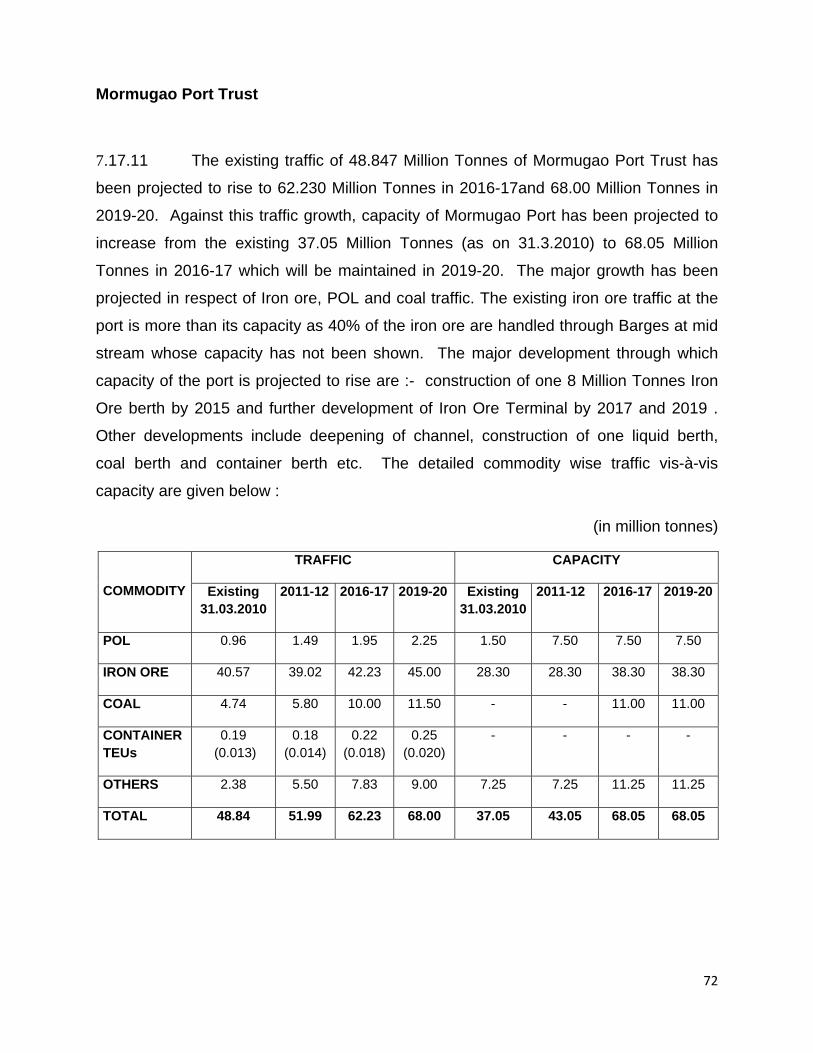
72
Mormugao Port Trust
7.17.11 The existing traffic of 48.847 Million Tonnes of Mormugao Port Trust has
been projected to rise to 62.230 Million Tonnes in 2016-17and 68.00 Million Tonnes in
2019-20. Against this traffic growth, capacity of Mormugao Port has been projected to
increase from the existing 37.05 Million Tonnes (as on 31.3.2010) to 68.05 Million
Tonnes in 2016-17 which will be maintained in 2019-20. The major growth has been
projected in respect of Iron ore, POL and coal traffic. The existing iron ore traffic at the
port is more than its capacity as 40% of the iron ore are handled through Barges at mid
stream whose capacity has not been shown. The major development through which
capacity of the port is projected to rise are :- construction of one 8 Million Tonnes Iron
Ore berth by 2015 and further development of Iron Ore Terminal by 2017 and 2019 .
Other developments include deepening of channel, construction of one liquid berth,
coal berth and container berth etc. The detailed commodity wise traffic vis-à-vis
capacity are given below :
(in million tonnes)
COMMODITY
TRAFFIC CAPACITY
Existing 31.03.2010
2011-12 2016-17 2019-20 Existing 31.03.2010
2011-12 2016-17 2019-20
POL 0.96 1.49 1.95 2.25 1.50 7.50 7.50 7.50
IRON ORE 40.57 39.02 42.23 45.00 28.30 28.30 38.30 38.30
COAL 4.74 5.80 10.00 11.50 - - 11.00 11.00
CONTAINER TEUs
0.19 (0.013)
0.18 (0.014)
0.22 (0.018)
0.25 (0.020)
- - - -
OTHERS 2.38 5.50 7.83 9.00 7.25 7.25 11.25 11.25
TOTAL 48.84 51.99 62.23 68.00 37.05 43.05 68.05 68.05
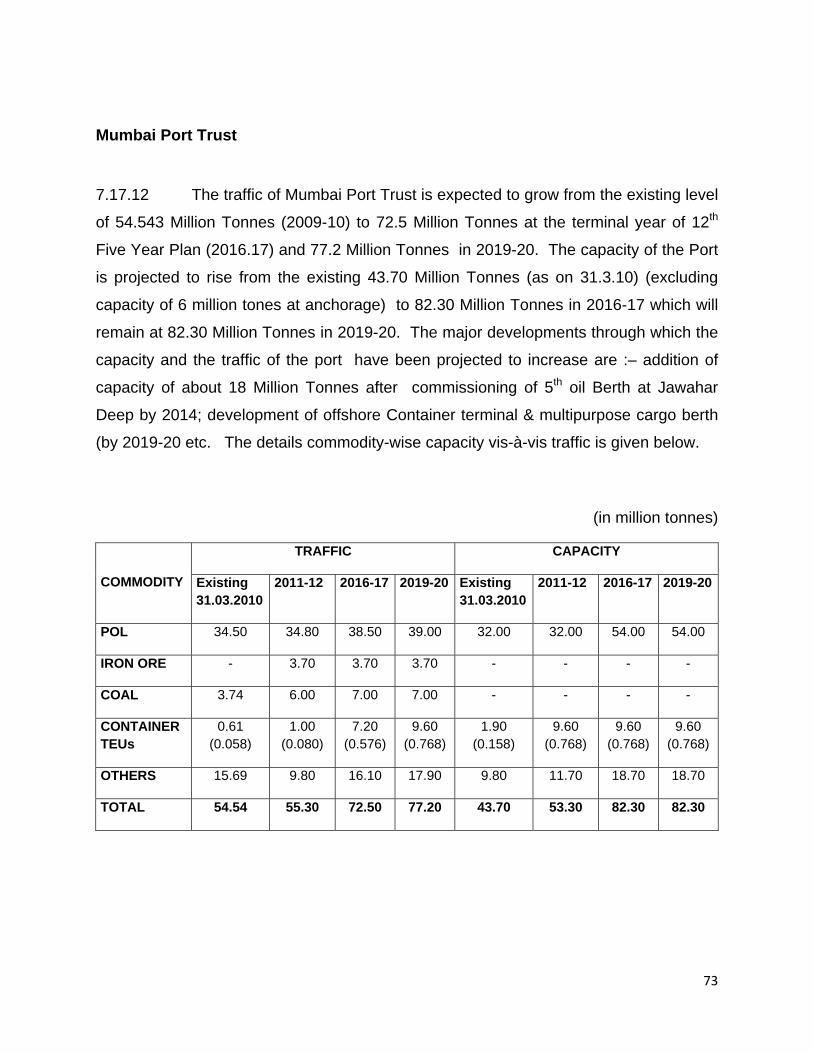
73
Mumbai Port Trust
7.17.12 The traffic of Mumbai Port Trust is expected to grow from the existing level
of 54.543 Million Tonnes (2009-10) to 72.5 Million Tonnes at the terminal year of 12th
Five Year Plan (2016.17) and 77.2 Million Tonnes in 2019-20. The capacity of the Port
is projected to rise from the existing 43.70 Million Tonnes (as on 31.3.10) (excluding
capacity of 6 million tones at anchorage) to 82.30 Million Tonnes in 2016-17 which will
remain at 82.30 Million Tonnes in 2019-20. The major developments through which the
capacity and the traffic of the port have been projected to increase are :– addition of
capacity of about 18 Million Tonnes after commissioning of 5th oil Berth at Jawahar
Deep by 2014; development of offshore Container terminal & multipurpose cargo berth
(by 2019-20 etc. The details commodity-wise capacity vis-à-vis traffic is given below.
(in million tonnes)
COMMODITY
TRAFFIC CAPACITY
Existing 31.03.2010
2011-12 2016-17 2019-20 Existing 31.03.2010
2011-12 2016-17 2019-20
POL 34.50 34.80 38.50 39.00 32.00 32.00 54.00 54.00
IRON ORE - 3.70 3.70 3.70 - - - -
COAL 3.74 6.00 7.00 7.00 - - - -
CONTAINER TEUs
0.61 (0.058)
1.00 (0.080)
7.20 (0.576)
9.60 (0.768)
1.90 (0.158)
9.60 (0.768)
9.60 (0.768)
9.60 (0.768)
OTHERS 15.69 9.80 16.10 17.90 9.80 11.70 18.70 18.70
TOTAL 54.54 55.30 72.50 77.20 43.70 53.30 82.30 82.30

74
Jawaharlal Nehru Port Trust
7.17.13 The existing traffic of JNPT is 60.763 Million Tonnes (2009-10) which is
projected to grow 130.20 Million Tonnes in 2016-17 which would remain at 130.2 Million
Tonnes in 2019-20. The capacity of the Port during this period is projected to increase
from the existing 64.0 Million Tonnes (as on 31-3-10) to 140.35 Million Tonnes in 2016-
17 and 142.22 Million Tonnes in 2019-20. The major growth in traffic has been
projected in respect of container traffic only. The major development as envisaged by
JNPT are : - the deepening of channel, construction of berths under BOT basis and
replacement of old container handling equipment. Also the present level of handling 2%
to 3% of empty container, due to post effect of global recession, will soon be over and
possibility to handle more loaded containers is expected to increase. The detailed
commodity-wise traffic vis-à-vis capacity are given in the following table.
(in million tonnes)
COMMODITY
TRAFFIC CAPACITY
Existing 31.03.2010
2011-12 2016-17 2019-20 Existing 31.03.2010
2011-12
2016-17 2019-20
POL 4.92 3.96 3.96 3.96 5.50 5.50 5.50 5.50
IRON ORE - - - - -
COAL - - - - -
CONTAINER TEUs
53.09 (4.092)
58.10 (4.648)
124.00 (9.920)
124.00 (9.920)
57.60 (4.550)
61.20 (4.896)
133.95 (10.716)
135.82 (10.866)
OTHERS 2.75 2.24 2.24 2.24 0.90 0.90 0.90 0.90
TOTAL 60.76 64.30 130.20 130.20 64.00 67.60 140.35 142.22

75
Kandla Port Trust
7.17.14 The traffic of Kandla Port is projected to grow from the existing level
of 79.50 Million Tonnes (in 2009-10) to 132.12 Million Tonnes at the terminal year of
12th Five Year Plan (2016-17) and 177.90 Million Tonnes in 2019-20. The capacity of
the port during this period is projected to increase form the present level of 85.0 Million
Tonnes (as on 31-3-2010) to 159.70 Million Tonnes in 2016-17 and 194.40 Million
Tonnes in 2019-20. The major growth have been projected in case of POL traffic which
is projected to grow by 55% in 2016-17 from the present level. The major
developments through which capacity as well as traffic have been projected to increase
are :– Construction of two products handling jetties and one SBM by 2014-15,
mechanization of general cargo berth, setting up of offshore liquid terminal,
development of dry bulk terminal, construction multipurpose berth by 2012-13, and
modification and strengthening of existing berths 1 to 6 by 2015-16 etc. The detailed
commodity-wise traffic vis-à-vis capacity are given below.
(in million tonnes)
COMMODITY
TRAFFIC CAPACITY
Existing 31.03.2010
2011-12 2016-17 2019-20 Existing 31.03.2010
2011-12 2016-17 2019-20
POL 47.21 52.05 72.65 89.30 62.83 62.83 91.23 97.23
IRON ORE 0.66 0.75 0.77 0.85 - - - -
COAL 3.23 3.29 12.36 15.72 - - - -
CONTAINER TEUs
2.43 (0.147)
2.70 (0.216)
3.95 (0.316)
4.80 (0.384)
7.20 (0.576)
7.20 (0.576)
7.20 (0.576)
7.20 (0.576)
OTHERS 25.97 26.81 42.39 67.23 14.97 14.97 61.27 89.97
TOTAL 79.50 85.60 132.12 177.90 85.00 85.00 159.70 194.40

76
Port Blair port Trust
7.14.15 Port Blair Port Trust at present (2009-10) handles 1.652 Million Tonnes
which is projected to rise to 1.70 million tones in 2011-12, 2.12 Million Tonnes in 2016-
17 and 2.42 Million Tonnes in 2019-20. The capacity of the port is expected to remain
at the same level of 4.115 Million Tonnes (as on 31-3-10) to 4.115 Million Tonnes in
2016-17 and 2019-20. The existing level of traffic and capacity is shown under section
on non-major ports. The commodities which have been projected to grow more are POL
and Container. The detailed commodity wise traffic vis-à-vis projection are given below :
(in million tonnes)
COMMODITY
TRAFFIC CAPACITY
Existing* 31.03.2010
2011-12 2016-17 2019-20 Existing* 31.03.2010
2011-12 2016-17 2019-20
POL 0.17 0.23 0.26 0.40 0.40 0.40
IRON ORE - - - - - -
COAL - - - - - -
CONTAINER TEUs
0.45 (0.036)
0.52 (0.042)
0.57 (0.046)
0.70 (0.056)
0.70 (0.056)
0.70 (0.056)
OTHERS 1.07 1.37 1.59 3.02 3.02 3.02
TOTAL 1.69 2.12 2.42 4.12 4.12 4.12
(*) included in section on non-major ports
7.15 All Major Ports
7.15.1 All the twelve Major Ports (excluding Port Blair) handled 561.090 Million Tonnes
of Traffic in 2009-10. The traffic of all these Major Ports (including Port Blair Port Trust)
are expected to reach to the level of 629.64 million tonnes by the end of 11th Five year
plan. (i.e. in 2011-12), 1031.518 million tonnes by end of 12th Five Year Plan (i.e. in
2016-17) and 1214.820 million tonnes in 2019-20. These projections are based on the
feedback received from the Major Ports through their user agencies and development
plans over the years. The compound projected annual growth (CAGR) for different
commodities from the existing level (2009-10) to 2019-20 are as follows : - POL -
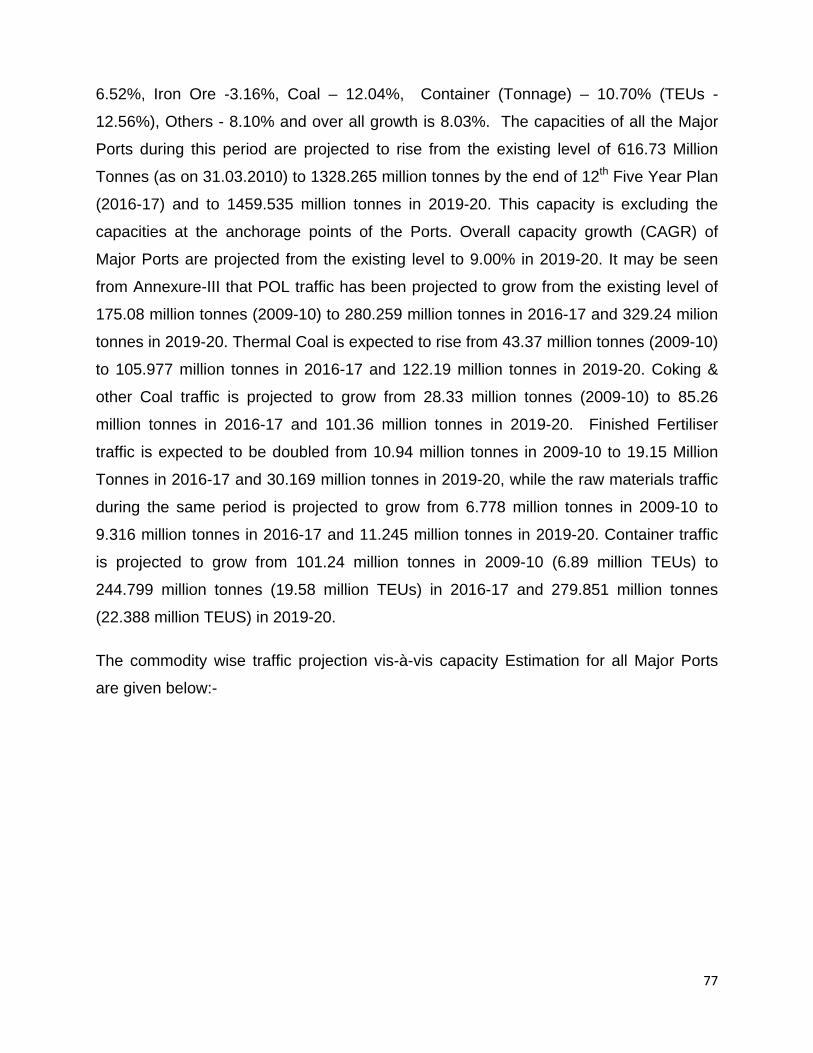
77
6.52%, Iron Ore -3.16%, Coal – 12.04%, Container (Tonnage) – 10.70% (TEUs -
12.56%), Others - 8.10% and over all growth is 8.03%. The capacities of all the Major
Ports during this period are projected to rise from the existing level of 616.73 Million
Tonnes (as on 31.03.2010) to 1328.265 million tonnes by the end of 12th Five Year Plan
(2016-17) and to 1459.535 million tonnes in 2019-20. This capacity is excluding the
capacities at the anchorage points of the Ports. Overall capacity growth (CAGR) of
Major Ports are projected from the existing level to 9.00% in 2019-20. It may be seen
from Annexure-III that POL traffic has been projected to grow from the existing level of
175.08 million tonnes (2009-10) to 280.259 million tonnes in 2016-17 and 329.24 milion
tonnes in 2019-20. Thermal Coal is expected to rise from 43.37 million tonnes (2009-10)
to 105.977 million tonnes in 2016-17 and 122.19 million tonnes in 2019-20. Coking &
other Coal traffic is projected to grow from 28.33 million tonnes (2009-10) to 85.26
million tonnes in 2016-17 and 101.36 million tonnes in 2019-20. Finished Fertiliser
traffic is expected to be doubled from 10.94 million tonnes in 2009-10 to 19.15 Million
Tonnes in 2016-17 and 30.169 million tonnes in 2019-20, while the raw materials traffic
during the same period is projected to grow from 6.778 million tonnes in 2009-10 to
9.316 million tonnes in 2016-17 and 11.245 million tonnes in 2019-20. Container traffic
is projected to grow from 101.24 million tonnes in 2009-10 (6.89 million TEUs) to
244.799 million tonnes (19.58 million TEUs) in 2016-17 and 279.851 million tonnes
(22.388 million TEUS) in 2019-20.
The commodity wise traffic projection vis-à-vis capacity Estimation for all Major Ports
are given below:-

78
Traffic vis-a-vis Capacity of all Major Ports
(in million tonnes)
COMMODITY
TRAFFIC CAPACITY
Existing 31.03.2010
2011-12 2016-17 2019-20 Existing 31.03.2010
2011-12 2016-17 2019-20
POL 175.08 188.62 280.26 329.24 219.24 243.38 372.48 380.48
Iron Ore 100.33 97.47 121.10 136.56 66.80 81.42 122.58 125.88
Coal 71.71 97.80 191.24 223.48 46.25 * 81.65 196.59 217.59
Comtainer TEUs
101.24 (6.89)
116.43 (9.32)
244.79(19.58)
279.85(22.39)
154.49 (9.82)
146.04 (11.68)
313.70 (25.10)
373.67 (29.89)
Others 112.73 129.32 194.11 245.69 129.95 188.87 322.91 361.91
Total
561.090 629.64 1031.50 1214.82
616.73 741.36 1328.26 1459.53
*Capacity of only Thermal Coal
Port –wise, commodity-wise traffic projections and capacity estimation for major ports
from 2011-12 to 2019-20 is given in Annexure VI & VII.
In addition to above, Central Government plans to commission two more Major Ports, one each on Andhra Coast & West Coast, which will also entail addition capacity in Major Port segment.
7.16 Maritime States - Traffic Forecast and Capacity Estimation
7.16.1 Recognising the critical importance of ports to cater to the future increase
in maritime traffic, the maritime states initiated the process of development of ports in
their States. The eight maritime States have estimated that the cargo traffic from non-
major ports will increase from the existing 288.80 million tonnes in 2009-10 to 402.50
million tonnes in 2011-12, 987.81 million tonnes by the end of 12th Five Year Plan in
2016-17 and 1280.13 million tonnes by 2019-20. During 2009-10 to 2019-20, Cargo
traffic in the maritime states is projected to grow at Cumulative Annual Growth Rate
(CAGR) of 16.06%. The State-wise traffic projections of traffic is given in following
Table .

79
Traffic Projections of Maritime States
(In million tonnes)
States Existing Traffic Projected Traffic
2009-10 2011-12 2016-17 2019-20
Gujarat 205.54 248.00 438.00 565.00
Maharashtra 12.51 30.57 124.28 172.71
Goa 13.90 14.17 14.90 15.35
Karnataka 8.54 9.95 51.95 67.40
Andhra Pradesh 43.62 63.85 162.01 202.04
Tamil Nadu 1.17 3.10 35.20 45.40
Kerala 0.15 0.26 11.39 27.27
Orissa 0.42 32.60 150.08 184.96
Total 288.80* 402.50 987.81 1280.13
Note : (*) including 2.92 million tonnes of other Union territories.
7.16.2 The above table shows that in absolute terms, traffic is projected to
increase substantially in four states namely, Gujarat, Andhra Pradesh, Maharashtra and
Orissa out of the total cargo handled at non-major ports. The share of Gujarat and Goa
is likely to decline from 71% and 5% in 2009-10 to 44% and 2% by 2019-20
respectively, whereas share of rest of the maritime states is expected to increase in
future. The State-wise and commodity wise traffic projection from 2011-12 to 2019-20
are given in Annexure VIII.
7.16.3 The cargo mix of non-major ports during 2009-10 reveals that, Petroleum
Oil & Lubricants (POL) was the dominant commodity accounting for more than 50% of
total cargo. The share of other major commodities was iron ore (17.0%), coal(14.3%)
and fertilizer ( 2.1%).
7.16.4 The commodity profile of the cargo, over the years is expected to undergo
substantial change. The commodity wise traffic projections of cargo at non-major ports
in maritime states during 2011-12, 2016-17 and 2019-20 is given in following table.
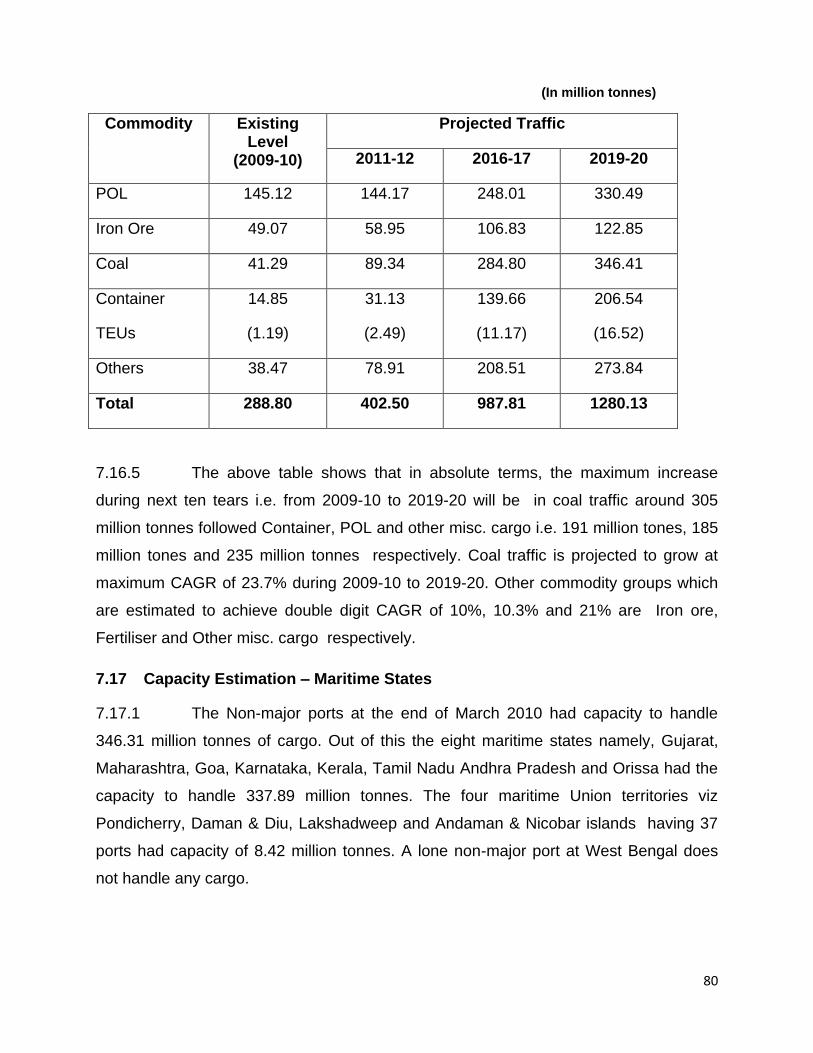
80
(In million tonnes)
Commodity Existing Level
(2009-10)
Projected Traffic
2011-12 2016-17 2019-20
POL 145.12 144.17 248.01 330.49
Iron Ore 49.07 58.95 106.83 122.85
Coal 41.29 89.34 284.80 346.41
Container
TEUs
14.85
(1.19)
31.13
(2.49)
139.66
(11.17)
206.54
(16.52)
Others 38.47 78.91 208.51 273.84
Total 288.80 402.50 987.81 1280.13
7.16.5 The above table shows that in absolute terms, the maximum increase
during next ten tears i.e. from 2009-10 to 2019-20 will be in coal traffic around 305
million tonnes followed Container, POL and other misc. cargo i.e. 191 million tones, 185
million tones and 235 million tonnes respectively. Coal traffic is projected to grow at
maximum CAGR of 23.7% during 2009-10 to 2019-20. Other commodity groups which
are estimated to achieve double digit CAGR of 10%, 10.3% and 21% are Iron ore,
Fertiliser and Other misc. cargo respectively.
7.17 Capacity Estimation – Maritime States
7.17.1 The Non-major ports at the end of March 2010 had capacity to handle
346.31 million tonnes of cargo. Out of this the eight maritime states namely, Gujarat,
Maharashtra, Goa, Karnataka, Kerala, Tamil Nadu Andhra Pradesh and Orissa had the
capacity to handle 337.89 million tonnes. The four maritime Union territories viz
Pondicherry, Daman & Diu, Lakshadweep and Andaman & Nicobar islands having 37
ports had capacity of 8.42 million tonnes. A lone non-major port at West Bengal does
not handle any cargo.
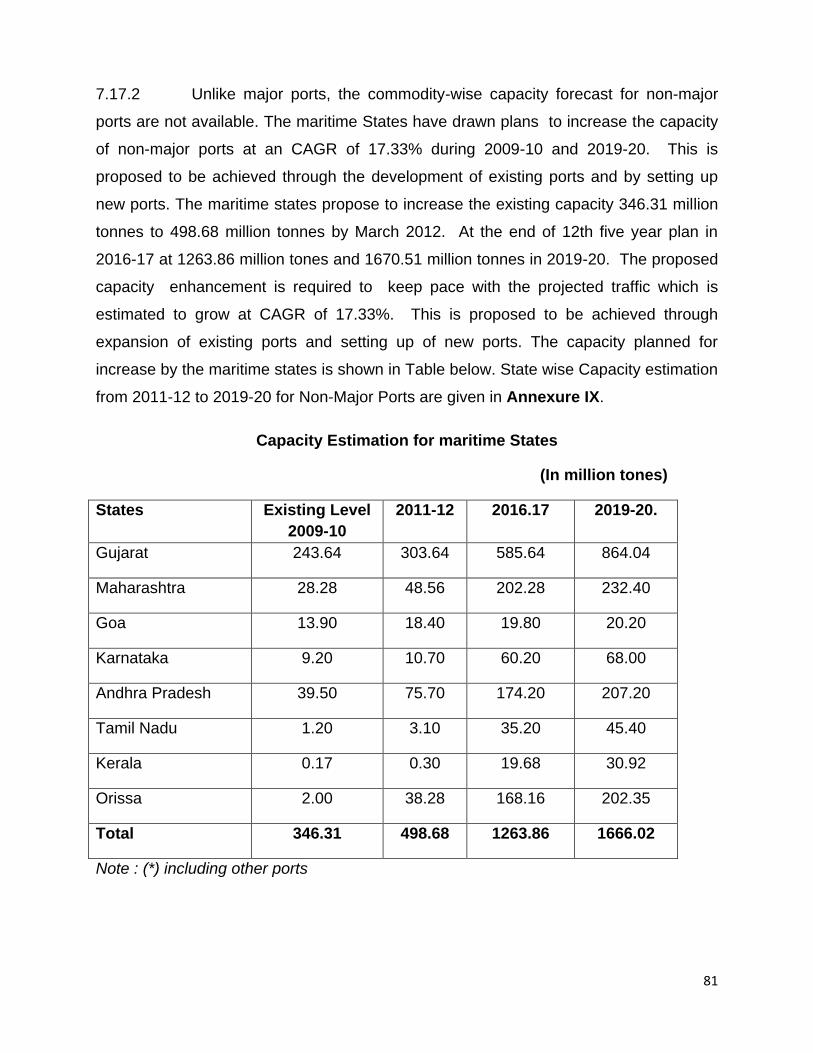
81
7.17.2 Unlike major ports, the commodity-wise capacity forecast for non-major
ports are not available. The maritime States have drawn plans to increase the capacity
of non-major ports at an CAGR of 17.33% during 2009-10 and 2019-20. This is
proposed to be achieved through the development of existing ports and by setting up
new ports. The maritime states propose to increase the existing capacity 346.31 million
tonnes to 498.68 million tonnes by March 2012. At the end of 12th five year plan in
2016-17 at 1263.86 million tones and 1670.51 million tonnes in 2019-20. The proposed
capacity enhancement is required to keep pace with the projected traffic which is
estimated to grow at CAGR of 17.33%. This is proposed to be achieved through
expansion of existing ports and setting up of new ports. The capacity planned for
increase by the maritime states is shown in Table below. State wise Capacity estimation
from 2011-12 to 2019-20 for Non-Major Ports are given in Annexure IX.
Capacity Estimation for maritime States
(In million tones)
States Existing Level
2009-10
2011-12 2016.17 2019-20.
Gujarat 243.64 303.64 585.64 864.04
Maharashtra 28.28 48.56 202.28 232.40
Goa 13.90 18.40 19.80 20.20
Karnataka 9.20 10.70 60.20 68.00
Andhra Pradesh 39.50 75.70 174.20 207.20
Tamil Nadu 1.20 3.10 35.20 45.40
Kerala 0.17 0.30 19.68 30.92
Orissa 2.00 38.28 168.16 202.35
Total 346.31 498.68 1263.86 1666.02
Note : (*) including other ports

82
7.17.3 The above table shows that non-major ports in maritime states plan to
achieve nearly four fold increase in capacity in next ten Years. The State of Gujarat has
planned maximum increase in capacity by 620 million tonnes followed by Andhra
Pradesh (168 million tonnes), Maharashtra (204 million tonnes), Orissa (200 million
tonnes), Karnataka (59 million tones), Tamil Nadu (44.20 million tones), Kerala ( 30.75
million tones) and Goa (6 million tones).
7.18 Summary – Traffic & Capacity
7.18.1 Traffic Projection (In million tonnes)
Ports Existing
Level
2009-10
Projections CAGR(%) between 2009-10 and
2011-12 2016-17 2019-20 2011-12 2016-17 2019-20
Major Ports 561.09 629.64 1031.50 1214.82 5.93 9.09 8.03
Maritime
States
288.80 402.50 987.81 1280.13 18.05 19.21 16.06
Overall 849.89 1032.14 2019.31 2494.95 10.20 13.16 11.37
7.18.2 Capacity Estimation (In million tonnes)
Ports Existing
Level
2009-10
Projections CAGR(%) between 2009-10 &
2011-12 2016-17 2019-20 2011-12 2016-17 2019-20
Major Ports 616.73 741.36 1328.26 1459.53 9.64 11.58 9.00
Maritime
States
346.31 498.68 1263.86 1670.51 20.00 20.31 17.04
Overall 963.04 1240.04 2592.12 3130.04 13.47 15.19 18.34
Summary of overall commodity wise traffic projection for Major Ports and non- Major
Ports, including all Indian Ports is given in Annexure-X.

83
CHAPTER – 8
HINTERLAND CONNECTIVITY
8.1 The projected traffic of major & non-major ports is to move through the land
transport infrastructure providing port connectivity which needs considerable expansion
to keep pace with accelerating trade growth. In fact, inadequate capacities in the
hinterland transport modes often lead to higher costs and delays on account of sub-
optimal mode choices, circuitous routing and congestion in the hinterland transport
links. All of which directly impact trade competitiveness. Many raw materials, agricultural
products and manufactured goods which are competitive at the mine, farm-gate or
factory, lose their competitive advantage due to high transport cost to the port and
delays in transit. Though all the major ports are having rail and road connectivity with
national rail and road network, yet more thrust is to be made for faster and efficient
evacuation of cargo to and from ports.
8.2 CONNECTIVITY AT MAJOR PORTS – AN OVERVIEW
8.2.1 A brief overview of the present rail and road connectivity status in ports along
with some of the major connectivity projects proposed to be under taken in the ports is
given as under :
(i) Kolkata Port Trust
The Port has vast hinterland comprising the entire Eastern India and two land-locked
neighbouring countries. Nepal and Bhutan, it is well linked by road and railways with
rest of the India. City roads connect the port to National Highways 2 and 6 and to the
junction of National Highway 34 and the Airport. The 10 kms stretch from the port to the
junction of NH-2 and Nh-6 including 1.7 kms long elevated road link between
Vidyasagar Sethu and Swing Bridge is being undertaken. The rail connectivity to the
port is provided by the Sealdah-Budge Budge Branch Line to Majherhat Junction.
(ii) Haldia Dock Complex
Haldia Dock Complex is connected to NH-41 which links it to NH-6 and the rest of the
country. Four laning of 52.2 kms stretch of NH-41 from Kotaghat-Haldia is in progress.
A single rail line from Panskura-Haldia Branch Line connects the docks to the Trunk
84
Railways. Doubling of the 15.05 kms stretch of this line from Panskura to Rajgoda has
been completed.
(iii) Paradip Port Trust
The port is connected to NH-5 through a two lane road upto Chandikol. Four laning of
the road is completed. The two lane State Highway 12 from the port to Cuttack
provides network between the port and the mines. Port is connected by a single line
section with Cuttack which connects Howrah-Chennai Trunk Line. The single line is
being doubled. The 155 kms Daitari-Banspani rail line is under construction. The 78
kms Haridaspur-Paradip Rail Link to provide a dedicated corridor from the Port with the
iron ore mines and steel plants is also under construction.
(iv) Visakhapatnam Port Trust
The port has two harbours viz. Inner Harbour and Outer Harbour. The port boasts of
the deepest container terminal mong major ports (14.9 mtrs). The port is connected to
NH-5. A project for improving the 12.47 kms long stretch of Naval Dockyard and
Industrial by pass State road is available. The port is also connected to the Chennai –
Hawrah main railway line of the East Coast Route.
(v) Ennore Port Limited
The first corporate Major port in India, the port is situated at Ennore, 25 kms north of
Chennai on India‘s east coast. The port is a functional landlord port. The port is
connected to NH-4, NH-5 and NH-45, Rail connectivity from the port is also available.
Ennore – Manali Road improvement Project (EMRIP) costing around Rs. 600 cr. Is to
be executed by SPV comprising NHAI, ChPT, GoTN and Ennore Port Ltd. The
objective of the project is to widen and strengthen a number of roads including Ennore
Expressway, Manali Oil Refinery Road etc covering a distance of 19 Kms. After
completion of the said road improvement project it is expected that the present road
capacity of 1,100 Passenger Car Unit (PCU) per hour shall increase to 3,500 PCUs per
hour. This road improvement plan is envisaged to improve the connectivity to Ennore
and Chennai Ports.

85
(vi) Chennai Port Trust
The port is connected by road to NH-5 (Chennai-Kolkata), NH-4 (Chennai – Bangalore /
Hyderabad etc.) and NH-45 (Chennai –Dindugal/ Tiruchirappalli. Apart from national
highways the east coast highway connects the city with Puducherry and rest of South
India. Port is also well connected with the railway network to the southern parts of
Tamil Nadu as also to the rest of India. Chennai Port – Maduravoyal 4 Lane Eelvated
Corridor project is included in the NHDP Phase-VII to be executed under BOT model at
a total estimated cost of Rs,1,655 Cr. covering a distance of 19 Kms. The majority of the
expressway shall be alongside the river Cooum. The elevated corridor shall begin from
the Exit/Entry Gate of Chennai Port on the southern end to Maduravoyal connecting
NH-4 which leads to the industrial hinterland of Sriperumbudur of Kanchipuram District
and further to Bangalore, Hyderabad etc.
Unless, the above connectivity projects at Ennore and Chennai port are implemented, it
will be difficult of evacuation of cargo to be handled at proposed at Mega container
terminal.
(vii) Tuticorin Port Trust
The port has two lane road connectivity through NH-45B, NH-7 and NH-7A. Four laning
of the 47.2 kms stretch of NH-7A between Tuticorin and Tirunelvelli and NH-45B are in
progress.
(viii) Cochin Port Trust
Road connectivity to the port from the mainland is through two bridges –one on
Mattanchery channel and one on Emakulam Channel. A link road connects Willingdon
Island to NH-47 bypass. Four laning of the 10.40 stretch of NH-47 is under progress. A
single rail line which branches off at Emakulam from the main line from Shornur—
Trivandrum also serves the port. Action is being taken to provide rail connectivity and
National Highway connectivity to the upcoming International Container Transhipment
Terminal, which is targeted to serves an hinterland extending to Major Industrial Hubs of
India. A 17.2 km long four-lane road that will connect the Container Terminal to three
National Highways NH-47 (Salem), NH-17 (Mumbai) and (indirectly) to NH-49 (Madurai)
has been newly created. The road is to be commissioned along with ICTT project, by
86
January 2011. The connectivity to the National railway grid is established to facilitate
container movement to the North Indian Industrial hubs. An 8.86 km long link line from
ICTT to the main rail grid is becoming operational by November 2010. The link will
support the formation of a freight corridor for movement of exports from Tamil Nadu and
Karnataka in future. In addition to the rail/road linking, an Inland water connectivity is
also needed to the terminal in the context of Kerala, inland water transport can support
development of industries along the water-front in nearby districts. The National
Waterway (NW3) maintained by the Inland Waterways Authority of India runs in
proximity to the Cochin Port. In the wake of the commissioning of ICTT, the Waterways
Authority is adding two new terminals near the port to facilitate the movement of Ro-ro
barges (Roll on and Roll off) which will enable movement of container traffic from South
Kerala through the Inland Waterways. The terminals will also facilitate movement of
containers by coastal vessels and river-sea vessels from west coast Non-Major Ports.
(ix) New Mangalore Port Trust
Mangalore in Karnataka State on the west Coast of India, well connected to the
Industrial hubs of Southern India as well as North India via Konkan railway. Road
connectivity to the port is provided through NH-48 (Bangalore-Mangalore), NH-17
(cochin-Goa-Mangalore) and NH-13 (Sholapur-Mangalore). Four laning of NH-17
(suratkal-Nantur section), NH-48 (Padil-Bantwal section) and a bypass from Nantur
junction on NH-17 to Padil junction on NH-48 is in progress. A broadguage railway line
connects the port to the southern parts of the country and the Konkan Railway links the
port through Mangalore with Mumbai.
(x) Mormugao Port Trust
The port accounts for about 32% of Iron Ore export of the country. Two lane road
linkfrom the port to NH-17A through vasco city is available. Four laning of 18 kms
stretch of NH-17B from Verna Junction on NH-17 to Mormugao Port in progress. Rail
connectivity to the port is also available.

87
(xi) Mumbai Port Trust
The port has three dock systems with 50 berths on the mainland. The port is well
connected to other parts of the country through NH-8 (ahmedabad), NH-3 (Delhi and
Kolkata), NH-4 (Bangalore) and NH-17 (Goa/Mangalore), anik-Panjorpole Link Road to
provide access between Mumbai Port and Southern parts of Mumbai, Navi Mumbai on
the mainland to the East and Eastern Express Highway is being undertaken. The port
is connected to the Indian Railways at Raoli, Junction, Wadala.
(xii) Jawaharlal Nehru Port
The port is connected through NH-4Bto the Mumbai-Oune Expressway, NH-17 to
Mumabi-Goa Highway, SH-54 to the western parts of India. Four laning of NH-4B and
SH-54 and construction of a four lane Amra Marg including six lane major bridge across
Panvel Creek is also in operation. The port is well connected by rail to Panvel. A
proposal for construction of grade separators through SPV between NHAI, JNPT and
State Government is under active consideration. Similarly, construction of second
evacuation road from container gate to CFS / Dronagiri with respect the proposed
development of SEZ in the area is also under consideration.
(xiii) Kandla Port Trust
A gateway to the North West India, it accesses a vast hinterland of 1 million sq. kms
stretching upto Jammu & Kashmir by meter gauge and broad gauge railway system.
The port has two lane and four land approaches to NH-8A. Four laning of various
sections of NH-8A have also been implemented. The port is connected by rail to
Mumbai and Delhi via Ahmedabad. The port has metre-gauge connectivity to Palanpur.
8.3 MODAL SHARES IN PORT CONNECTIVITY
8.3.1 Port traffic within India is carried largely by railways and road transport, with
pipelines carrying some crude oil and petroleum products. Alternative modes such as
inland waterways have remained largely undeveloped and the situation is unlikely to
change substantially in the medium term. The present mode share of port cargo, based
on the tonnage transported by a particular mode, is provided below. These mode share
estimates are based on some assumptions on commodity-wise optimal mode of

88
transport, on the geographical features of the respective regions, certain cargo
characteristics, and the distances traveled from the hinterland. For instance, cargo such
as coal and iron ore would preferably be transported by railways unless alternative
arrangements such as conveyors or pipelines are available. The estimates suggest that
while the railways should have carried 34 percent of port traffic, it actually moved only
24 percent. Roads by contrast presently carry 36 percent of the traffic as compared with
the 22 percent they should carry.
Port Traffic Mode Share (% of Tons Handled)
Present Mode Share % (2007) Optimal Mode Share %
Railways 24 34
Roads 36 22
Pipeline 30 44
Other including inland
waterways, conveyers etc.
10
Source World Bank Report 2007
8.4 ROAD TRANSPORT
8.3.1 Road transport is now the predominant mode of inland transport for port cargo. It
is generally more cost effective for shorter leads and smaller package sizes as it is both
costlier and slower than railways for distances in excess of about 300 to 500 km. Partly
this is due to delays at numerous checkpoints for road traffic at state border crossings.
A significant improvement in the quality of road infrastructure over the last few years
following the launch of national programs such as the National Highway Development
Program (NHDP) has contributed to the growing efficiency and increased reliance on
road transport. The other factor favoring road transport is the convenience of door-to-
door transport for high value goods which are increasing as trade in finished and
intermediate goods increases.
8.5 RAILWAYS
8.5.1 In contrast, railways account for the inland haulage of only 24 percent of port
cargo, with the Major ports having a 30 percent share and State ports an insignificant 8
percent, indicating the extremely low rail connectivity to ports other than the Major ports.
89
Rail transport is primarily used for low value commodities for which transport costs are
an important component of the delivered price. However, with the exception of coal,
which is almost entirely transported by rail, most other commodities are beginning to
shift to roads owing to the shortage of rail capacity in many sectors. Iron ore exports
have experienced a large shift to roads, on account of the rapid increase in exports and
the capacity crunch being faced by the railways. High value cargo such as containers,
are also moving away from rail transport. Fertilisers, limestone and foodgrains are the
other dry bulk commodities being moved by rail.
8.5.2 The main reason for the railways declining share has been inadequate
investments in capacity, particularly for freight, the poor quality of service and slow
response to various segments of the growing freight demand. The non-availability of
wagons, even when line capacity is available is a common problem hurting both bulk
and containerized cargo. In the case of container traffic, this shortage of rakes can be
attributed to insufficient investment by the Container Corporation of India (CONCOR)
which has so far enjoyed a monopoly in rail container transport.
8.5.3 The Tughlakabad-JNPT (Delhi-Mumbai) line, one of the most highly trafficked
corridors in the country is a case in point. With an average line capacity of 50 trains per
day, it has been handling over 67 trains per day, operating at a capacity utilization of
135 percent, and several sections are being operated at 160 percent utilization levels.
Roughly 40 trains on this corridor are passenger trains, leaving a limited capacity for
freight trains, which have a lower priority. Congestion at the railways‘ Tughlakabad
Inland Container Depot (ICD) near Delhi and on the line itself has resulted in a poor
reliability of service, and high value cargo such as containers, which form the majority of
the traffic on this corridor, is increasingly shifting to road transport. Presently, less than
one-third of the containerized cargo in this corridor is being carried by the Railways. On
average, 9,000 loaded trucks move over this corridor everyday, aggregating around 30
million tons annually of road freight traffic.
8.5.4 The Dedicated Freight Corridor proposed for the Delhi–Mumbai and Delhi-
Kolkata sections will, once completed, go a long way towards relieving congestion on
these corridors. The National Rail Vikas Yojana launched in 2003, is an attempt by the
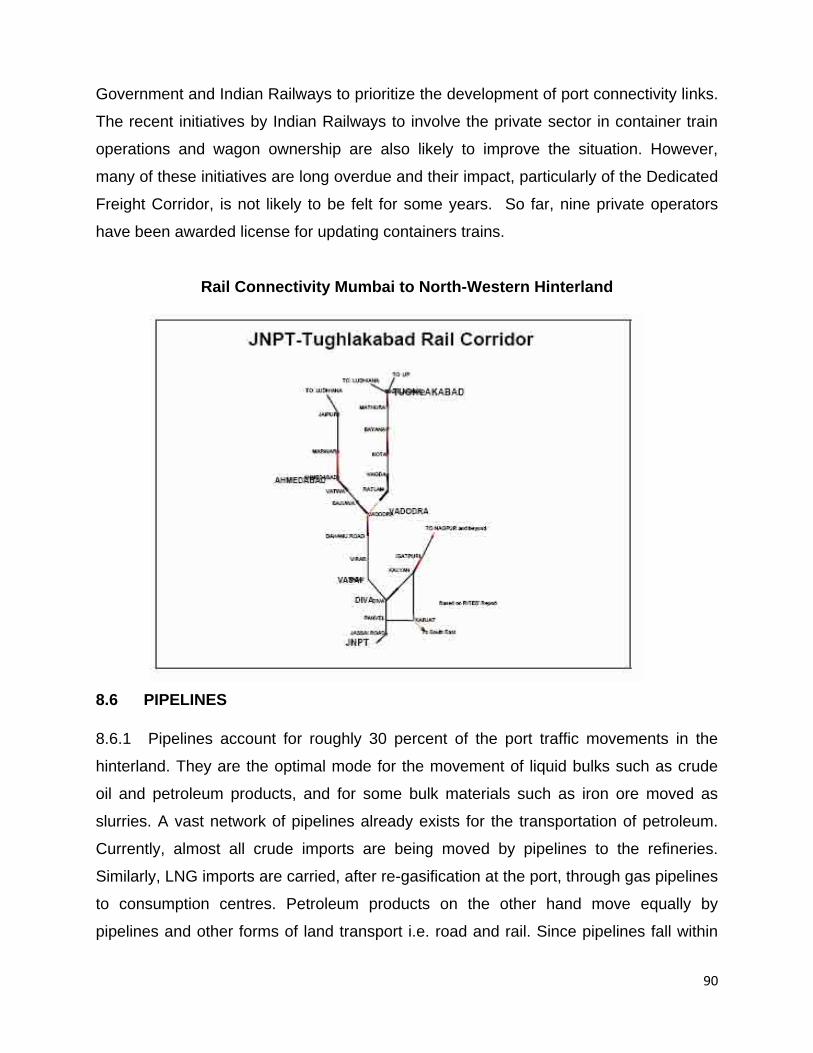
90
Government and Indian Railways to prioritize the development of port connectivity links.
The recent initiatives by Indian Railways to involve the private sector in container train
operations and wagon ownership are also likely to improve the situation. However,
many of these initiatives are long overdue and their impact, particularly of the Dedicated
Freight Corridor, is not likely to be felt for some years. So far, nine private operators
have been awarded license for updating containers trains.
Rail Connectivity Mumbai to North-Western Hinterland
8.6 PIPELINES
8.6.1 Pipelines account for roughly 30 percent of the port traffic movements in the
hinterland. They are the optimal mode for the movement of liquid bulks such as crude
oil and petroleum products, and for some bulk materials such as iron ore moved as
slurries. A vast network of pipelines already exists for the transportation of petroleum.
Currently, almost all crude imports are being moved by pipelines to the refineries.
Similarly, LNG imports are carried, after re-gasification at the port, through gas pipelines
to consumption centres. Petroleum products on the other hand move equally by
pipelines and other forms of land transport i.e. road and rail. Since pipelines fall within
91
the domain of the large oil companies, and are not really dependent on public funding,
their development has generally kept pace with requirements.
8.7 IMPACT OF INADEQUATE CONNECTIVITY
8.7.1 Inadequate hinterland connectivity has important impacts on external trade and
therefore the development of the economy. It typically results in suboptimal choice of
mode and port, leading to time and cost escalations, and in extreme cases to
congestion in the ports due to an inability to move cargo out of the port.
8.7.2 Containerized Cargo
8.7.3 Jawaharlal Nehru Port is the most efficient container port in the country and is
the preferred port for a majority of the country‘s container traffic, presently accounting
for about 60 percent of the total. even though the Gujarat ports are located a little
closer, they take almost twice as long to reach. The east coast ports not only take much
longer, but also cost more than twice as much in inland haulage charges. These
differences restrict competition, and JNP therefore enjoys a dominant position on
account of both its better overall shipping service offerings and its superior hinterland
connectivity. The Gujarat ports on the other hand, continue to lose out to JNP due to
their relatively poor connectivity, despite enjoying a closer proximity to the north-western
hinterland which generates a majority of the container traffic. Even cargo destined for
China or other south east Asian countries prefers to be routed through JNP, rather than
ports like Chennai on the east coast which though closer to the destination offer poor
connectivity to the northern hinterland.
8.7.4 As a result, traffic at JNP has grown at the rate of 22 percent over the last five
years, but rail connectivity has not kept pace. The main reason for this, apart from the
congested rail network on the Delhi-Mumbai corridor, is the low reliability of services
offered by CONCOR, the container transport monopoly of Indian Railways. The present
container handling capacity as on 31-03-2010 at JNPT is 4.55 million TEUs. Further, the
proposed fourth terminal would add another 4 million TEU, and will require a major
upgrade of the port‘s connectivity infrastructure.

92
8.7.5 Bulk Cargo
(i) Ports on the east coast are ideally located to serve the growing trade needs of
its vast mineral rich hinterland. Large reserves of coal and iron ore are found in Orissa
state and also in the neighboring landlocked states of Jharkhand and Chhattisgarh. The
recent boom in the steel industry has also led to large additions in steel manufacturing
capacity being planned in this hinterland.
(ii) The iron ore mines in the Banspani area, in the immediate hinterland of Paradip
Port, do not have a direct rail link to the port, instead the cargo must be routed
circuitously via Kharagpur in West Bengal to the north before coming back south to
Paradip port. The problem is further compounded by a severe shortage of wagons. As a
result, a large percentage of the iron ore from this belt is being diverted to Haldia and
Vizag ports which are considerably further away.
8.7.6 Similarly, thermal coal shipments from Talcher coalfields in Orissa to power
plants in the south are also best routed through Paradip Port which is 200 km away.
However, due to rail capacity constraints, some of this traffic is being diverted to Vizag
port which is 560 km away and also due to Paradip Port has a single line rail link which
cannot handle more than 18 trains per day.
8.8 IMPROVING PORT CONNECTIVITY
8.8.1 In the absence of adequate hinterland connectivity, higher cost solutions in the
form of sub-optimal modes or ports are being used as was seen above, leading to large
economic losses. Efficient connectivity solutions not only ensure trade competitiveness
through their direct impact on costs and delivery times, but also enhance competition
between ports by increasing shipper options. Improving hinterland connectivity is
therefore also important for promoting inter-port competition and thereby improving the
efficiency of services available to shippers. In recognition of these considerations,
Government of India constituted in March, 2005 a Committee of Secretaries to establish
policies and priorities for improving port connectivity. The following summarizes the key
recommendations of the Committee:
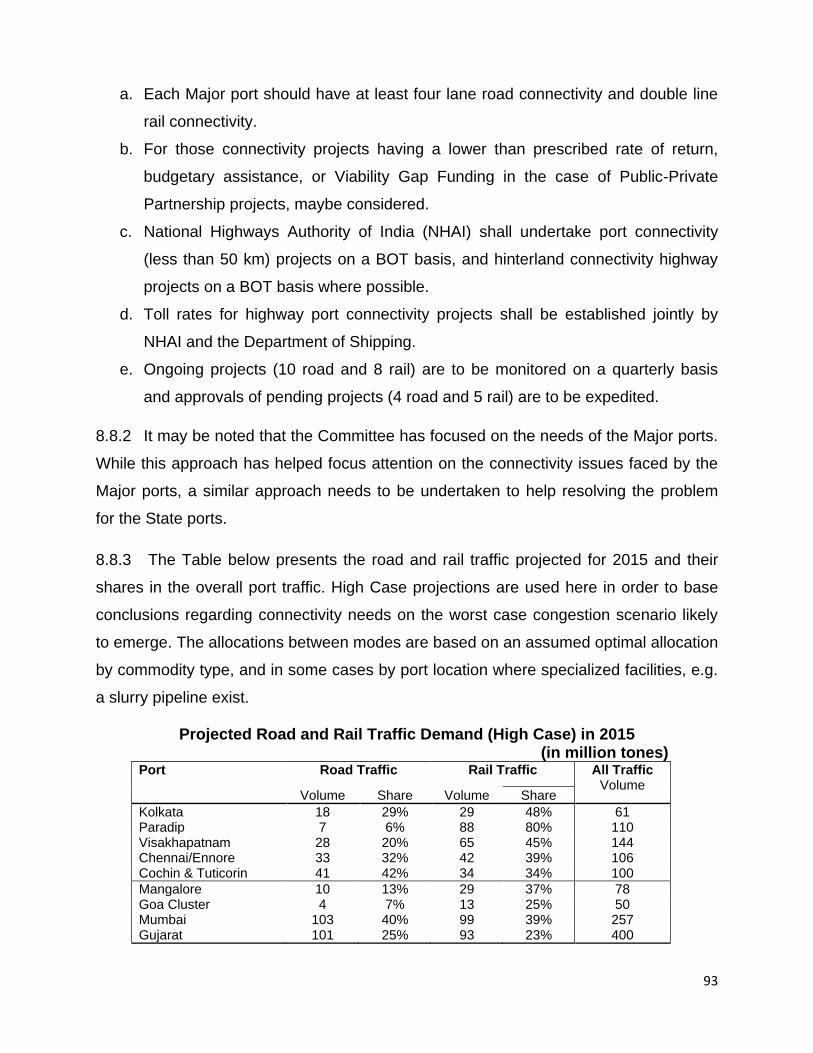
93
a. Each Major port should have at least four lane road connectivity and double line
rail connectivity.
b. For those connectivity projects having a lower than prescribed rate of return,
budgetary assistance, or Viability Gap Funding in the case of Public-Private
Partnership projects, maybe considered.
c. National Highways Authority of India (NHAI) shall undertake port connectivity
(less than 50 km) projects on a BOT basis, and hinterland connectivity highway
projects on a BOT basis where possible.
d. Toll rates for highway port connectivity projects shall be established jointly by
NHAI and the Department of Shipping.
e. Ongoing projects (10 road and 8 rail) are to be monitored on a quarterly basis
and approvals of pending projects (4 road and 5 rail) are to be expedited.
8.8.2 It may be noted that the Committee has focused on the needs of the Major ports.
While this approach has helped focus attention on the connectivity issues faced by the
Major ports, a similar approach needs to be undertaken to help resolving the problem
for the State ports.
8.8.3 The Table below presents the road and rail traffic projected for 2015 and their
shares in the overall port traffic. High Case projections are used here in order to base
conclusions regarding connectivity needs on the worst case congestion scenario likely
to emerge. The allocations between modes are based on an assumed optimal allocation
by commodity type, and in some cases by port location where specialized facilities, e.g.
a slurry pipeline exist.
Projected Road and Rail Traffic Demand (High Case) in 2015 (in million tones)
Port Road Traffic Rail Traffic All Traffic Volume
Volume Share Volume Share
Kolkata 18 29% 29 48% 61 Paradip 7 6% 88 80% 110 Visakhapatnam 28 20% 65 45% 144 Chennai/Ennore 33 32% 42 39% 106 Cochin & Tuticorin 41 42% 34 34% 100
Mangalore 10 13% 29 37% 78 Goa Cluster 4 7% 13 25% 50 Mumbai 103 40% 99 39% 257 Gujarat 101 25% 93 23% 400
94
8.8.4 What is abundantly clear from above Table is that for port traffic to be moved to
and from its inland destinations efficiently, the key strategic issue will be rail
connectivity. This is true of all Major or Non-Major Ports, with the possible exception of
Cochin and Tuticorin, and even there the absolute rail traffic volumes projected are not
inconsequential. For the Ports in Gujarat and Mumbai region, while the relative share of
rail is lower than for road, the absolute volumes are extremely high, and here too
efficiency of the ports will critically rely on improvements in rail connectivity. This is not
to minimize the importance of road connectivity. Roads will always be the default option
for connectivity of the ports. However, the highway development aspects appear to be
in a better shape owing to initiatives such as the National Highways Development
Program Port Connectivity projects, and the overall funding plans for highway
development programs. The point to be noted is that the efficiency of India‘s port
infrastructure will critically rely on a major effort to ramp up rail port connectivity.
8.9 RAIL CONNECTIVITY ENHANCEMENT
8.9.1 An estimated 225 percent increase in rail haulage of port cargo will be required
over the medium term (2015) an increase of over 400 percent will be needed. Based on
the presently proposed rail capacity enhancements an analysis was conducted of the
last mile port connectivity of the railways for the 2015 High Case and the number of
trains required for the transportation of projected rail cargo. The analysis is limited in
scope as it considers only last mile connectivity and does not factor in upstream
capacity constraints. Some assumptions have been made on the share of passenger
trains for city ports and other ports where the rail link also has passenger traffic.
8.9.2 The analysis given below very clearly points to the large rail capacity shortfalls
likely in the critical Mumbai. Cochin/ Tuticorin and Mangalore are also likely to
experience significant constraints. This is assuming the present plans are implemented
without major delays. It must be kept in mind that the analysis merely explores the
bottleneck at the port and not further into the network, where large capacity constraints
may exist and for which projects such as the Dedicated Freight Corridor are needed to
address capacity expansion needs.

95
Projected Rail Capacity Minus Demand (Unit Trains/ day) Port Demand 2015 Capacity 2015 Capacity Shortfall 2015
Kolkata 46 130
Paradip 128 154
Vizag 98 122
Chennai/Ennore 70 75
Cochin & Tuticorin 68 62 (6)
Mangalore 47 32 (15)
Goa 19 32
Mumbai 193 120 (73)
Gujarat 180 218
8.10 CONCLUSIONS
8.10.1 This review of port - hinterland connectivity has highlighted some critical issues
that need to be addressed and the key challenges with regard to hinterland connectivity
facing the ports sector. The following summarizes the essential features for improving
hinterland connectivity in Indian Ports :
a. Railways are presently carrying considerably less than their optimal share of port
traffic, and road transport has made up the deficit with many negative
externalities for road traffic particularly in the major port cities.
b. As the economy grows and diversifies to higher value manufactures, the optimal
road transport share of port traffic will grow. NHAI‘s port connectivity projects
under the NHDP appear to be addressing the needs for Major ports. A similar
effort for non-major ports, however, is lacking.
c. Over the medium term, however, the key to improved port connectivity for India‘s
ports will be enhancements in rail connectivity and capacity, and the latter could
require as much as a 400% increase over the present levels of port traffic carried
by the railways.
d. Indian Railways‘ Dedicated Freight Corridor project will help to considerably
alleviate congestion in the Delhi-Mumbai corridor, which is critical to the
hinterland connectivity of the Mumbai and Gujarat port clusters that serve the
largest share of India‘s port traffic.
e. Railways plans for last mile connectivity to various Major and non-major ports
need considerable enhancement, and a special effort on this by RVNL to
expedite planning and implementation should be initiated on an urgent basis.
96
CHAPTER- 9
PORT’S EFFICIENCY – QUEST TO ACHIEVE INTERNATIONAL STANDARDS
9.1 In India, when Productivity Parameters in major ports are discussed, traditionally,
the following parameters are reckoned to assess the effectiveness and efficiency of a
major port:
1. Average Pre-berthing Detention of Vessels (In hours) 2. Average Turnaround Time of Ships (In days) 3. Average Output per Ship berth day (In tonnes) 4. Average Idle time (%) 5. Average Berth Occupancy (%) 6. Percentage of Capacity Utilisation of berths 7. Average Gang Output per shift.
9.2 Of course, the total traffic , number of vessels and total number of TEUs handled
are also computed to indicate how big or small the port is. But, these parameters
definitely do not indicate how efficient a port is, unless they are correlated with the
number of berthing points a port possesses and the kind of cargo it handles viz., bulk,
break-bulk, liquid bulk and containerised cargo. Further, after commissioning of
container terminals in the country, calculation of ―Average moves per Crane-hour‖ in
each of the terminals, which ultimately show the productivity of the terminal, was also
considered.
9.3 However, when internationally acknowledged practices are discussed , the
above parameters are not much in vogue in international ports either in Asia, South
Africa Europe or United States. There is no concept of ―pre-berthing detention‖ as such
because in world class ports, the capacity is much more than the actual traffic and the
planning is also done on those lines. Hence, there is no question of any ship waiting at
anchorage. When average turnaround time is discussed, they may generally be
referred to in informal business conversations but not formally calculated since it all
depends upon the parcel size of the vessel calling, length of the channel in which
pilotage takes place, type of commodity and the mode of discharge/loading. It cannot be
generalised as the averages of such anomalous elements only distort the real picture
97
and convey wrong results and interpretations because weightages of different
commodities are different in each port. One commonly used parameter which could be
attributed to port‘s internal efficiency is the quantum of cargo that the port
discharges/loads from /to a ship in a day which is nothing but Output per ship berth day.
However, it will also differ according to the nature of commodity. Still, comparisons
could be made commodity-wise and it gives a fair comparison of the port‘s handling
efficiency. Of course, it does not indicate non-shore (water side) efficiency nor reflect
whether a port has adequate capacity to serve the demands of traffic/trade. It pre-
supposes that the port has built adequate capacity and no pre-berthing detention
accrues.
9.4 One parameter widely used internationally is ―Average moves per crane per
hour‖. With the advent of full-scale containerisation of general cargo all over the world
due to its obvious advantages, ports have seen a metamorphosis in terms of
commissioning of container terminals in majority of ports in the world and relatively less
emphasis is given on analysis of handling of traditional bulk cargo since the container
vessels are more modern and costly and hence turnaround should be faster. Hence,
many innovative methods and handling systems are found to achieve more productivity
in a container terminal. As a consequence, monitoring of terminal performance takes
an important seat and monitoring is done by meticulously watching the performance of
Shore Cranes. The best parameter for the purpose is ―Average moves per Crane hour‖.
Associated and derivative parameters like Number of moves per hour ( meaning total
moves of all cranes working for vessel – also known as Vessel throughput per hour) ,
terminal throughput (meaning the total TEUs handled by the terminal in a day), yard
productivity (meaning the number of containers handled in a yard) etc., have
subsequently emerged . This could be a real yardstick to measure and compare the
different terminals in the worlds on an even keel.
9.5 A survey of some available literature on the subject does not show any standard
KPIs defined for the port sector. However, on compilation through various sources of
information like UNCTAD Monographs on Port Management, other informal data
obtained from respective ports and some articles in shipping magazines, the following
position emerges:

98
PORT Crane Productivity
for small vessels
Berth Productivity for large vessels
Crane Productivity for large vessels
Berth Productivity for large vessels
Singapore PSA 23 45 36 140
Port Rashid and Jabel Ali 22
40 30 110
Khor-Fakkan, Fujairah 20 32 28 100
Salalah N/A N/A 29 90
Aden N/A N/A 28 70
India
NSICT JNPCT Tuticorin
18 16 14
30 24 14
22 20 -
40 36 -
Colombo - SLPA Colombo -SAGT
14 13
23 25
18
24-25
45
Belgium Ports
-
-
30-35
-
Shanghai
-
-
35
-
International Standards
-
-
27-33
-
9.6 If one expands the productivity parameters from Turnaround time to Dwell Time and compare with Port of Singapore, in general terms, the position emerges as follows:
Ports Dwell Time
(days)
Crane productivity (Moves/hr)
Evacuation System
Vessel evacuation
rate (Containers/hr)
Turnaround time
(days)
Major Indian Ports
3.78 20 Manual 40 1.77
Singapore 0.60 30 Automatic flow –thru
gate system
100 0.50
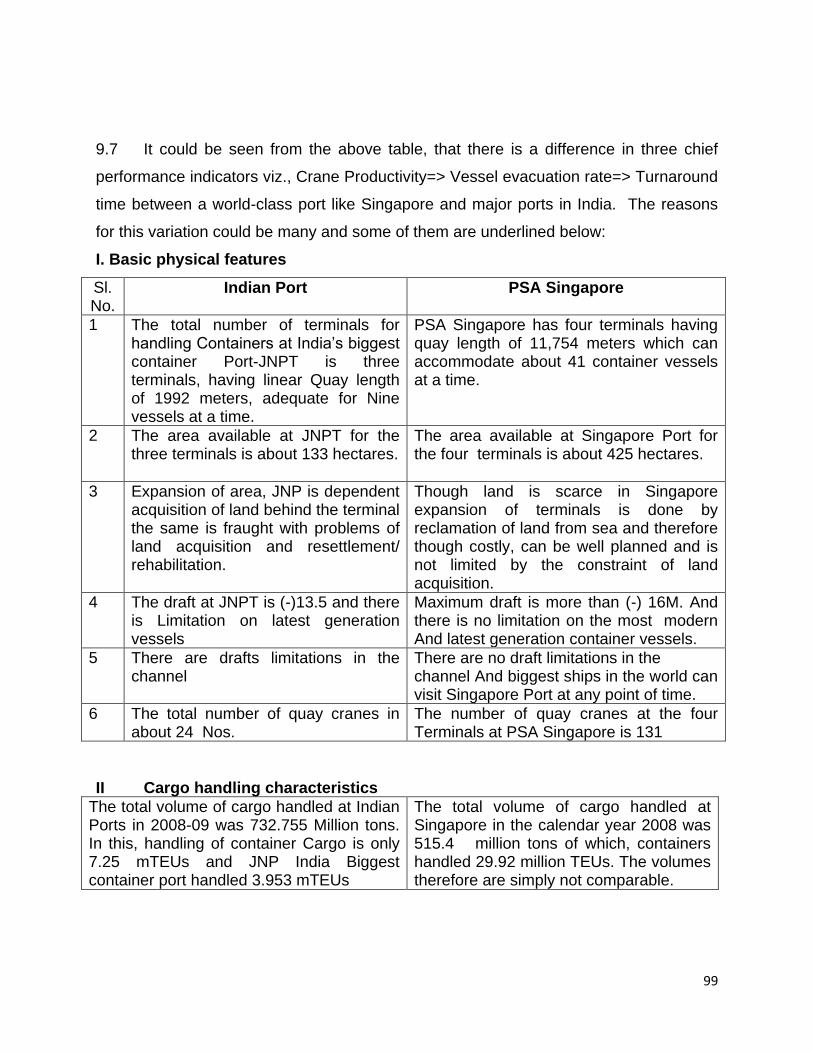
99
9.7 It could be seen from the above table, that there is a difference in three chief
performance indicators viz., Crane Productivity=> Vessel evacuation rate=> Turnaround
time between a world-class port like Singapore and major ports in India. The reasons
for this variation could be many and some of them are underlined below:
I. Basic physical features
Sl. No.
Indian Port PSA Singapore
1 The total number of terminals for handling Containers at India‘s biggest container Port-JNPT is three terminals, having linear Quay length of 1992 meters, adequate for Nine vessels at a time.
PSA Singapore has four terminals having quay length of 11,754 meters which can accommodate about 41 container vessels at a time.
2 The area available at JNPT for the three terminals is about 133 hectares.
The area available at Singapore Port for the four terminals is about 425 hectares.
3 Expansion of area, JNP is dependent acquisition of land behind the terminal the same is fraught with problems of land acquisition and resettlement/ rehabilitation.
Though land is scarce in Singapore expansion of terminals is done by reclamation of land from sea and therefore though costly, can be well planned and is not limited by the constraint of land acquisition.
4 The draft at JNPT is (-)13.5 and there is Limitation on latest generation vessels
Maximum draft is more than (-) 16M. And there is no limitation on the most modern And latest generation container vessels.
5 There are drafts limitations in the channel
There are no draft limitations in the channel And biggest ships in the world can visit Singapore Port at any point of time.
6 The total number of quay cranes in about 24 Nos.
The number of quay cranes at the four Terminals at PSA Singapore is 131
II Cargo handling characteristics
The total volume of cargo handled at Indian Ports in 2008-09 was 732.755 Million tons. In this, handling of container Cargo is only 7.25 mTEUs and JNP India Biggest container port handled 3.953 mTEUs
The total volume of cargo handled at Singapore in the calendar year 2008 was 515.4 million tons of which, containers handled 29.92 million TEUs. The volumes therefore are simply not comparable.
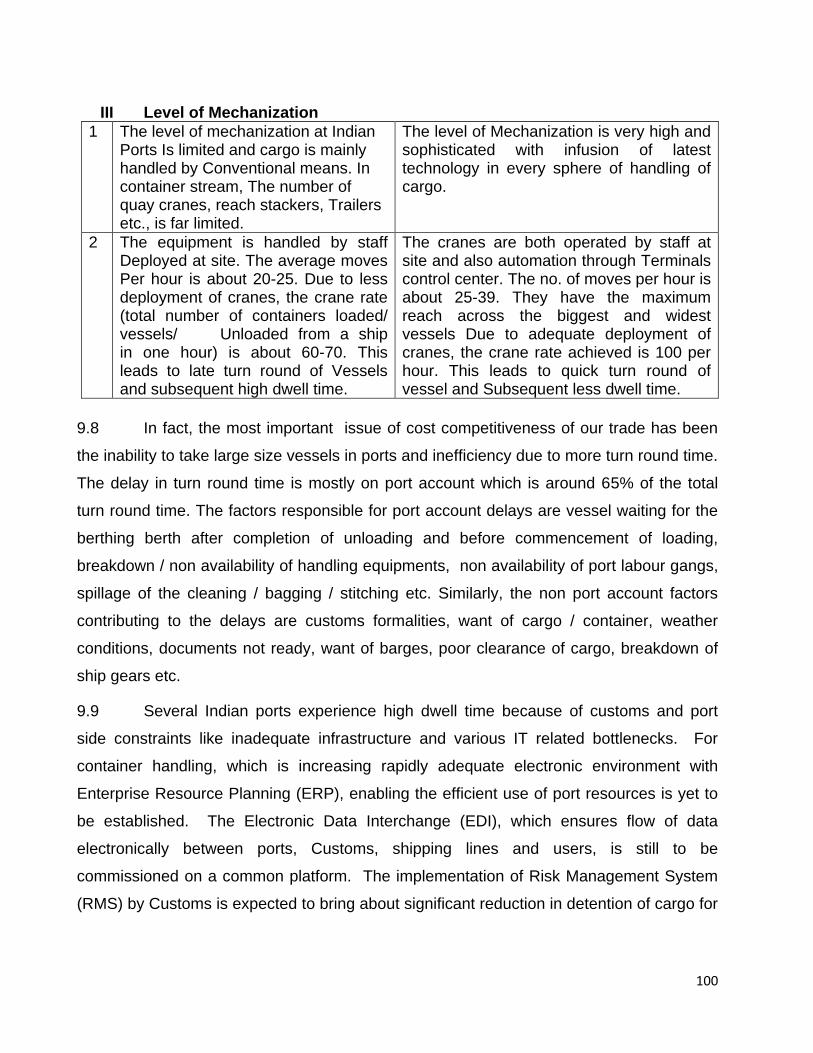
100
III Level of Mechanization
1 The level of mechanization at Indian Ports Is limited and cargo is mainly handled by Conventional means. In container stream, The number of quay cranes, reach stackers, Trailers etc., is far limited.
The level of Mechanization is very high and sophisticated with infusion of latest technology in every sphere of handling of cargo.
2 The equipment is handled by staff Deployed at site. The average moves Per hour is about 20-25. Due to less deployment of cranes, the crane rate (total number of containers loaded/ vessels/ Unloaded from a ship in one hour) is about 60-70. This leads to late turn round of Vessels and subsequent high dwell time.
The cranes are both operated by staff at site and also automation through Terminals control center. The no. of moves per hour is about 25-39. They have the maximum reach across the biggest and widest vessels Due to adequate deployment of cranes, the crane rate achieved is 100 per hour. This leads to quick turn round of vessel and Subsequent less dwell time.
9.8 In fact, the most important issue of cost competitiveness of our trade has been
the inability to take large size vessels in ports and inefficiency due to more turn round time.
The delay in turn round time is mostly on port account which is around 65% of the total
turn round time. The factors responsible for port account delays are vessel waiting for the
berthing berth after completion of unloading and before commencement of loading,
breakdown / non availability of handling equipments, non availability of port labour gangs,
spillage of the cleaning / bagging / stitching etc. Similarly, the non port account factors
contributing to the delays are customs formalities, want of cargo / container, weather
conditions, documents not ready, want of barges, poor clearance of cargo, breakdown of
ship gears etc.
9.9 Several Indian ports experience high dwell time because of customs and port
side constraints like inadequate infrastructure and various IT related bottlenecks. For
container handling, which is increasing rapidly adequate electronic environment with
Enterprise Resource Planning (ERP), enabling the efficient use of port resources is yet to
be established. The Electronic Data Interchange (EDI), which ensures flow of data
electronically between ports, Customs, shipping lines and users, is still to be
commissioned on a common platform. The implementation of Risk Management System
(RMS) by Customs is expected to bring about significant reduction in detention of cargo for

101
assessment and examination at ports. An assessment of working of RMS needs to be
made so that corrective measures, if necessary can be taken.
9.10 Taking the overall position of Indian Ports‘ performance, in order to really
improve the performance in terms of Pre-berthing Detention, Turnaround Time and Berth
Productivity in Indian Ports, the following broad strategies could be envisaged:
A. Capacity Creation: Although it is ideal to maintain a gap of 30% between the
installed capacity and the traffic according to the conventional international norms, it
may not be possible to maintain the exact gap all the time. The gap of 30% is
generally required to be maintained in order to take care of maintenance works at
the berths, approaches to the berths, equipments etc., it is not mandatory to
maintain this ideal gap. In fact, if the traffic outweighs capacity, capacity utilisation of
berths will be maximum which again indicates effective utilisation of berth capacity.
However, leaving this short-term gain, it is better if the ports create capacity in
excess of 30% of actual traffic over a period of time. In such a case, pre-berthing
detention on account of Port could be brought to almost ―zero‖.
B. Adequate drafts: Due to various reasons, the drafts at Indian Ports (both in the
channel and at berths) have historically been very low and not commensurate with
the developments taking place in the world in terms of change of ship sizes, higher
parcel sizes, changes in cargo trends such as containerization, project cargoes etc.,
If one would glance through the drafts available in Indian Ports, it goes as low as 7
mtrs in older ports and upto 16 mtrs in newer ports. Higher drafts are available in
very few ports only. Internationally, top 20 container ports in the world had drafts
ranging from 14 mtrs to 16 mtrs even in 2003. Thereafter, some ports in China and
other countries have enhanced drafts still further to accommodate Super Post
Panamax and above vessels. Hence, another important measure that the Ports are
required to do is to increase the drafts at least to 14 mtrs and upto 17 mtrs according
to the potential of bigger size vessels calling a particular port.

102
C. Massive Mechanisation: With the kind and size of vessels with higher parcel sizes
calling at Ports, loading and discharge rates should go phenomenally up from the
present low productivity levels at berth. Some ports in India discharge Fertilizers as
low as 2277 tonnes per day and maximum discharge is to the tune of 10931 MT per
day. With manual loading, Iron Ore is getting loaded into the ships at some ports to
the tune of 12028 MT per day whereas mechanized ports in India itself load around
50136 MT per day. International Comparison has been made in the previous pages
with regard to containers. It was also a fact that a ship which was loaded in 4 days in
a Chinese Port took 15 days to discharge at an Indian Port, despite efforts made at
all levels. It only goes to say that ―mechanization‖ is the need of the hour at all Indian
Ports - not a nominal or limited mechanization but a massive world-class
mechanization. It is a fact that till recently and even now, Ports have been grappling
with handling of cargo with the Electric Level Luffing Cranes of Capacity of 3T, 6T
and 10T. With this kind of mechanical aids, Indian Ports might find it difficult to
achieve international norms and standards of performance. Hence, it is high time,
Indian Ports should take up heavy mechanization programmes and each berth
should be equipped adequately with high capacity versatile Cranes, Conveyer
Systems, Silos, Harbour Mobile Cranes, Grab Unloaders and Gantry Cranes.
D. Development of Adequate Storage Areas: If one examines the entire chain of
cargo flow from /to the Port, he finds that the immediate concern for all the
stakeholders in the port is to feed/remove the cargo from the wharf so that
turnaround of ships shall be faster. There should not be congestion at wharf and
wharf clearance is of utmost importance. Towards this objective, apart from
deploying and achieving the manual and mechanical efficiency at wharf, clearance
of cargo from the wharf to/from some other plots, viz., storage areas has to targeted.
It is a general impression that the cargo should not dwell at the Port for longer
periods; rather, it can be taken to individual factory or consumption centres for feed
from there in case of exports. Although it is ideal to aim at, practically, it may result in
so many snags because the ultimate consumption centres or cargo generating
centres are far away from the ports. All over the world, land is always regarded as a
leverage point for port‘s development. If a port has adequate land, it should develop
103
or cause to develop adequate open stacking areas or closed warehouses near the
port, with sufficient disincentive to dump for longer periods and resort to ―stock &
sale‖ from such port areas. However, ports need to develop or cause to develop
storage areas near the port so that cargo can be cleared from the port faster and
achieve lower turnaround time. Incidentally, it may be mentioned that ―warehousing‖
if one of the port related functions and providing ―transit‖ is one of the primary
responsibilities of a port. The strategy of providing storage space for attracting the
traffic is well adopted by private ports like Mundra and Gangavaram.
E. Hinterland connectivity: In order to make Indian Ports comparable to International
Ports, not only improvements inside the port but also the improvements in logistics
network outside is ensured. One of the important factors apart from wharf clearance,
inside evacuation network, augmentation of storage space etc., is to really evacuate
the cargo from the port to hinterland. This holds true for every port, be it a Bulk Port
or a Container Port or a Specialised Cargo Port/ Terminal. We see in Europe that all
the ports have such a seamless connectivity that cargo flows and transported in the
entire Europe (even between the countries) uninterrupted and smooth. This ensures
minimum delays at the port as well as port area. Hence, Indian Ports, to be
comparable to International Ports, should have minimum 4-lane road connectivity as
well as double line rail connectivity.
F. Cost Efficiency: Shipping lines have been representing time and again that port
charges at Indian Ports are very high as compared to other comparable International
Ports. As a matter of fact, vessel related charges are perhaps higher than some of
the International Ports whereas cargo related charges are much lower in some
Indian Ports in comparison to ports abroad. If actual cost of handling per tonne is
reckoned, we find it is as low as Rs.41.41 at Mangalore, Rs.44.74 at Tuticorin and
Rs.45.20 at Kandla ( meaning, less than US $ 1 per ton). Hence, a generalised
statement based on a common perception by incorrectly grouping together vessel
and cargo related charges may not reflect a correct picture. If we take Vessel related
charges alone, the reasons for higher charges are mainly two: (1) higher cost of
dredging in certain ports, requiring perennial dredging and (2) lack of subsidy on the

104
part of Government. We have seen, in many parts of the world, some part of
dredging (at least Capital) is funded by Provincial Governments or Federal
Governments. If the same approach is adopted by Central Government or State
Governments, the vessel related charges also could be brought to the reasonable
levels. The whole position stated above is with regard to Port Cost, meaning thereby
cost at port. But, if we look at the overall cost at Port, including ship‘s waiting cost;
stevedoring charges, C&F charges, Vessel Agent charges etc., the cost may be
higher than that of international ports. The best way to deal with it is to reduce pre-
berthing time to zero, bring down ship turnaround time to the minimum levels, and
achieve higher productivity levels for which the above mentioned strategies may
really work wonders.
9.11 To sum up, Indian Ports have to lay their emphasis and focus on improving Berth
Productivity for container vessels as also the Turnaround Time of ships. Indian Ports, as
of now, irrespective of Public or Private, are not comparable to world-class ports due to
various reasons. The broad strategies to make Indian Ports to achieve international
standards are Capacity Creation, increase in the drafts, massive mechanisation,
development of adequate storage areas, providing seamless hinterland connectivity and
attaining cost efficiency.

105
CHAPTER – 10
CATEGORY-WISE PROJECTS AND THE FUNDING PATTERN FOR MAJOR PORTS AND MARITIMES STATES UPTO 2020
10.1 In order to meet the projected traffic and estimated capacity as indicated in the previous
Chapter for Major Ports and Non Major Ports, a number of development projects has also been
identified under five projects heads viz. deepening of channels, construction and re-construction
of berths, procurement / modernization of equipments, hinterland connectivity and various other
developmental works to be taken up in three phases i.e. Phase – I, Phase – II and Phase – III
by the terminal year of the 11th five year plan (2011-12), by the terminal year of the 12th five year
plan (2016-17) and by the end of the financial year 2020, respectively. The details are as follows:
10.2 Major Ports – Projects and Funding Pattern
Kolkata Port Trust
10.2.1 Kolkata Port Trust has proposed out an investment plan for Rs. 1824.90 crores for 7
projects in phase I, Rs. 8690.47 crores for 15 projects in Phase II and Rs. 260.00 crores for 3
projects in Phase III. The Private sector investment has been proposed for Rs. 760.00 crores, Rs.
8011.00 crores and Rs. 215.00 crores in three phases respectively. The above investments and
projects include Kolkata Dock System and Haldia Dock Complex. The details of number of
projects - ongoing as well as to be undertaken in 3 phases under different project heads, along
with their estimated costs is given as under:
Sl. No.
PROJECT HEAD Ongoing Projects
PHASE – I (2010-2012)
PHASE – II (2012-2017)
PHASE – III (2017-2020)
No. of Projects
Estimated Cost* (Rs. In Crore)
No. of Projects
Estimated Cost* (Rs. In Crore)
No. of Projects
Estimated Cost* (Rs. In Crore)
No. of Projects
Estimated Cost* (Rs. In Crore)
1 2 3 4 5 6 7 8 9 10
1. Deepening of Channel / Berths etc.
- - 1 1000.00 - - - -
2. Construction/Reconstruc tion of Berths/ Jetties etc.
- - 4 801.90 6 6883.00 - -
3. Procurement of Equipments etc.
2 325.80 2 23.00 4 628.47 - -
4. Rail / Road Connectivity Works
1 30.00 - - 3 1075.00 - -
5. Other Works 1 6.10 - - 2 104.00 3 260.00
TOTAL 4 361.90 7 1824.90 15 8690.47 3 260.00
Note : (*) Estimated Cost is for the Projects proposed to be taken up/under execution during that period.
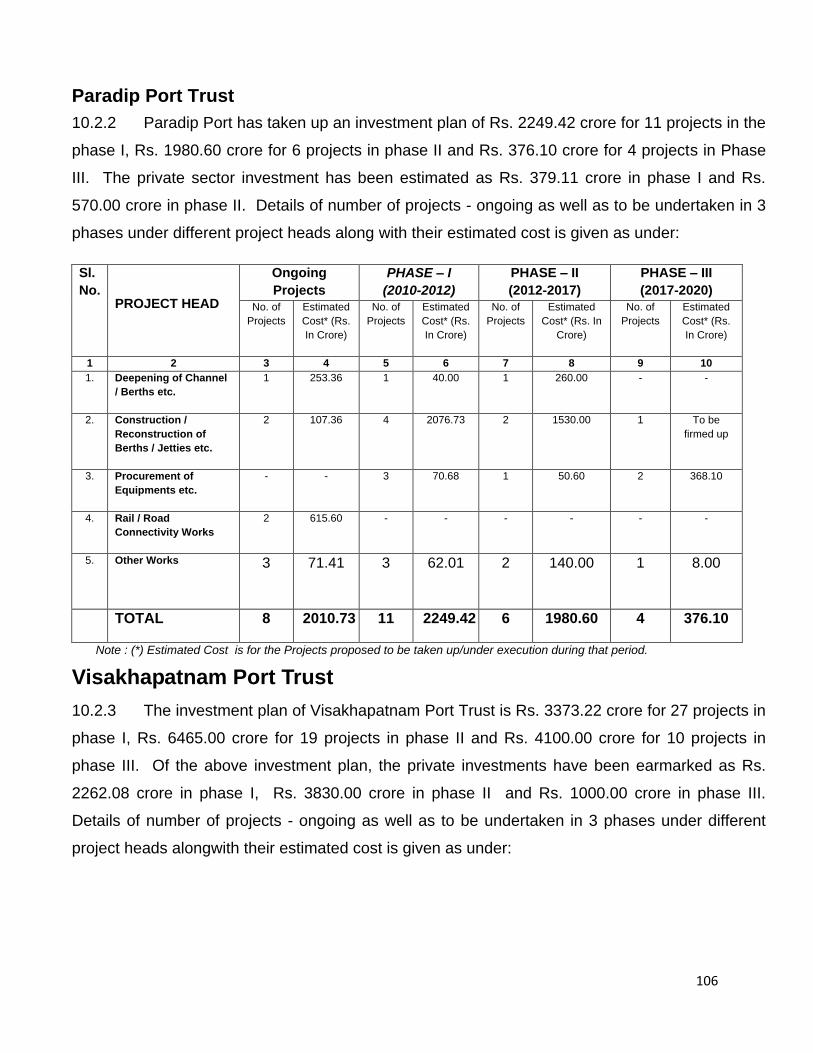
106
Paradip Port Trust
10.2.2 Paradip Port has taken up an investment plan of Rs. 2249.42 crore for 11 projects in the
phase I, Rs. 1980.60 crore for 6 projects in phase II and Rs. 376.10 crore for 4 projects in Phase
III. The private sector investment has been estimated as Rs. 379.11 crore in phase I and Rs.
570.00 crore in phase II. Details of number of projects - ongoing as well as to be undertaken in 3
phases under different project heads along with their estimated cost is given as under:
Sl.
No.
PROJECT HEAD
Ongoing
Projects
PHASE – I
(2010-2012)
PHASE – II
(2012-2017)
PHASE – III
(2017-2020)
No. of
Projects
Estimated
Cost* (Rs.
In Crore)
No. of
Projects
Estimated
Cost* (Rs.
In Crore)
No. of
Projects
Estimated
Cost* (Rs. In
Crore)
No. of
Projects
Estimated
Cost* (Rs.
In Crore)
1 2 3 4 5 6 7 8 9 10
1. Deepening of Channel
/ Berths etc.
1 253.36 1 40.00 1 260.00 - -
2. Construction /
Reconstruction of
Berths / Jetties etc.
2 107.36 4 2076.73 2 1530.00 1 To be
firmed up
3. Procurement of
Equipments etc.
- - 3 70.68 1 50.60 2 368.10
4. Rail / Road
Connectivity Works
2 615.60 - - - - - -
5. Other Works
3 71.41 3 62.01 2 140.00 1 8.00
TOTAL 8 2010.73 11 2249.42 6 1980.60 4 376.10
Note : (*) Estimated Cost is for the Projects proposed to be taken up/under execution during that period.
Visakhapatnam Port Trust
10.2.3 The investment plan of Visakhapatnam Port Trust is Rs. 3373.22 crore for 27 projects in
phase I, Rs. 6465.00 crore for 19 projects in phase II and Rs. 4100.00 crore for 10 projects in
phase III. Of the above investment plan, the private investments have been earmarked as Rs.
2262.08 crore in phase I, Rs. 3830.00 crore in phase II and Rs. 1000.00 crore in phase III.
Details of number of projects - ongoing as well as to be undertaken in 3 phases under different
project heads alongwith their estimated cost is given as under:

107
Sl. No.
PROJECT HEAD
Ongoing Projects
PHASE – I (2010-2012)
PHASE – II (2012-2017)
PHASE – III (2017-2020)
No. of Projects
Estimated Cost* (Rs. In Crore)
No. of Projects
Estimated Cost* (Rs. In Crore)
No. of Projects
Estimated Cost* (Rs. In Crore)
No. of Projects
Estimated Cost* (Rs. In
Crore)
1 2 3 4 5 6 7 8 9 10
1. Deepening of Channel / Berths etc.
- - 3 412.14 2 200.00 2 1500.00
2. Construction / Reconstruction of Berths / Jetties etc.
1 35.19 12 1873.07 5 5630.00 3 2300.00
3. Procurement of Equipments etc.
1 444.10 5 654.01 1 90.00 - -
4. Rail / Road Connectivity Works
3 100.00 3 296.00 2 150.00 3 200.00
5. Other Works 5 166.46 4 138.00 9 395.00 2 100.00
TOTAL 10 745.75 27 3373.22 19 6465.00 10 4100.00
Note : (*) Estimated Cost is for the Projects proposed to be taken up/under execution during that period.
Ennore Port Limited
10.2.4 Ennore Port has envisaged an investment plan of Rs. 1636.92 crore for 6 projects in phase I,
Rs. 3622.00 crore for 5 projects in phase II and no project for phase III. Of the above investment plan, the
private investments have been estimated as Rs. 100.00 crore only in phase II. Details of number of
projects - ongoing as well as to be undertaken in 3 phases under different project heads alongwith their
estimated cost is given as under:
Sl. No.
PROJECT HEAD
Ongoing Projects
PHASE – I (2010-2012)
PHASE – II (2012-2017)
PHASE – III (2017-2020)
No. of Projects
Estimated Cost* (Rs. In Crore)
No. of Projects
Estimated Cost* (Rs. In Crore)
No. of Projects
Estimated Cost* (Rs. In Crore)
No. of Projects
Estimated Cost* (Rs. In
Crore)
1 2 3 4 5 6 7 8 9 10
1. Deepening of Channel / Berths etc.
- - 1 221.00 1 219.00 - -
2. Construction / Reconstruction of Berths / Jetties etc.
3 2286.13 2 310.00 3 357.00 - -
3. Procurement of Equipments etc.
- - - - - - - -
4. Rail / Road Connectivity Works
2 122.02 1 454.32 1 446.00 - -
5. Other Works - - - - - - - -
TOTAL 5 2408.15 4 985.32 5 1022.00 - -
Note : (*) Estimated Cost is for the Projects proposed to be taken up/under execution during that period.

108
Chennai Port Trust
10.2.5 Chennai Port has chalked out an investment plan of Rs. 5224.04 crore for 9 projects in
phase I, Rs. 4231.00 crore for another 13 projects in phase II and Rs. 1125.00 crore for 7 projects
in phase III. The investments from Private Sector for the three phases are Rs. 4262.24 crore in
phase I, Rs. 2911.00 crore in phase II and Rs. 795.00 crore in phase III respectively. Details of
number of projects - ongoing as well as to be undertaken in 3 phases under different project
heads alongwith their estimated cost is given as under:
[
Sl. No.
PROJECT HEAD
Ongoing Projects
PHASE – I (2010-2012)
PHASE – II (2012-2017)
PHASE – III (2017-2020)
No. of Projects
Estimated Cost* (Rs. In Crore)
No. of Projects
Estimated Cost* (Rs. In Crore)
No. of Projects
Estimated Cost* (Rs. In Crore)
No. of Projects
Estimated Cost* (Rs. In
Crore)
1 2 3 4 5 6 7 8 9 10
1. Deepening of Channel / Berths etc.
1 143.00 1 561.00 1 - - -
2. Construction / Reconstruction of Berths / Jetties etc.
1 200.00 3 3259.80 4 925.00 1 500.00
3. Procurement of Equipments etc.
- - - - - - - -
4. Rail / Road Connectivity Works
1 400.00 1 600.00 - - 2 225.00
5. Other Works
1 200.00 4 803.24 8 3306.00
4 400.00
TOTAL 4 943.00 9 5224.04
13 4231.00
7 1125.00
Note : (*) Estimated Cost is for the Projects proposed to be taken up/under execution during that period.
Tuticorin Port Trust
10.2.6 Tuticorin Port has envisaged an investment plan of Rs. 1154.55 crore for 7. projects in phase I,
Rs. 1444.32 crore for 6 projects in phase II and Rs. 3907.00 crore for 11 projects under phase III schemes.
The provisions of private sector investment for the above projects are Rs. 873.08 crore in phase I, Rs.
664.32 crore in phase II and Rs. 1200.00 crore in phase III. Details of number of projects - ongoing as well
as to be undertaken in 3 phases under different project heads alongwith their estimated cost is given as
under:
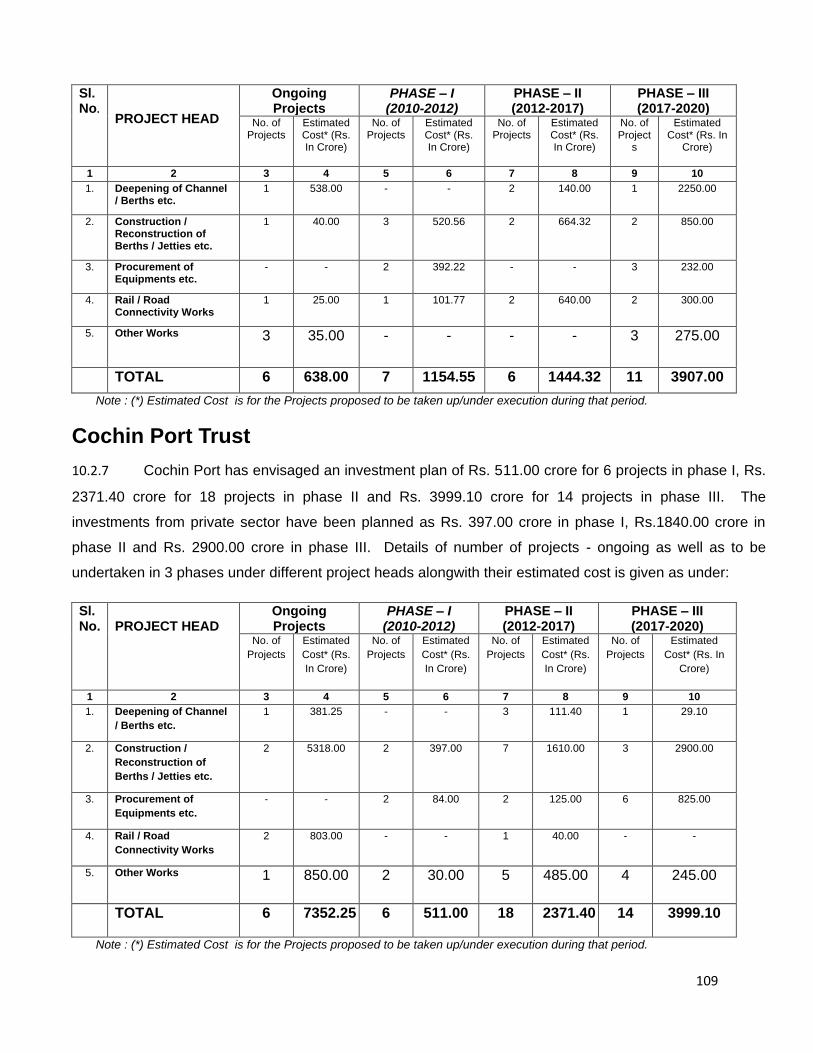
109
Sl. No.
PROJECT HEAD
Ongoing Projects
PHASE – I (2010-2012)
PHASE – II (2012-2017)
PHASE – III (2017-2020)
No. of Projects
Estimated Cost* (Rs. In Crore)
No. of Projects
Estimated Cost* (Rs. In Crore)
No. of Projects
Estimated Cost* (Rs. In Crore)
No. of Project
s
Estimated Cost* (Rs. In
Crore)
1 2 3 4 5 6 7 8 9 10
1. Deepening of Channel / Berths etc.
1 538.00 - - 2 140.00 1 2250.00
2. Construction / Reconstruction of Berths / Jetties etc.
1 40.00 3 520.56 2 664.32 2 850.00
3. Procurement of Equipments etc.
- - 2 392.22 - - 3 232.00
4. Rail / Road Connectivity Works
1 25.00 1 101.77 2 640.00 2 300.00
5. Other Works
3 35.00 - - - - 3 275.00
TOTAL 6 638.00 7 1154.55 6 1444.32 11 3907.00
Note : (*) Estimated Cost is for the Projects proposed to be taken up/under execution during that period.
Cochin Port Trust
10.2.7 Cochin Port has envisaged an investment plan of Rs. 511.00 crore for 6 projects in phase I, Rs.
2371.40 crore for 18 projects in phase II and Rs. 3999.10 crore for 14 projects in phase III. The
investments from private sector have been planned as Rs. 397.00 crore in phase I, Rs.1840.00 crore in
phase II and Rs. 2900.00 crore in phase III. Details of number of projects - ongoing as well as to be
undertaken in 3 phases under different project heads alongwith their estimated cost is given as under:
Sl. No.
PROJECT HEAD
Ongoing Projects
PHASE – I (2010-2012)
PHASE – II (2012-2017)
PHASE – III (2017-2020)
No. of
Projects
Estimated
Cost* (Rs.
In Crore)
No. of
Projects
Estimated
Cost* (Rs.
In Crore)
No. of
Projects
Estimated
Cost* (Rs.
In Crore)
No. of
Projects
Estimated
Cost* (Rs. In
Crore)
1 2 3 4 5 6 7 8 9 10
1. Deepening of Channel
/ Berths etc.
1 381.25 - - 3 111.40 1 29.10
2. Construction /
Reconstruction of
Berths / Jetties etc.
2 5318.00 2 397.00 7 1610.00 3 2900.00
3. Procurement of
Equipments etc.
- - 2 84.00 2 125.00 6 825.00
4. Rail / Road
Connectivity Works
2 803.00 - - 1 40.00 - -
5. Other Works
1 850.00 2 30.00 5 485.00 4 245.00
TOTAL 6 7352.25 6 511.00 18 2371.40 14 3999.10
Note : (*) Estimated Cost is for the Projects proposed to be taken up/under execution during that period.

110
New Mangalore Port Trust
10.2.8 New Mangalore Port has envisaged an investment plan of Rs 378.90 crore for 3 projects in
phase I, Rs. 1147.00 crore for 3 projects in phase II and Rs. 390.00 crore for 1 project in phase III. The
private investment for phase I and phase II have been projected as Rs. 299.73 crore and Rs. 850 crore
respectively. No private investment has been planned in phase III. Details of number of projects - ongoing
as well as to be undertaken in 3 phases under different project heads alongwith their estimated cost is
given as under:
Sl. No.
PROJECT HEAD
Ongoing Projects
PHASE – I (2010-2012)
PHASE – II (2012-2017)
PHASE – III (2017-20)
No. of
Projects
Estimated
Cost* (Rs.
In Crore)
No. of
Projects
Estimated
Cost* (Rs.
In Crore)
No. of
Projects
Estimated
Cost* (Rs.
In Crore)
No. of
Projects
Estimated
Cost* (Rs. In
Crore)
1 2 3 4 5 6 7 8 9 10
1. Deepening of Channel
/ Berths etc.
- - - - - - 1 390.00
2. Construction /
Reconstruction of
Berths / Jetties etc.
1 230.00 2 348.90 3 1147.00 - -
3. Procurement of
Equipments etc.
1 296.03 1 30.00 - - - -
4. Rail / Road
Connectivity Works
2 69.55 - - - - - -
5. Other Works
- - - - - - - -
TOTAL 4 595.58 3 378.90 3 1147.00 1 390.00
Note : (*) Estimated Cost is for the Projects proposed to be taken up/under execution during that period.

111
Mormugao Port Trust
10.2.9 The investment plan of Mormugao Port Trust is Rs. 496.00 crore for 1 projects in phase I, Rs.
2391.80 crore for 4 projects under phase II. No investment plan has been projected for phase III. The
private investment has been projected for Rs. 496.00 crore in phase I and Rs. 1946.00 crore for Phase II.
Details of number of projects - ongoing as well as to be undertaken in 3 phases under different project
heads alongwith their estimated cost is given as under:
Sl. No.
PROJECT HEAD
Ongoing Projects
PHASE – I (2010-2012)
PHASE – II (2012-2017)
PHASE – III (2017-20)
No. of
Projects
Estimated
Cost* (Rs.
In Crore)
No. of
Projects
Estimated
Cost* (Rs.
In Crore)
No. of
Projects
Estimated
Cost* (Rs.
In Crore)
No. of
Projects
Estimated
Cost* (Rs. In
Crore)
1 2 3 4 5 6 7 8 9 10
1. Deepening of Channel
/ Berths etc.
1 50.00 - - - - - -
2. Construction /
Reconstruction of
Berths / Jetties etc.
2 63.00 1 496.00 3 1946.00 - -
3. Procurement of
Equipments etc.
1 15.00 - - 1 445.80 - -
4. Rail / Road
Connectivity Works
- - - - - - - -
5. Other Works
- - - - - - - -
TOTAL 4 128.00 1 496.00 4 2391.80 - -
Note : (*) Estimated Cost is for the Projects proposed to be taken up/under execution during that period.
Mumbai Port Trust
10.2.10 Mumbai Port Trust has chalked out an investment plan of Rs. 919.50 crore for 10
projects in phase I, Rs. 1371.50 crore for 9 projects in phase II and Rs. 3900 crore for 3 projects
under phase III. The proposed private investments for 3 phases are as follows: Rs. 100.00 crore
in phase I, Rs. 400.00 crore in phase II and Rs. 1500.00 crore in phase III. Details of number of
projects - ongoing as well as to be undertaken in 3 phases under different project heads alongwith
their estimated cost is given as under:

112
Sl. No.
PROJECT HEAD
Ongoing Projects
PHASE – I (2010-2012)
PHASE – II (2012-2017)
PHASE – III (2017-20)
No. of
Projects
Estimated
Cost* (Rs.
In Crore)
No. of
Projects
Estimated
Cost* (Rs.
In Crore)
No. of
Projects
Estimated
Cost* (Rs.
In Crore)
No. of
Projects
Estimated
Cost* (Rs. In
Crore)
1 2 3 4 5 6 7 8 9 10
1. Deepening of Channel
/ Berths etc.
- - 2 1038.00 1 50.00 - -
2. Construction /
Reconstruction of
Berths / Jetties etc.
1 1460.52 2 469.00 4 971.50 2 2040.00
3. Procurement of
Equipments etc.
- - 3 48.00 1 50.00 - -
4. Rail / Road
Connectivity Works
1 333.00 - - - - - -
5. Other Works
1 50.00 3 164.50 3 300.00 1 1860.00
TOTAL 3 1843.52 10 919.50 9 1371.50 3 3900.00
Note : (*) Estimated Cost is for the Projects proposed to be taken up/under execution during that period.
Jawaharlal Nehru Port Trust
10.2.11 JNPT has projected an investment plan of Rs. 9467.00 crore for 12 projects in phase
I, Rs. 11851.10 crore for 10 projects in phase II and Rs. 23.10 crore for 1 project in phase III. The
proposed private investments are Rs. 6988.00 crore in phase I, Rs. 8600.00 crore in phase II. No
private investment has been projected in phase III. Details of number of projects - ongoing as well
as to be undertaken in 3 phases under different project heads alongwith their estimated cost is
given as under:
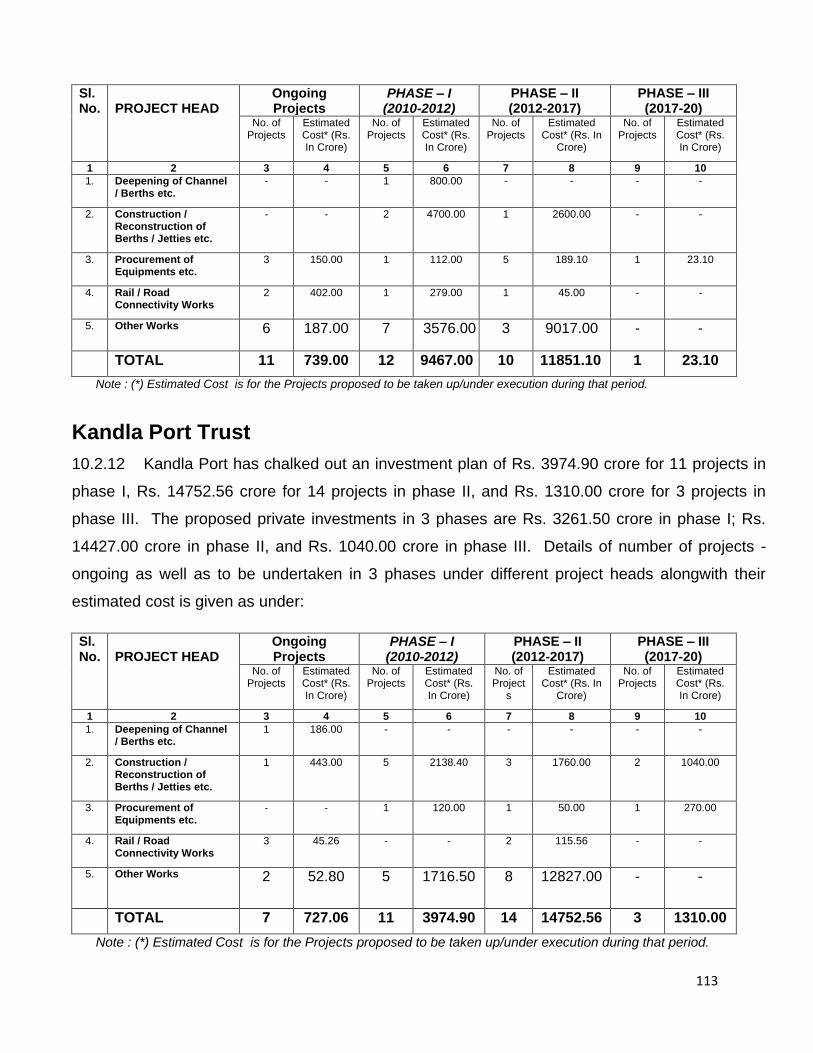
113
Sl. No.
PROJECT HEAD
Ongoing Projects
PHASE – I (2010-2012)
PHASE – II (2012-2017)
PHASE – III (2017-20)
No. of Projects
Estimated Cost* (Rs. In Crore)
No. of Projects
Estimated Cost* (Rs. In Crore)
No. of Projects
Estimated Cost* (Rs. In
Crore)
No. of Projects
Estimated Cost* (Rs. In Crore)
1 2 3 4 5 6 7 8 9 10
1. Deepening of Channel / Berths etc.
- - 1 800.00 - - - -
2. Construction / Reconstruction of Berths / Jetties etc.
- - 2 4700.00 1 2600.00 - -
3. Procurement of Equipments etc.
3 150.00 1 112.00 5 189.10 1 23.10
4. Rail / Road Connectivity Works
2 402.00 1 279.00 1 45.00 - -
5. Other Works
6 187.00 7 3576.00 3 9017.00 - -
TOTAL 11 739.00 12 9467.00 10 11851.10 1 23.10
Note : (*) Estimated Cost is for the Projects proposed to be taken up/under execution during that period.
Kandla Port Trust
10.2.12 Kandla Port has chalked out an investment plan of Rs. 3974.90 crore for 11 projects in
phase I, Rs. 14752.56 crore for 14 projects in phase II, and Rs. 1310.00 crore for 3 projects in
phase III. The proposed private investments in 3 phases are Rs. 3261.50 crore in phase I; Rs.
14427.00 crore in phase II, and Rs. 1040.00 crore in phase III. Details of number of projects -
ongoing as well as to be undertaken in 3 phases under different project heads alongwith their
estimated cost is given as under:
Sl. No.
PROJECT HEAD
Ongoing Projects
PHASE – I (2010-2012)
PHASE – II (2012-2017)
PHASE – III (2017-20)
No. of Projects
Estimated Cost* (Rs. In Crore)
No. of Projects
Estimated Cost* (Rs. In Crore)
No. of Project
s
Estimated Cost* (Rs. In
Crore)
No. of Projects
Estimated Cost* (Rs. In Crore)
1 2 3 4 5 6 7 8 9 10
1. Deepening of Channel / Berths etc.
1 186.00 - - - - - -
2. Construction / Reconstruction of Berths / Jetties etc.
1 443.00 5 2138.40 3 1760.00 2 1040.00
3. Procurement of Equipments etc.
- - 1 120.00 1 50.00 1 270.00
4. Rail / Road Connectivity Works
3 45.26 - - 2 115.56 - -
5. Other Works
2 52.80 5 1716.50 8 12827.00 - -
TOTAL 7 727.06 11 3974.90 14 14752.56 3 1310.00
Note : (*) Estimated Cost is for the Projects proposed to be taken up/under execution during that period.
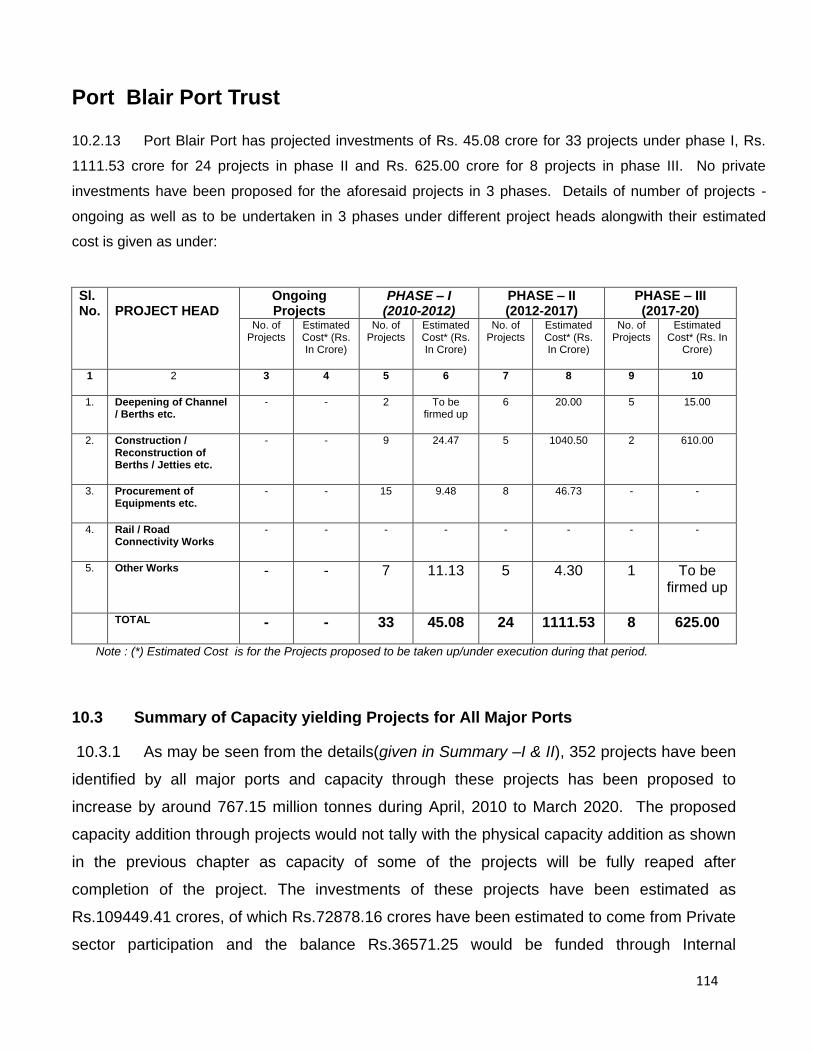
114
Port Blair Port Trust
10.2.13 Port Blair Port has projected investments of Rs. 45.08 crore for 33 projects under phase I, Rs.
1111.53 crore for 24 projects in phase II and Rs. 625.00 crore for 8 projects in phase III. No private
investments have been proposed for the aforesaid projects in 3 phases. Details of number of projects -
ongoing as well as to be undertaken in 3 phases under different project heads alongwith their estimated
cost is given as under:
Sl. No.
PROJECT HEAD
Ongoing Projects
PHASE – I (2010-2012)
PHASE – II (2012-2017)
PHASE – III (2017-20)
No. of Projects
Estimated Cost* (Rs. In Crore)
No. of Projects
Estimated Cost* (Rs. In Crore)
No. of Projects
Estimated Cost* (Rs. In Crore)
No. of Projects
Estimated Cost* (Rs. In
Crore)
1 2 3 4 5 6 7 8 9 10
1. Deepening of Channel / Berths etc.
- - 2 To be firmed up
6 20.00 5 15.00
2. Construction / Reconstruction of Berths / Jetties etc.
- - 9 24.47 5 1040.50 2 610.00
3. Procurement of Equipments etc.
- - 15 9.48 8 46.73 - -
4. Rail / Road Connectivity Works
- - - - - - - -
5. Other Works
- - 7 11.13 5 4.30 1 To be firmed up
TOTAL - - 33 45.08 24 1111.53 8 625.00
Note : (*) Estimated Cost is for the Projects proposed to be taken up/under execution during that period.
10.3 Summary of Capacity yielding Projects for All Major Ports
10.3.1 As may be seen from the details(given in Summary –I & II), 352 projects have been
identified by all major ports and capacity through these projects has been proposed to
increase by around 767.15 million tonnes during April, 2010 to March 2020. The proposed
capacity addition through projects would not tally with the physical capacity addition as shown
in the previous chapter as capacity of some of the projects will be fully reaped after
completion of the project. The investments of these projects have been estimated as
Rs.109449.41 crores, of which Rs.72878.16 crores have been estimated to come from Private
sector participation and the balance Rs.36571.25 would be funded through Internal
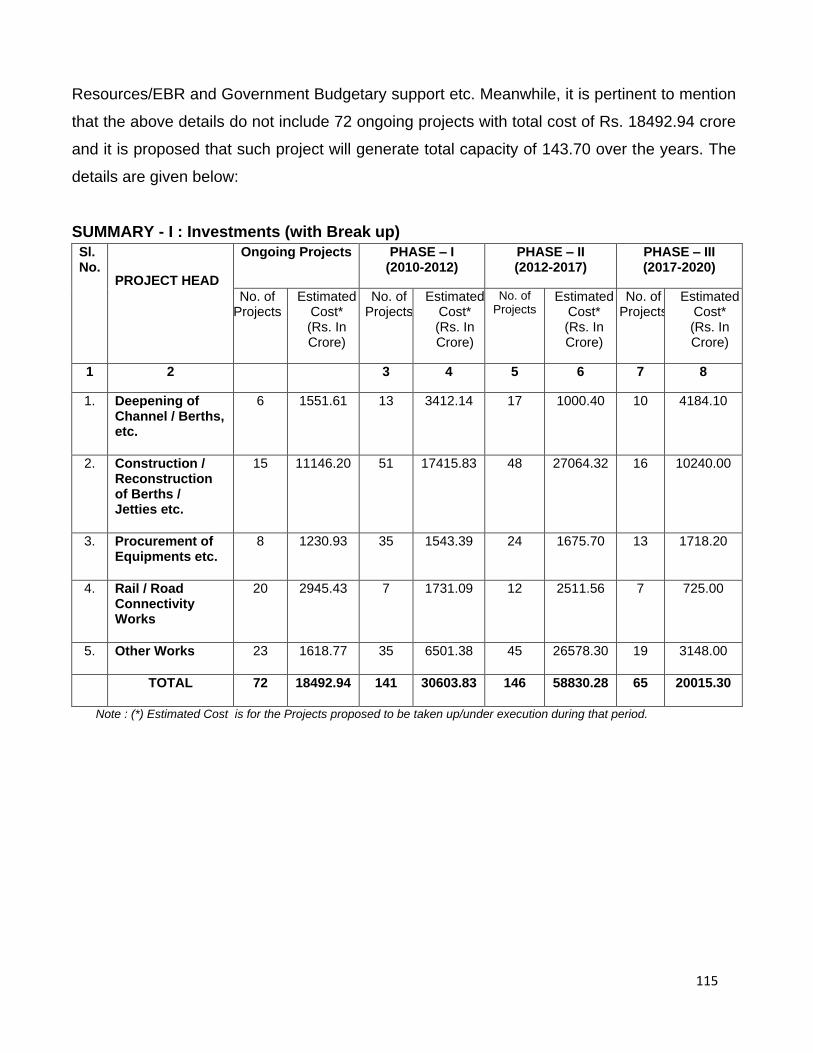
115
Resources/EBR and Government Budgetary support etc. Meanwhile, it is pertinent to mention
that the above details do not include 72 ongoing projects with total cost of Rs. 18492.94 crore
and it is proposed that such project will generate total capacity of 143.70 over the years. The
details are given below:
SUMMARY - I : Investments (with Break up)
Sl.No.
PROJECT HEAD
Ongoing Projects PHASE – I (2010-2012)
PHASE – II (2012-2017)
PHASE – III (2017-2020)
No. of Projects
Estimated Cost* (Rs. In Crore)
No. of Projects
Estimated Cost* (Rs. In Crore)
No. of Projects
Estimated Cost* (Rs. In Crore)
No. of Projects
Estimated Cost* (Rs. In Crore)
1 2 3 4 5 6 7 8
1. Deepening of Channel / Berths, etc.
6 1551.61 13 3412.14 17 1000.40 10 4184.10
2. Construction / Reconstruction of Berths / Jetties etc.
15 11146.20 51 17415.83 48 27064.32 16 10240.00
3. Procurement of Equipments etc.
8 1230.93 35 1543.39 24 1675.70 13 1718.20
4. Rail / Road Connectivity Works
20 2945.43 7 1731.09 12 2511.56 7 725.00
5. Other Works 23 1618.77 35 6501.38 45 26578.30 19 3148.00
TOTAL 72 18492.94 141 30603.83 146 58830.28 65 20015.30
Note : (*) Estimated Cost is for the Projects proposed to be taken up/under execution during that period.
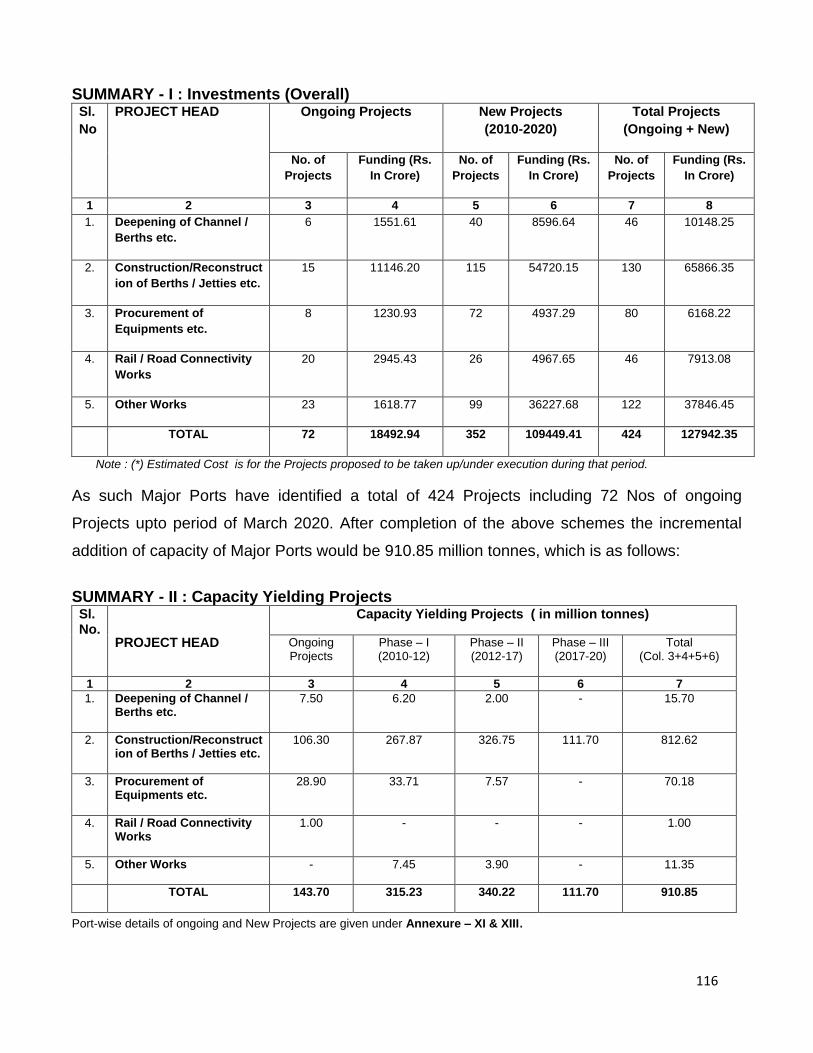
116
SUMMARY - I : Investments (Overall) Sl.
No
PROJECT HEAD Ongoing Projects New Projects
(2010-2020)
Total Projects
(Ongoing + New)
No. of
Projects
Funding (Rs.
In Crore)
No. of
Projects
Funding (Rs.
In Crore)
No. of
Projects
Funding (Rs.
In Crore)
1 2 3 4 5 6 7 8
1. Deepening of Channel /
Berths etc.
6 1551.61 40 8596.64 46 10148.25
2. Construction/Reconstruct
ion of Berths / Jetties etc.
15 11146.20 115 54720.15 130 65866.35
3. Procurement of
Equipments etc.
8 1230.93 72 4937.29 80 6168.22
4. Rail / Road Connectivity
Works
20 2945.43 26 4967.65 46 7913.08
5. Other Works 23 1618.77 99 36227.68 122 37846.45
TOTAL 72 18492.94 352 109449.41 424 127942.35
Note : (*) Estimated Cost is for the Projects proposed to be taken up/under execution during that period.
As such Major Ports have identified a total of 424 Projects including 72 Nos of ongoing
Projects upto period of March 2020. After completion of the above schemes the incremental
addition of capacity of Major Ports would be 910.85 million tonnes, which is as follows:
SUMMARY - II : Capacity Yielding Projects Sl.No.
PROJECT HEAD
Capacity Yielding Projects ( in million tonnes)
Ongoing Projects
Phase – I (2010-12)
Phase – II (2012-17)
Phase – III (2017-20)
Total (Col. 3+4+5+6)
1 2 3 4 5 6 7
1. Deepening of Channel / Berths etc.
7.50 6.20 2.00 - 15.70
2. Construction/Reconstruct ion of Berths / Jetties etc.
106.30 267.87 326.75 111.70 812.62
3. Procurement of Equipments etc.
28.90 33.71 7.57 - 70.18
4. Rail / Road Connectivity Works
1.00 - - - 1.00
5. Other Works - 7.45 3.90 - 11.35
TOTAL 143.70 315.23 340.22 111.70 910.85
Port-wise details of ongoing and New Projects are given under Annexure – XI & XIII.

117
10.4 From the above, it could be gauged that Major Ports in India have drawn up some
ambitious expansion plans during the next decade, thereby intending to create substantial
additional capacity. Some of the major and important capacity yielding projects include :
10.4.1 Kolkata Port’s River Regulatory Measures for improvement of draft of Hooghly
estuary, development of four container handling jetties at Diamond Harbour; development
of full fledged cargo handling facilities at Saugor Island; Transloading facilities at
Sandheads and development of Port facilities at Haldia Dock II (Shalukhali).
10.4.2 Paradip Port’s projects include development of multi purpose clean cargo
berth, construction of Southern Oil Jetty, installation of second and third SPM by Indian Oil
Corporation; deepening of channel to increase a draft from 16 meters to 18.5 meters.
Development of western Dock, Construction of Offshore Breakwater, Replacement of
Equipments in MCHP etc.
10.4.3 Visakhapatnam Port’s major projects of expansion include Deepening of
entrance channel. Additional Oil handling facilities for POL, Outer harbor expansion,
Construction of WQ7, WQ8, WQ6, EQ!A berths at inner harbor, Development of Satellite
Port at Bhimunipatnam apart from the strengthening of existing berths.
10.4.4 Chennai Port’s major investment projects are besides capital dredging creation
of mega container terminal apart from development of two more container terminals within
docks, development of elevated corridor from Chennai Port to Maduravoil, development of
one liquid cargo berth and development of integrated Dry Port and Multi Model Logistics
Hub near Sriperumbudur
10.4.5 Tuticorin Port‗s plan include apart from Capital Dreding projects . development
of 3 North-Cargo berths, 2 additional container terminals and an Outer Harbour &
upgradation of Mechanical Handling equipment.
10.4.6 Ennore Port plans to take up projects including Capital Dredging, construction of
one Coal berth , development of LNG Terminal , 2nd Marine Liquid Terminal etc.

118
10.4.7 Major Developmental projects of Cochin Port include construction/ Development
of LNG re-Gasification terminal Ph-II , International Container Transshipment Terminal Ph
II & Ph III, and a Deep Water Outer Harbour apart from the projects of Multi-User
Bunkering Terminal & International Cruise Terminal.
10.4.8 New Mangalore Port’s major projects include development of Coal handling
facilities, Multi-purpose General Cargo Berth, development of container terminal, SBM
facilities for POL apart from Mechanisation and Deepening proposals.
10.4.8 Mormugao Port’s include construction of two additional berths at Vasco Bay,
Development of Iron Ore Terminal apart from Mechanisation and Modernisation projects
10.4.9 Mumbai Port’s plan includes deepening of main harbour channel & other capital
dredging projects, development of off-shore container terminal PhII, construction of one oil
berth at Jawahar Deep, one liquid cargo jetty at New Pir Pau Pier, Development of offshore
multipurpose cargo berths apart from New Cruise Terminal at Gateway of India.
10.4.10 Jawaharlal Nehru Port’s major projects include extension of container berth,
development of fourth container terminal Ph I & II, apart from Deepening of Channel and
Equipment projects.
10.4.11 Kandla Port’s important projects are development of Off-Shore liquid terminal ,
development of one Dry-Bulk terminal and two multipurpose cargo berths and also
development of satellite port ―Tuna-Tekara‖.
10.4.12 Port Blair Port’s major project includes development of port facilities at Katchal
& Safed Balu, establishment of dry dock & procurement of tug of 45 T capacity.
10.5 MARITIME STATES - PROJECTS AND FUNDING
10.5.1 Maritime states have drawn ambitious programmes to create additional capacity
during 2010-11 to 2019-20.The states have identified projects for development of non-
major ports at an estimated cost of Rs 167930.84 crore for creation of additional capacity
of 1293.56 million tonnes. Private sector is envisaged to fund most of the projects through
PPP or BOT or BOOT basis. It is envisaged that private sector will meet 96.1% of the
cost of development amounting to Rs 161332.91 crore. Remaining requirement of
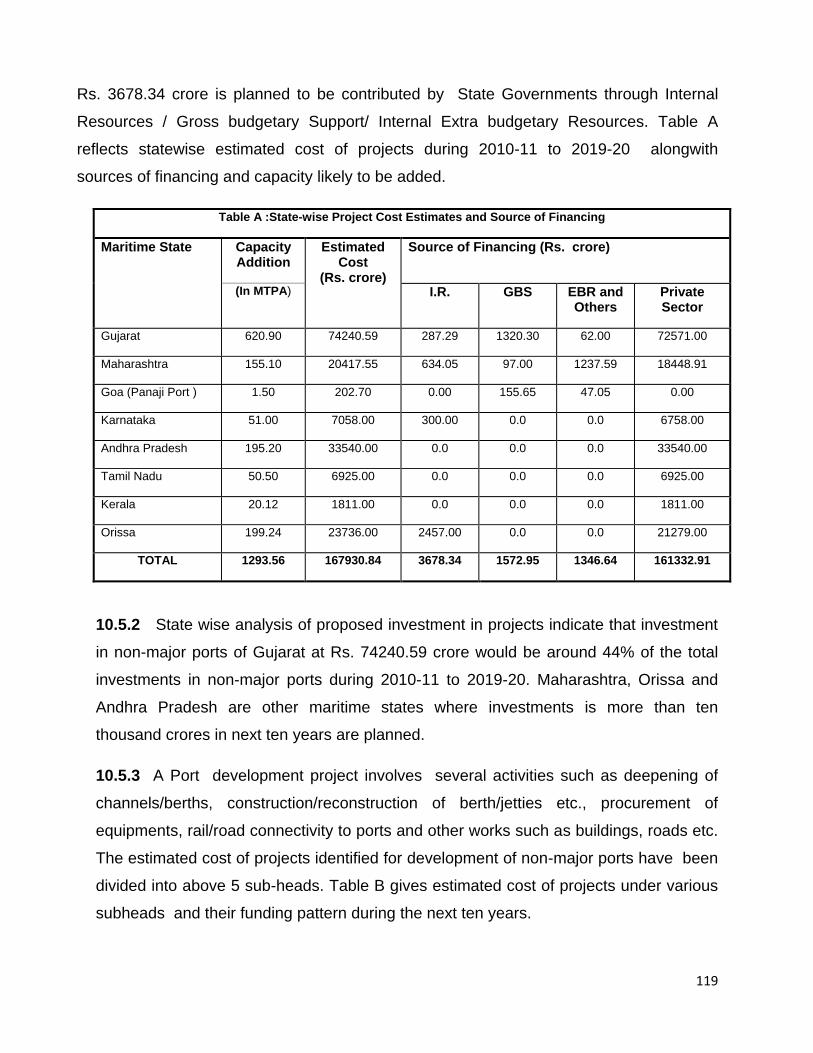
119
Rs. 3678.34 crore is planned to be contributed by State Governments through Internal
Resources / Gross budgetary Support/ Internal Extra budgetary Resources. Table A
reflects statewise estimated cost of projects during 2010-11 to 2019-20 alongwith
sources of financing and capacity likely to be added.
Table A :State-wise Project Cost Estimates and Source of Financing
Maritime State Capacity Addition
Estimated Cost
(Rs. crore)
Source of Financing (Rs. crore)
(In MTPA) I.R. GBS EBR and Others
Private Sector
Gujarat 620.90 74240.59 287.29 1320.30 62.00 72571.00
Maharashtra 155.10 20417.55 634.05 97.00 1237.59 18448.91
Goa (Panaji Port ) 1.50 202.70 0.00 155.65 47.05 0.00
Karnataka 51.00 7058.00 300.00 0.0 0.0 6758.00
Andhra Pradesh 195.20 33540.00 0.0 0.0 0.0 33540.00
Tamil Nadu 50.50 6925.00 0.0 0.0 0.0 6925.00
Kerala 20.12 1811.00 0.0 0.0 0.0 1811.00
Orissa 199.24 23736.00 2457.00 0.0 0.0 21279.00
TOTAL 1293.56 167930.84 3678.34 1572.95 1346.64 161332.91
10.5.2 State wise analysis of proposed investment in projects indicate that investment
in non-major ports of Gujarat at Rs. 74240.59 crore would be around 44% of the total
investments in non-major ports during 2010-11 to 2019-20. Maharashtra, Orissa and
Andhra Pradesh are other maritime states where investments is more than ten
thousand crores in next ten years are planned.
10.5.3 A Port development project involves several activities such as deepening of
channels/berths, construction/reconstruction of berth/jetties etc., procurement of
equipments, rail/road connectivity to ports and other works such as buildings, roads etc.
The estimated cost of projects identified for development of non-major ports have been
divided into above 5 sub-heads. Table B gives estimated cost of projects under various
subheads and their funding pattern during the next ten years.

120
Table B:Sub-Project wise Estimated Cost and Source of Financing
Sub-Project Estimated Cost
(Rs. crore)
Source of Financing (Rs. Crore)
I.R. GBS EBR and Others
Private Sector
Deepening of channel/berths
11468.40 628.3 140.0 9.45 10690.60
Construction/reconstruction of berths/jetties etc.
124782.43 845.99 20.0 222.4 123694.00
Procurement of equipment etc.
10276.18 789.23 15.65 894.80 8576.50
Rail/road connectivity works 9338.56 617.11 1397.30 76.95 7247.20
Other works 12065.27 797.71 0.0 142.95 11124.61
Total 167930.84 3678.34 1572.95 1346.64 161332.91
Note : The total cost figures may not tally exactly due to rounding of figures
10.5.4 Table B shows that cost of construction of berths is major component for the
development of non-major ports account for 64% of aggregated project cost. The
percentage share of other sub-projects i.e. deepening of channels, procurement of
equipments, rail/road connectivity and other works in total cost of projects are 9%,
11%,10% and 10% respectively. States propose to fund more than 20% of expenditure
on Rail/Road connectivity projects. Summary of Investment to be made by Maritime
states for various development projects during three phases are given in Annexure - XII
10.5.5 The execution of proposed projects is divided into three phases – ongoing &
new schemes have been included under 2010-11 to 2011-12 i.e. last two years of XIth
Five year Plan(Phase-I), 2012-13 to 2016-17 i.e. XIIth Five Year Plan(Phase-II) and
first three years of XIIIth Plan i.e. 2017-18 to 2019-20(Phase-III) respectively. The
projects of Rs. 33144.22 crore are planned/under execution in the first phase. These
projects are expected to add capacity of 240.11 million tonnes. The projects of Rs
95883.83 crore and Rs. 38675.79 crore are planned to be taken up for execution in
Phase-II and Phase-III. The projects in Phase-II and Phase-III are expected to add
capacity of 680.34 million tonnes and 373.11 million tonnes respectively in the major
ports. State-wise cost of projects to be taken up during three phases is given in Table B.

121
Table B: Phase wise Project Estimates and source of Financing
Phase – I 2010-11 to 2011-12
Maritime States
Capacity addition
Estimated Cost*
(Rs. Crore)
Source of Financing (Rs. Crore)
(In MMT) I.R. GBS EBR and
Others Private Sector
Gujarat 60.00 8030.89 95.79 280.10 7655.00
Maharashtra 57.11 4224.88 129.10 97.00 226.68 3772.10
Goa (Panaji Port ) 0.30 59.45 37.15 22.30
Karnataka 1.50 800.00 800.00
Andhra Pradesh 63.70 10590.00 10590.00
Tamil Nadu 22.50 1200.00 1200.00
Kerala 203.00 203.00
Orissa 35.00 8036.00 667.00 7369.00
TOTAL 240.11 33144.22 891.89 414.25 248.98 31589.10
Phase - II 2012-13 to 2016-17
Maritime States
Capacity addition
(In MMT)
Estimated Cost*
(Rs. Crore)
Source of Financing (Rs. Crore)
I.R. GBS EBR and
Others Private Sector
Gujarat 281.00 40928.10 178.20 797.90 62.00 39890.00
Maharashtra 75.17 9108.73 344.87 635.35 8128.51
Goa (Panaji Port ) 0.70 81.00 56.25 24.75
Karnataka 49.50 6031.00 6031.00
Andhra Pradesh 98.50 20550.00 20550.00
Tamil Nadu 28.00 5725.00 5725.00
Kerala 13.52 957.00 957.00
Orissa 133.95 12503.00 890.00 11613.00
TOTAL 680.34 95883.83 1413.07 854.15 722.10 92894.51
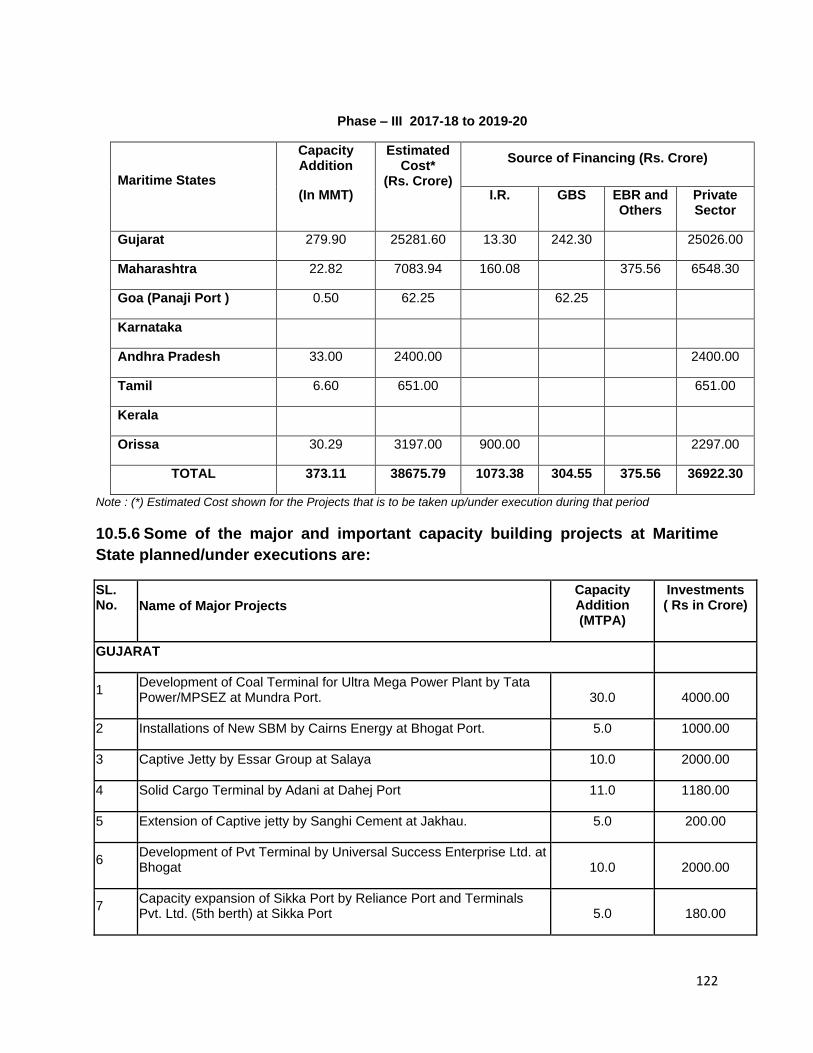
122
Phase – III 2017-18 to 2019-20
Maritime States
Capacity Addition
Estimated Cost*
(Rs. Crore)
Source of Financing (Rs. Crore)
(In MMT) I.R. GBS EBR and
Others Private Sector
Gujarat 279.90 25281.60 13.30 242.30 25026.00
Maharashtra 22.82 7083.94 160.08 375.56 6548.30
Goa (Panaji Port ) 0.50 62.25 62.25
Karnataka
Andhra Pradesh 33.00 2400.00 2400.00
Tamil 6.60 651.00 651.00
Kerala
Orissa 30.29 3197.00 900.00 2297.00
TOTAL 373.11 38675.79 1073.38 304.55 375.56 36922.30
Note : (*) Estimated Cost shown for the Projects that is to be taken up/under execution during that period
10.5.6 Some of the major and important capacity building projects at Maritime
State planned/under executions are:
SL. No. Name of Major Projects
Capacity Addition (MTPA)
Investments ( Rs in Crore)
GUJARAT
1 Development of Coal Terminal for Ultra Mega Power Plant by Tata Power/MPSEZ at Mundra Port. 30.0 4000.00
2 Installations of New SBM by Cairns Energy at Bhogat Port. 5.0 1000.00
3 Captive Jetty by Essar Group at Salaya 10.0 2000.00
4 Solid Cargo Terminal by Adani at Dahej Port 11.0 1180.00
5 Extension of Captive jetty by Sanghi Cement at Jakhau. 5.0 200.00
6 Development of Pvt Terminal by Universal Success Enterprise Ltd. at Bhogat 10.0 2000.00
7 Capacity expansion of Sikka Port by Reliance Port and Terminals Pvt. Ltd. (5th berth) at Sikka Port 5.0 180.00
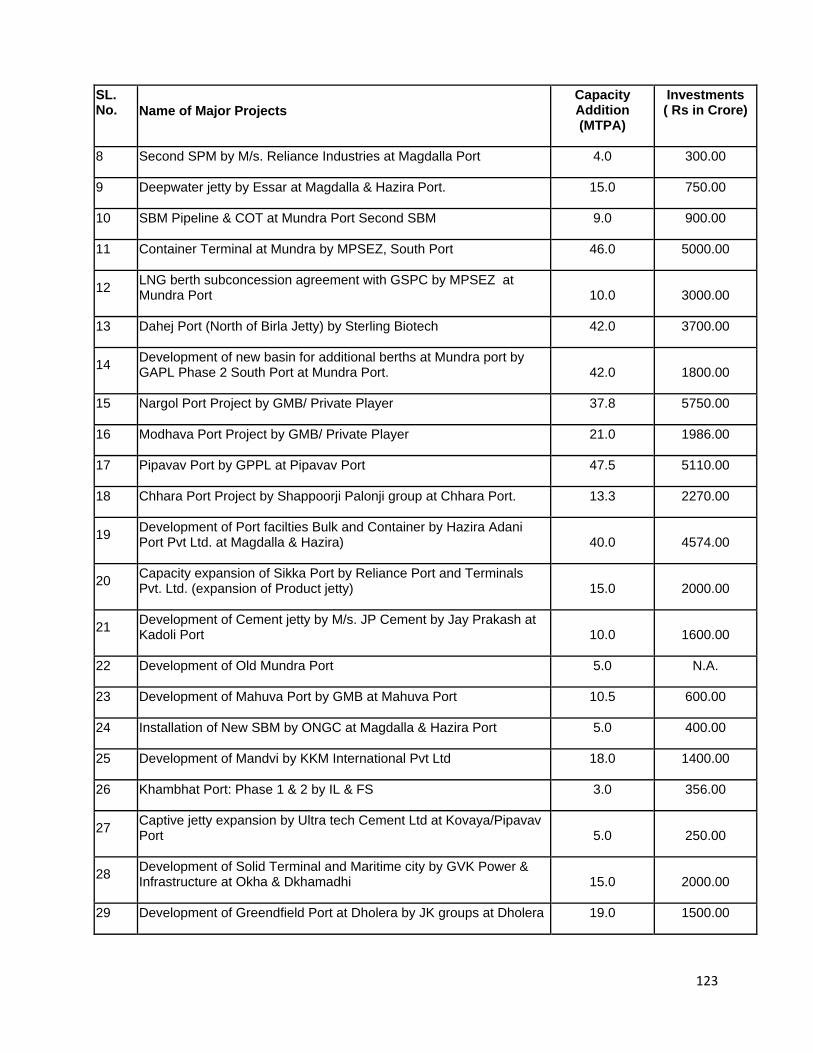
123
SL. No. Name of Major Projects
Capacity Addition (MTPA)
Investments ( Rs in Crore)
8 Second SPM by M/s. Reliance Industries at Magdalla Port 4.0 300.00
9 Deepwater jetty by Essar at Magdalla & Hazira Port. 15.0 750.00
10 SBM Pipeline & COT at Mundra Port Second SBM 9.0 900.00
11 Container Terminal at Mundra by MPSEZ, South Port 46.0 5000.00
12 LNG berth subconcession agreement with GSPC by MPSEZ at Mundra Port 10.0 3000.00
13 Dahej Port (North of Birla Jetty) by Sterling Biotech 42.0 3700.00
14 Development of new basin for additional berths at Mundra port by GAPL Phase 2 South Port at Mundra Port. 42.0 1800.00
15 Nargol Port Project by GMB/ Private Player 37.8 5750.00
16 Modhava Port Project by GMB/ Private Player 21.0 1986.00
17 Pipavav Port by GPPL at Pipavav Port 47.5 5110.00
18 Chhara Port Project by Shappoorji Palonji group at Chhara Port. 13.3 2270.00
19 Development of Port facilties Bulk and Container by Hazira Adani Port Pvt Ltd. at Magdalla & Hazira) 40.0 4574.00
20 Capacity expansion of Sikka Port by Reliance Port and Terminals Pvt. Ltd. (expansion of Product jetty) 15.0 2000.00
21 Development of Cement jetty by M/s. JP Cement by Jay Prakash at Kadoli Port 10.0 1600.00
22 Development of Old Mundra Port 5.0 N.A.
23 Development of Mahuva Port by GMB at Mahuva Port 10.5 600.00
24 Installation of New SBM by ONGC at Magdalla & Hazira Port 5.0 400.00
25 Development of Mandvi by KKM International Pvt Ltd 18.0 1400.00
26 Khambhat Port: Phase 1 & 2 by IL & FS 3.0 356.00
27 Captive jetty expansion by Ultra tech Cement Ltd at Kovaya/Pipavav Port 5.0 250.00
28 Development of Solid Terminal and Maritime city by GVK Power & Infrastructure at Okha & Dkhamadhi 15.0 2000.00
29 Development of Greendfield Port at Dholera by JK groups at Dholera 19.0 1500.00
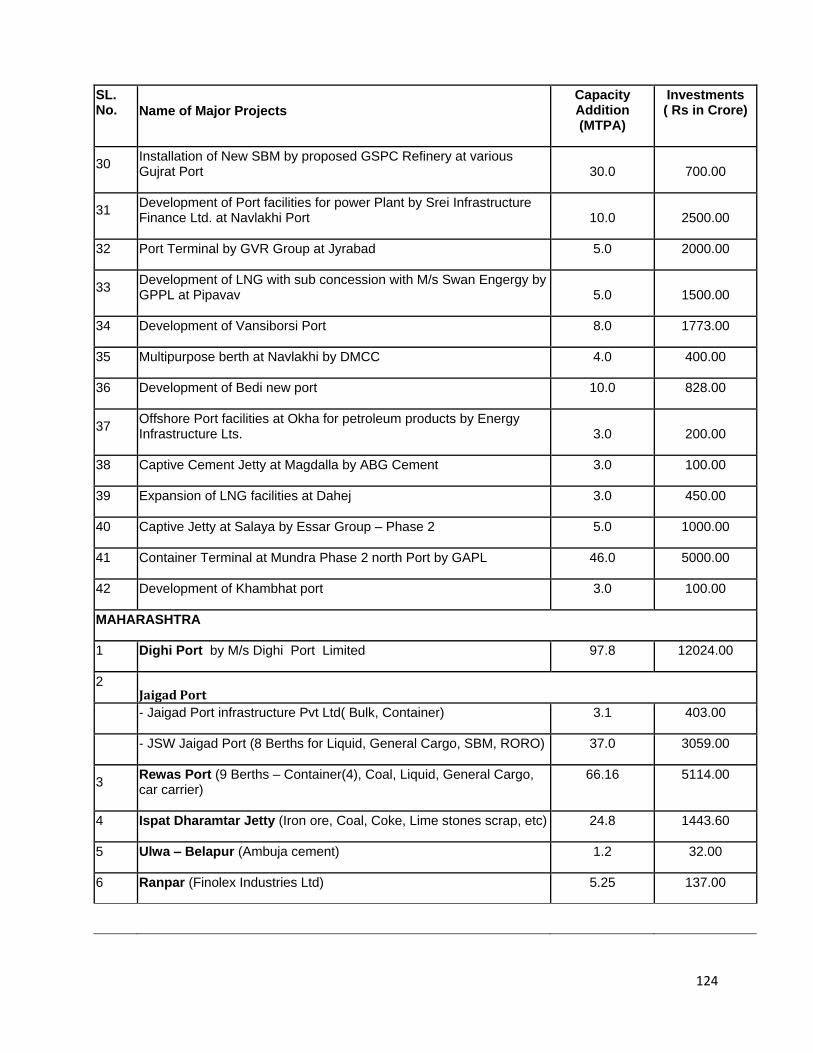
124
SL. No. Name of Major Projects
Capacity Addition (MTPA)
Investments ( Rs in Crore)
30 Installation of New SBM by proposed GSPC Refinery at various Gujrat Port 30.0 700.00
31 Development of Port facilities for power Plant by Srei Infrastructure Finance Ltd. at Navlakhi Port 10.0 2500.00
32 Port Terminal by GVR Group at Jyrabad 5.0 2000.00
33 Development of LNG with sub concession with M/s Swan Engergy by GPPL at Pipavav 5.0 1500.00
34 Development of Vansiborsi Port 8.0 1773.00
35 Multipurpose berth at Navlakhi by DMCC 4.0 400.00
36 Development of Bedi new port 10.0 828.00
37 Offshore Port facilities at Okha for petroleum products by Energy Infrastructure Lts. 3.0 200.00
38 Captive Cement Jetty at Magdalla by ABG Cement 3.0 100.00
39 Expansion of LNG facilities at Dahej 3.0 450.00
40 Captive Jetty at Salaya by Essar Group – Phase 2 5.0 1000.00
41 Container Terminal at Mundra Phase 2 north Port by GAPL 46.0 5000.00
42 Development of Khambhat port 3.0 100.00
MAHARASHTRA
1 Dighi Port by M/s Dighi Port Limited 97.8 12024.00
2 Jaigad Port
- Jaigad Port infrastructure Pvt Ltd( Bulk, Container) 3.1 403.00
- JSW Jaigad Port (8 Berths for Liquid, General Cargo, SBM, RORO) 37.0 3059.00
3 Rewas Port (9 Berths – Container(4), Coal, Liquid, General Cargo, car carrier)
66.16 5114.00
4 Ispat Dharamtar Jetty (Iron ore, Coal, Coke, Lime stones scrap, etc) 24.8 1443.60
5 Ulwa – Belapur (Ambuja cement) 1.2 32.00
6 Ranpar (Finolex Industries Ltd) 5.25 137.00

125
SL. No. Name of Major Projects
Capacity Addition (MTPA)
Investments ( Rs in Crore)
GOA
1 Development of Panaji Port
1.5 202.70
KARNATAKA
1 Development of Karwar Port 11.75 800.00
2 Development of Tadri Port 34.05 2231.00
3 Development of Haldipur Port 10.0 1900.00
KERALA
1 Development of Azhikkal Port 8.46 425.00
2 Development of Ponnani Port 6.8 636.00
3 Development of Vizhinjam Port 10.55 NA
TAMIL NADU
1 Captive port by IL&FS Ltd. Paragipeti, Cuddalore 9.0 1500.00
2 Captive port by Tridem Port and Power Company Private Ltd., Thirukuvalai in Nagapattinam District
5.0 850.00
3 Captive port by M/s Udangudi Power Corporation Ltd., Udangudi, Thoothukudi District
4.0 600.00
4 Captive port by Empee Group, Nagapattinam District 4.0 350.00
5 Captive port by Sindya Power Generating Co.Pvt. Ltd., Nagapattinam District
4.0 350.00
6 Captive Jetty by M/s Cuddalare Powergen Corporation Limited, Cuddakare
3.5 325.00
7 Captive port by M/s Nagarjuna oil Corporation Limited, Thiruchopuram 15.0 2300.00
ANDHRA PRADESH
1 Development of Kakinada Deep Water Port 11.0 900.00
2 Development of Gangavaram Port 24.0 2750.00
3 Development of Machilipatnam Port 17.0 1860.00
4 Development of Krishnapatnam Port 25.0 2000.00

126
SL. No. Name of Major Projects
Capacity Addition (MTPA)
Investments ( Rs in Crore)
5 Development of Nizampatnam & Vadarevu ports 40.0 15414.00
6 Development of Vanpic Port 50.0 17930.00
ORISSA
1 Development of Gopalpur Port by Gopalpur Port Ltd. 27.74 1879.00
2 Development of Dhamra Port by International Sea Ports Private Ltd. 99.0 10800.00
3 Development of Subernarekha Muhan Port by Creative Port Development Private Ltd.
14.5 2500.00
4 Development of Astaranga Port by navayuga Engineering Company Ltd.
30.0 3500.00
5 Development of Chudamani Port by Essel Mining and Industries Ltd.(Aditya Birla Group)
28.0 2457.00
127
CHAPTER – 11
INFORMATION AND COMMUNICATION TECHNOLOGY (ICT) PERSPECTIVE IN INDIAN PORTS
11.1. Need of Information Technology in a Port
Ports are interfaces in a complex chain of logistical stations where not only containers and
general cargo but also numerous kinds of bulk goods, like coal and ores, are loaded and
unloaded at maritime and river terminals, stored and transferred to power stations, agricultural
and industrial centres using conveyors, road and rail transport.
Therefore, Ports deal with a wide range of activities like movement of ships,
passengers, cargo/container through different modes of transport, the loading and
unloading of ship and interaction/clearance from different statutory bodies and port
users. In addition, allocation and management of physical resources like berths,
anchorage, channels, tugs, warehouses, storage space, human resources, etc. are
also to be considered. Therefore, management of a port involves efficient deployment
and utilization of all resources, backed-up by timely and accurate information, which can
only be successfully achieved by efficient deployment of state-of-art Information
Technology.
In view of innovations in Information and Communication Technology, the maritime
industry is undergoing rapid technological changes. High degree of automation in
operations is aimed at the ports world over to meet the increase in demand of efficiency
of port operations. Hence, application of Information Technology is one of the key
issues in the modernization of Ports.
11.2. Computerization at Indian Ports – Present Status
Presently, Indian Ports are now rapidly moving towards application of state-of-art
technology and internet technology to implement integrated Port Operation System and
to move towards paperless regime so as to reduce dwell time and as also cost to users.
The major areas includes, where such automation is aimed at by use of:
Vessel Traffic Management System (VTMS)
Information Technology in Operational and non-operational areas
Surveillance System and Safety & Security System
Electronic Commerce (EC)/Electronic Data Interchange (EDI)

128
11.2.1 Vessel Traffic Management System (VTMS)
VTMS has already been installed at Mumbai, Jawaharlal Nehru, Kolkata, Chennai,
Cochin, New Mangalore and Mormugao Ports. Installation of the VTMS in the Gulf of
Kutch providing coverage to Port of Kandla and other non-major Ports along the Gulf is
under process.
11.2.2 Information Technology
Indian Ports have been implementing/implemented heterogeneous system using the
latest technology covering the following modules/applications for efficient functioning of
ports:
i) Integrated Vessel Services and Control Management
ii) Integrated Cargo Management and Accounting System for all types of cargo(which includes import & export module, Rail/CONCOR Operation and billing)
iii) Integrated Container handling and Tracking system iv) Resource Planning (Including Equipment, Labor etc)
Most of the Private Container Terminal Operators in Major Ports/Non Major Ports have
also implemented Terminal Operation Systems like NAVIS, CATOS, etc.
Apart from the operational Applications, some of the Indian Ports possess modern
Hydrographic Survey units.
Other areas, which have been computerized by the Ports, are Pay Roll preparation and related accounting functions such as P.F. Accounts, Loan Accounts, Income Tax, Financial Accounting, Stores Inventory, Personnel Management, Estate Management, Hospital Management, Materials Management System, etc.
11.2.3 Surveillance System and Safety & Security System
As a result of fallout of 9/11incident, a number of new technologies have been
introduced to help the implementation of International Ship and Port Facility Security
(ISPS) Code in various countries including India. All the Major Ports are ISPS
compliant. In process of implementing ISPS, the need for bio-metric based access
control management was felt and many ports are in the process of implementations.
Besides, the requirement of CCTV based surveillance system has also been felt and
some ports are also reaping the benefits of the same.
129
Now, all crafts tend to have AIS system, which install a satellite station on a ship.
Similarly the use of radio frequency identification (RFID) is gaining ground in logistics
and transport planning and optical charter recognition (OCR) is being used quite
cleverly in terminals to speed up the processing of containers in and out.
It is also proposed to introduce container scanning system in a phased manner, in
addition to the introduction of automatic surveillance system like CCTVs.
Because of terrorist threat, the surveillance and security has become top most priority in
Ports. Therefore, the need of very stringent and secured RFID/smart card and biometric
verification at access points within ports/terminals for the seaport personnel, vehicles
and container truck traffic management has arisen. Ports are geared to take up this
challenge. The need of electric fencing with breach alarm is also thought of.
11.2.4 Electronic Commerce (EC)/Electronic Data Interchange (EDI)
The members of the Port Community depend on the flow of data from other members of
the community to perform their functions effectively, since activity in one area will have
an impact on the others. If data can be exchanged between them accurately and
speedily, the efficiency and throughput will be improved. Electronic Data Interchange
(EDI) has therefore become an essential element for maintaining the efficient operation
not only of ports but also for the complete trade and transportation cycle.
The EC/EDI implementation is vigorously pursued in the functioning of trade regulating
and facilitating organizations like Customs, Ports, Airports, Airlines, Banks, DGFT,
AEPC/Texprocil, CONCOR, Railways, etc. Implementation of EDI varies from port to
port and covers areas like Banks, exchange with Customs and few messages with few
users.
11.3 Way Forward - Towards Paperless Regime
To achieve the paperless regime, ports have to gear up with the complete automation at
an individual Port and Port Community levels.

130
11.3.1 Port Level Automation
Each port should undertake Enterprise Resource Planning (ERP) solutions which would
cover all functional areas including port operation. The functional areas where ERP
solutions are not available on the shelf, the solutions should be developed and
integrated with ERP solutions. Ports like Cochin and Mormugao have already
implemented ERP Solution along with Port Operation System and other modules that
are not part of ERP Solution. New Mangalore is in the process of implementation similar
ERP Solution followed by all the other Ports.
Non ERP solution like GIS linking with the Land/Estate Policy, Hospital Management,
Bespoke System like Vigilance, Legal, File Tracking, Employee welfare, Right To
Information (RTI) Act shall be implemented.
Ports shall implement Land/Estate Management solution which is completely scalable
for implementation of other Business Process like Financial and Management
Accounting, etc. As most of the Major Ports have initiative for the Computerization of
Land Management process, the need of the hour is the Implementation of a complete
application for Real estate Management, Utilities, and Advertisements which is
completely scalable for implementation of an integrated ERP application on a
Decentralized basis and shall be linked with ministry e-governance initiatives.
The provision for Self Service Scheme available in the system would be introduced as
an employee welfare measure.
Automated equipment (Cargo/Container handling, Weight Bridges) shall also be
integrated with the centralized system to avoid manual intervention.
Campus cabled LAN Network system shall be undertaken covering all the automation
system and as a redundancy wireless LAN network shall also be considered.
The IT Policy of the port should be such a way as to integrate all sophisticated systems
in the port in a comprehensive manner such as VTMS, AIS, RFID, CCTV, Surveillance
System and other security systems.

131
A comprehensive data base needs to be developed by the ports themselves which will
lead decision making and provide artificial intelligence.
Sufficient and suitable manpower shall be placed in each port for managing IT systems
and these personnel shall be trained periodically to update their knowledge & know-
how.
Each Port shall aim toward the goal to secure the ISO 27001 certification.
11.3.2 Port Community Level Automation
Port Community System (PCS) is intended to integrate the electronic flow of
information and function as the centralized hub for Indian Ports and other stakeholders
like Shipping Lines/Agents, Surveyors, Stevedores, Banks, Container Freight Stations,
Government regulatory agencies, Customs House agents, Importers, Exporters,
CONCOR/Railways, etc. through common interface in secure manner using the latest
technologies.

132
PCS will be accessible through a secure and personalized web browser. This central
and common facility will definitely save time and money and improve the speed of the
services. It will improve track and trace efficiency and shipment/service visibility by
automatically posting the current status updates by the system of each member as and
when any significant event occurs. The status will be available for all interested parties
for viewing or downloading as required.
Steps had already been initiated to implement Centralized Web based - Port
Community System (PCS) at all Major Ports to reap the maximum benefits of EC/EDI
and move towards a paperless regime. The module like Vessel, Container, Cargo,
Transport, Finance, e-payment and MMD have been made LIVE. The testing of Port-
Customs interface messages is in progress.
Presently as on July 2010, Major Ports are exchanging around 5 lakhs messages every
month.
Now, steps have already been taken to implement PCS at Non-Major Ports also. Ports
like Mundra, Pipavav, Gangavaram, Dehaj have already shown interest to implement
PCS and taken advance step to integrate with PCS.
11.4 Conclusion
With the above ICT measures, Port Community will be enriched with:
Ability to file documents as well as messages (XML, UN/EDIFACT, TXT
format) in multiple protocol for any port from any where in India;
Convenience 24x7 submission;
Ability to monitor and track the activities through the web;
Exchange of Standardized Information;
Gateways provisions for e-payment, SMS, E-mail, etc. centrally;
Ability to get timely Alert during exceptions on e-mail, SMS, etc;
Better security, redundancy and providing for Disaster recovery;
Building of a Centralized repository of information for endless query options
and a variety of needs including statistics and research;
133
The ultimate aim is to seamlessly integrate all members of the port community and also
to provide an electronic platform to act as a single window to exchange messages. This
is definitely a positive step towards improving Communication & Productivity and
reduction in transaction cost at Indian Major Ports.
All the above ICT measures will transform the Indian Ports into a truly top-knotch world-
class technology driven ports. When Indian is becoming third largest economy in the
world, ports also to be geared up to catch up the requirement of world trade and
contribute their mite to the economy for which the ports should be equipped with the
State-of-Art Technology
134
CHAPTER - 12
POLICY AGENDA AND THE WAY FORWARD
12.1 India has been an emerging and vibrant economy with a huge market and
a billion plus population. As per the prediction of experts, India has the potential to grow
as the fastest economy for the next 30 years and is more likely to occupy the second
position after China by 2030.
12.2 This economic upsurge will be one of the important drivers for the growth
of Indian Ports in the years to come. Coupled with this, the technological changes in
shipping and information technology will trigger the growth in Indian Ports and provide
stimulus for cargo handling.
12.3 Hinterland connectivity and Information and Communication (ICT)
integration among all Port Community members are the two vital elements which drive
the port sector in India towards comprehensive development of efficient world class
ports. Various Ministries in Government of India viz., Ministry of Shipping, Ministry of
Road Transport & Highways and Ministry of Railways as well as State Governments
should lay specific emphasis and focus on hinterland connectivity. Major and non-major
ports in the country should initiate and update various ICT measures and also integrate
themselves with stakeholders to vitalize themselves into world class ports.
12.4 The Indian major ports in the recent past have exhibited very strong
change management capabilities and have made significant strides in modernization
and capacity augmentation. Port capacity development was possible mainly due to the
various policy initiatives taken by the Government for increasing the pace of
privatization, which include, amongst other things, standardization of RFQ, RFP and
MCA and formulation of guidelines for fixation of upfront tariffs. The maritime states
also have come up with several policy initiatives and identified potential locations for
development of new outlets. Thus, the major ports and non-major ports have assumed
complementary roles, besides creating healthy competition which in turn enabled the
sector to provide cost effective and quality service to the customers.

135
12.5 As per the Maritime Agenda, 2020, the traffic at major ports is likely to
grow at a CAGR of 8.03% from 561.09 Million Tonnes in 2009-10 to 1214.82 Million
Tonnes by 2019-20, whereas the traffic at non – major ports is expected to grow at a
CAGR of 15.96% from the present level of 288.80 Million Tonnes to 1269.59 Million
Tonnes by 2019-20. Thus, the anticipated traffic at Indian Ports would grow to 2484.41
Million Tonnes by 2019-20 from the present level of 849.89 Million Tonnes at CAGR of
11.32%.
12.6 Having set the tone for the growth path, the Indian major ports and non-
major ports have formulated ambitious plans for development of new outlets,
augmentation of existing service centres, induction of state-of-art cargo handling
equipment and improvement in logistics in order to meet the challenges emanating from
the anticipated growth in the trade. As per these plans, the capacity at 13 major ports is
likely to increase to 1459.53 million tonnes by 2020 from the present level of 616.73
Million Tonnes. The capacity at non-major ports is poised to increase by 2020 to
1660.02 Million Tonnes from the present level of 346.31 Million Tonnes. Thus, the
Indian Ports are aiming at a surplus capacity of above 25% over the projected demand.
This will enable the ports to provide berthing facilities on arrival of the ships, thus
achieving zero waiting time for the vessels. The proposed investment during the next
ten years is expected to be Rs. 2.77 lakh crore - 1.09 lakh crore for Major Ports and
Rs.1.68 lakh crore for non-major ports.
12.7 In addition to capacity augmentation, all the major ports are aiming at
bringing structural changes in the administration of the ports to improve organizational
effectiveness. To this end, all the ports are planning towards implementing ‗landlord
port‘ concept duly limiting their role to maintenance of channels and basic infrastructure
leaving the development operation management of terminal and cargo handling facilities
to the private sector. The ports are aiming at lean staff by extending information
technology to the entire gamut of operations. Thus the Indian Ports are marching
forward with a confident note and gearing themselves to meet the anticipated demand
from the trade in the years to come.
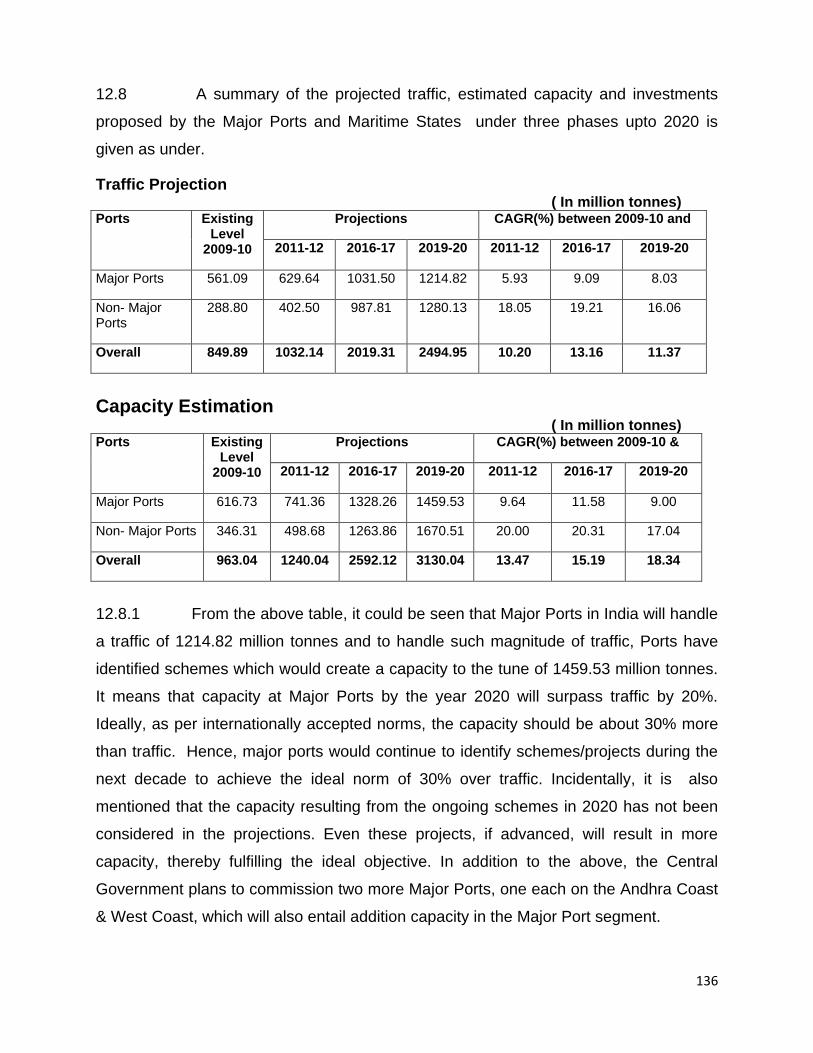
136
12.8 A summary of the projected traffic, estimated capacity and investments
proposed by the Major Ports and Maritime States under three phases upto 2020 is
given as under.
Traffic Projection ( In million tonnes)
Ports Existing Level
2009-10
Projections CAGR(%) between 2009-10 and
2011-12 2016-17 2019-20 2011-12 2016-17 2019-20
Major Ports 561.09 629.64 1031.50 1214.82 5.93 9.09 8.03
Non- Major Ports
288.80 402.50 987.81 1280.13 18.05 19.21 16.06
Overall 849.89 1032.14 2019.31 2494.95 10.20 13.16 11.37
Capacity Estimation
( In million tonnes) Ports Existing
Level 2009-10
Projections CAGR(%) between 2009-10 &
2011-12 2016-17 2019-20 2011-12 2016-17 2019-20
Major Ports 616.73 741.36 1328.26 1459.53 9.64 11.58 9.00
Non- Major Ports 346.31 498.68 1263.86 1670.51 20.00 20.31 17.04
Overall 963.04 1240.04 2592.12 3130.04 13.47 15.19 18.34
12.8.1 From the above table, it could be seen that Major Ports in India will handle
a traffic of 1214.82 million tonnes and to handle such magnitude of traffic, Ports have
identified schemes which would create a capacity to the tune of 1459.53 million tonnes.
It means that capacity at Major Ports by the year 2020 will surpass traffic by 20%.
Ideally, as per internationally accepted norms, the capacity should be about 30% more
than traffic. Hence, major ports would continue to identify schemes/projects during the
next decade to achieve the ideal norm of 30% over traffic. Incidentally, it is also
mentioned that the capacity resulting from the ongoing schemes in 2020 has not been
considered in the projections. Even these projects, if advanced, will result in more
capacity, thereby fulfilling the ideal objective. In addition to the above, the Central
Government plans to commission two more Major Ports, one each on the Andhra Coast
& West Coast, which will also entail addition capacity in the Major Port segment.
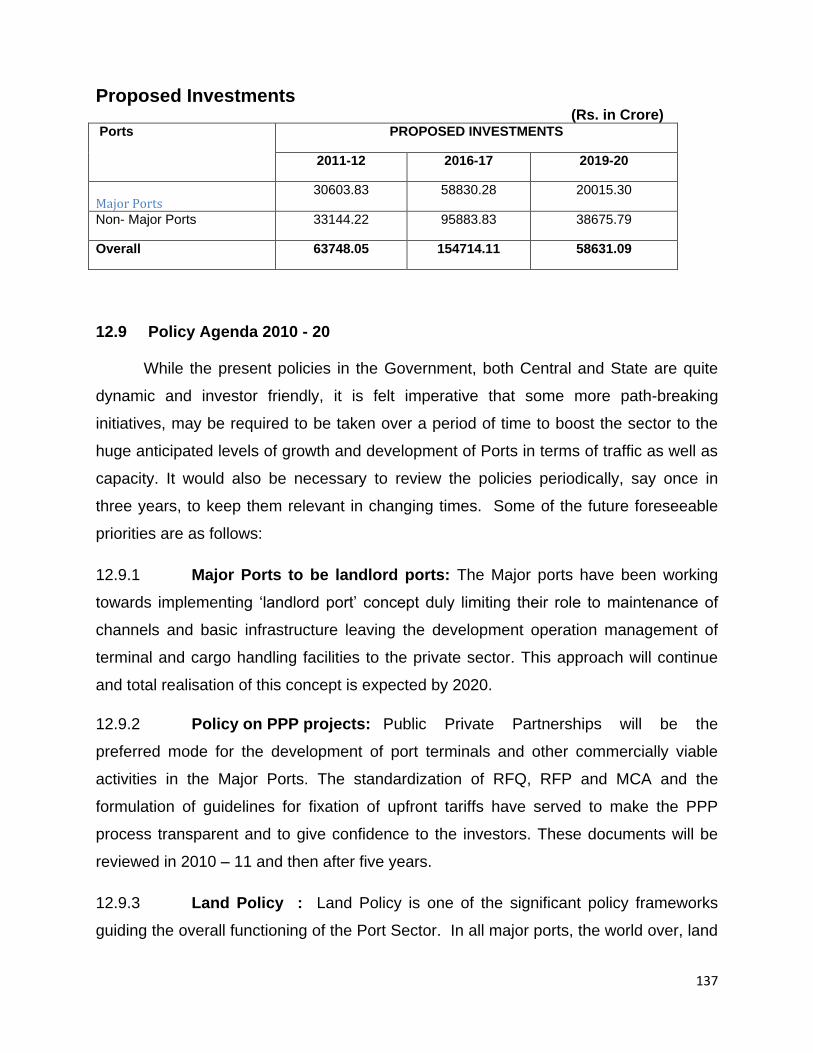
137
Proposed Investments (Rs. in Crore) Ports PROPOSED INVESTMENTS
2011-12 2016-17 2019-20
Major Ports 30603.83 58830.28 20015.30
Non- Major Ports 33144.22 95883.83 38675.79
Overall 63748.05 154714.11 58631.09
12.9 Policy Agenda 2010 - 20
While the present policies in the Government, both Central and State are quite
dynamic and investor friendly, it is felt imperative that some more path-breaking
initiatives, may be required to be taken over a period of time to boost the sector to the
huge anticipated levels of growth and development of Ports in terms of traffic as well as
capacity. It would also be necessary to review the policies periodically, say once in
three years, to keep them relevant in changing times. Some of the future foreseeable
priorities are as follows:
12.9.1 Major Ports to be landlord ports: The Major ports have been working
towards implementing ‗landlord port‘ concept duly limiting their role to maintenance of
channels and basic infrastructure leaving the development operation management of
terminal and cargo handling facilities to the private sector. This approach will continue
and total realisation of this concept is expected by 2020.
12.9.2 Policy on PPP projects: Public Private Partnerships will be the
preferred mode for the development of port terminals and other commercially viable
activities in the Major Ports. The standardization of RFQ, RFP and MCA and the
formulation of guidelines for fixation of upfront tariffs have served to make the PPP
process transparent and to give confidence to the investors. These documents will be
reviewed in 2010 – 11 and then after five years.
12.9.3 Land Policy : Land Policy is one of the significant policy frameworks
guiding the overall functioning of the Port Sector. In all major ports, the world over, land
138
has been leveraged for optimizing the throughput and increasing revenue of Ports. It is
an established practice globally for the ports to allot land for carrying out the economic
activity including establishing industry to ensure captive cargo to the port, thereby
enhancing the sustainability of that port. Port land has also been used to set up Special
Economic Zones (SEZ) aimed at encouraging industrial development in and around that
port. Other than the above, ports are generally expected to utilize their land giving the
first priority for the purpose of port-related activities and treating the activities incidental
to the port as secondary in nature. Ports located in large cities present port planners
with a special challenges in land management. Major city-ports offer opportunities for
the economic development of their host cities in terms of utilisation of land. Keeping all
these factors in view, Land Policy shall be reviewed from time to time and a new vibrant
Land Policy will be put in place in tune with the times.
12.9.4 Policy for preventing monopoly in the Major Ports Sector: In terms
of the ‗Regulatory Framework‘ of the Private Sector Participation (PSP) guidelines
(1996), the ports were directed to ensure that private investment does not result in
creation of private monopolies and that private facilities are available to all users on
equal and competitive terms. Accordingly, it was felt that a policy may be formulated for
prevention of private monopoly in the Port Sector for ensuring healthy competition
amongst the private operators and smooth award of projects for capacity augmentation
at the Major Ports. In exercise of the powers conferred upon the Central Government
under Section 111 of the Major Port Trusts Act, 1963 and in consultation with
Chairpersons of all Major Ports as well as stake holders, the following policy has been
laid down with effect from 2.8.2010 for preventing private sector monopoly in Major
Ports:
―If there is only one private terminal/berth operator in a port for a specific cargo,
the operator of that berth or his associates shall not be allowed to bid for the next
terminal/berth for handling the same cargo in the same port‖.
12.9.5 Corporatization of Major Ports and Commercialisation: There are 13
Ports directly under the Central Government – out of these, 12 Major Ports are
governed by the Major Port Trusts Act, 1963, and one (Ennore Port Limited) was

139
incorporated as a company under the Companies Act, 1956 and is governed by Indian
Ports Act, 1908. Corporatization envisages conversion of Major Ports into commercial
organizations operating with minimum costs offering improved services and having a
quick market oriented commercial response mechanism. Towards this end,
Corporatisation of ports has been recommended by experts and will be achieved in
phases. Corporatisation will be taken up for three ports in the first phase, beginning
with JNPT. Deserving ports could be conferred with Navaratna or Mini ratna status,
giving them substantial autonomy in functioning. Public Ports under the control of both
the Central Government and the State Governments should completely re-tune
themselves and focus on Commercialisation and Corporatisation, with professional
management in place and free access to financial markets without recourse to
government support.
12.9.6 Tariff Regulation at Major Ports: TAMP is the economic regulator
for major ports with the key function being tariff determination for major ports and their
private terminals. TAMP was established in 1997 by an amendment to the Major Port
Trusts Act, 1963 with the key objective of determining tariffs for the major ports and also
specifying the conditions governing these tariffs. TAMP follows a consultative process
with the stakeholders before fixation of tariffs. A set of guidelines on tariff setting was
notified on March 31, 2005. This was a cost plus approach with an assured return on
gross capital deployed. It was clarified that royalty/revenue share payable to the land
lord port by the operator will not be an admissible cost for tariff computation. It thus
implied that royalty will be paid out of the operating surplus of the concessionaire. The
Tariff setting guidelines were revised in February, 2008 since it was felt that the bidders
were facing difficulties in quoting the revenue share, on account of the tariff being
determined after the bidding process was completed. As per the February, 2008
guidelines, a tariff cap (defining the ceiling) is set upfront by TAMP prior to inviting bids.
TAMP follows a normative cost based approach which recognizes capital and operating
costs and allow a reasonable rate of return on capital deployed, which is 16 percent as
of now based on a capacity utilization of 70 percent of the capital deployed. While the
whole tariff fixation mechanism has to be reviewed, there are several improvements
possible in the guidelines in the short term, and this will be attempted in 2010-11.
140
12.9.7 Port Regulator : While the Tariff Authority of Major Ports is the
economic regulator for major ports, with the main function as tariff setting for major ports
and private terminals commissioned therein, the non-major ports, operating in the same
environment do not have any economic regulator and non-major ports including private
ports have liberty to fix their own tariffs. As a result, there is no level playing field.
Hence, there is a need for a Port Regulator for all the ports for setting, monitoring and
regulating the service levels, technical & performance standards. All the ports should be
left free to fix their tariff, depending upon inter-play of market forces. The Regulator can
be entrusted with the responsibility of dispute resolution as appropriate. The Regulator
may also be empowered with judicial powers to issue regulations and policy guidelines,
and take specific regulatory actions upon a finding of inadequate competition, anti-
competitive practices or unsafe or environmentally detrimental practices. The Regulator
could also act as an Ombudsman to deal with consumer grievances.
12.9.8 Environmental Clearance Mechanism: India is in the process of
creating huge capacity through Public Private Partnership basis. One of the major
factors for delay in the fructification of projects is the long environmental clearance
mechanism. The project authorities have to undergo different processes at State and
Central Level to get the project environmentally cleared. It is in the interest of the Port
Sector that the environmental clearance process be reviewed in respect of existing
ports where further development works are being undertaken. It should be possible to
have clear guidelines laid down by the Environment Ministry and leave it to the
Administrative Ministry / State Government to comply with those guidelines strictly and
clear the projects environmentally. A Master Plan for the entire Port, covering different
projects may be prepared and in-principle clearance be taken from Environment
Ministry and thereafter, specific clearance for each project may be obtained from the
Administrative Ministry/State Government. These could also be subject to subsequent
environmental audit. It would also be desirable to look at the global best practices for
environmental clearance.
12.9.9 Environment Policy and Green ports: The Ministry of Shipping is
committed to the protection of environment, as it is an indispensable factor for
sustainable economic growth. Steps are to be taken by ports in their endeavour to
141
become clean, green and environmental friendly ports. Environmental issues including
the handling of hazardous and noxious substances in a port, prevention of air, water
and soil pollution in ports, treatment of harmful aquatic organism in ballast water etc.,
are being addressed and tackled. The port industry in general has been faced with
sustainability issues – compliance to international and national regulations vis-à-vis
demands for bigger port capacity and increased productivity without compromising
environmental quality. Without regulation, it is difficult to implement greener practices,
as these may put operators at a competitive disadvantage. In addition to the need for
increased regulation, there are several other issues that appear across the marine and
port sector. These include availability of incentives to encourage green practices, cost
and availability of clean fuel, the need to do more research on green technologies, use
of shoreside power, training programmes for such industry and designating emission
control areas.
In India also, strict policies for the air pollution due to fuel, old engines are adopted by
prescribing the emission limits for different pollutants. Along with regulatory mechanism,
there are various solutions available to control air pollution at ports. Air emission is
already spreading its wings damaging the environment and ports contribute major
source of emission imposing health risks to the nearby communities. Ports need to take
the initiatives addressing the root cause of the pollution for the sustainable
development. Progress with bad health of the region is not preferred by any society.
Hence more emphasis is to be given on the use of cleaner fuel and technology leading
to improvement in air quality and public health. There is a need to develop green
policies supported by incentives to encourage ports to implement green practices.
Jawaharlal Nehru Port Trust has already taken a lead in this regard. Green practices in
the marine and port sector would need collaboration with other sectors (ex., air quality
concerns, etc). Some of the measures for the control of emission and development of
green ports are as under:
Easy and low cost approaches
i. Use of cleaner fuels such as low sulphur diesels (LSD), biodiesel, and Fischer- tropsch diesel in all port equipments.
ii. Well-enforced idling time restrictions of the vehicles in the port area.

142
iii. Measures such as terminal gate improvements, simplifying trade procedures, designing logistic chain which produces less traffic and less air emission.
iv. Controlling temperature of bunker during storage or using scavenging agent to reduce emission during bunkering operations.
v. Speed reduction, use of specially designed paints to reduce drag, and vessel assignment planning for harbour crafts.
vi. Formulation of ‗green tariff‘ for the vessels which are reducing speed and using distillate fuel in the port limits.
vii. ‗Water curtains‘ for the coal storage area to prevent the coal dust flying from the storage yard and spreading through the port.
Capital intensive approaches
i. Replacing or retrofitting cleaner engines for cargo handling equipments, vehicles, and harbour crafts.
ii. Repowering of the old, highly polluting locomotives and tugboats with several low emitting new engine options, including natural gas (NG) and hybrid battery-electric (Bailey & Solomon, 2004).
iii. Cold ironing for ships and port‘s tugs. iv. Building of the infrastructure such as separate corridors for the cargo,
widening of the roads, flyovers, improving intersection for the better traffic. v. VOCS for the oil installations, gas fill stations and bunkering barges in the
port area. vi. Use of renewable energy such as wind, solar power or biogas or
alternative fuel such as natural gas or propane for the port‘s energy needs.
vii. ‗Green curtains‘ by tree plantation mainly to mitigate the effect of CO2
emission.
12.9.10 Capacity Building and Human Resource Development : Recognising
the need to impart structured training to all port personnel including officers, it is
essential to re-train them towards multi-skilling. Every employee shall undergo different
tiers of training programme during his service. Revamping of port based training
institutions is also focused. Training will be made compulsory before consideration of an
employee for promotion. In order to incentivise the port personnel and induct
professionalism, Cadre Restructuring of Officers in Major Ports will be fully
implemented which brings in uniformity as well as fresh induction of professionals at
different levels of management through direct recruitment. The present classification of
Ports into Category I & Category II will be reviewed and if considered necessary, done
away with. The remuneration package for the port personnel will be on the lines of
143
public sector companies to induce corporate culture in the ports. Manning Scales,
Datums and piece-rate incentives for port employees will be rationalised from time to
time and realistic and productivity oriented ones will be put in place. Performance
appraisal of CEOs of Ports will depend upon the agreed targets and objectives by way
of a Memorandum of Understanding. Incentives for officers will depend upon the
achievement of such stated targets and objectives.
12.9.11 Indian Maritime Cadre : Maritime Sector is a specialised sector and
decisions in most of the areas are driven by the experience of executives in the sector,
who through their professional experience and expertise can contribute to the growth
and development of the sector. It should be possible to have several key positions in
the sector manned by maritime specialists. In addition, executives in the sector do not
have any proper career progression plans. As a result, they lack motivation and are
unable to contribute their mite to the sector in spite of their specialisation. Hence, there
is a need to form an Indian Maritime Cadre and encourage the specialisation in this
field.
12.9.12 Pilots Pool : Indian Ports suffer, many-a-time, from inadequacy of pilots
to navigate the vessels in their channels. As a result, ports are unable to achieve zero
pre-detention time for vessels and long-waiting of vessels are also common in ports. It
is advisable to start a three year pilots course consisting of 1 years theoretical training in
Indian Maritime University and 2 years practical on-the job-training in ports so that a
candidate can be given a pilot licence by the Government, after successful completion
of course, to pilot vessels in any port. These pilots can move from one port to another.
12.9.13 Dredging : Ports need to develop the capacity to receive bigger ships,
for which capital dredging to achieve the desired level of draft and maintenance
dredging to retain that level, have to be undertaken. In most of the maritime nations,
dredging in the channels, both capital as well as maintenance is taken up with
budgetary support from the either the national Government or local Governments.
Financial support for dredging is necessary for reducing the port charges. The channels
leading to the Major Ports could be declared as National or State Channels. If
considered necessary, each Port may be asked to remit certain Dredging Contribution
144
to the concerned Government in proportion of the quantum of traffic handled by the port.
A policy on this has to be prepared in 2011-12.
12.9.14 Rail- Road Connectivity : Although major ports have reasonably
adequate Rail-Road connectivity, many non-major ports are suffering from severe
constraints. Such non-major ports must work with the State Governments and other
authorities to commission 4 - lanes Road connectivity and 2 - lanes Rail Connectivity at
their ports so as to ensure seamless flow of cargo. Major Ports may endeavour, in
consultation with National Highways Authority of India (NHAI) and Ministry of Railways,
to expand their connectivity to 8-lane Road Connectivity and 4- lanes Rail-connectivity
respectively, by 2020. Links with the Western Dedicated Freight Corridor and Eastern
Freight Corridor are a must for the Indian Ports to live up to challenges of burgeoning
trade and must be pursued to be in place at the earliest.
12.9.15 Hub Ports : India should commission at least 4 hub ports, two each on
the east viz. Chennai and Visakhapatnam Ports and the west coast viz. Jawaharlal
Nehru and Cochin Ports to receive the 13,500+ TEU containerships. These should
have : -
Ability to berth vessels upto 400 LOA.
Depth of water to be available for vessels at least of 15 m draft.
Crane reach for vessels having 24 rows across.
Container handling speed of 250-350 moves per hour.
12.9.16 Tax Regime: Since the beginning, the major ports in this country have
been treated as ―local authority‖ by virtue of a provision in General Clauses Act and
they have been exempted from the Income Tax as Ports are considered as Nation‘s
vital infrastructure and the surpluses generated in the Ports could be ploughed back for
creation of more infrastructure both within and outside the Port. Similar was the case of
State Maritime Boards also. However, during the year 2002, the Income Tax Act has
been amended to tax Ports also. The taxation system must also promote investment in
infrastructure.
12.9.17 Cruise Shipping : Cruise Shipping is an area which has vast potential
for Indian Ports, India being a major tourist destination. Though a policy has been
145
formulated, Cruise Shipping has not really taken off as it should have. A
comprehensive policy need to be evolved and adequate arrangements in terms of state
of art Passenger Terminals, Baggage screening, Customs clearance, Immigration,
Tourism related ancillaries backed up by effective publicity need to be in place so that
Indian Ports also become truly world class destinations as in the case of Singapore,
Dubai and several western European and Caribbean countries.
12.9.18 Indian Maritime Finance Corporation : Most of the maritime projects
are specialized in nature and they require a specialized scrutiny and appraisal for
obtaining the finances for such projects. Moreover, there are no specialized agencies to
fund such projects. As a result, many-a-time, project authorities in the maritime sector
find it difficult to raise finances and achieve financial closure. Many Ports possess
considerable cash reserves which, otherwise to be utilised for expansion and
developmental activities, are deposited in Banks, because of induction of PPP in sector.
These deposits yield low returns. On the other hand, a good maritime project, if
appraised properly, might yield very good returns. Hence, it is quite desirable to float a
specialized Maritime Finance Corporation with the equity of ports and financial
institutions to fund the Port projects.
12.9.19 Corporate Social Responsibility : Corporate Social responsibility
encompasses the sectors like health, education, employment, income and quality of life.
It should be binding on the corporate sector to work on the above aspects, which are
thought to be primary social indicators. The concept of corporate social responsibility
(CSR) has so far failed to take deep root in India. Much needs to be done to bring
changes in attitude towards CSR and bring awareness among the corporate about their
social responsibilities. The Department of Public Enterprises (DPE) has prepared
guidelines for central public sector enterprises to take up important corporate social
responsibility projects to be funded by 2-5 per cent of the company's net profits. Nearly
all the major ports in India are involved in CSR programmes in areas like education,
health, staff quarters, skill development, and training. Major Ports are also promoting
encouragement to the outstanding children of port employees through scholarships etc.
However, much more could be done. A policy on CSR applicable to the Major ports will
be prepared in 2011-12.

146
12.9.20 Approach to International Co-operation : To widen the Port‘s
horizon, a continuous co-ordination and co-operation is to be maintained with
international organizations like IAPH (of which most of the ports are members), PIANC,
World bank, European Union, ESCAP, UNCTAD and ADB etc. In fact, Ports are aligned
to IMO, FAL and SOLAS convention documents for safe and secure handling of various
type of cargo. Most of the leading ports have already implemented ISPS code. Though
a number of major ports have established sister-port agreements with some of the world
class ports, there is further need to strengthen such co-operation for sharing the
expertise in cargo handling operations and port management, exchange of information,
co-operation in training needs and modules development, establishing joint ventures of
mutual interest, promoting synergy and trade facilitation in the areas of their expertise
etc. The sister-port arrangements may cover bilateral financial and technical
cooperation through exchange of technology relating to infrastructure development and
environment, management and operations, collaborations on dredging, marketing of
port services etc.
12.9.21 Competition and Co-operation among Ports : In this era of
globalisation where the economy grows at a brisk pace, every industry is witnessing
competition between the many players. The Port Sector is no exception. The inter-port
competition as well as intra-port competition is quite evident in the recent times. In
India, inter-port competition is hindered mostly by insufficient hinterland connectivity and
because not all ports can not offer similar type of cargo handling facilities at their
terminals. Further, there are rigidities in pricing as a result of which traffic of nearby
ports cannot be enticed by value added services or reduction in tariff. These issues
need to be resolved to promote inter-port competition in an efficient market. One can
expect more competition to emerge, once more ports are developed by the private
operators in the bigger Maritime States. The Central Government has taken a
considered decision to not allow a particular player to dominate a port, and this should
promote intra-port competition in future. With the emergence of new ports and
terminals lined up in the future, there is a need of a government policy to gear itself to
meet these challenges of competition (or the lack of it).
147
While competition is very vital for growth and development of industry as well as to
ensure quality of service to the Trade at competitive prices, at times, situations come
across the situations where co-operation among the competing players is also essential.
There is a need to practice business ethics as well as to avoid unfair practices for which
co-operation among all the relevant players is essential. There are certain
circumstances where co-operation among the different terminals or ports is necessary
in operational exigencies as well as in emergent situations. For example, when a
CONCOR Train brings in boxes in a rake comprising the boxes pertaining to JNPT,
NSICT and GTL into the Port, a co-operative and co-ordinated mechanism should be
evolved to deliver the boxes to the respective terminals. Similarly, when the traffic is
over-flowing in a Port, all the terminals should find out a way out to handle all the boxes
effectively without much delay. What is required in such a situation is that the Port
authorities must plan in co-operation with other terminal operators to handle the vessels
most efficiently and prepare berthing programme, allotment of space, gate clearance,
inter-terminal transfers etc., Similarly, in case of illegal strikes takes place in a terminal,
creating a difficult situation to the management and the Trade, the other terminals
should come forward and rescue the terminal in difficulty, by handling their cargo at the
usual tariff. The same broad principle of co-operation should be adopted by the all the
ports in the country to see that Indian Cargo should not get diverted to the neighbouring
countries. Of course, usual competition based on efficiency, productivity, cost-
effectiveness and marketing must continue and thrive in ports and terminals.
12.9.22 Legislative Framework : The Governments, both Central and State
should transform the legislative frame-work in tune with the current requirements.
Necessary amendments to the Major Ports Act, 1963, Indian Ports Act, 1908 and
Maritime Board Acts of respective State Governments have to be carried out.
12.9.23 Indian Ports’ Global : In the era of Globalisation, infrastructure sectors
all over the world have gone global in the form of acquisitions, equity stakes in
companies abroad, commissioning of green field projects, partnering with companies
abroad by the way of Joint Ventures etc., Port sector is no exception. Port of Singapore
Authority have established their wings in different part of the world by an instrument
called PSA International. Similarly, Dubai Ports have too spread its wings internationally
148
by the consolidated company viz. DP World. Likewise, some ports in Europe too made
their presence in the rest of the world. It is in this context felt that since India is
bestowed with rich maritime heritage and immense expertise in operating ports with
highly skilled manpower and specialised knowledge in port operations, India must also
float a special purpose vehicle for making investments in ports abroad and become a
truly global power in Port Sector world-wide. It is envisaged to incorporate a new
special purpose vehicle viz. Indian Ports‘ Global (IP Global) and commence pursuing its
objectives as stated above.
12.10 While, the Maritime Agenda, 2010 - 20 envisages ambitious programmes
to reach 3.12 billion tonnes port capacity within the next decade, a strong monitoring
and feedback mechanism with ―Score Card‖ approach should be initiated both at the
Ports‘ level and at Government‘s level.

149
Annexure - I LIST OF PORTS IN INDIA
(A) STATE-WISE & UNION TERRITORY LIST OF NON-MAJOR PORTS
S.NO. NAME OF PORT S.NO NAME OF PORT GUJARAT- 41 33 Vansi-Borsi 1. Mandvi 34 Billimora 2. Navlakhi 35 Valsad 3. Bedi 36 Umarsadi 4. Sikka 37 Kolak 5. Jafarabad 38 Maroli 6. Okha 39 Umergaon 7. Porbandar 40 Mul-Dwarka 8. Veraval 41 Magdalla 9. Bhavnagar 10. Bharuch 11. Hazira 12. Koteshwar 13. Mundra / GAPL 14. Jakhau 15. Jodia 16. Salaya ANDHRA PRADESH -12 17. Pindhara 1 Bhavanapadu 18. Beyt 2 Calingapatnam 19. Rupen 3 Bheemunipatnam 20. Mangrol 4 (i) Kakinada
(ii)Kakinada Deepwater Port 21. Kotda 5 Narsapur 22. Madhwad 6 Machilipatnam 23. Navabandar 7 Vodarevu 24. Rajpara 8 Nizampatnam 25. Pipavav / GPPL 9 Krishnapatnam 26. Mahuva 10 Gangavaram 27. Talaja 11 Mutyalampalem 28. Ghogha 12 Rawa 29. Khambhat 30. Dahej 31. Bhagwa 32 Onjal

150
S.NO. NAME OF PORT S.NO NAME OF PORT MAHARASHTRA - 48 45 Vengurla 1 Dahanu 46 Redi 2 Tarapur 47 Kiranpani 3 Nawapur 48 Ratnagiri 4 Satpati 5 Kelwa-Mahim 6 Arnala ( incl Datiware) 7 Uttan 8 Bassein 9 Nhiwandi KARNATAKA - 10 10 Manori 1 Mangalore 11 Kalyan 2 Malpe 12 Thane 3 Hangarkatta 13 Versova 4 Kundapur 14 Bandra 5 Bhatkal 15 Trombay 6 Honavar 16 Ulwa-Belapur /(Panvel) 7 Tadri 17 Mora 8 Belekeri 18 Mandwa 9 Karwar 19 Karanja 10 Pudubidri 20 Thal (Rewas) 21 Alibag (Dharamtar 22 Revdanda LAKSHADWEEP - 10 23 Borli/Mandla 1 Agatti 24 Nandgaon 2 Amini 25 Murud-Junijira 3 Androt 26 Rajpuri (Dighi 4 Bitra 27 Manded 5 Chetlat 28 Kumbharu 6 Kavaratti 29 Shriwardhan 7 Kadmat 30 Bankot 8 Kiltan 31 Kelshi 9 Kalpeni 32 Harnai 10 Minicoy 33 Dabhol 34 Palshet GOA - 5 35 Borya 1 Panaji 36 Jaigad 2 Chapora 37 Tiwri-Waroda 3 Betul 38 Purnagad 4 Talpona 39 Jaitapur 5 Tiracol 40 Vijaydurg 41 Devgad PONDICHERRY - 2 42 Achara 1 Pondicherry 43 Malvan 2 Karaikal 44 Niwti
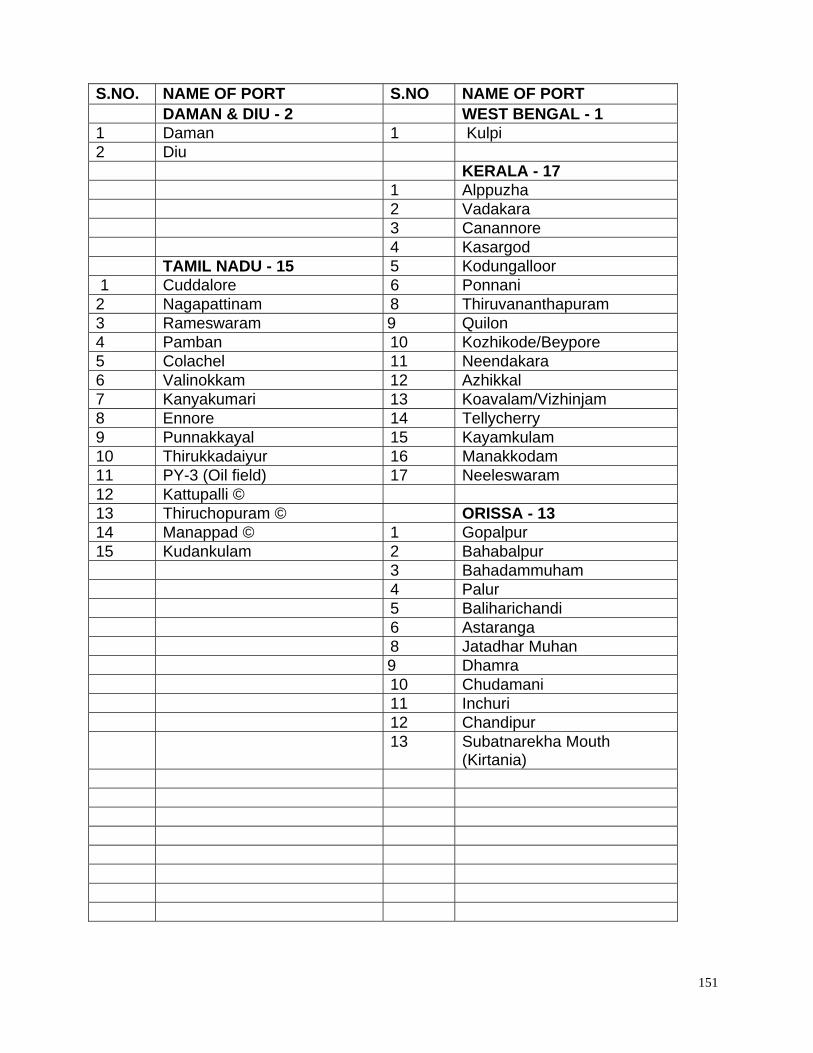
151
S.NO. NAME OF PORT S.NO NAME OF PORT DAMAN & DIU - 2 WEST BENGAL - 1 1 Daman 1 Kulpi 2 Diu KERALA - 17 1 Alppuzha 2 Vadakara 3 Canannore 4 Kasargod TAMIL NADU - 15 5 Kodungalloor 1 Cuddalore 6 Ponnani 2 Nagapattinam 8 Thiruvananthapuram 3 Rameswaram 9 Quilon 4 Pamban 10 Kozhikode/Beypore 5 Colachel 11 Neendakara 6 Valinokkam 12 Azhikkal 7 Kanyakumari 13 Koavalam/Vizhinjam 8 Ennore 14 Tellycherry 9 Punnakkayal 15 Kayamkulam 10 Thirukkadaiyur 16 Manakkodam 11 PY-3 (Oil field) 17 Neeleswaram 12 Kattupalli © 13 Thiruchopuram © ORISSA - 13 14 Manappad © 1 Gopalpur 15 Kudankulam 2 Bahabalpur 3 Bahadammuham 4 Palur 5 Baliharichandi 6 Astaranga 8 Jatadhar Muhan 9 Dhamra 10 Chudamani 11 Inchuri 12 Chandipur 13 Subatnarekha Mouth
(Kirtania)
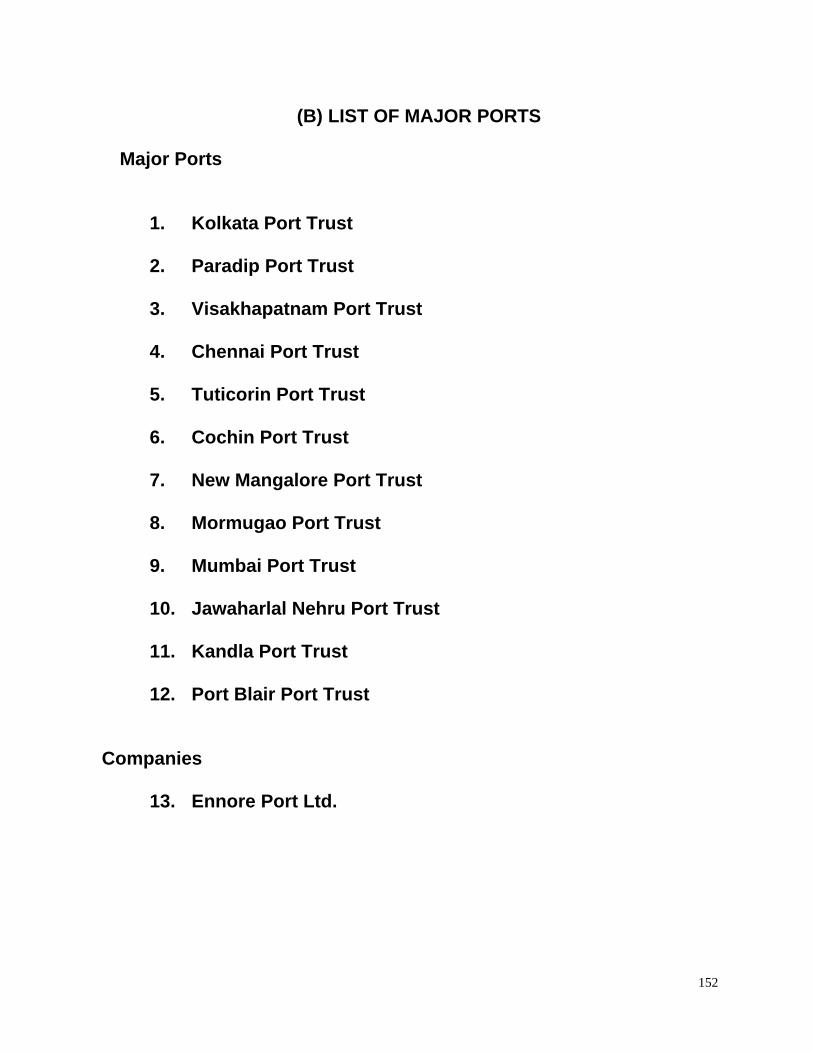
152
(B) LIST OF MAJOR PORTS
Major Ports
1. Kolkata Port Trust 2. Paradip Port Trust 3. Visakhapatnam Port Trust 4. Chennai Port Trust 5. Tuticorin Port Trust 6. Cochin Port Trust 7. New Mangalore Port Trust 8. Mormugao Port Trust 9. Mumbai Port Trust 10. Jawaharlal Nehru Port Trust 11. Kandla Port Trust 12. Port Blair Port Trust
Companies
13. Ennore Port Ltd.
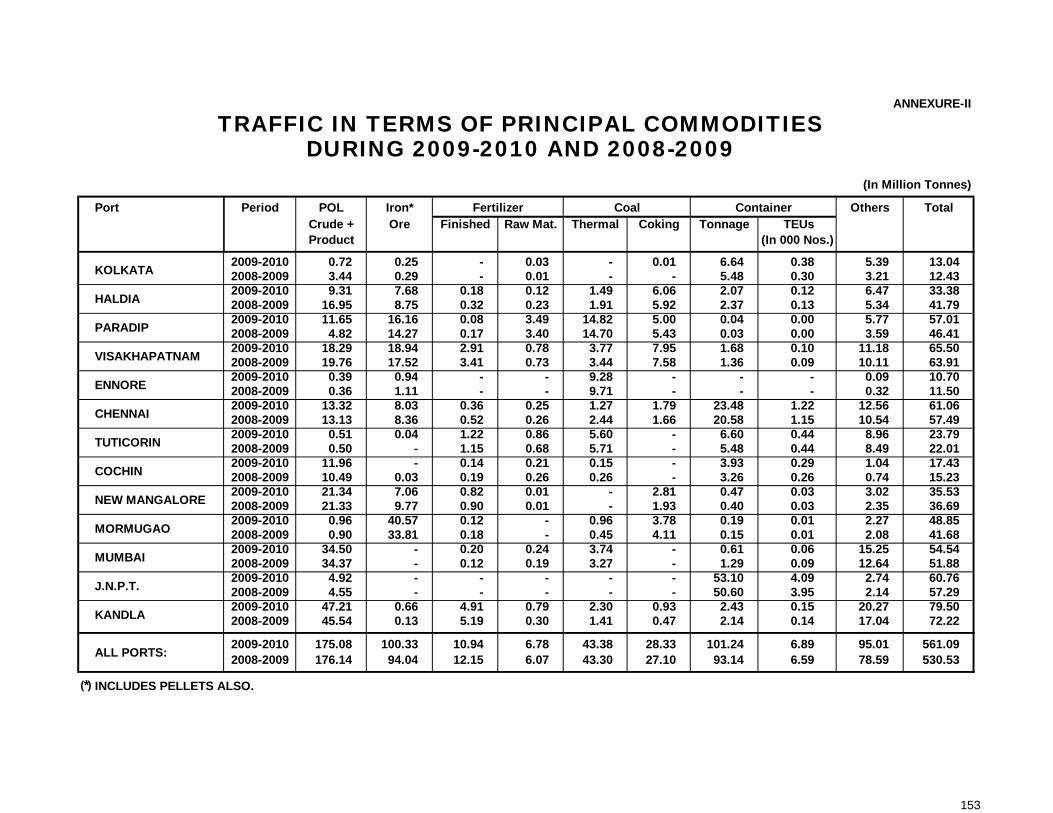
Port Period POL Iron* Fertilizer Coal Container Others TotalCrude + Ore Finished Raw Mat. Thermal Coking Tonnage TEUsProduct (In 000 Nos.)
2009-2010 0.72 0.25 - 0.03 - 0.01 6.64 0.38 5.39 13.042008-2009 3.44 0.29 - 0.01 - - 5.48 0.30 3.21 12.432009-2010 9.31 7.68 0.18 0.12 1.49 6.06 2.07 0.12 6.47 33.382008-2009 16.95 8.75 0.32 0.23 1.91 5.92 2.37 0.13 5.34 41.792009-2010 11.65 16.16 0.08 3.49 14.82 5.00 0.04 0.00 5.77 57.012008-2009 4.82 14.27 0.17 3.40 14.70 5.43 0.03 0.00 3.59 46.412009-2010 18.29 18.94 2.91 0.78 3.77 7.95 1.68 0.10 11.18 65.502008-2009 19.76 17.52 3.41 0.73 3.44 7.58 1.36 0.09 10.11 63.912009-2010 0.39 0.94 - - 9.28 - - - 0.09 10.702008-2009 0.36 1.11 - - 9.71 - - - 0.32 11.502009-2010 13.32 8.03 0.36 0.25 1.27 1.79 23.48 1.22 12.56 61.062008-2009 13.13 8.36 0.52 0.26 2.44 1.66 20.58 1.15 10.54 57.492009-2010 0.51 0.04 1.22 0.86 5.60 - 6.60 0.44 8.96 23.792008-2009 0.50 - 1.15 0.68 5.71 - 5.48 0.44 8.49 22.012009-2010 11.96 - 0.14 0.21 0.15 - 3.93 0.29 1.04 17.432008-2009 10.49 0.03 0.19 0.26 0.26 - 3.26 0.26 0.74 15.232009-2010 21.34 7.06 0.82 0.01 - 2.81 0.47 0.03 3.02 35.532008-2009 21.33 9.77 0.90 0.01 - 1.93 0.40 0.03 2.35 36.692009-2010 0.96 40.57 0.12 - 0.96 3.78 0.19 0.01 2.27 48.852008-2009 0.90 33.81 0.18 - 0.45 4.11 0.15 0.01 2.08 41.682009-2010 34.50 - 0.20 0.24 3.74 - 0.61 0.06 15.25 54.542008-2009 34.37 - 0.12 0.19 3.27 - 1.29 0.09 12.64 51.882009-2010 4.92 - - - - - 53.10 4.09 2.74 60.762008-2009 4.55 - - - - - 50.60 3.95 2.14 57.292009-2010 47.21 0.66 4.91 0.79 2.30 0.93 2.43 0.15 20.27 79.502008-2009 45.54 0.13 5.19 0.30 1.41 0.47 2.14 0.14 17.04 72.22
2009-2010 175.08 100.33 10.94 6.78 43.38 28.33 101.24 6.89 95.01 561.092008-2009 176.14 94.04 12.15 6.07 43.30 27.10 93.14 6.59 78.59 530.53
(*) INCLUDES PELLETS ALSO.
CHENNAI
TUTICORIN
TRAFFIC IN TERMS OF PRINCIPAL COMMODITIESDURING 2009-2010 AND 2008-2009
(In Million Tonnes)
KOLKATA
HALDIA
PARADIP
COCHIN
KANDLA
VISAKHAPATNAM
ENNORE
ANNEXURE-II
ALL PORTS:
NEW MANGALORE
MORMUGAO
MUMBAI
J.N.P.T.
153

SL. COMMODITY Kolkata Haldia Paradip Ennore Tuticorin Cochin New Mormugao Mumbai Kandla J.Nehru TotalNO. Mangalore
1. POL 3.96 + 4.0 17.00 21.00 17.65 3.00 11.80 2.30 18.70 22.00 1.50 62.83 + 0.8 5.50 219.24 + 4.8(7) + A (3+2BJ) (1) (4) (1) (2) (1) (3)+ (4) (1) (8+3SBM) + A (2)
+ SBM SPM
2. IRON ORE 6.00 4.50 12.50 - 8.00 - - 7.50 28.30 - 66.80(2) (1) (1) (1) (1) (7+Trans)
3. COAL 7.00 20.00 - 13.00 - 6.25 - - - - 46.25(THERMAL) (2) (2) (2) (2) (8)
4. FERTILIZERS - 7.50 1.00 - - - 0.60 - - - 9.10(2) (1) (1) (4)
5. GEN./ BREAK 6.44 + 0.5 12.70 23.50 29.38 - 17.92 10.17 6.76 14.70 7.25 9.80 + 6 14.97 0.90 154.49 + 6.5BULK CARGO (22) + A (8) (9) (15) (14) (10) (9) (8) (4) (24)* + A (11) (1) (135) + A
6. CONTAINERS 4.00 - 1.74 - 33.60 # 5.00 4.31 - - 57.60 @ 120.85(2) (1) (7) (1) (3) (9) (31)
In Lakhs TEUs 3.33 - 1.45 - 28.00 4.17 3.59 - - 45.50 98.20
TOTAL: 15.90 + 4.5 46.70 76.50 62.27 16.00 71.32 23.72 30.37 44.20 37.05 43.70 + 6 85.00 + 0.8 64.00 616.73 + 11.30(33) + A (15) (22) (3) (24) (14) (16)+ (13) (6+Tran (31) + A (21+3SBM) + A (12) (227+5SBM+
+ SBM SPM shippers) Transhippers+2BJ)+A
NOTE: Figures in brackets denotes number of berths. BJ = Barge Jetty, SBM = Single Buoy Mooring, Single Point Mooring=SPM, Trans = Transhippers, and A = Anchorage.# CHENNAI Capacity of Chennai Port 1st Container Terminal(4 berths) and 2nd Container Terminal (3 berths) has been taken as 24 MT and 9.60 MT respectively.* MUMBAI: Berth no. 2&4 of Indira Dock has been redesignated as general cargo berths. As P&V dock (18 berths) is being converted as container storage yard,
the capacity and number of berths have been taken as nil.@ JNPT: Capacity of JNP container terminal (3 berths), NSICT(2 berths), GTIPL(3 berths) & 1 shallow water berth has been taken as 15.0 MT, 15.0 MT, 26.40 MT and
1.20 MT respectively. Capacity of one shallow water berth at JNPT is 0.90 MT for dry bulk cargo.SOURCE: DEVELOPMENT WING, MINISTRY OF SHIPPING.
ANNEXURE-III
6.00
-
-
1.90
-
-
7.20(2)
COMMODITY-WISE PORT CAPACITIES AS ON 31-3-2010(TAKING INTO ACCOUNT THE REASSESSMENT OF EXISTING CAPACITIES)
(In Million Tonnes)
-
ChennaiVizag
32.00(5)
- -
(42+5SBM+2BJ) + A
(17+2BJ)
(1+Trans)
5.50(4)
4.58
(2)
1.58
-
-
154

States Period POL Iron Cement & Coal Container Others TotalCrude + Ore TonnageProduct
2009-2010 140.23 6.83 11.04 21.64 2.18 14.42 9.20 205.542008-2009 91.16 5.87 11.26 16.16 6.77 11.54 10.05 152.812009-2010 - 5.32 2.20 2.97 0.01 0.00 2.01 12.512008-2009 - 4.16 2.16 1.46 0.03 - 2.60 10.412009-2010 - 13.68 - 0.22 - - - 13.902008-2009 - 11.90 - - - - - 11.902009-2010 1.04 - - - 0.04 - 0.09 1.172008-2009 0.80 - - - 0.02 - 0.08 0.902009-2010 - 7.84 0.01 - - - 0.70 8.552008-2009 - 4.28 0.01 - - - 0.68 4.972009-2010 0.01 - 0.05 - - - 0.06 0.122008-2009 0.01 - 0.04 - - - 0.07 0.122009-2010 0.02 - - 1.16 - 0.01 0.13 1.322008-2009 0.02 - - - - - 0.03 0.052009-2010 3.65 15.28 0.92 15.16 3.85 - 4.76 43.622008-2009 9.40 9.47 0.21 3.50 3.27 - 3.89 29.742009-2010 - 0.12 - 0.14 0.03 - 0.13 0.422008-2009 - 0.04 - - 0.20 - 0.05 0.292009-2010 0.17 - 0.26 - 0.01 0.42 0.79 1.652008-2009 0.17 - 0.26 - 0.01 0.43 1.14 2.01
2009-2010 145.12 49.07 14.48 41.29 6.12 14.85 17.87 288.802008-2009 101.56 35.72 13.94 21.12 10.30 11.97 18.59 213.20
(*) Provisional (#) Steam Coal
COMMODITY-WISE TRAFFIC AT NON-MAJOR PORTSDURING 2009-2010* AND 2008-2009
Fertilizer &FRM
GOA(PANJIM)
TAMIL NADU
(In Million Tonnes)
Clinker
ANNEXURE-IV
ALL PORTS:
A&N ISLANDS
KARNATAKA
KERALA
PUDUCHERRY
ANDHRA PRADESH
ORISSA
GUJARAT
MAHARASHTRA
155

S.no. Name of the Project PORT Cost (RS. In Crore)
Capacity (in MTPA)
(1) (2) (3) (4) (5)1. Container Terminal, NSICT JNPT 600.00 13.20
2. BPCL Jetty JNPT 200.00 5.50
3. Third Container Terminal JNPT 900.00 15.60
4. Bulk Cargo berths no. 5A & 6A Mormugao 250.00 5.00
5. Fifth Oil Jetty (IFfco0 Kandla 21.50 2.00
6. Oil Jetty related facilities at Vadinar (ESSAR) Kandla 750.00 12.00
7. Oil Jetty awarded to M/s IOCL Kandla 20.70 2.00
8. Container Freight Station Kandla 41.07 3.00
9. Container Terminal (Phase I & II) Kandla 446.54 7.20
10. Container Terminal (Berth no. 70). Tuticorin 100.00 5.00
11. Container Terminal, Outer harbour. Visakhapatnam 108.00 1.60
12. Multipurpose Berths - EQ-8 & EQ-9 Visakhapatnam 196.00 6.00
13. Captive Fertilizer Berth Paradip 26.17 4.00
14. Mechanisation of Cargo handling project -1 Paradip 37.32 2.00
15. Mechanisation of Cargo handling project -2 Paradip 25.13 2.00
16. Container Terminal at Chennai Chennai 469.00 8.00
17. Construction of single Point Mooring Captive berth
paradip 500.00 15.00
18. Development of Second Container Terminal Chennai 495.00 9.60
19. Marine Liquid Terminal Ennore 249.00 3.00
20. Multipurpose Berth no. 4A Haldia 150.00 3.00
21. Multipurpose Berth no. 12 Haldia 30.07 0.45
22. Crude Oil handling facility Cochin 720.00 7.50
Total 6335.50 132.65
PRIVATE SECTOR / CAPTIVE PORT PROJECTS (OPERATIONAL)ANNEXURE - V (a)
(AS ON 1.10.2010)
156

S.NO. Name of the Project PORT Cost (RS. In Crore)
Capacity (in MTPA)
(1) (2) (3) (4) (5)1. International Container Transhipment
Terminal (ICTT) (Phase I to III)Cochin 2118.00 36.00
2. LNG R-gasification Terminal at Cochin Cochin 3195.00 2.50
3. Coal Terminal Ennore 399.00 8.00
4. iron Ore Terminal Ennore 480.00 12.00
5. Construction of two new off Shore container berths and development of container terminal
Mumbai 1460.00 9.60
6. Construction of Captive Jetty for handling Coal by M/s NPCL
New Mangalore 230.00 5.40
7. Construction of Coal Berth at NBW for NLC-TNEB
Tuticorin 49.00 6.30
8. Development of 13th multipurpose cargo berth (other than liquid and container cargo berth)
Kandla 188.00 2.00
9. Construction of Deep Draft Iron Ore Berth Paradip 591.00 10.00
10. Construction of Deep Draft Coal Berth Paradip 479.00 10.00
11. Setting up of Mechanised Iron Ore Handling Facilities at Berth no. 14
New Mangalore 277.11 6.62
12. Development of Berth No.7 for handling bulk cargo
Mormugao 252.00 7.00
13. Development of Western quay(WQ-6) in the northern arm of Inner harbour of VPT for
Visakhapatnam 114.37 2.00
14. Development of EQ-10 berth in Inner Harbour for handling liquid cargo
Visakhapatnam 55.38 1.85
15. .Mechanised Coal handling facilities at General cum Cargo Berth (GCB) in the Outer
Visakhapatnam 444.10 10.18
16. Mechanization of Central Quay-III Berth Paradip 40.00 4.00
17. Mechanization of berth no. 2 Haldia 75.00 4.00
18. Mechanization of Berth no. 8 Haldia 75.00 4.00
19. Multi purpose berth Project Paradip 387.31 5.00
20. Development of Container Terminal Ennore 1407.00 18.00
21. Construction of NCB-II Tuticorin 332.16 7.00
Total 12648.43 171.45
ANNEXURE - V (b)
PRIVATE SECTOR / CAPTIVE PORT PROJECTS UNDER IMPLEMENTATION(AS ON 1.10.2010)
157

S.NO. Name of the Project PORT Cost (RS. In Crore)
Capacity (in MTPA)
(1) (2) (3) (4) (5)1. Development of 13th multipurpose cargo
berth (other than liquid and container cargo berth)
Kandla 188.00 2.00
2. Construction of Deep Draft Iron Ore Berth Paradip 591.00 10.00
3. Construction of Deep Draft Coal Berth Paradip 479.00 10.00
4. Setting up of Mechanised Iron Ore Handling Facilities at Berth No. 14
New Mangalore 277.11 6.62
5. Development of Berth no.-7 for handling bulk cargo
Mormugao 252.00 7.00
6. Development of Western quay (WQ-6) in the northern arm of Inner harbour of VPT for handling Dry bulk cargo
Visakhapatnam 114.37 2.00
7. Development of EQ-10 berth in Inner harbour for handling liquid cargo
Visakhapatnam 55.38 1.85
8. Mechanised Coal handling facilities at General cum Cargo Berth (GCB) in the Outer Harbour
Visakhapatnam 444.10 10.18
9. Mechanisation at HDC berth no. 2 Kolkata 75.00 4.00
10. Mechanisation at HDC berth no. 8 Kolkata 75.00 4.00
11. Mechanisation of Cargo Handling Project-1 Paradip 37.32 2.00
12. Mechanisation of Cargo Handling project -2 Paradip 25.13 2.00
13. Mechanization of Central Quay-III Berth Paradip 40.00 4.00
Total 2653.41 65.65
PPP PROJECTS AWARDED IN 2009-10 ANNEXURE V (c)
158
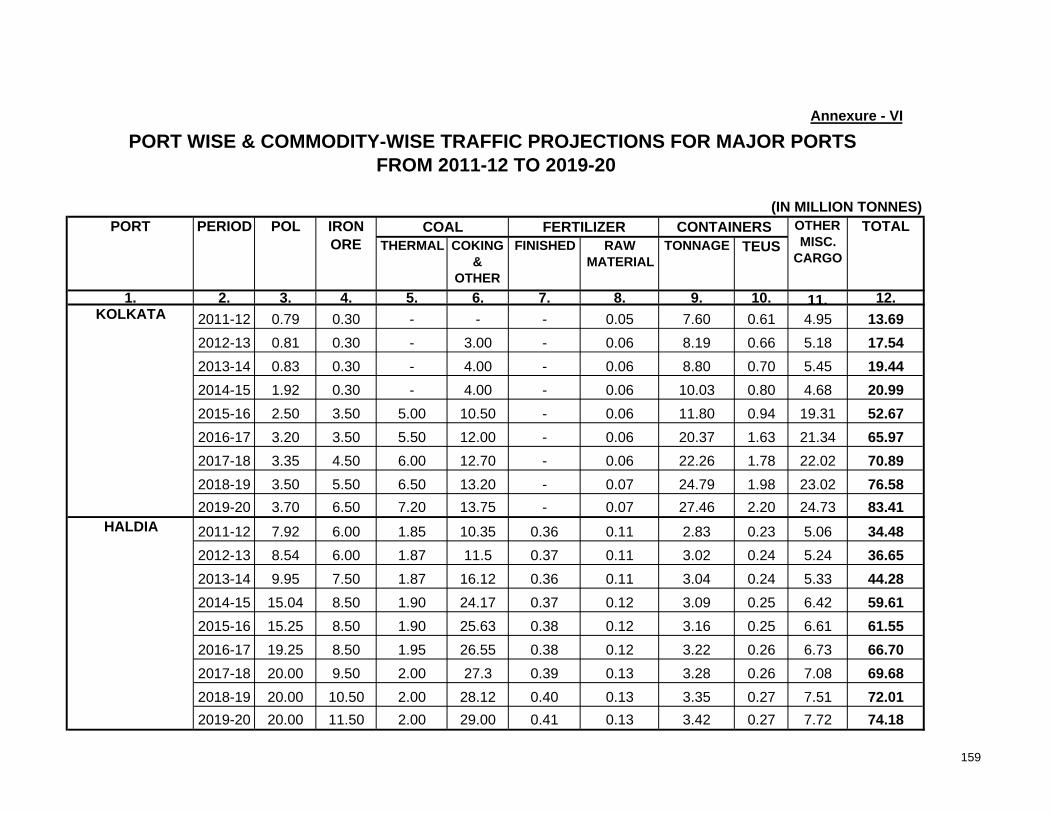
THERMAL COKING &
OTHER
FINISHED RAW MATERIAL
TONNAGE TEUS
1. 2. 3. 4. 5. 6. 7. 8. 9. 10. 11. 12.2011-12 0.79 0.30 - - - 0.05 7.60 0.61 4.95 13.692012-13 0.81 0.30 - 3.00 - 0.06 8.19 0.66 5.18 17.542013-14 0.83 0.30 - 4.00 - 0.06 8.80 0.70 5.45 19.442014-15 1.92 0.30 - 4.00 - 0.06 10.03 0.80 4.68 20.992015-16 2.50 3.50 5.00 10.50 - 0.06 11.80 0.94 19.31 52.672016-17 3.20 3.50 5.50 12.00 - 0.06 20.37 1.63 21.34 65.972017-18 3.35 4.50 6.00 12.70 - 0.06 22.26 1.78 22.02 70.892018-19 3.50 5.50 6.50 13.20 - 0.07 24.79 1.98 23.02 76.582019-20 3.70 6.50 7.20 13.75 - 0.07 27.46 2.20 24.73 83.412011-12 7.92 6.00 1.85 10.35 0.36 0.11 2.83 0.23 5.06 34.482012-13 8.54 6.00 1.87 11.5 0.37 0.11 3.02 0.24 5.24 36.652013-14 9.95 7.50 1.87 16.12 0.36 0.11 3.04 0.24 5.33 44.282014-15 15.04 8.50 1.90 24.17 0.37 0.12 3.09 0.25 6.42 59.612015-16 15.25 8.50 1.90 25.63 0.38 0.12 3.16 0.25 6.61 61.552016-17 19.25 8.50 1.95 26.55 0.38 0.12 3.22 0.26 6.73 66.702017-18 20.00 9.50 2.00 27.3 0.39 0.13 3.28 0.26 7.08 69.682018-19 20.00 10.50 2.00 28.12 0.40 0.13 3.35 0.27 7.51 72.012019-20 20.00 11.50 2.00 29.00 0.41 0.13 3.42 0.27 7.72 74.18
TOTAL
HALDIA
Annexure - VI
FROM 2011-12 TO 2019-20PORT WISE & COMMODITY-WISE TRAFFIC PROJECTIONS FOR MAJOR PORTS
IRON ORE
(IN MILLION TONNES)CONTAINERSFERTILIZERPOL
KOLKATA
PORT PERIOD OTHER MISC.
CARGO
COAL
159

Annexure - VI
FROM 2011-12 TO 2019-20PORT WISE & COMMODITY-WISE TRAFFIC PROJECTIONS FOR MAJOR PORTS
THERMAL COKING &
OTHER
FINISHED RAW MATERIAL
TONNAGE TEUS
1. 2. 3. 4. 5. 6. 7. 8. 9. 10. 11. 12.2011-12 18.00 17.00 18.00 5.00 0.20 4.00 0.05 0.004 7.75 70.002012-13 21.00 17.00 18.00 5.50 0.20 4.00 0.05 0.004 9.10 74.852013-14 23.50 17.00 18.00 6.00 0.20 4.50 0.10 0.008 10.10 79.402014-15 29.00 17.50 18.00 7.00 0.20 4.50 0.10 0.008 10.70 87.002015-16 34.50 18.50 18.00 8.00 0.20 4.50 1.00 0.08 11.30 96.002016-17 35.00 19.00 18.00 10.00 0.20 5.00 1.00 0.08 11.80 100.002017-18 39.00 19.00 18.50 10.00 0.20 5.50 1.00 0.08 12.40 105.602018-19 43.00 19.50 19.00 10.00 0.20 6.00 1.00 0.08 13.20 111.902019-20 48.00 20.00 20.00 10.00 0.20 7.00 1.00 0.08 13.80 120.002011-12 16.30 18.30 3.00 11.00 4.20 0.75 2.04 0.16 10.67 66.262012-13 16.30 18.30 3.00 11.30 4.50 1.00 2.28 0.18 11.05 67.732013-14 16.60 18.30 3.00 11.30 5.50 0.9 2.56 0.20 11.48 69.642014-15 17.40 18.30 3.50 15.00 5.50 0.9 2.86 0.23 12.39 75.852015-16 19.40 18.30 3.50 15.00 5.50 0.85 3.2 0.26 13.11 78.862016-17 20.20 21.20 3.50 15.00 5.50 0.85 3.57 0.29 13.57 83.392017-18 21.50 21.20 3.50 15.00 5.50 0.85 3.97 0.32 14.15 85.672018-19 21.50 21.20 3.50 17.00 5.50 0.85 4.34 0.35 14.79 88.682019-20 21.50 25.70 3.50 24.00 7.00 0.85 4.67 0.37 15.74 102.96
PARADIP
IRON ORE
(IN MILLION TONNES)POL
VISAKHAPATNAM
PERIODPORT TOTALCOAL FERTILIZER CONTAINERS OTHER MISC.
CARGO
160
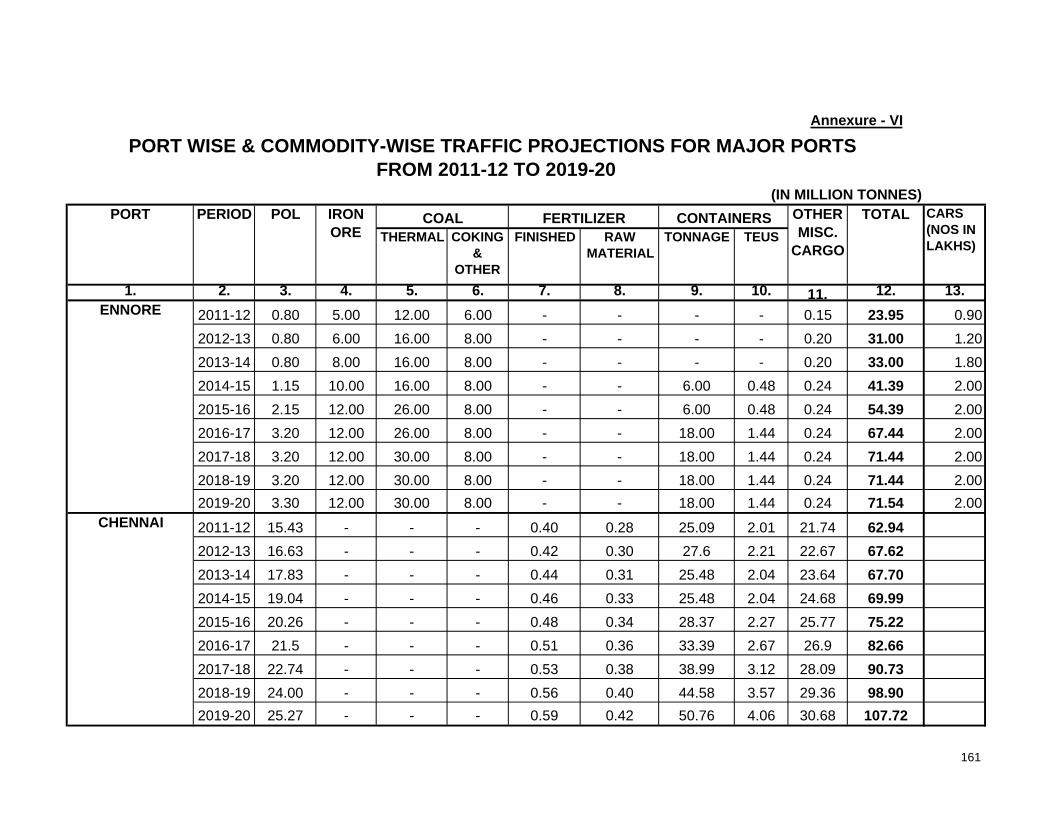
Annexure - VI
FROM 2011-12 TO 2019-20PORT WISE & COMMODITY-WISE TRAFFIC PROJECTIONS FOR MAJOR PORTS
THERMAL COKING &
OTHER
FINISHED RAW MATERIAL
TONNAGE TEUS
1. 2. 3. 4. 5. 6. 7. 8. 9. 10. 11. 12. 13.2011-12 0.80 5.00 12.00 6.00 - - - - 0.15 23.95 0.902012-13 0.80 6.00 16.00 8.00 - - - - 0.20 31.00 1.202013-14 0.80 8.00 16.00 8.00 - - - - 0.20 33.00 1.802014-15 1.15 10.00 16.00 8.00 - - 6.00 0.48 0.24 41.39 2.002015-16 2.15 12.00 26.00 8.00 - - 6.00 0.48 0.24 54.39 2.002016-17 3.20 12.00 26.00 8.00 - - 18.00 1.44 0.24 67.44 2.002017-18 3.20 12.00 30.00 8.00 - - 18.00 1.44 0.24 71.44 2.002018-19 3.20 12.00 30.00 8.00 - - 18.00 1.44 0.24 71.44 2.002019-20 3.30 12.00 30.00 8.00 - - 18.00 1.44 0.24 71.54 2.00
2011-12 15.43 - - - 0.40 0.28 25.09 2.01 21.74 62.942012-13 16.63 - - - 0.42 0.30 27.6 2.21 22.67 67.622013-14 17.83 - - - 0.44 0.31 25.48 2.04 23.64 67.702014-15 19.04 - - - 0.46 0.33 25.48 2.04 24.68 69.992015-16 20.26 - - - 0.48 0.34 28.37 2.27 25.77 75.222016-17 21.5 - - - 0.51 0.36 33.39 2.67 26.9 82.662017-18 22.74 - - - 0.53 0.38 38.99 3.12 28.09 90.732018-19 24.00 - - - 0.56 0.40 44.58 3.57 29.36 98.902019-20 25.27 - - - 0.59 0.42 50.76 4.06 30.68 107.72
CHENNAI
ENNORE
PORT PERIOD CONTAINERS OTHER MISC.
CARGO
(IN MILLION TONNES)POL IRON
ORECARS (NOS IN LAKHS)
TOTALCOAL FERTILIZER
161
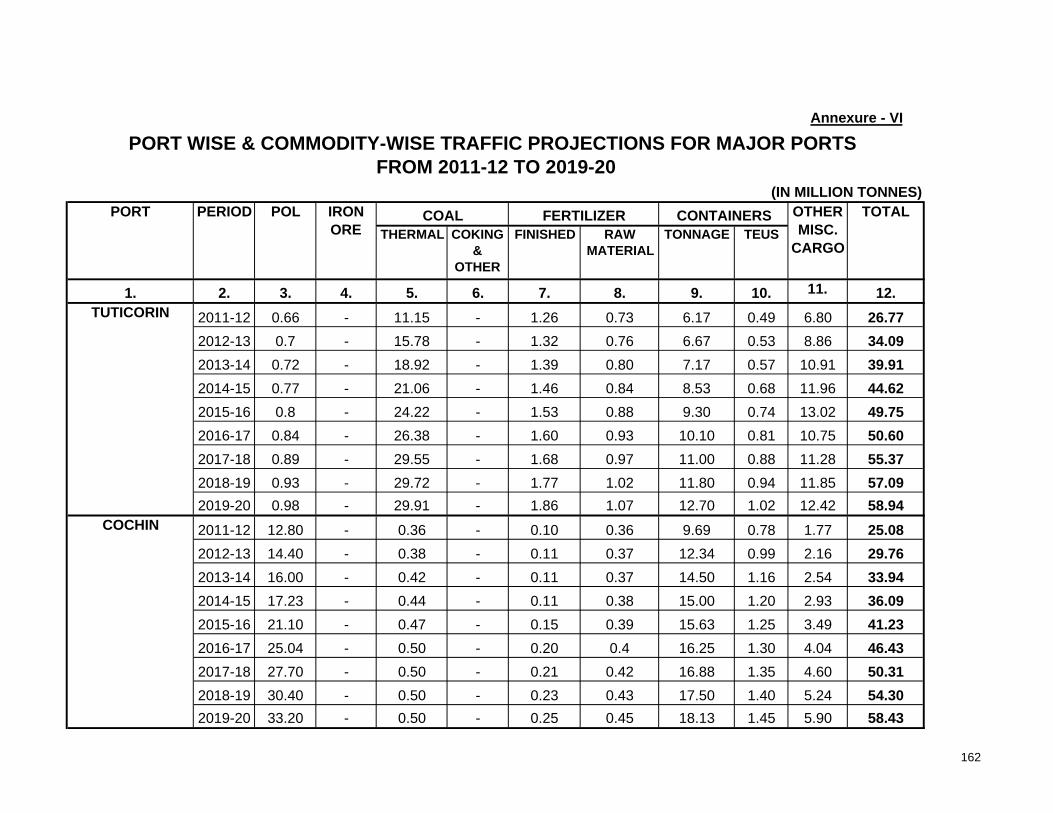
Annexure - VI
FROM 2011-12 TO 2019-20PORT WISE & COMMODITY-WISE TRAFFIC PROJECTIONS FOR MAJOR PORTS
THERMAL COKING &
OTHER
FINISHED RAW MATERIAL
TONNAGE TEUS
1. 2. 3. 4. 5. 6. 7. 8. 9. 10. 11. 12.2011-12 0.66 - 11.15 - 1.26 0.73 6.17 0.49 6.80 26.772012-13 0.7 - 15.78 - 1.32 0.76 6.67 0.53 8.86 34.092013-14 0.72 - 18.92 - 1.39 0.80 7.17 0.57 10.91 39.912014-15 0.77 - 21.06 - 1.46 0.84 8.53 0.68 11.96 44.622015-16 0.8 - 24.22 - 1.53 0.88 9.30 0.74 13.02 49.752016-17 0.84 - 26.38 - 1.60 0.93 10.10 0.81 10.75 50.602017-18 0.89 - 29.55 - 1.68 0.97 11.00 0.88 11.28 55.372018-19 0.93 - 29.72 - 1.77 1.02 11.80 0.94 11.85 57.092019-20 0.98 - 29.91 - 1.86 1.07 12.70 1.02 12.42 58.942011-12 12.80 - 0.36 - 0.10 0.36 9.69 0.78 1.77 25.082012-13 14.40 - 0.38 - 0.11 0.37 12.34 0.99 2.16 29.762013-14 16.00 - 0.42 - 0.11 0.37 14.50 1.16 2.54 33.942014-15 17.23 - 0.44 - 0.11 0.38 15.00 1.20 2.93 36.092015-16 21.10 - 0.47 - 0.15 0.39 15.63 1.25 3.49 41.232016-17 25.04 - 0.50 - 0.20 0.4 16.25 1.30 4.04 46.432017-18 27.70 - 0.50 - 0.21 0.42 16.88 1.35 4.60 50.312018-19 30.40 - 0.50 - 0.23 0.43 17.50 1.40 5.24 54.302019-20 33.20 - 0.50 - 0.25 0.45 18.13 1.45 5.90 58.43
TUTICORIN
FERTILIZER
COCHIN
COAL(IN MILLION TONNES)
PORT PERIOD POL IRON ORE
CONTAINERS OTHER MISC.
CARGO
TOTAL
162
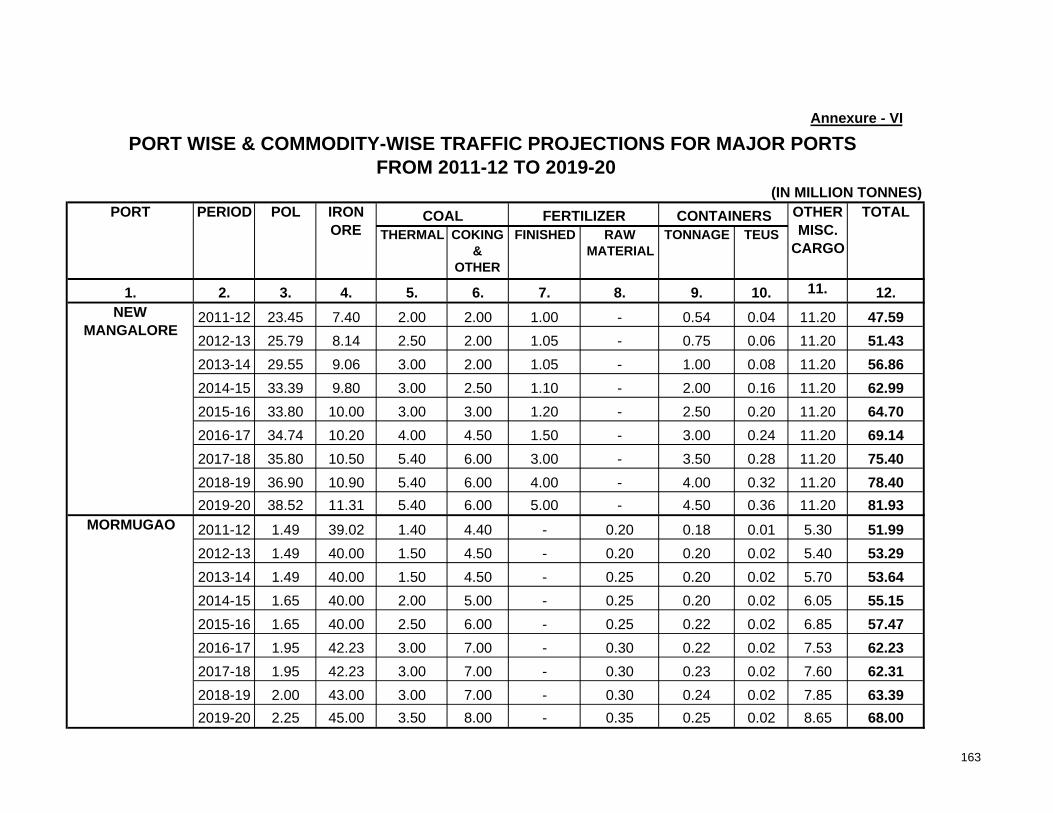
Annexure - VI
FROM 2011-12 TO 2019-20PORT WISE & COMMODITY-WISE TRAFFIC PROJECTIONS FOR MAJOR PORTS
THERMAL COKING &
OTHER
FINISHED RAW MATERIAL
TONNAGE TEUS
1. 2. 3. 4. 5. 6. 7. 8. 9. 10. 11. 12.2011-12 23.45 7.40 2.00 2.00 1.00 - 0.54 0.04 11.20 47.592012-13 25.79 8.14 2.50 2.00 1.05 - 0.75 0.06 11.20 51.432013-14 29.55 9.06 3.00 2.00 1.05 - 1.00 0.08 11.20 56.862014-15 33.39 9.80 3.00 2.50 1.10 - 2.00 0.16 11.20 62.992015-16 33.80 10.00 3.00 3.00 1.20 - 2.50 0.20 11.20 64.702016-17 34.74 10.20 4.00 4.50 1.50 - 3.00 0.24 11.20 69.142017-18 35.80 10.50 5.40 6.00 3.00 - 3.50 0.28 11.20 75.402018-19 36.90 10.90 5.40 6.00 4.00 - 4.00 0.32 11.20 78.402019-20 38.52 11.31 5.40 6.00 5.00 - 4.50 0.36 11.20 81.932011-12 1.49 39.02 1.40 4.40 - 0.20 0.18 0.01 5.30 51.992012-13 1.49 40.00 1.50 4.50 - 0.20 0.20 0.02 5.40 53.292013-14 1.49 40.00 1.50 4.50 - 0.25 0.20 0.02 5.70 53.642014-15 1.65 40.00 2.00 5.00 - 0.25 0.20 0.02 6.05 55.152015-16 1.65 40.00 2.50 6.00 - 0.25 0.22 0.02 6.85 57.472016-17 1.95 42.23 3.00 7.00 - 0.30 0.22 0.02 7.53 62.232017-18 1.95 42.23 3.00 7.00 - 0.30 0.23 0.02 7.60 62.312018-19 2.00 43.00 3.00 7.00 - 0.30 0.24 0.02 7.85 63.392019-20 2.25 45.00 3.50 8.00 - 0.35 0.25 0.02 8.65 68.00
NEW MANGALORE
MORMUGAO
COAL FERTILIZERPORT PERIOD POL IRON ORE
CONTAINERS OTHER MISC.
CARGO
TOTAL(IN MILLION TONNES)
163
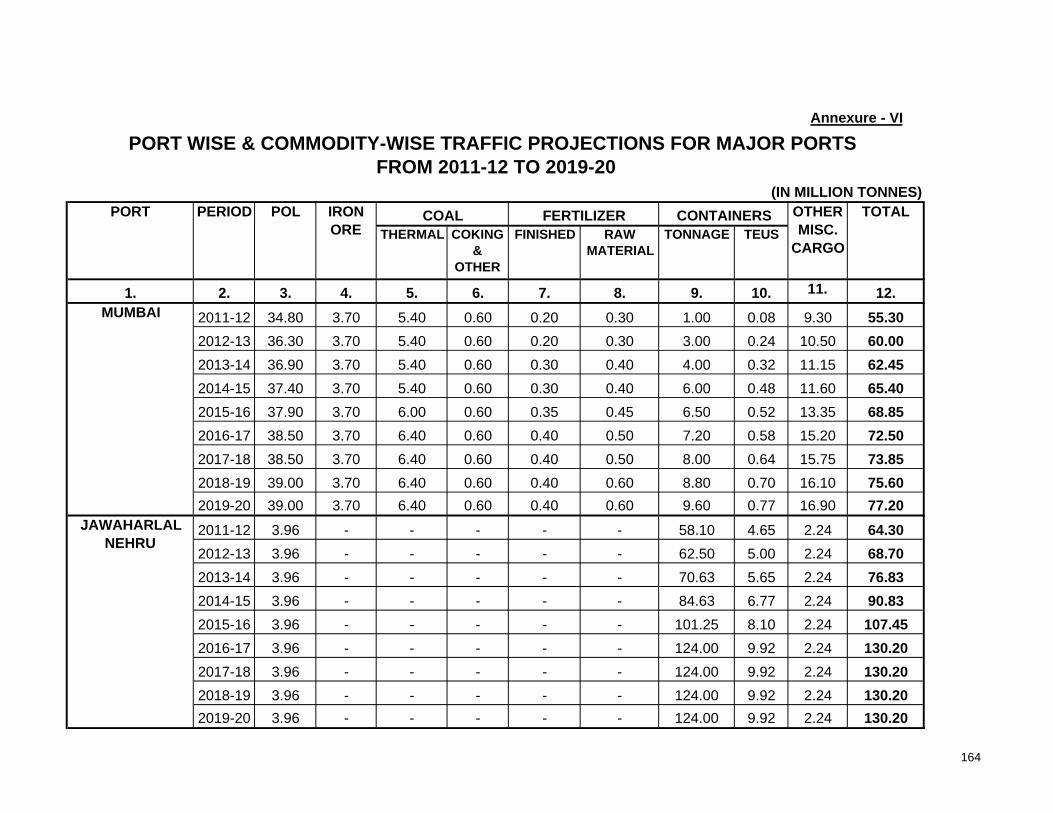
Annexure - VI
FROM 2011-12 TO 2019-20PORT WISE & COMMODITY-WISE TRAFFIC PROJECTIONS FOR MAJOR PORTS
THERMAL COKING &
OTHER
FINISHED RAW MATERIAL
TONNAGE TEUS
1. 2. 3. 4. 5. 6. 7. 8. 9. 10. 11. 12.2011-12 34.80 3.70 5.40 0.60 0.20 0.30 1.00 0.08 9.30 55.302012-13 36.30 3.70 5.40 0.60 0.20 0.30 3.00 0.24 10.50 60.002013-14 36.90 3.70 5.40 0.60 0.30 0.40 4.00 0.32 11.15 62.452014-15 37.40 3.70 5.40 0.60 0.30 0.40 6.00 0.48 11.60 65.402015-16 37.90 3.70 6.00 0.60 0.35 0.45 6.50 0.52 13.35 68.852016-17 38.50 3.70 6.40 0.60 0.40 0.50 7.20 0.58 15.20 72.502017-18 38.50 3.70 6.40 0.60 0.40 0.50 8.00 0.64 15.75 73.852018-19 39.00 3.70 6.40 0.60 0.40 0.60 8.80 0.70 16.10 75.602019-20 39.00 3.70 6.40 0.60 0.40 0.60 9.60 0.77 16.90 77.202011-12 3.96 - - - - - 58.10 4.65 2.24 64.302012-13 3.96 - - - - - 62.50 5.00 2.24 68.702013-14 3.96 - - - - - 70.63 5.65 2.24 76.832014-15 3.96 - - - - - 84.63 6.77 2.24 90.832015-16 3.96 - - - - - 101.25 8.10 2.24 107.452016-17 3.96 - - - - - 124.00 9.92 2.24 130.202017-18 3.96 - - - - - 124.00 9.92 2.24 130.202018-19 3.96 - - - - - 124.00 9.92 2.24 130.202019-20 3.96 - - - - - 124.00 9.92 2.24 130.20
JAWAHARLAL NEHRU
PORT PERIOD FERTILIZER
MUMBAI
COALPOL IRON ORE
(IN MILLION TONNES)TOTALCONTAINERS OTHER
MISC. CARGO
164

Annexure - VI
FROM 2011-12 TO 2019-20PORT WISE & COMMODITY-WISE TRAFFIC PROJECTIONS FOR MAJOR PORTS
THERMAL COKING &
OTHER
FINISHED RAW MATERIAL
TONNAGE TEUS
1. 2. 3. 4. 5. 6. 7. 8. 9. 10. 11. 12.2011-12 52.05 0.75 2.42 0.87 5.15 0.75 2.70 0.22 20.91 85.602012-13 53.45 0.75 2.44 0.89 5.15 0.75 2.90 0.23 21.67 88.002013-14 55.65 0.75 4.65 1.01 6.89 0.76 3.16 0.25 23.76 96.632014-15 57.85 0.75 6.69 1.21 7.52 0.77 3.42 0.27 26.32 104.532015-16 65.3 0.75 8.72 1.41 8.05 0.78 3.68 0.29 28.67 117.362016-17 72.65 0.77 10.75 1.61 8.84 0.79 3.95 0.32 32.76 132.122017-18 80.3 0.79 12.53 1.81 9.53 0.80 4.22 0.34 35.5 145.482018-19 88.35 0.82 13.56 1.91 9.92 0.80 4.51 0.36 38.24 158.112019-20 89.3 0.85 13.71 2.01 14.45 0.80 4.80 0.38 51.98 177.902011-12 0.17 - - - 0.01 - 0.45 0.04 1.06 1.692012-13 0.18 - - - 0.01 - 0.46 0.04 1.12 1.772013-14 0.19 - - - 0.01 - 0.48 0.04 1.17 1.852014-15 0.20 - - - 0.01 - 0.49 0.04 1.23 1.932015-16 0.22 - - - 0.01 - 0.51 0.04 1.29 2.032016-17 0.23 - - - 0.01 - 0.52 0.04 1.36 2.122017-18 0.23 - - - 0.01 - 0.54 0.04 1.43 2.212018-19 0.25 - - - 0.01 - 0.55 0.04 1.50 2.312019-20 0.26 - - - 0.01 - 0.57 0.05 1.57 2.41
PORT BLAIR
KANDLA
TOTALCOAL FERTILIZER CONTAINERS OTHER MISC.
CARGO
(IN MILLION TONNES)PORT PERIOD POL IRON
ORE
165

Annexure - VI
FROM 2011-12 TO 2019-20PORT WISE & COMMODITY-WISE TRAFFIC PROJECTIONS FOR MAJOR PORTS
THERMAL COKING &
OTHER
FINISHED RAW MATERIAL
TONNAGE TEUS
1. 2. 3. 4. 5. 6. 7. 8. 9. 10. 11. 12.2011-12 188.62 97.47 57.58 40.22 12.88 7.53 116.44 9.32 108.90 629.642012-13 200.35 100.19 66.87 47.29 13.33 7.85 129.96 10.40 116.59 682.432013-14 213.97 104.61 72.76 53.53 16.25 8.46 141.12 11.29 124.87 735.572014-15 236.00 108.85 77.99 67.48 17.03 8.55 167.83 13.43 132.64 816.372015-16 258.79 115.25 99.31 78.14 17.85 8.62 193.12 15.45 156.45 927.532016-17 280.26 121.10 105.98 85.26 19.14 9.31 244.79 19.58 165.66 1031.502017-18 299.12 123.42 117.38 88.41 21.45 9.91 255.87 20.47 173.58 1089.142018-19 316.99 127.12 119.58 91.83 22.99 10.60 267.46 21.40 182.34 1138.912019-20 329.24 136.56 122.12 101.36 30.17 11.74 279.86 22.39 203.77 1214.82
ALL MAJOR PORTS
COAL FERTILIZER CONTAINERS OTHER MISC.
CARGO
TOTAL(IN MILLION TONNES)
PORT PERIOD POL IRON ORE
166
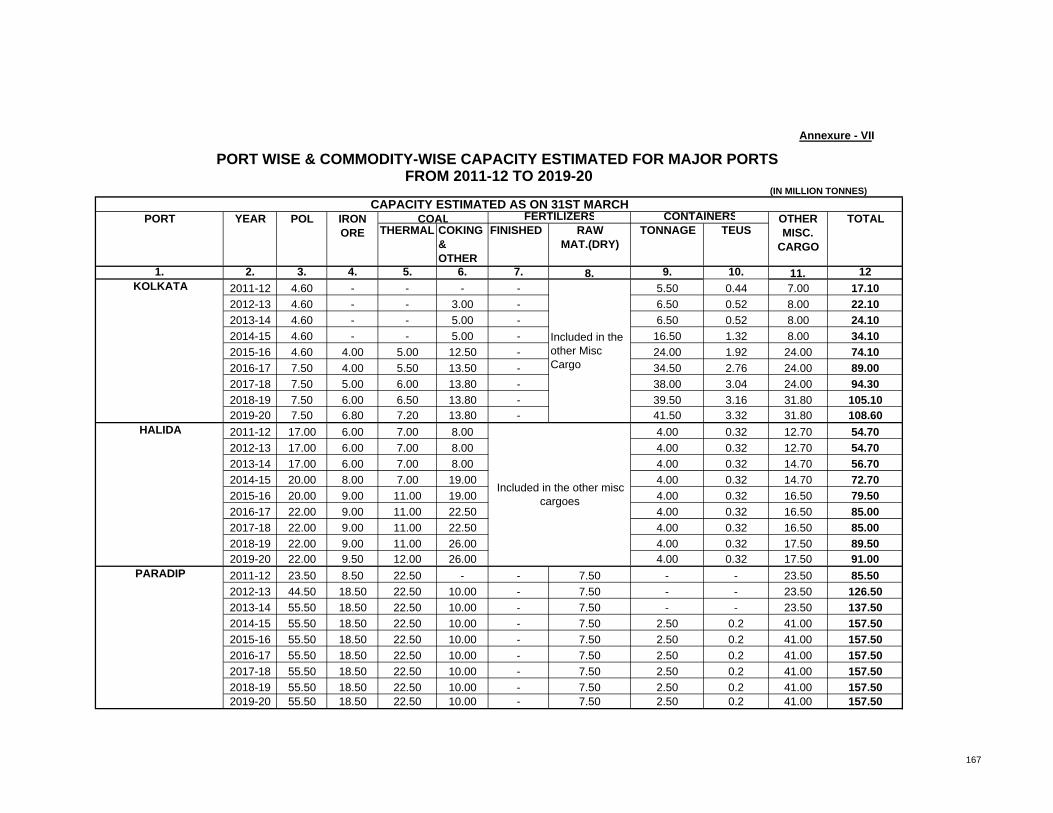
(IN MILLION TONNES)
THERMAL COKING & OTHER
FINISHED RAW MAT.(DRY)
TONNAGE TEUS
1. 2. 3. 4. 5. 6. 7. 8. 9. 10. 11. 122011-12 4.60 - - - - 5.50 0.44 7.00 17.102012-13 4.60 - - 3.00 - 6.50 0.52 8.00 22.102013-14 4.60 - - 5.00 - 6.50 0.52 8.00 24.102014-15 4.60 - - 5.00 - 16.50 1.32 8.00 34.102015-16 4.60 4.00 5.00 12.50 - 24.00 1.92 24.00 74.102016-17 7.50 4.00 5.50 13.50 - 34.50 2.76 24.00 89.002017-18 7.50 5.00 6.00 13.80 - 38.00 3.04 24.00 94.302018-19 7.50 6.00 6.50 13.80 - 39.50 3.16 31.80 105.102019-20 7.50 6.80 7.20 13.80 - 41.50 3.32 31.80 108.602011-12 17.00 6.00 7.00 8.00 4.00 0.32 12.70 54.702012-13 17.00 6.00 7.00 8.00 4.00 0.32 12.70 54.702013-14 17.00 6.00 7.00 8.00 4.00 0.32 14.70 56.702014-15 20.00 8.00 7.00 19.00 4.00 0.32 14.70 72.702015-16 20.00 9.00 11.00 19.00 4.00 0.32 16.50 79.502016-17 22.00 9.00 11.00 22.50 4.00 0.32 16.50 85.002017-18 22.00 9.00 11.00 22.50 4.00 0.32 16.50 85.002018-19 22.00 9.00 11.00 26.00 4.00 0.32 17.50 89.502019-20 22.00 9.50 12.00 26.00 4.00 0.32 17.50 91.002011-12 23.50 8.50 22.50 - - 7.50 - - 23.50 85.502012-13 44.50 18.50 22.50 10.00 - 7.50 - - 23.50 126.502013-14 55.50 18.50 22.50 10.00 - 7.50 - - 23.50 137.502014-15 55.50 18.50 22.50 10.00 - 7.50 2.50 0.2 41.00 157.502015-16 55.50 18.50 22.50 10.00 - 7.50 2.50 0.2 41.00 157.502016-17 55.50 18.50 22.50 10.00 - 7.50 2.50 0.2 41.00 157.502017-18 55.50 18.50 22.50 10.00 - 7.50 2.50 0.2 41.00 157.502018-19 55.50 18.50 22.50 10.00 - 7.50 2.50 0.2 41.00 157.502019-20 55.50 18.50 22.50 10.00 - 7.50 2.50 0.2 41.00 157.50
HALIDA
KOLKATA
PARADIP
Included in the other misc cargoes
Included in the other Misc Cargo
POL IRON ORE
COAL
Annexure - VII
FROM 2011-12 TO 2019-20
FERTILIZERS CONTAINERSCAPACITY ESTIMATED AS ON 31ST MARCH
PORT OTHER MISC.
CARGO
PORT WISE & COMMODITY-WISE CAPACITY ESTIMATED FOR MAJOR PORTS
TOTALYEAR
167

Annexure - VII
FROM 2011-12 TO 2019-20PORT WISE & COMMODITY-WISE CAPACITY ESTIMATED FOR MAJOR PORTS
(IN MILLION TONNES)
THERMAL COKING & OTHER
FINISHED RAW MAT.(DRY)
TONNAGE TEUS
1. 2. 3. 4. 5. 6. 7. 8. 9. 10. 11. 12 13.2011-12 25.65 12.50 - - 1.74 0.14 31.08 71.972012-13 25.65 14.50 3.00 9.20 2.40 0.19 37.00 94.052013-14 25.65 20.16 7.36 16.58 2.40 0.19 37.00 115.352014-15 27.65 26.66 7.36 16.58 4.40 0.35 39.20 128.052015-16 27.65 26.66 7.36 16.58 4.40 0.35 39.20 128.052016-17 27.65 26.66 7.36 19.08 4.40 0.35 48.32 139.672017-18 27.65 26.66 7.36 21.58 4.40 0.35 48.32 142.172018-19 27.65 26.66 7.36 24.08 4.40 0.35 49.82 146.172019-20 27.65 26.66 7.36 26.58 4.40 0.35 49.82 148.672011-12 3.00 12.00 16.00 8.00 - - - - 0.50 39.50 2.02012-13 3.00 12.00 16.00 8.00 - - - - 0.50 39.50 2.02013-14 3.00 12.00 16.00 8.00 - - 6.000 0.48 0.50 45.50 2.02014-15 5.50 12.00 16.00 8.00 - - 6.000 0.48 0.50 48.00 2.02015-16 8.50 12.00 26.00 8.00 - - 18.00 1.44 0.50 73.00 2.02016-17 8.50 12.00 26.00 8.00 - - 18.00 1.44 0.50 73.00 2.02017-18 8.50 12.00 26.00 8.00 - - 18.00 1.44 0.50 73.00 2.02018-19 8.50 12.00 26.00 8.00 - - 18.00 1.44 0.50 73.00 2.02019-20 8.50 12.00 26.00 8.00 - - 18.00 1.44 0.50 73.00 2.02011-12 11.80 - - - - - 33.60 2.69 22.92 68.322012-13 12.80 - - - - - 33.60 2.69 25.42 71.822013-14 12.80 - - - - - 33.60 2.69 26.42 72.822014-15 12.80 - - - - - 41.60 3.33 26.42 80.822015-16 12.80 - - - - - 53.60 4.29 26.42 92.822016-17 12.80 - - - - - 65.60 5.25 27.92 106.322017-18 12.80 - - - - - 77.60 6.21 27.92 118.322018-19 12.80 - - - - - 89.60 7.17 27.92 130.322019-20 12.80 - - - - - 99.60 7.97 27.92 140.32
6.20
6.20
OTHER MISC.
CARGO
TOTAL
6.206.20
CONTAINERS
6.20
1.002.30
CARS (NOS IN LAKHS)
CAPACITY ESTIMATED AS ON 31ST MARCHPORT FERTILIZERS
CHENNAI
ENNORE
VISAKHAPATNAM
6.206.20
YEAR POL IRON ORE
COAL
168
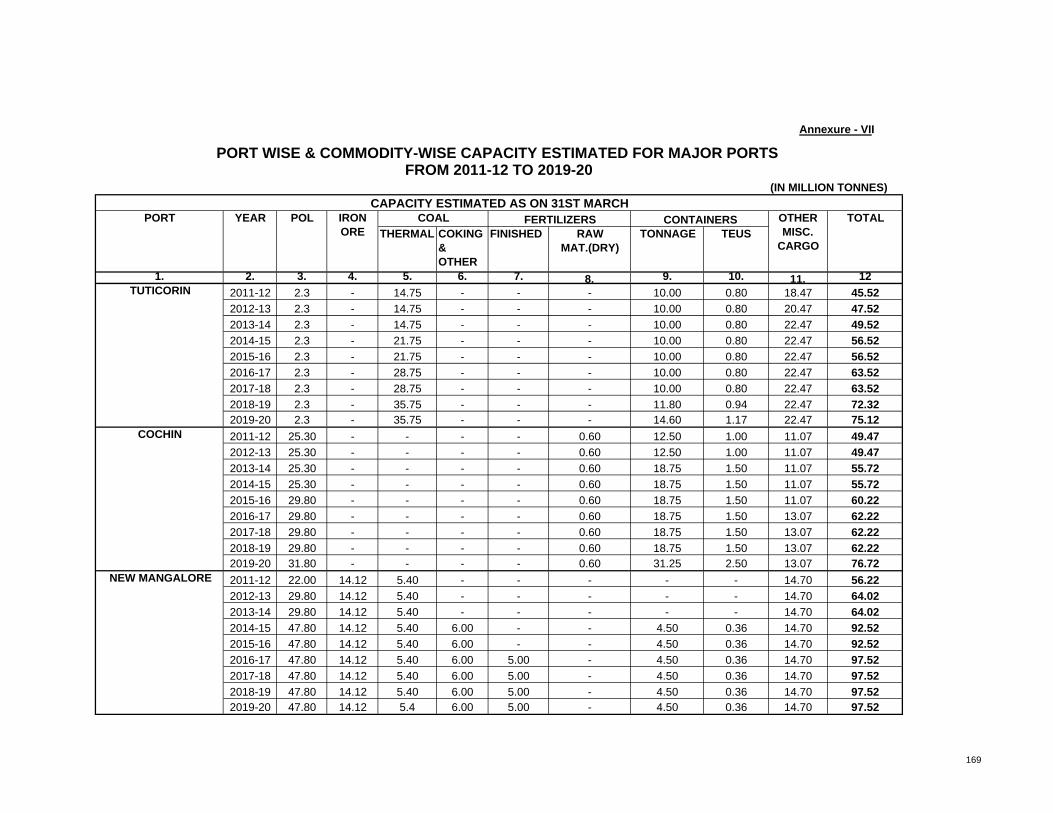
Annexure - VII
FROM 2011-12 TO 2019-20PORT WISE & COMMODITY-WISE CAPACITY ESTIMATED FOR MAJOR PORTS
(IN MILLION TONNES)
THERMAL COKING & OTHER
FINISHED RAW MAT.(DRY)
TONNAGE TEUS
1. 2. 3. 4. 5. 6. 7. 8. 9. 10. 11. 122011-12 2.3 - 14.75 - - - 10.00 0.80 18.47 45.522012-13 2.3 - 14.75 - - - 10.00 0.80 20.47 47.522013-14 2.3 - 14.75 - - - 10.00 0.80 22.47 49.522014-15 2.3 - 21.75 - - - 10.00 0.80 22.47 56.522015-16 2.3 - 21.75 - - - 10.00 0.80 22.47 56.522016-17 2.3 - 28.75 - - - 10.00 0.80 22.47 63.522017-18 2.3 - 28.75 - - - 10.00 0.80 22.47 63.522018-19 2.3 - 35.75 - - - 11.80 0.94 22.47 72.322019-20 2.3 - 35.75 - - - 14.60 1.17 22.47 75.122011-12 25.30 - - - - 0.60 12.50 1.00 11.07 49.472012-13 25.30 - - - - 0.60 12.50 1.00 11.07 49.472013-14 25.30 - - - - 0.60 18.75 1.50 11.07 55.722014-15 25.30 - - - - 0.60 18.75 1.50 11.07 55.722015-16 29.80 - - - - 0.60 18.75 1.50 11.07 60.222016-17 29.80 - - - - 0.60 18.75 1.50 13.07 62.222017-18 29.80 - - - - 0.60 18.75 1.50 13.07 62.222018-19 29.80 - - - - 0.60 18.75 1.50 13.07 62.222019-20 31.80 - - - - 0.60 31.25 2.50 13.07 76.722011-12 22.00 14.12 5.40 - - - - - 14.70 56.222012-13 29.80 14.12 5.40 - - - - - 14.70 64.022013-14 29.80 14.12 5.40 - - - - - 14.70 64.022014-15 47.80 14.12 5.40 6.00 - - 4.50 0.36 14.70 92.522015-16 47.80 14.12 5.40 6.00 - - 4.50 0.36 14.70 92.522016-17 47.80 14.12 5.40 6.00 5.00 - 4.50 0.36 14.70 97.522017-18 47.80 14.12 5.40 6.00 5.00 - 4.50 0.36 14.70 97.522018-19 47.80 14.12 5.40 6.00 5.00 - 4.50 0.36 14.70 97.522019-20 47.80 14.12 5.4 6.00 5.00 - 4.50 0.36 14.70 97.52
OTHER MISC.
CARGO
YEAR POL COAL CONTAINERSPORT TOTAL
NEW MANGALORE
CAPACITY ESTIMATED AS ON 31ST MARCHIRON ORE
TUTICORIN
COCHIN
FERTILIZERS
169
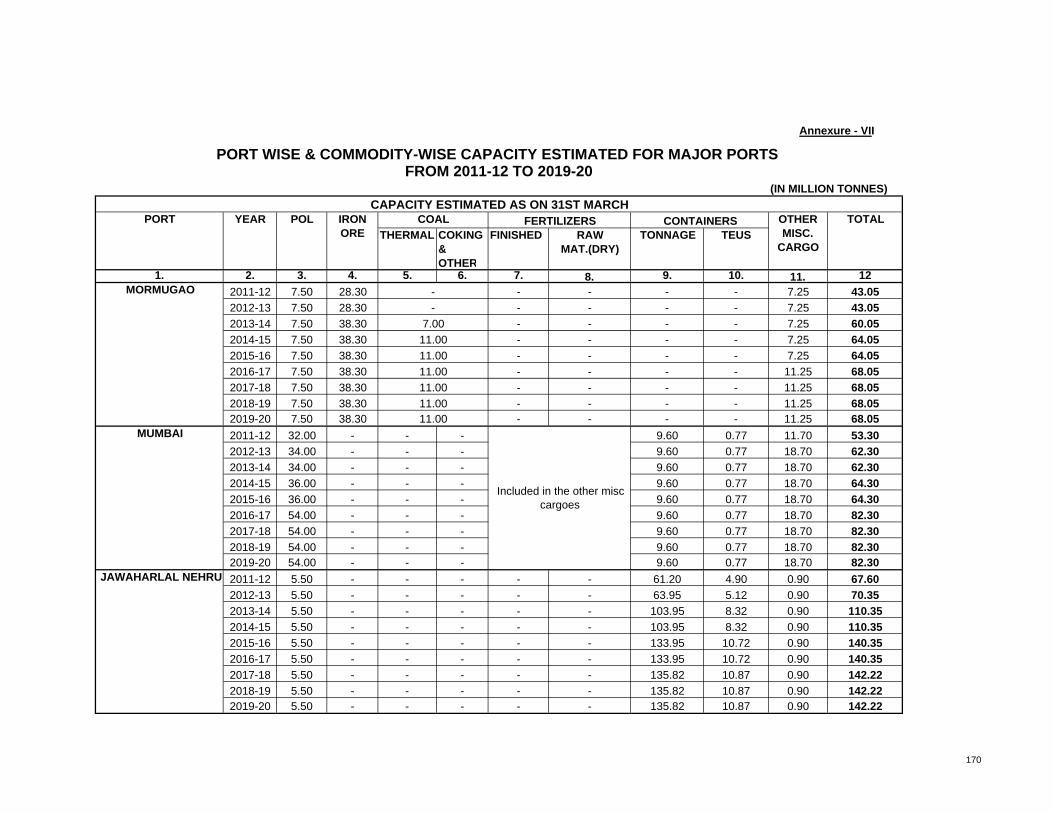
Annexure - VII
FROM 2011-12 TO 2019-20PORT WISE & COMMODITY-WISE CAPACITY ESTIMATED FOR MAJOR PORTS
(IN MILLION TONNES)
THERMAL COKING & OTHER
FINISHED RAW MAT.(DRY)
TONNAGE TEUS
1. 2. 3. 4. 5. 6. 7. 8. 9. 10. 11. 122011-12 7.50 28.30 - - - - 7.25 43.052012-13 7.50 28.30 - - - - 7.25 43.052013-14 7.50 38.30 - - - - 7.25 60.052014-15 7.50 38.30 - - - - 7.25 64.052015-16 7.50 38.30 - - - - 7.25 64.052016-17 7.50 38.30 - - - - 11.25 68.052017-18 7.50 38.30 - - - - 11.25 68.052018-19 7.50 38.30 - - - - 11.25 68.052019-20 7.50 38.30 - - - - 11.25 68.052011-12 32.00 - - - 9.60 0.77 11.70 53.302012-13 34.00 - - - 9.60 0.77 18.70 62.302013-14 34.00 - - - 9.60 0.77 18.70 62.302014-15 36.00 - - - 9.60 0.77 18.70 64.302015-16 36.00 - - - 9.60 0.77 18.70 64.302016-17 54.00 - - - 9.60 0.77 18.70 82.302017-18 54.00 - - - 9.60 0.77 18.70 82.302018-19 54.00 - - - 9.60 0.77 18.70 82.302019-20 54.00 - - - 9.60 0.77 18.70 82.302011-12 5.50 - - - - - 61.20 4.90 0.90 67.602012-13 5.50 - - - - - 63.95 5.12 0.90 70.352013-14 5.50 - - - - - 103.95 8.32 0.90 110.352014-15 5.50 - - - - - 103.95 8.32 0.90 110.352015-16 5.50 - - - - - 133.95 10.72 0.90 140.352016-17 5.50 - - - - - 133.95 10.72 0.90 140.352017-18 5.50 - - - - - 135.82 10.87 0.90 142.222018-19 5.50 - - - - - 135.82 10.87 0.90 142.222019-20 5.50 - - - - - 135.82 10.87 0.90 142.22
OTHER MISC.
CARGO
MORMUGAO
MUMBAI
JAWAHARLAL NEHRU
YEAR POL CONTAINERSIRON ORE
COALCAPACITY ESTIMATED AS ON 31ST MARCH
PORT
Included in the other misc cargoes
11.0011.0011.0011.00
-7.00
11.0011.00
-
TOTALFERTILIZERS
170
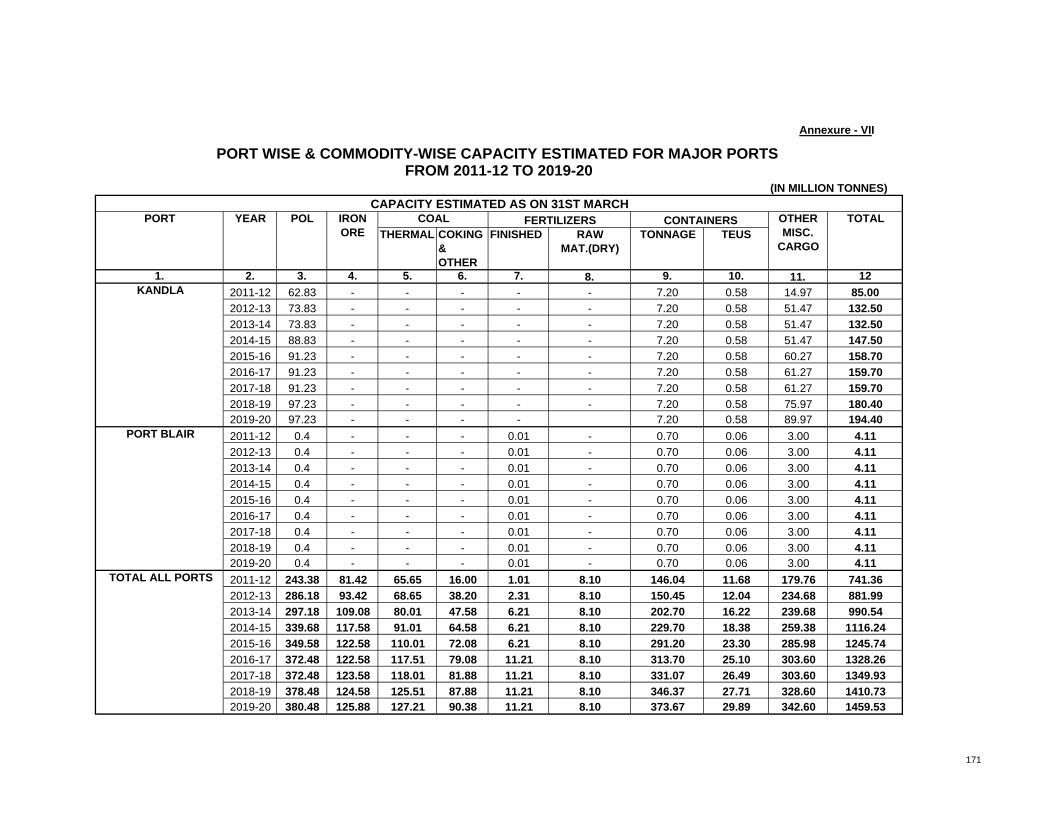
Annexure - VII
FROM 2011-12 TO 2019-20PORT WISE & COMMODITY-WISE CAPACITY ESTIMATED FOR MAJOR PORTS
(IN MILLION TONNES)
THERMAL COKING & OTHER
FINISHED RAW MAT.(DRY)
TONNAGE TEUS
1. 2. 3. 4. 5. 6. 7. 8. 9. 10. 11. 122011-12 62.83 - - - - - 7.20 0.58 14.97 85.002012-13 73.83 - - - - - 7.20 0.58 51.47 132.502013-14 73.83 - - - - - 7.20 0.58 51.47 132.502014-15 88.83 - - - - - 7.20 0.58 51.47 147.502015-16 91.23 - - - - - 7.20 0.58 60.27 158.702016-17 91.23 - - - - - 7.20 0.58 61.27 159.702017-18 91.23 - - - - - 7.20 0.58 61.27 159.702018-19 97.23 - - - - - 7.20 0.58 75.97 180.402019-20 97.23 - - - - 7.20 0.58 89.97 194.402011-12 0.4 - - - 0.01 - 0.70 0.06 3.00 4.112012-13 0.4 - - - 0.01 - 0.70 0.06 3.00 4.112013-14 0.4 - - - 0.01 - 0.70 0.06 3.00 4.112014-15 0.4 - - - 0.01 - 0.70 0.06 3.00 4.112015-16 0.4 - - - 0.01 - 0.70 0.06 3.00 4.112016-17 0.4 - - - 0.01 - 0.70 0.06 3.00 4.112017-18 0.4 - - - 0.01 - 0.70 0.06 3.00 4.112018-19 0.4 - - - 0.01 - 0.70 0.06 3.00 4.112019-20 0.4 - - - 0.01 - 0.70 0.06 3.00 4.112011-12 243.38 81.42 65.65 16.00 1.01 8.10 146.04 11.68 179.76 741.362012-13 286.18 93.42 68.65 38.20 2.31 8.10 150.45 12.04 234.68 881.992013-14 297.18 109.08 80.01 47.58 6.21 8.10 202.70 16.22 239.68 990.542014-15 339.68 117.58 91.01 64.58 6.21 8.10 229.70 18.38 259.38 1116.242015-16 349.58 122.58 110.01 72.08 6.21 8.10 291.20 23.30 285.98 1245.742016-17 372.48 122.58 117.51 79.08 11.21 8.10 313.70 25.10 303.60 1328.262017-18 372.48 123.58 118.01 81.88 11.21 8.10 331.07 26.49 303.60 1349.932018-19 378.48 124.58 125.51 87.88 11.21 8.10 346.37 27.71 328.60 1410.732019-20 380.48 125.88 127.21 90.38 11.21 8.10 373.67 29.89 342.60 1459.53
CONTAINERSCAPACITY ESTIMATED AS ON 31ST MARCH
PORT YEAR POL IRON ORE
COAL OTHER MISC.
CARGO
TOTALFERTILIZERS
KANDLA
PORT BLAIR
TOTAL ALL PORTS
171
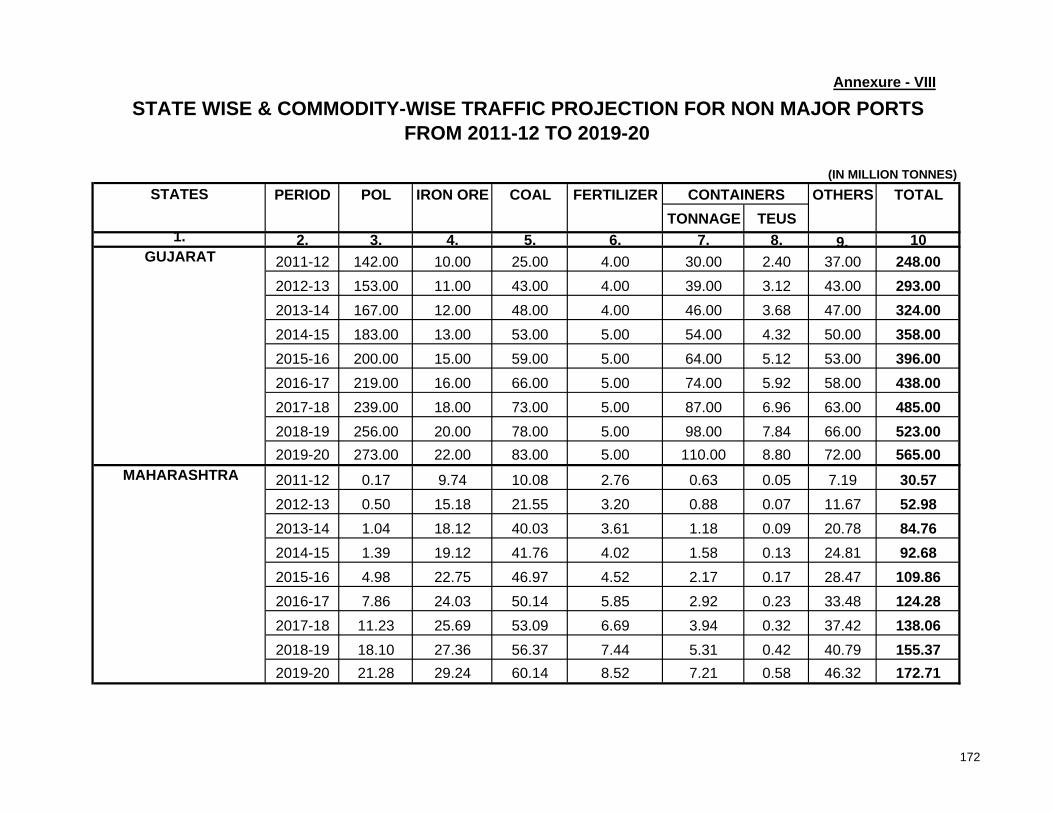
STATES PERIOD POL IRON ORE COAL FERTILIZER OTHERS TOTALTONNAGE TEUS
1. 2. 3. 4. 5. 6. 7. 8. 9. 102011-12 142.00 10.00 25.00 4.00 30.00 2.40 37.00 248.002012-13 153.00 11.00 43.00 4.00 39.00 3.12 43.00 293.002013-14 167.00 12.00 48.00 4.00 46.00 3.68 47.00 324.002014-15 183.00 13.00 53.00 5.00 54.00 4.32 50.00 358.002015-16 200.00 15.00 59.00 5.00 64.00 5.12 53.00 396.002016-17 219.00 16.00 66.00 5.00 74.00 5.92 58.00 438.002017-18 239.00 18.00 73.00 5.00 87.00 6.96 63.00 485.002018-19 256.00 20.00 78.00 5.00 98.00 7.84 66.00 523.002019-20 273.00 22.00 83.00 5.00 110.00 8.80 72.00 565.002011-12 0.17 9.74 10.08 2.76 0.63 0.05 7.19 30.572012-13 0.50 15.18 21.55 3.20 0.88 0.07 11.67 52.982013-14 1.04 18.12 40.03 3.61 1.18 0.09 20.78 84.762014-15 1.39 19.12 41.76 4.02 1.58 0.13 24.81 92.682015-16 4.98 22.75 46.97 4.52 2.17 0.17 28.47 109.862016-17 7.86 24.03 50.14 5.85 2.92 0.23 33.48 124.282017-18 11.23 25.69 53.09 6.69 3.94 0.32 37.42 138.062018-19 18.10 27.36 56.37 7.44 5.31 0.42 40.79 155.372019-20 21.28 29.24 60.14 8.52 7.21 0.58 46.32 172.71
GUJARAT
(IN MILLION TONNES)CONTAINERS
FROM 2011-12 TO 2019-20
MAHARASHTRA
Annexure - VIII
STATE WISE & COMMODITY-WISE TRAFFIC PROJECTION FOR NON MAJOR PORTS
172
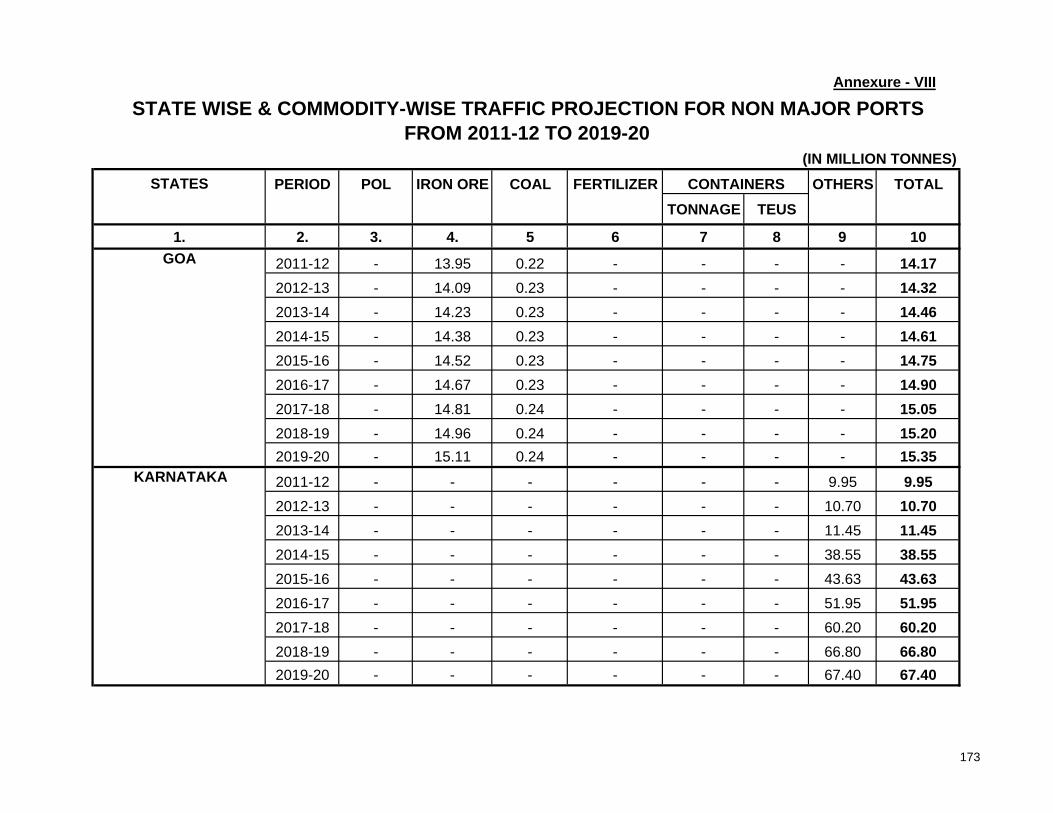
FROM 2011-12 TO 2019-20
Annexure - VIII
STATE WISE & COMMODITY-WISE TRAFFIC PROJECTION FOR NON MAJOR PORTS
STATES PERIOD POL IRON ORE COAL FERTILIZER OTHERS TOTALTONNAGE TEUS
1. 2. 3. 4. 5 6 7 8 9 10
2011-12 - 13.95 0.22 - - - - 14.172012-13 - 14.09 0.23 - - - - 14.322013-14 - 14.23 0.23 - - - - 14.462014-15 - 14.38 0.23 - - - - 14.612015-16 - 14.52 0.23 - - - - 14.752016-17 - 14.67 0.23 - - - - 14.902017-18 - 14.81 0.24 - - - - 15.052018-19 - 14.96 0.24 - - - - 15.202019-20 - 15.11 0.24 - - - - 15.352011-12 - - - - - - 9.95 9.952012-13 - - - - - - 10.70 10.702013-14 - - - - - - 11.45 11.452014-15 - - - - - - 38.55 38.552015-16 - - - - - - 43.63 43.632016-17 - - - - - - 51.95 51.952017-18 - - - - - - 60.20 60.202018-19 - - - - - - 66.80 66.802019-20 - - - - - - 67.40 67.40
KARNATAKA
GOA
(IN MILLION TONNES)CONTAINERS
173

FROM 2011-12 TO 2019-20
Annexure - VIII
STATE WISE & COMMODITY-WISE TRAFFIC PROJECTION FOR NON MAJOR PORTS
STATES PERIOD POL IRON ORE COAL FERTILIZER OTHERS TOTAL
TONNAGE TEUS1. 2. 3. 4. 5 6 7 8 9 10
2011-12 0.50 16.18 34.11 4.65 0.15 0.01 8.26 63.852012-13 0.50 16.95 45.21 5.27 0.40 0.03 10.37 78.702013-14 1.22 20.24 56.81 5.50 5.40 0.43 13.74 102.912014-15 1.32 20.57 61.43 6.13 18.13 1.45 16.93 124.512015-16 1.39 20.92 64.88 6.46 30.45 2.44 20.06 144.162016-17 1.51 21.32 69.18 7.29 41.50 3.32 21.21 162.012017-18 1.62 21.25 73.03 7.34 50.75 4.06 24.35 178.342018-19 1.93 21.72 79.47 7.78 57.60 4.61 24.22 192.722019-20 1.94 22.25 82.79 8.63 61.70 4.94 24.73 202.042011-12 1.50 0.20 0.80 0.05 0.35 0.03 0.20 3.102012-13 3.00 0.30 1.40 0.05 0.40 0.03 0.25 5.402013-14 6.00 0.40 16.00 0.20 0.60 0.05 1.00 24.202014-15 6.50 0.90 18.50 1.00 0.80 0.06 2.00 29.702015-16 7.00 1.30 20.00 1.20 1.00 0.08 2.50 33.002016-17 7.50 1.40 21.00 1.20 1.10 0.09 3.00 35.202017-18 8.00 1.40 23.00 1.60 1.30 0.10 3.00 38.302018-19 9.00 1.70 23.50 1.60 1.50 0.12 3.50 40.802019-20 10.00 1.80 26.00 2.00 1.60 0.13 4.00 45.40
TAMIL NADU
ANDHRA PRADESH
(IN MILLION TONNES)CONTAINERS
174
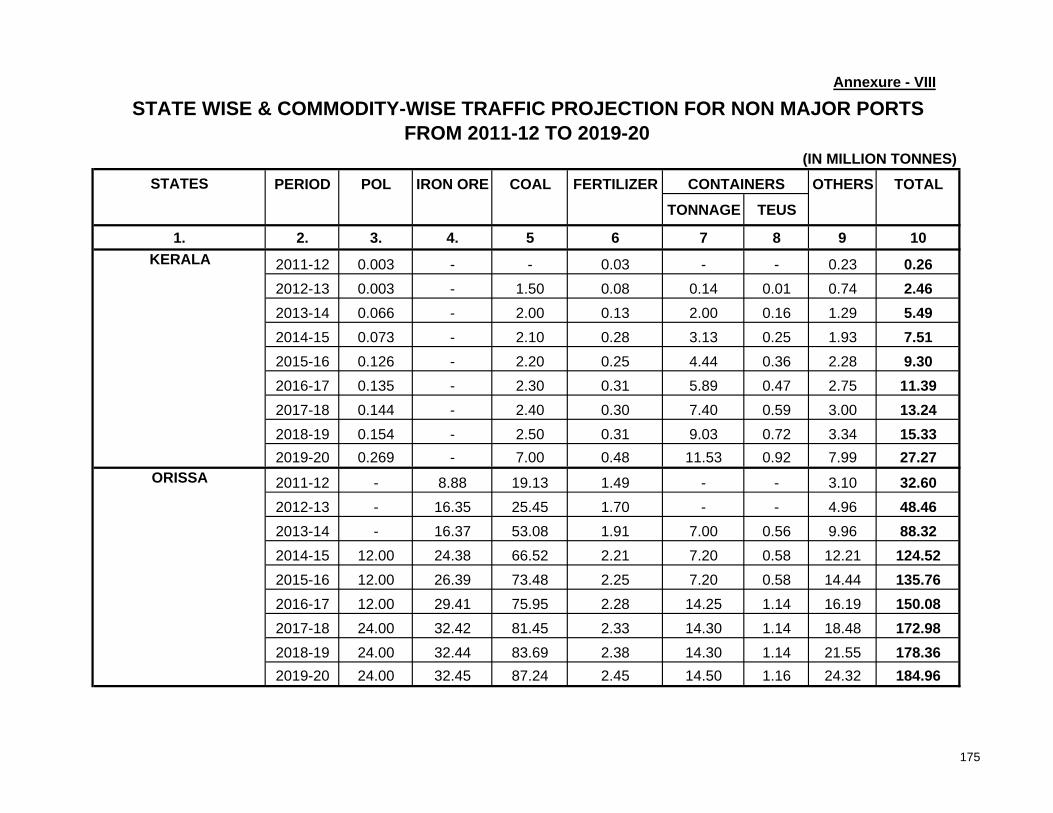
FROM 2011-12 TO 2019-20
Annexure - VIII
STATE WISE & COMMODITY-WISE TRAFFIC PROJECTION FOR NON MAJOR PORTS
STATES PERIOD POL IRON ORE COAL FERTILIZER OTHERS TOTAL
TONNAGE TEUS
1. 2. 3. 4. 5 6 7 8 9 10
2011-12 0.003 - - 0.03 - - 0.23 0.262012-13 0.003 - 1.50 0.08 0.14 0.01 0.74 2.462013-14 0.066 - 2.00 0.13 2.00 0.16 1.29 5.492014-15 0.073 - 2.10 0.28 3.13 0.25 1.93 7.512015-16 0.126 - 2.20 0.25 4.44 0.36 2.28 9.302016-17 0.135 - 2.30 0.31 5.89 0.47 2.75 11.392017-18 0.144 - 2.40 0.30 7.40 0.59 3.00 13.242018-19 0.154 - 2.50 0.31 9.03 0.72 3.34 15.332019-20 0.269 - 7.00 0.48 11.53 0.92 7.99 27.272011-12 - 8.88 19.13 1.49 - - 3.10 32.602012-13 - 16.35 25.45 1.70 - - 4.96 48.462013-14 - 16.37 53.08 1.91 7.00 0.56 9.96 88.322014-15 12.00 24.38 66.52 2.21 7.20 0.58 12.21 124.522015-16 12.00 26.39 73.48 2.25 7.20 0.58 14.44 135.762016-17 12.00 29.41 75.95 2.28 14.25 1.14 16.19 150.082017-18 24.00 32.42 81.45 2.33 14.30 1.14 18.48 172.982018-19 24.00 32.44 83.69 2.38 14.30 1.14 21.55 178.362019-20 24.00 32.45 87.24 2.45 14.50 1.16 24.32 184.96
KERALA
CONTAINERS(IN MILLION TONNES)
ORISSA
175

FROM 2011-12 TO 2019-20
Annexure - VIII
STATE WISE & COMMODITY-WISE TRAFFIC PROJECTION FOR NON MAJOR PORTS
STATES PERIOD POL IRON ORE COAL FERTILIZER OTHERS TOTAL
TONNAGE TEUS
2011-12 144.17 58.95 89.34 12.98 31.13 2.49 65.93 402.502012-13 157.00 73.87 138.34 14.30 40.82 3.27 81.69 506.022013-14 175.33 81.36 216.15 15.35 62.18 4.97 105.22 655.592014-15 204.28 92.35 243.54 18.64 84.84 6.79 146.43 790.082015-16 225.50 100.88 266.76 19.68 109.26 8.74 164.38 886.462016-17 248.01 106.83 284.80 21.93 139.66 11.17 186.58 987.812017-18 283.99 113.57 306.21 23.26 164.69 13.18 209.45 1101.172018-19 309.18 118.18 323.77 24.51 185.74 14.86 226.20 1187.582019-20 330.49 122.85 346.41 27.08 206.54 16.52 246.76 1280.13
TOTAL
CONTAINERS(IN MILLION TONNES)
176
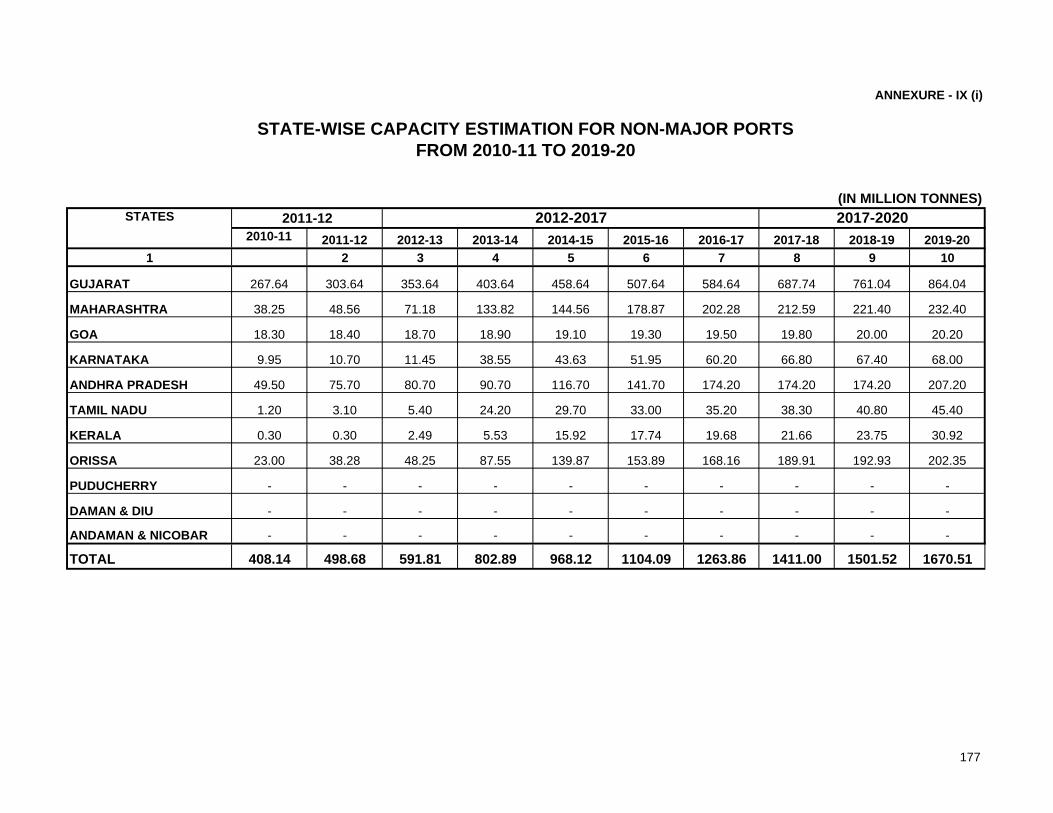
2010-11 2011-12 2012-13 2013-14 2014-15 2015-16 2016-17 2017-18 2018-19 2019-201 2 3 4 5 6 7 8 9 10
GUJARAT 267.64 303.64 353.64 403.64 458.64 507.64 584.64 687.74 761.04 864.04
MAHARASHTRA 38.25 48.56 71.18 133.82 144.56 178.87 202.28 212.59 221.40 232.40
GOA 18.30 18.40 18.70 18.90 19.10 19.30 19.50 19.80 20.00 20.20
KARNATAKA 9.95 10.70 11.45 38.55 43.63 51.95 60.20 66.80 67.40 68.00
ANDHRA PRADESH 49.50 75.70 80.70 90.70 116.70 141.70 174.20 174.20 174.20 207.20
TAMIL NADU 1.20 3.10 5.40 24.20 29.70 33.00 35.20 38.30 40.80 45.40
KERALA 0.30 0.30 2.49 5.53 15.92 17.74 19.68 21.66 23.75 30.92
ORISSA 23.00 38.28 48.25 87.55 139.87 153.89 168.16 189.91 192.93 202.35
PUDUCHERRY - - - - - - - - - -
DAMAN & DIU - - - - - - - - - -
ANDAMAN & NICOBAR - - - - - - - - - -
TOTAL 408.14 498.68 591.81 802.89 968.12 1104.09 1263.86 1411.00 1501.52 1670.51
ANNEXURE - IX (i)
2011-12STATES 2012-2017 2017-2020
STATE-WISE CAPACITY ESTIMATION FOR NON-MAJOR PORTS FROM 2010-11 TO 2019-20
(IN MILLION TONNES)
177
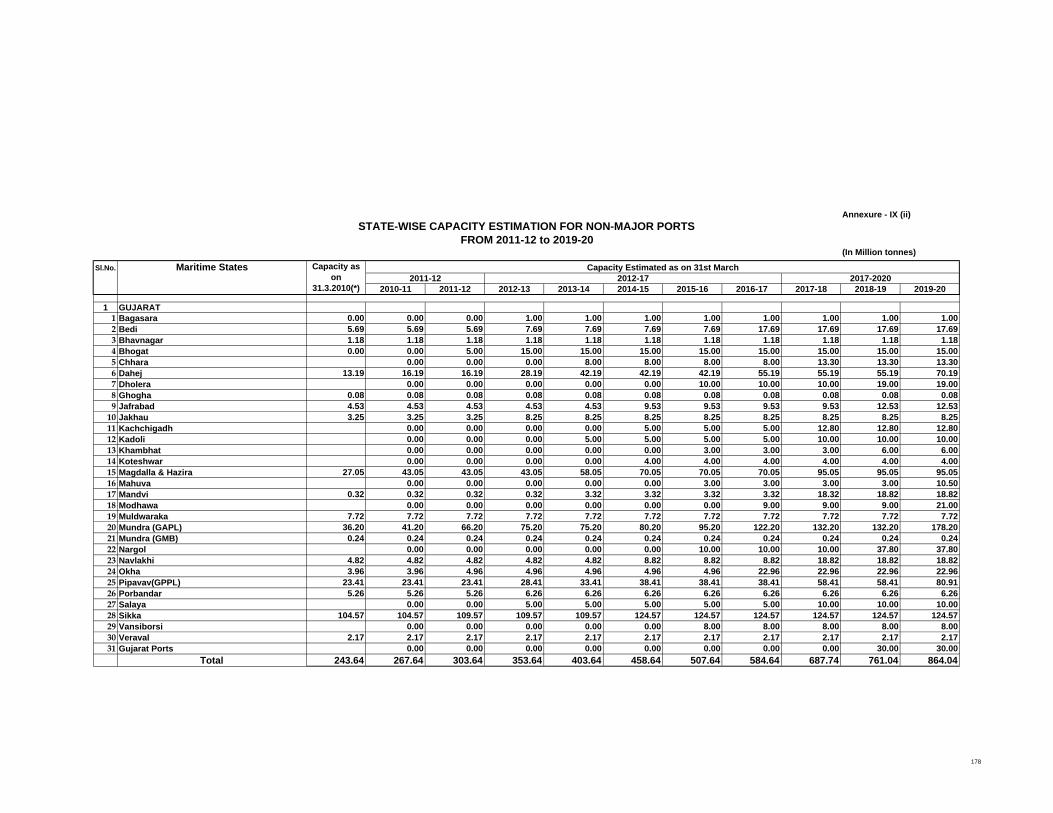
Annexure - IX (ii)
(In Million tonnes)
Sl.No. Maritime States
2010-11 2011-12 2012-13 2013-14 2014-15 2015-16 2016-17 2017-18 2018-19 2019-20
1 GUJARAT1 Bagasara 0.00 0.00 0.00 1.00 1.00 1.00 1.00 1.00 1.00 1.00 1.002 Bedi 5.69 5.69 5.69 7.69 7.69 7.69 7.69 17.69 17.69 17.69 17.693 Bhavnagar 1.18 1.18 1.18 1.18 1.18 1.18 1.18 1.18 1.18 1.18 1.184 Bhogat 0.00 0.00 5.00 15.00 15.00 15.00 15.00 15.00 15.00 15.00 15.005 Chhara 0.00 0.00 0.00 8.00 8.00 8.00 8.00 13.30 13.30 13.306 Dahej 13.19 16.19 16.19 28.19 42.19 42.19 42.19 55.19 55.19 55.19 70.197 Dholera 0.00 0.00 0.00 0.00 0.00 10.00 10.00 10.00 19.00 19.008 Ghogha 0.08 0.08 0.08 0.08 0.08 0.08 0.08 0.08 0.08 0.08 0.089 Jafrabad 4.53 4.53 4.53 4.53 4.53 9.53 9.53 9.53 9.53 12.53 12.5310 Jakhau 3.25 3.25 3.25 8.25 8.25 8.25 8.25 8.25 8.25 8.25 8.2511 Kachchigadh 0.00 0.00 0.00 0.00 5.00 5.00 5.00 12.80 12.80 12.8012 Kadoli 0.00 0.00 0.00 5.00 5.00 5.00 5.00 10.00 10.00 10.0013 Khambhat 0.00 0.00 0.00 0.00 0.00 3.00 3.00 3.00 6.00 6.0014 Koteshwar 0.00 0.00 0.00 0.00 4.00 4.00 4.00 4.00 4.00 4.0015 Magdalla & Hazira 27.05 43.05 43.05 43.05 58.05 70.05 70.05 70.05 95.05 95.05 95.0516 Mahuva 0.00 0.00 0.00 0.00 0.00 3.00 3.00 3.00 3.00 10.5017 Mandvi 0.32 0.32 0.32 0.32 3.32 3.32 3.32 3.32 18.32 18.82 18.8218 Modhawa 0.00 0.00 0.00 0.00 0.00 0.00 9.00 9.00 9.00 21.0019 Muldwaraka 7.72 7.72 7.72 7.72 7.72 7.72 7.72 7.72 7.72 7.72 7.7220 Mundra (GAPL) 36.20 41.20 66.20 75.20 75.20 80.20 95.20 122.20 132.20 132.20 178.2021 Mundra (GMB) 0.24 0.24 0.24 0.24 0.24 0.24 0.24 0.24 0.24 0.24 0.2422 Nargol 0.00 0.00 0.00 0.00 0.00 10.00 10.00 10.00 37.80 37.8023 Navlakhi 4.82 4.82 4.82 4.82 4.82 8.82 8.82 8.82 18.82 18.82 18.8224 Okha 3.96 3.96 4.96 4.96 4.96 4.96 4.96 22.96 22.96 22.96 22.9625 Pipavav(GPPL) 23.41 23.41 23.41 28.41 33.41 38.41 38.41 38.41 58.41 58.41 80.9126 Porbandar 5.26 5.26 5.26 6.26 6.26 6.26 6.26 6.26 6.26 6.26 6.2627 Salaya 0.00 0.00 5.00 5.00 5.00 5.00 5.00 10.00 10.00 10.0028 Sikka 104.57 104.57 109.57 109.57 109.57 124.57 124.57 124.57 124.57 124.57 124.5729 Vansiborsi 0.00 0.00 0.00 0.00 0.00 8.00 8.00 8.00 8.00 8.0030 Veraval 2.17 2.17 2.17 2.17 2.17 2.17 2.17 2.17 2.17 2.17 2.1731 Gujarat Ports 0.00 0.00 0.00 0.00 0.00 0.00 0.00 0.00 30.00 30.00
Total 243.64 267.64 303.64 353.64 403.64 458.64 507.64 584.64 687.74 761.04 864.04
Capacity as on
31.3.2010(*)
STATE-WISE CAPACITY ESTIMATION FOR NON-MAJOR PORTS
2011-12 2012-17 2017-2020
FROM 2011-12 to 2019-20
Capacity Estimated as on 31st March
178

Annexure - IX (ii)
(In Million tonnes)
Sl.No. Maritime States
2010-11 2011-12 2012-13 2013-14 2014-15 2015-16 2016-17 2017-18 2018-19 2019-20
Capacity as on
31.3.2010(*)
STATE-WISE CAPACITY ESTIMATION FOR NON-MAJOR PORTS
2011-12 2012-17 2017-2020
FROM 2011-12 to 2019-20
Capacity Estimated as on 31st March
2 MAHARASHTRA1 REWAS PORT 0.00 0.00 0.00 0.00 43.83 44.94 46.10 59.43 61.03 62.69 66.162 DIGHI PORT 0.00 0.36 1.29 4.37 5.92 7.08 7.73 8.97 9.33 10.49 10.063 JAIGAD PORT (JSW LTD.) 15.00 15.00 16.50 27.00 34.50 34.50 54.50 54.50 54.50 54.50 54.504 JAIGAD PORT (CHOWGULE PORT LTD.) 0.00 0.00 3.15 3.15 3.15 3.15 3.15 5.84 5.84 5.84 5.845 VIJAYDURG PORT 0.00 0.00 0.00 0.00 0.00 0.00 0.00 0.00 0.00 0.00 0.006 REDI PORT 0.00 0.00 0.00 0.00 0.13 0.26 0.39 0.75 0.99 1.23 1.467 ULWE (AMBUJA CEMENT) 1.80 2.00 2.18 2.35 2.55 2.70 2.87 3.00 3.00 3.00 3.008 RANPAR PORT (FINOLEX INDUSTRIES) 0.25 0.50 0.50 0.50 5.50 5.50 5.50 5.50 5.50 5.50 5.509 RATNAGIRI PORT 0.00 0.10 0.10 0.10 0.25 0.25 0.50 0.50 0.50 0.50 0.50
10 REVDANDA PORT (WELSPUN) 1.55 1.55 2.20 7.15 7.15 7.15 14.35 14.80 14.80 14.80 14.8011 DHARMATAR PORT(ISPAT INDUSTRIES) 9.03 12.08 14.83 18.18 21.13 23.95 27.28 29.09 33.12 36.08 40.3512 JAIGAD PORT (MARINE SYNDICATE) 0.15 0.15 0.15 0.48 0.48 0.48 0.48 0.48 0.60 0.60 0.6013 SANEGAON (INDO ENERGY INTERNATIONAL 0.50 0.85 1.00 1.25 1.58 2.00 2.43 2.95 3.55 4.35 4.8014 DHARMATAR (PNP PORT ) 0.00 5.66 6.66 6.66 7.66 12.60 13.60 16.47 19.83 21.83 24.83
Total 28.28 38.25 48.56 71.18 133.83 144.56 178.87 202.28 212.59 221.40 232.40
3 ORISSA1 GOPALPUR PORT 2.00 2.00 11.28 17.25 18.05 18.67 19.19 19.91 20.61 21.13 21.852 PORT AT ASTARANGA AREA 0.00 0.00 0.00 0.00 4.50 17.70 19.20 21.75 23.80 26.30 30.003 CHUDAMANI PORT 0.00 0.00 0.00 4.00 8.00 13.00 19.00 20.00 25.00 25.00 28.004 DHAMRA PORT 0.00 21.00 27.00 27.00 57.00 77.00 83.00 93.00 107.00 107.00 109.005 SUBARNAREKHA MUHAN PORT 13.50 13.50 13.50 13.50 13.50 13.50
Total 2.00 23.00 38.28 48.25 87.55 139.87 153.89 168.16 189.91 192.93 202.35
4 KARNATAKA1 KARWAR 3.00 3.15 3.30 3.45 3.60 3.75 6.95 10.15 11.75 11.75 11.752 BELEKERI 6.00 6.60 7.20 7.80 8.40 9.00 9.60 10.20 10.80 11.40 12.003 HALDIPUR 0.00 0.00 0.00 0.00 6.00 7.00 8.00 9.00 10.00 10.00 10.004 TADRI 0.20 0.20 0.20 0.20 20.55 23.88 27.40 30.85 34.25 34.25 34.25
Total 9.20 9.95 10.70 11.45 38.55 43.63 51.95 60.20 66.80 67.40 68.005 ANDHRA PRADESH
1 KAKINADA ANCHORAGE PORT 4.00 4.00 4.00 4.00 4.00 4.00 4.00 4.00 4.00 4.00 4.002 KAKINADA DEEP WATER PORT 12.50 12.50 14.00 14.00 14.00 18.00 18.00 22.00 22.00 22.00 25.003 GANGAVARAM PORT LTD. 10.00 15.00 15.00 15.00 20.00 25.00 30.00 35.00 35.00 35.00 40.004 MACHILIPATNAM PORT 0.00 0.00 5.00 5.00 5.00 12.00 17.00 17.00 17.00 17.00 22.005 KRISHNAPATNAM PORT 10.00 15.00 25.00 25.00 30.00 30.00 35.00 40.00 40.00 40.00 50.006 NIZAMPATNAM & VADAREVU PORTS 0.00 0.00 5.00 10.00 10.00 20.00 30.00 40.00 40.00 40.00 50.007 MEGHAVARAM 0.00 4.70 4.70 4.70 4.70 4.70 13.20 13.20 13.20 13.208 RAWA 3.00 3.00 3.00 3.00 3.00 3.00 3.00 3.00 3.00 3.00 3.00
Total 39.50 49.50 75.70 80.70 90.70 116.70 141.70 174.20 174.20 174.20 207.20
179
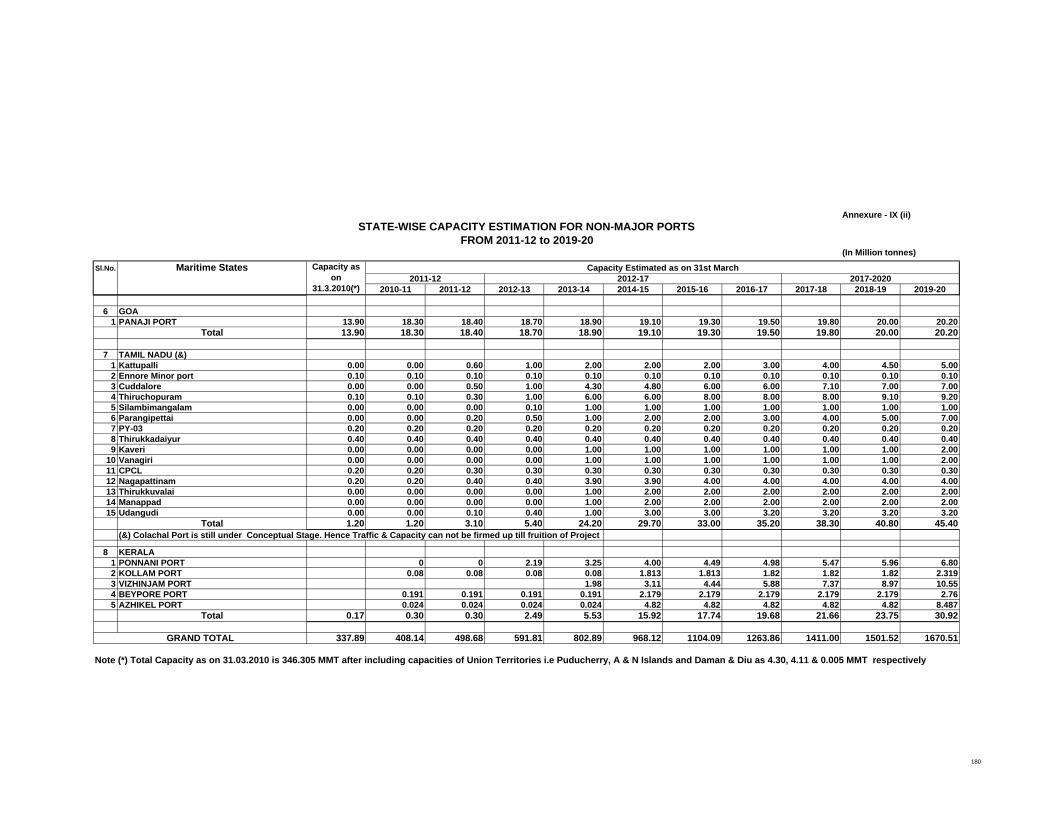
Annexure - IX (ii)
(In Million tonnes)
Sl.No. Maritime States
2010-11 2011-12 2012-13 2013-14 2014-15 2015-16 2016-17 2017-18 2018-19 2019-20
Capacity as on
31.3.2010(*)
STATE-WISE CAPACITY ESTIMATION FOR NON-MAJOR PORTS
2011-12 2012-17 2017-2020
FROM 2011-12 to 2019-20
Capacity Estimated as on 31st March
6 GOA1 PANAJI PORT 13.90 18.30 18.40 18.70 18.90 19.10 19.30 19.50 19.80 20.00 20.20
Total 13.90 18.30 18.40 18.70 18.90 19.10 19.30 19.50 19.80 20.00 20.20
7 TAMIL NADU (&)1 Kattupalli 0.00 0.00 0.60 1.00 2.00 2.00 2.00 3.00 4.00 4.50 5.002 Ennore Minor port 0.10 0.10 0.10 0.10 0.10 0.10 0.10 0.10 0.10 0.10 0.103 Cuddalore 0.00 0.00 0.50 1.00 4.30 4.80 6.00 6.00 7.10 7.00 7.004 Thiruchopuram 0.10 0.10 0.30 1.00 6.00 6.00 8.00 8.00 8.00 9.10 9.205 Silambimangalam 0.00 0.00 0.00 0.10 1.00 1.00 1.00 1.00 1.00 1.00 1.006 Parangipettai 0.00 0.00 0.20 0.50 1.00 2.00 2.00 3.00 4.00 5.00 7.007 PY-03 0.20 0.20 0.20 0.20 0.20 0.20 0.20 0.20 0.20 0.20 0.208 Thirukkadaiyur 0.40 0.40 0.40 0.40 0.40 0.40 0.40 0.40 0.40 0.40 0.409 Kaveri 0.00 0.00 0.00 0.00 1.00 1.00 1.00 1.00 1.00 1.00 2.00
10 Vanagiri 0.00 0.00 0.00 0.00 1.00 1.00 1.00 1.00 1.00 1.00 2.0011 CPCL 0.20 0.20 0.30 0.30 0.30 0.30 0.30 0.30 0.30 0.30 0.3012 Nagapattinam 0.20 0.20 0.40 0.40 3.90 3.90 4.00 4.00 4.00 4.00 4.0013 Thirukkuvalai 0.00 0.00 0.00 0.00 1.00 2.00 2.00 2.00 2.00 2.00 2.0014 Manappad 0.00 0.00 0.00 0.00 1.00 2.00 2.00 2.00 2.00 2.00 2.0015 Udangudi 0.00 0.00 0.10 0.40 1.00 3.00 3.00 3.20 3.20 3.20 3.20
Total 1.20 1.20 3.10 5.40 24.20 29.70 33.00 35.20 38.30 40.80 45.40(&) Colachal Port is still under Conceptual Stage. Hence Traffic & Capacity can not be firmed up till fruition of Project
8 KERALA1 PONNANI PORT 0 0 2.19 3.25 4.00 4.49 4.98 5.47 5.96 6.802 KOLLAM PORT 0.08 0.08 0.08 0.08 1.813 1.813 1.82 1.82 1.82 2.3193 VIZHINJAM PORT 1.98 3.11 4.44 5.88 7.37 8.97 10.554 BEYPORE PORT 0.191 0.191 0.191 0.191 2.179 2.179 2.179 2.179 2.179 2.765 AZHIKEL PORT 0.024 0.024 0.024 0.024 4.82 4.82 4.82 4.82 4.82 8.487
Total 0.17 0.30 0.30 2.49 5.53 15.92 17.74 19.68 21.66 23.75 30.92
337.89 408.14 498.68 591.81 802.89 968.12 1104.09 1263.86 1411.00 1501.52 1670.51
Note (*) Total Capacity as on 31.03.2010 is 346.305 MMT after including capacities of Union Territories i.e Puducherry, A & N Islands and Daman & Diu as 4.30, 4.11 & 0.005 MMT respectively
GRAND TOTAL
180
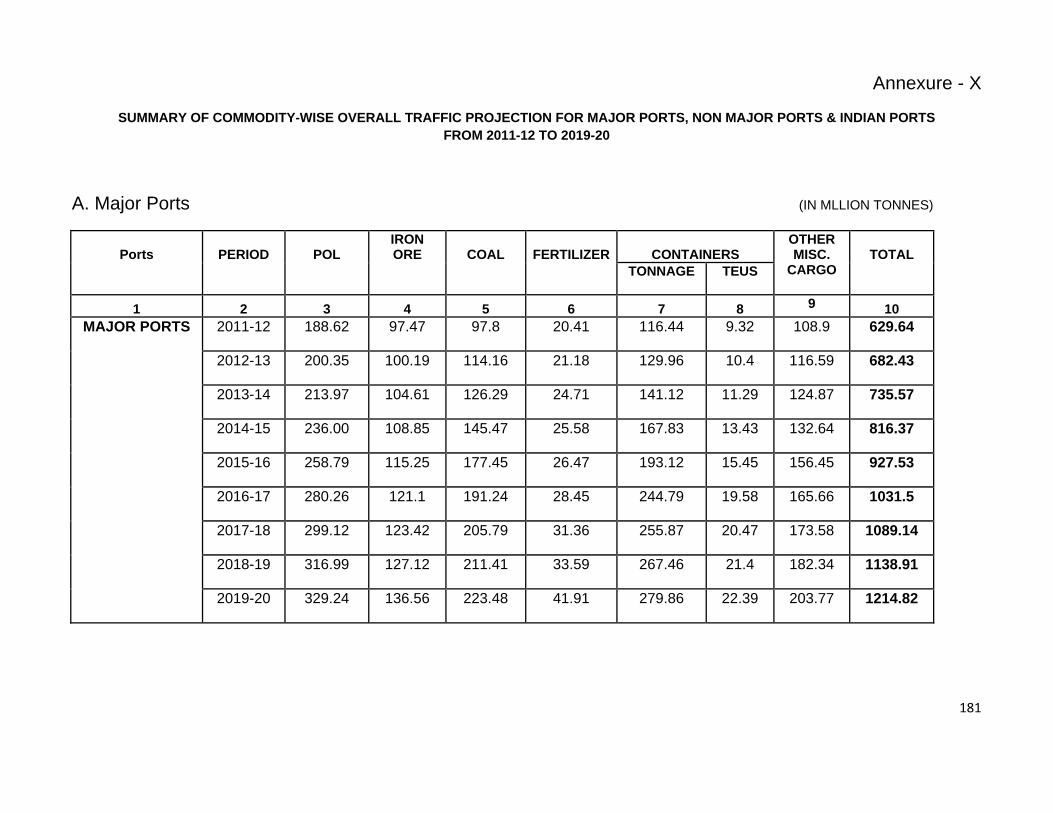
181
Annexure - X
SUMMARY OF COMMODITY-WISE OVERALL TRAFFIC PROJECTION FOR MAJOR PORTS, NON MAJOR PORTS & INDIAN PORTS FROM 2011-12 TO 2019-20
A. Major Ports (IN MLLION TONNES)
Ports PERIOD POL IRON ORE COAL FERTILIZER CONTAINERS
OTHER MISC.
CARGO TOTAL
TONNAGE TEUS
1 2 3 4 5 6 7 8 9 10
MAJOR PORTS 2011-12 188.62 97.47 97.8 20.41 116.44 9.32 108.9 629.64
2012-13 200.35 100.19 114.16 21.18 129.96 10.4 116.59 682.43
2013-14 213.97 104.61 126.29 24.71 141.12 11.29 124.87 735.57
2014-15 236.00 108.85 145.47 25.58 167.83 13.43 132.64 816.37
2015-16 258.79 115.25 177.45 26.47 193.12 15.45 156.45 927.53
2016-17 280.26 121.1 191.24 28.45 244.79 19.58 165.66 1031.5
2017-18 299.12 123.42 205.79 31.36 255.87 20.47 173.58 1089.14
2018-19 316.99 127.12 211.41 33.59 267.46 21.4 182.34 1138.91
2019-20 329.24 136.56 223.48 41.91 279.86 22.39 203.77 1214.82
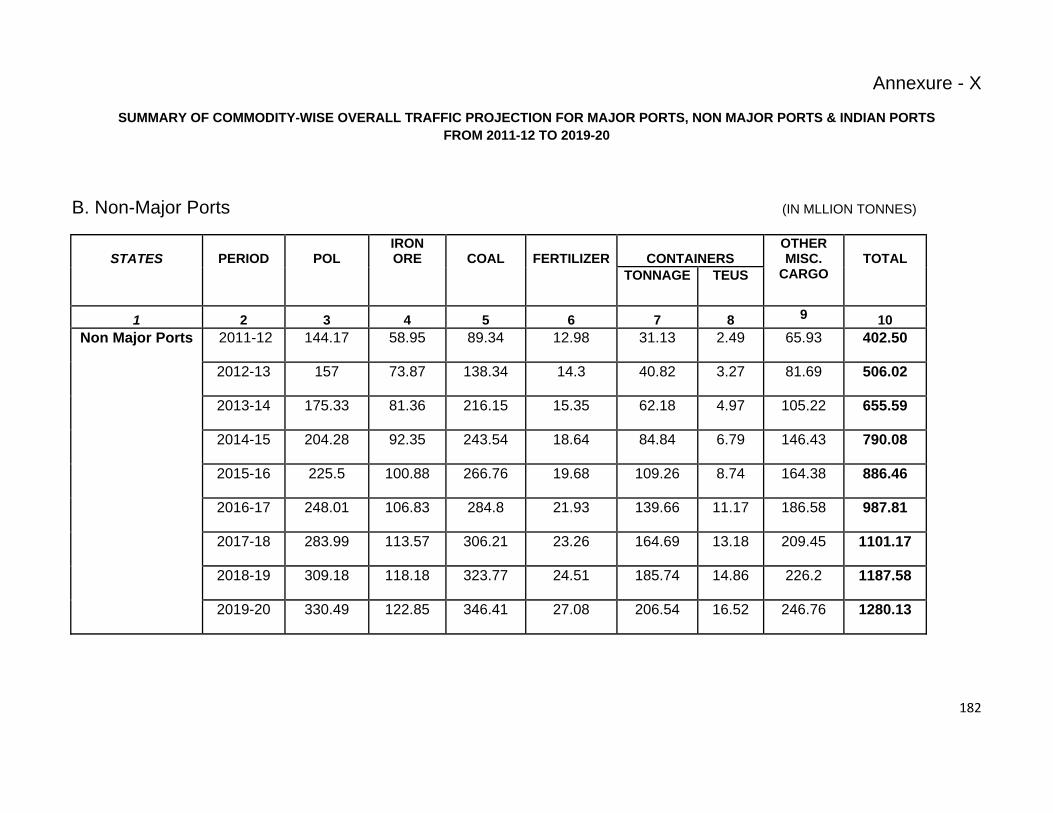
182
Annexure - X
SUMMARY OF COMMODITY-WISE OVERALL TRAFFIC PROJECTION FOR MAJOR PORTS, NON MAJOR PORTS & INDIAN PORTS FROM 2011-12 TO 2019-20
B. Non-Major Ports (IN MLLION TONNES)
STATES PERIOD POL IRON ORE COAL FERTILIZER CONTAINERS
OTHER MISC.
CARGO TOTAL
TONNAGE TEUS
1 2 3 4 5 6 7 8 9 10
Non Major Ports 2011-12 144.17 58.95 89.34 12.98 31.13 2.49 65.93 402.50
2012-13 157 73.87 138.34 14.3 40.82 3.27 81.69 506.02
2013-14 175.33 81.36 216.15 15.35 62.18 4.97 105.22 655.59
2014-15 204.28 92.35 243.54 18.64 84.84 6.79 146.43 790.08
2015-16 225.5 100.88 266.76 19.68 109.26 8.74 164.38 886.46
2016-17 248.01 106.83 284.8 21.93 139.66 11.17 186.58 987.81
2017-18 283.99 113.57 306.21 23.26 164.69 13.18 209.45 1101.17
2018-19 309.18 118.18 323.77 24.51 185.74 14.86 226.2 1187.58
2019-20 330.49 122.85 346.41 27.08 206.54 16.52 246.76 1280.13

183
Annexure - X
SUMMARY OF COMMODITY-WISE OVERALL TRAFFIC PROJECTION FOR MAJOR PORTS, NON MAJOR PORTS & INDIAN PORTS FROM 2011-12 TO 2019-20
C. All Indian Ports (IN MLLION TONNES)
PORTS/STATES PERIOD POL IRON ORE COAL FERTILIZER CONTAINERS
OTHER MISC.
CARGO TOTAL
TONNAGE TEUS
1 2 3 4 5 6 7 8 9 10
All Indian Ports (Major Ports &
State Ports
2011-12 332.79 156.42 187.14 33.39 147.57 11.81 174.83 1032.14
2012-13 357.35 174.06 252.5 35.48 170.78 13.67 198.28 1188.45
2013-14 389.3 185.97 342.44 40.06 203.3 16.26 230.09 1391.16
2014-15 440.28 201.2 389.01 44.22 252.67 20.22 279.07 1606.45
2015-16 484.29 216.13 444.21 46.15 302.38 24.19 320.83 1813.99
2016-17 528.27 227.93 476.04 50.38 384.45 30.75 352.24 2019.31
2017-18 583.11 236.99 512 54.62 420.56 33.65 383.03 2190.31
2018-19 626.17 245.3 535.18 58.1 453.2 36.26 408.54 2326.49
2019-20 659.73 259.41 569.89 68.99 486.4 38.91 450.53 2494.95
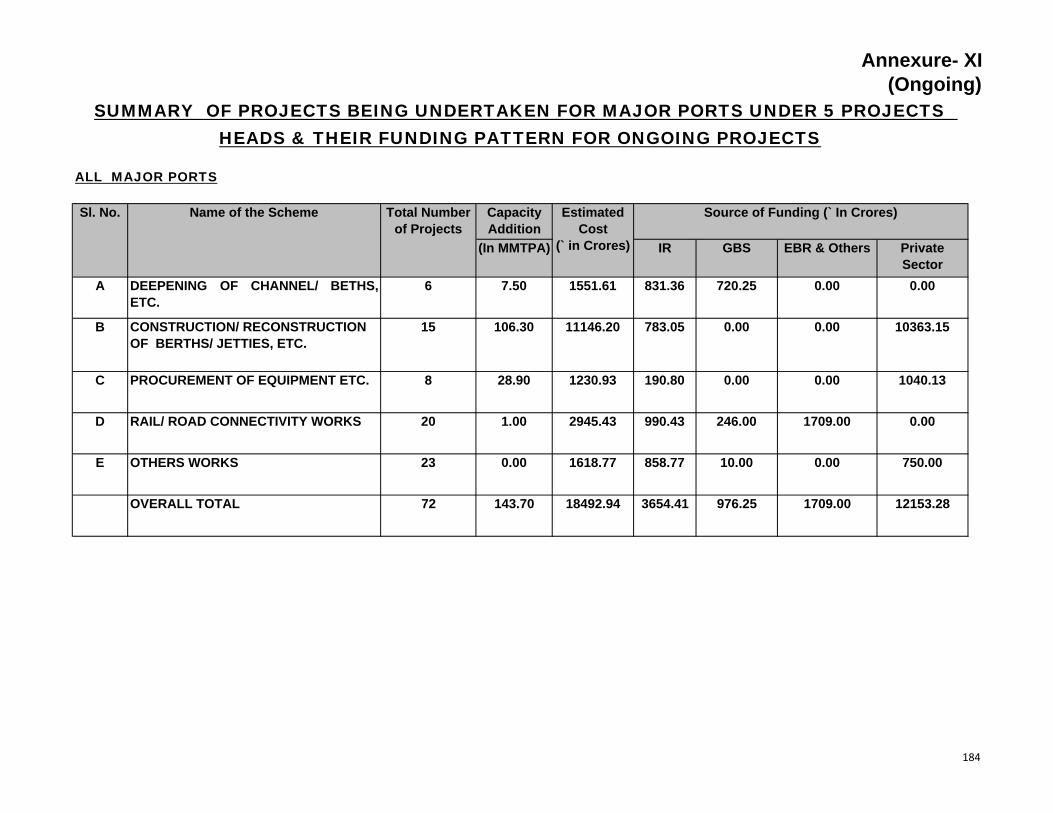
Annexure- XI(Ongoing)
ALL MAJOR PORTS
Capacity Addition
(In MMTPA) IR GBS EBR & Others Private Sector
A 6 7.50 1551.61 831.36 720.25 0.00 0.00
B 15 106.30 11146.20 783.05 0.00 0.00 10363.15
C 8 28.90 1230.93 190.80 0.00 0.00 1040.13
D 20 1.00 2945.43 990.43 246.00 1709.00 0.00
E 23 0.00 1618.77 858.77 10.00 0.00 750.00
72 143.70 18492.94 3654.41 976.25 1709.00 12153.28OVERALL TOTAL
DEEPENING OF CHANNEL/ BETHS,ETC.
Estimated Cost
(` in Crores)
CONSTRUCTION/ RECONSTRUCTION OF BERTHS/ JETTIES, ETC.
PROCUREMENT OF EQUIPMENT ETC.
RAIL/ ROAD CONNECTIVITY WORKS
SUMMARY OF PROJECTS BEING UNDERTAKEN FOR MAJOR PORTS UNDER 5 PROJECTS HEADS & THEIR FUNDING PATTERN FOR ONGOING PROJECTS
Sl. No. Name of the Scheme Total Number of Projects
Source of Funding (` In Crores)
OTHERS WORKS
184

IEBR & BS Private Total IEBR & BS Private Total IEBR & BS Private Total IEBR & BS Private Total
1 2 3 4 5 6 7 8 9 10 11 12 13 14 15 16 17 18 19 20 21 22
TOTAL 7 12.27 1064.9 760.00 1824.90 15 113.00 679.37 8011.10 8690.47 3 0.00 45.00 215.00 260.00 25 125.27 1789.27 8986.10 10775.37
IEBR & BS Private Total IEBR & BS Private Total IEBR & BS Private Total IEBR & BS Private Total
1 2 3 4 5 6 7 8 9 10 11 12 13 14 15 16 17 18 19 20 21 22
TOTAL 11 46.00 1870.31 379.11 2249.42 6 15.00 1410.60 570.00 1980.60 4 0.00 376.10 0.00 376.10 21 61.00 3657.01 949.11 4606.12
ANNEXURE-XIPort Wise Summary of Number of Projects to be undertaken for Major Ports Under 5 Project Heads & Their Funding Pattern in Phase I, II & III
FROM 2010-11 TO 2019-20
Name of the Port: Kolkata
No. of Projects
Capacity (In MTPA)
Source of Financing (In Crores) No. of Projects
Capacity (In
MTPA)
Source of Financing (In Crores)
1000.00 0.00 1000.00A DEEPENING OF CHANNEL/BERTHS ETC 1 0.00
Sl. No. Category
PHASE-I
329.11
0 0.00 0.00 0.00 0.00 0 0.00 0.00 0.00 0.00 1 0.00 1000.00 0.00 1000.00
BCONSTRUCTION/ RECONSTRUCTION OF BERTHS/JETTIES ETC.
4 11.27 41.90 760.00 801.90 6 109.50 350.00 6533.00 6883.00 0 0.00 0.00 0.00 0.00 10 120.77 391.90 7293.00 7684.90
C PROCUREMENT OF EQUIPMENTS ETC 2 1.00 23.00 0.00 23.00 4 3.00 264.37 364.10 628.47 0 0.00 0.00 0.00 0.00 6 4.00 287.37 364.10 651.47
D RAIL/ROAD CONNECTIVITY WORKS 0 0.00 0.00 0.00 0.00 3 0.00 25.00 1050.00 1075.00 0 0.00 0.00 0.00 0.00 3 0.00 25.00 1050.00 1075.00
E OTHER WORKS 0 0.00 0.00 0.00 0.00 0.00 45.002 0.50 40.00 64.00 85.00 279.00 364.00
Name of the Port: Paradip
215.00 260.00 5 0.50104.00 3
PHASE-II PHASE-III TOTAL
No. of Projects
Capacity (In MTPA)
Source of Financing (In Crores) No. of Projects
Capacity (In MTPA)
Source of Financing (In Crores) No. of Projects
Capacity (In MTPA)
Source of Financing (In Crores) No. of Projects
Capacity (In
MTPA)
Source of Financing (In Crores)
PHASE-III TOTAL
No. of Projects
Capacity (In MTPA)
Source of Financing (In Crores)
0.00 260.00 0.00
Sl. No. Category
PHASE-I PHASE-II
No. of Projects
Capacity (In MTPA)
Source of Financing (In Crores)
260.00 0 0.00 0.00 0.00 0.00 2 5.00 300.00 0.00 300.00
BCONSTRUCTION/ RECONSTRUCTION OF BERTHS/JETTIES ETC.
4 37.00 1747.62 2076.73 2 15.00 1060.00 470.00 1530.00 1 0.00 0.00 0.00 0.00 7 52.00 2807.62 799.11 3606.73
C PROCUREMENT OF EQUIPMENTS ETC 3 4.00 20.68 50.00 70.68 1 0.00 50.60 0.00 50.60 2 0.00 368.10 0.00 368.10 6 4.00 439.38 50.00 489.38
D RAIL/ROAD CONNECTIVITY WORKS 0 0.00 0.00 0.00 0.00 0.00 0.000 0.00 0.00 0.00 0.00 0.00 0.00
62.01
0.00 0.00 0 0.000.00 0
2 0.00 40.00 100.00 140.00 1 0.00 8.00 0.00 8.00 6 0.00 110.01 100.00 210.01E OTHER WORKS 3 0.00 62.01 0.00
A DEEPENING OF CHANNEL/BERTHS ETC 1 5.00 40.00 0.00 40.00 1
185
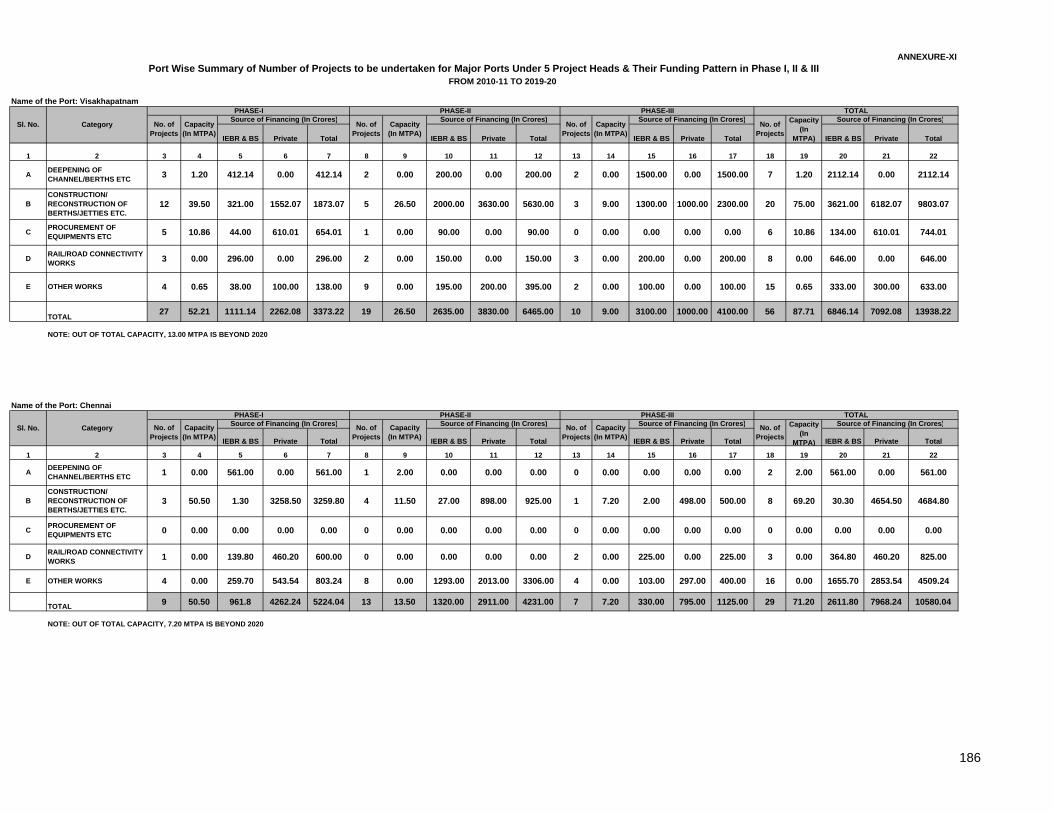
ANNEXURE-XIPort Wise Summary of Number of Projects to be undertaken for Major Ports Under 5 Project Heads & Their Funding Pattern in Phase I, II & III
FROM 2010-11 TO 2019-20
IEBR & BS Private Total IEBR & BS Private Total IEBR & BS Private Total IEBR & BS Private Total
1 2 3 4 5 6 7 8 9 10 11 12 13 14 15 16 17 18 19 20 21 22
TOTAL 27 52.21 1111.14 2262.08 3373.22 19 26.50 2635.00 3830.00 6465.00 10 9.00 3100.00 1000.00 4100.00 56 87.71 6846.14 7092.08 13938.22
NOTE: OUT OF TOTAL CAPACITY, 13.00 MTPA IS BEYOND 2020
IEBR & BS Private Total IEBR & BS Private Total IEBR & BS Private Total IEBR & BS Private Total
1 2 3 4 5 6 7 8 9 10 11 12 13 14 15 16 17 18 19 20 21 22
TOTAL 9 50.50 961.8 4262.24 5224.04 13 13.50 1320.00 2911.00 4231.00 7 7.20 330.00 795.00 1125.00 29 71.20 2611.80 7968.24 10580.04
NOTE: OUT OF TOTAL CAPACITY, 7.20 MTPA IS BEYOND 2020
Name of the Port: Visakhapatnam
Sl. No. Category
PHASE-I PHASE-II PHASE-III TOTAL
No. of Projects
Capacity (In MTPA)
Source of Financing (In Crores) No. of Projects
Capacity (In MTPA)
Source of Financing (In Crores) No. of Projects
Capacity (In MTPA)
Source of Financing (In Crores) No. of Projects
Capacity (In
MTPA)
Source of Financing (In Crores)
A DEEPENING OF CHANNEL/BERTHS ETC 3 1.20 412.14 0.00 412.14 2 0.00 200.00 0.00 200.00 2 0.00 1500.00 0.00 1500.00 7 1.20 2112.14 0.00 2112.14
BCONSTRUCTION/ RECONSTRUCTION OF BERTHS/JETTIES ETC.
12 39.50 321.00 1552.07 1873.07 5 26.50 2000.00 3630.00 5630.00 3 9.00 1300.00 1000.00 2300.00 20 75.00 3621.00 6182.07 9803.07
C PROCUREMENT OF EQUIPMENTS ETC 5 10.86 44.00 610.01 654.01 1 0.00 90.00 0.00 90.00 0 0.00 0.00 0.00 0.00 6 10.86 134.00 610.01 744.01
D RAIL/ROAD CONNECTIVITY WORKS 3 0.00 296.00 0.00 296.00 2 0.00 150.00 0.00 150.00 3 0.00 200.00 0.00 200.00 8 0.00 646.00 0.00 646.00
E OTHER WORKS 4 0.65 38.00 100.00 138.00 9 0.00 195.00 200.00 395.00 2 0.00 100.00 0.00 100.00 15 0.65 333.00 300.00 633.00
Name of the Port: Chennai
Sl. No. Category
PHASE-I PHASE-II PHASE-III TOTAL
No. of Projects
Capacity (In MTPA)
Source of Financing (In Crores) No. of Projects
Capacity (In MTPA)
Source of Financing (In Crores) No. of Projects
Capacity (In MTPA)
Source of Financing (In Crores) No. of Projects
Capacity (In
MTPA)
Source of Financing (In Crores)
A DEEPENING OF CHANNEL/BERTHS ETC 1 0.00 561.00 0.00 561.00 1 2.00 0.00 0.00 0.00 0 0.00 0.00 0.00 0.00 2 2.00 561.00 0.00 561.00
BCONSTRUCTION/ RECONSTRUCTION OF BERTHS/JETTIES ETC.
3 50.50 1.30 3258.50 3259.80 4 11.50 27.00 898.00 925.00 1 7.20 2.00 498.00 500.00 8 69.20 30.30 4654.50 4684.80
C PROCUREMENT OF EQUIPMENTS ETC 0 0.00 0.00 0.00 0.00 0 0.00 0.00 0.00 0.00 0 0.00 0.00 0.00 0.00 0 0.00 0.00 0.00 0.00
D RAIL/ROAD CONNECTIVITY WORKS 1 0.00 139.80 460.20 600.00 0 0.00 0.00 0.00 0.00 2 0.00 225.00 0.00 225.00 3 0.00 364.80 460.20 825.00
E OTHER WORKS 4 0.00 259.70 543.54 803.24 0.00 103.008 0.00 1293.00 2013.00 1655.70 2853.54 4509.24297.00 400.00 16 0.003306.00 4
186

ANNEXURE-XIPort Wise Summary of Number of Projects to be undertaken for Major Ports Under 5 Project Heads & Their Funding Pattern in Phase I, II & III
FROM 2010-11 TO 2019-20
IEBR & BS Private Total IEBR & BS Private Total IEBR & BS Private Total IEBR & BS Private Total
1 2 3 4 5 6 7 8 9 10 11 12 13 14 15 16 17 18 19 20 21 22
TOTAL 7 26.30 281.47 873.08 1154.55 6 14.00 780.00 664.32 1444.32 11 19.20 2707.00 1200.00 3907.00 24 59.50 3768.47 2737.40 6505.87
IEBR & BS Private Total IEBR & BS Private Total IEBR & BS Private Total IEBR & BS Private Total
1 2 3 4 5 6 7 8 9 10 11 12 13 14 15 16 17 18 19 20 21 22
TOTAL 6 4.10 114 397.00 511.00 18 12.75 531.40 1840.00 2371.40 14 49.50 1099.10 2900.00 3999.10 38 66.35 1744.50 5137.00 6881.50
Source of Financing (In Crores) No. of Projects
Capacity (In MTPA)
Source of Financing (In Crores)PHASE-II
Name of the Port: Cochin
Sl. No.
PHASE-III TOTALNo. of
ProjectsCapacity (In MTPA)
No. of Projects
Capacity (In MTPA)
Source of Financing (In Crores) No. of Projects
Capacity (In
MTPA)
Source of Financing (In Crores)Category
PHASE-I
Name of the Port: Tuticorin
Sl. No. Category
PHASE-I PHASE-II PHASE-III TOTAL
No. of Projects
Capacity (In MTPA)
Source of Financing (In Crores) No. of Projects
Capacity (In MTPA)
Source of Financing (In Crores) No. of Projects
Capacity (In MTPA)
Source of Financing (In Crores) No. of Projects
Capacity (In
MTPA)
Source of Financing (In Crores)
A DEEPENING OF CHANNEL/BERTHS ETC 1 0.00 140.00 0.00 140.00 2 0.00 140.00 0.00 140.00 1 0.00 2250.00 0.00 2250.00 4 0.00 2530.00 0.00 2530.00
BCONSTRUCTION/ RECONSTRUCTION OF BERTHS/JETTIES ETC.
3 13.20 39.70 480.86 520.56 2 14.00 0.00 664.32 664.32 2 19.20 0.00 850.00 850.00 7 46.40 39.70 1995.18 2034.88
C PROCUREMENT OF EQUIPMENTS ETC 2 13.10 0.00 392.22 392.22 0 0.00 0.00 0.00 0.00 3 0.00 82.00 150.00 232.00 5 13.10 82.00 542.22 624.22
D RAIL/ROAD CONNECTIVITY WORKS 1 0.00 101.77 0.00 101.77 2 0.00 640.00 0.00 640.00 2 0.00 300.00 0.00 300.00 5 0.00 1041.77 0.00 1041.77
E OTHER WORKS 0 0.00 0.00 0.00 0.00 0 0.00 0.00 0.00 0.00 3 0.00 75.00 200.00 275.00 3 0.00 75.00 200.00 275.00
A DEEPENING OF CHANNEL/BERTHS ETC 0 0.00 0.00 0.00 0.00 3 0.00 111.40 0.00 111.40 1 0.00 29.10 0.00 29.10 4 0.00 140.50 0.00 140.50
BCONSTRUCTION/ RECONSTRUCTION OF BERTHS/JETTIES ETC.
2 4.10 0.00 397.00 397.00 7 12.75 120.00 1490.00 1610.00 3 49.50 0.00 2900.00 2900.00 12 66.35 120.00 4787.00 4907.00
C PROCUREMENT OF EQUIPMENTS ETC 2 0.00 84.00 0.00 84.00 2 0.00 125.00 0.00 125.00 6 0.00 825.00 0.00 825.00 10 0.00 1034.00 0.00 1034.00
D RAIL/ROAD CONNECTIVITY WORKS 0 0.00 0.00 0.00 0.00 1 0.00 40.00 0.00 40.00 0 0.00 0.00 0.00 0.00 1 0.00 40.00 0.00 40.00
E OTHER WORKS 2 0.00 30.00 0.00 30.00 5 0.00 135.00 350.00 485.00 4 0.00 245.00 0.00 245.00 11 0.00 410.00 350.00 760.00
187

ANNEXURE-XIPort Wise Summary of Number of Projects to be undertaken for Major Ports Under 5 Project Heads & Their Funding Pattern in Phase I, II & III
FROM 2010-11 TO 2019-20
IEBR & BS Private Total IEBR & BS Private Total IEBR & BS Private Total IEBR & BS Private Total
1 2 3 4 5 6 7 8 9 10 11 12 13 14 15 16 17 18 19 20 21 22
TOTAL 3 12.30 79.17 299.73 378.90 3 29.00 297.00 850.00 1147.00 1 0.00 390.00 0.00 390.00 7 41.30 766.17 1149.73 1915.90
IEBR & BS Private Total IEBR & BS Private Total IEBR & BS Private Total IEBR & BS Private Total
1 2 3 4 5 6 7 8 9 10 11 12 13 14 15 16 17 18 19 20 21 22
TOTAL 1 7.00 0 496.00 496.00 4 18.00 445.80 1946.00 2391.80 0 0.00 0.00 0.00 0.00 5 25.00 445.80 2442.00 2887.80
Name of the Port: New Mangalore
Sl. No. Category
PHASE-I PHASE-II PHASE-III TOTAL
No. of Projects
Capacity (In MTPA)
Source of Financing (In Crores) No. of Projects
Capacity (In MTPA)
Source of Financing (In Crores) No. of Projects
Capacity (In MTPA)
Source of Financing (In Crores) No. of Projects
Capacity (In
MTPA)
Source of Financing (In Crores)
A DEEPENING OF CHANNEL/BERTHS ETC 0 0.00 0.00 0.00 0.00 0 0.00 0.00 0.00 0.00 1 0.00 390.00 0.00 390.00 1 0.00 390.00 0.00 390.00
BCONSTRUCTION/ RECONSTRUCTION OF BERTHS/JETTIES ETC.
2 12.30 79.17 269.73 348.90 3 29.00 297.00 850.00 1147.00 0 0.00 0.00 0.00 0.00 5 41.30 376.17 1119.73 1495.90
C PROCUREMENT OF EQUIPMENTS ETC 1 0.00 0.00 30.00 30.00 0 0.00 0.00 0.00 0.00 0 0.00 0.00 0.00 0.00 1 0.00 0.00 30.00 30.00
D RAIL/ROAD CONNECTIVITY WORKS 0 0.00 0.00 0.00 0.00 0 0.00 0.00 0.00 0.00 0 0.00 0.00 0.00 0.00 0 0.00 0.00 0.00 0.00
E OTHER WORKS 0 0.00 0.00 0.00 0.00 0.00 0.000 0.00 0.00 0.00 0.00 0.00 0.00
Name of the Port: Mormugao
0.00 0.00 0 0.000.00 0
Sl. No. Category
PHASE-I PHASE-II PHASE-III TOTAL
No. of Projects
Capacity (In MTPA)
Source of Financing (In Crores) No. of Projects
Capacity (In MTPA)
Source of Financing (In Crores) No. of Projects
Capacity (In MTPA)
Source of Financing (In Crores) No. of Projects
Capacity (In
MTPA)
Source of Financing (In Crores)
A DEEPENING OF CHANNEL/BERTHS ETC 0 0.00 0.00 0.00 0.00 0 0.00 0.00 0.00 0.00 0 0.00 0.00 0.00 0.00 0 0.00 0.00 0.00 0.00
BCONSTRUCTION/ RECONSTRUCTION OF BERTHS/JETTIES ETC.
1 7.00 0.00 496.00 496.00 3 16.00 0.00 1946.00 1946.00 0 0.00 0.00 0.00 0.00 4 23.00 0.00 2442.00 2442.00
C PROCUREMENT OF EQUIPMENTS ETC 0 0.00 0.00 0.00 0.00 1 2.00 445.80 0.00 445.80 0 0.00 0.00 0.00 0.00 1 2.00 445.80 0.00 445.80
D RAIL/ROAD CONNECTIVITY WORKS 0 0.00 0.00 0.00 0.00 0 0.00 0.00 0.00 0.00 0 0.00 0.00 0.00 0.00 0 0.00 0.00 0.00 0.00
E OTHER WORKS 0 0.00 0.00 0.00 0.00 0 0.00 0.00 0.00 0.00 0 0.00 0.00 0.00 0.00 0 0.00 0.00 0.00 0.00
188
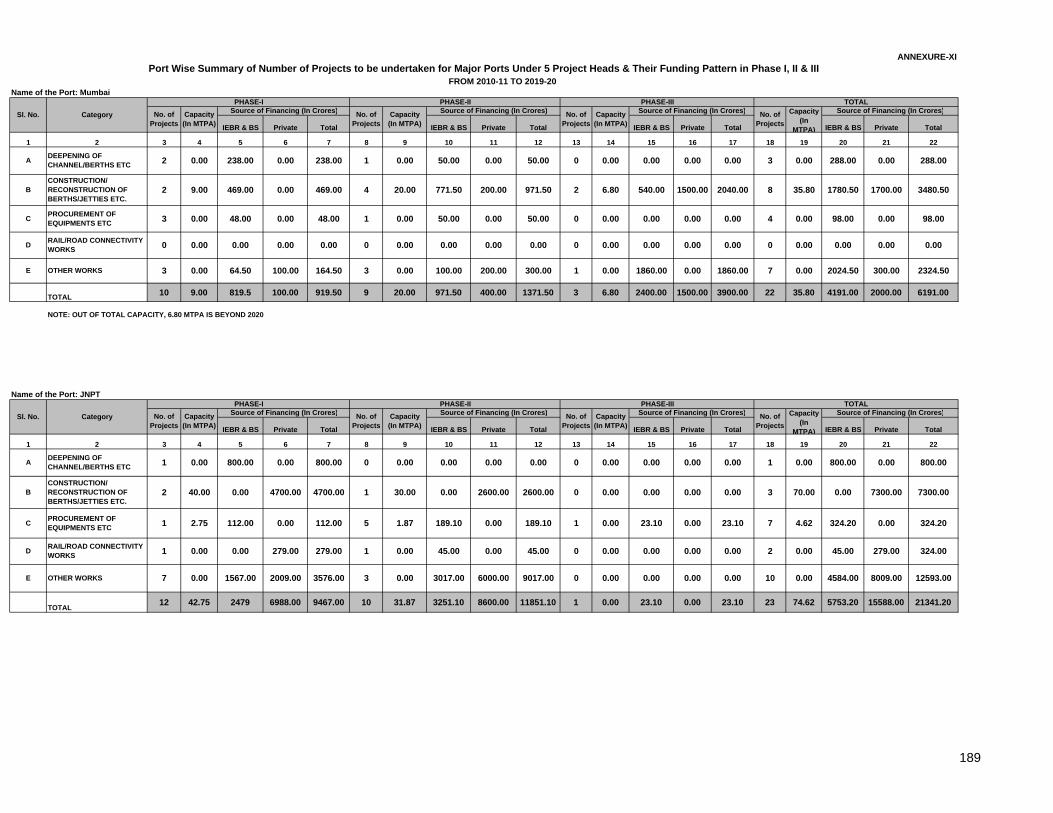
ANNEXURE-XIPort Wise Summary of Number of Projects to be undertaken for Major Ports Under 5 Project Heads & Their Funding Pattern in Phase I, II & III
FROM 2010-11 TO 2019-20
IEBR & BS Private Total IEBR & BS Private Total IEBR & BS Private Total IEBR & BS Private Total
1 2 3 4 5 6 7 8 9 10 11 12 13 14 15 16 17 18 19 20 21 22
TOTAL 10 9.00 819.5 100.00 919.50 9 20.00 971.50 400.00 1371.50 3 6.80 2400.00 1500.00 3900.00 22 35.80 4191.00 2000.00 6191.00
NOTE: OUT OF TOTAL CAPACITY, 6.80 MTPA IS BEYOND 2020
IEBR & BS Private Total IEBR & BS Private Total IEBR & BS Private Total IEBR & BS Private Total
1 2 3 4 5 6 7 8 9 10 11 12 13 14 15 16 17 18 19 20 21 22
TOTAL 12 42.75 2479 6988.00 9467.00 10 31.87 3251.10 8600.00 11851.10 1 0.00 23.10 0.00 23.10 23 74.62 5753.20 15588.00 21341.20
Name of the Port: Mumbai
Sl. No. Category
PHASE-I PHASE-II PHASE-III TOTAL
No. of Projects
Capacity (In MTPA)
Source of Financing (In Crores) No. of Projects
Capacity (In MTPA)
Source of Financing (In Crores) No. of Projects
Capacity (In MTPA)
Source of Financing (In Crores) No. of Projects
Capacity (In
MTPA)
Source of Financing (In Crores)
A DEEPENING OF CHANNEL/BERTHS ETC 2 0.00 238.00 0.00 238.00 1 0.00 50.00 0.00 50.00 0 0.00 0.00 0.00 0.00 3 0.00 288.00 0.00 288.00
BCONSTRUCTION/ RECONSTRUCTION OF BERTHS/JETTIES ETC.
2 9.00 469.00 0.00 469.00 4 20.00 771.50 200.00 971.50 2 6.80 540.00 1500.00 2040.00 8 35.80 1780.50 1700.00 3480.50
C PROCUREMENT OF EQUIPMENTS ETC 3 0.00 48.00 0.00 48.00 1 0.00 50.00 0.00 50.00 0 0.00 0.00 0.00 0.00 4 0.00 98.00 0.00 98.00
D RAIL/ROAD CONNECTIVITY WORKS 0 0.00 0.00 0.00 0.00 0 0.00 0.00 0.00 0.00 0 0.00 0.00 0.00 0.00 0 0.00 0.00 0.00 0.00
E OTHER WORKS 3 0.00 64.50 100.00 164.50 0.00 1860.003 0.00 100.00 200.00 2024.50 300.00 2324.50
Name of the Port: JNPT
0.00 1860.00 7 0.00300.00 1
Sl. No. Category
PHASE-I PHASE-II PHASE-III TOTAL
No. of Projects
Capacity (In MTPA)
Source of Financing (In Crores) No. of Projects
Capacity (In MTPA)
Source of Financing (In Crores) No. of Projects
Capacity (In MTPA)
Source of Financing (In Crores) No. of Projects
Capacity (In
MTPA)
Source of Financing (In Crores)
A DEEPENING OF CHANNEL/BERTHS ETC 1 0.00 800.00 0.00 800.00 0 0.00 0.00 0.00 0.00 0 0.00 0.00 0.00 0.00 1 0.00 800.00 0.00 800.00
BCONSTRUCTION/ RECONSTRUCTION OF BERTHS/JETTIES ETC.
2 40.00 0.00 4700.00 4700.00 1 30.00 0.00 2600.00 2600.00 0 0.00 0.00 0.00 0.00 3 70.00 0.00 7300.00 7300.00
C PROCUREMENT OF EQUIPMENTS ETC 1 2.75 112.00 0.00 112.00 5 1.87 189.10 0.00 189.10 1 0.00 23.10 0.00 23.10 7 4.62 324.20 0.00 324.20
D RAIL/ROAD CONNECTIVITY WORKS 1 0.00 0.00 279.00 279.00 1 0.00 45.00 0.00 45.00 0 0.00 0.00 0.00 0.00 2 0.00 45.00 279.00 324.00
E OTHER WORKS 7 0.00 1567.00 2009.00 3576.00 3 0.00 3017.00 6000.00 9017.00 0 0.00 0.00 0.00 0.00 10 0.00 4584.00 8009.00 12593.00
189

ANNEXURE-XIPort Wise Summary of Number of Projects to be undertaken for Major Ports Under 5 Project Heads & Their Funding Pattern in Phase I, II & III
FROM 2010-11 TO 2019-20
IEBR & BS Private Total IEBR & BS Private Total IEBR & BS Private Total IEBR & BS Private Total
1 2 3 4 5 6 7 8 9 10 11 12 13 14 15 16 17 18 19 20 21 22
TOTAL 11 44.30 713.4 3261.50 3974.90 14 37.10 325.56 14427.00 14752.56 3 20.00 270.00 1040.00 1310.00 28 101.40 1308.96 18728.50 20037.46
IEBR & BS Private Total IEBR & BS Private Total IEBR & BS Private Total IEBR & BS Private Total
1 2 3 4 5 6 7 8 9 10 11 12 13 14 15 16 17 18 19 20 21 22
TOTAL 4 8.50 985.32 0.00 985.32 5 9.50 922.00 100.00 1022.00 0 0.00 0.00 0.00 0.00 9 18.00 1907.32 100.00 2007.32
Name of the Port: Kandla
Sl. No. Category
PHASE-I PHASE-II PHASE-III TOTAL
No. of Projects
Capacity (In MTPA)
Source of Financing (In Crores) No. of Projects
Capacity (In MTPA)
Capacity (In
MTPA)
Source of Financing (In Crores)Source of Financing (In Crores) No. of Projects
Capacity (In MTPA)
Source of Financing (In Crores)
0.00 0.00 0.00
No. of Projects
0.00 0 0.00 0.00 0.00 0.00 0 0.00 0.00 0.00 0.00
BCONSTRUCTION/ RECONSTRUCTION OF BERTHS/JETTIES ETC.
5 35.50 347.40 1791.00 2138.40 3 33.00 0.00 1760.00 1760.00 2 20.00 0.00 1040.00 1040.00 10 88.50 347.40 4591.00 4938.40
C PROCUREMENT OF EQUIPMENTS ETC 1 2.00 40.00 80.00 120.00 1 0.70 0.00 50.00 50.00 1 0.00 270.00 0.00 270.00 3 2.70 310.00 130.00 440.00
D RAIL/ROAD CONNECTIVITY WORKS 0 0.00 0.00 0.00 0.00 2 0.00 115.56 0.00 115.56 0 0.00 0.00 0.00 0.00 2 0.00 115.56 0.00 115.56
E OTHER WORKS 5 6.80 326.00 1390.50 1716.50 0.00 0.008 3.40 210.00 12617.00 536.00 14007.50 14543.50
Name of the Port: Ennore Port Limited
0.00 0.00 13 10.2012827.00 0
Sl. No. Category
PHASE-I PHASE-II PHASE-III TOTAL
No. of Projects
Capacity (In MTPA)
Source of Financing (In Crores) No. of Projects
Capacity (In MTPA)
Source of Financing (In Crores) No. of Projects
Capacity (In MTPA)
Source of Financing (In Crores) No. of Projects
Capacity (In
MTPA)
Source of Financing (In Crores)
A DEEPENING OF CHANNEL/BERTHS ETC 1 0.00 221.00 0.00 221.00 1 0.00 219.00 0.00 219.00 0 0.00 0.00 0.00 0.00 2 0.00 440.00 0.00 440.00
BCONSTRUCTION/ RECONSTRUCTION OF BERTHS/JETTIES ETC.
2 8.50 310.00 0.00 310.00 3 9.50 257.00 100.00 357.00 0 0.00 0.00 0.00 0.00 5 18.00 567.00 100.00 667.00
C PROCUREMENT OF EQUIPMENTS ETC 0 0.00 0.00 0.00 0.00 0 0.00 0.00 0.00 0.00 0 0.00 0.00 0.00 0.00 0 0.00 0.00 0.00 0.00
D RAIL/ROAD CONNECTIVITY WORKS 1 0.00 454.32 0.00 454.32 1 0.00 446.00 0.00 446.00 0 0.00 0.00 0.00 0.00 2 0.00 900.32 0.00 900.32
E OTHER WORKS 0 0.00 0.00 0.00 0.00 0 0.00 0.00 0.00 0.00 0 0.00 0.00 0.00 0.00 0 0.00 0.00 0.00 0.00
A DEEPENING OF CHANNEL/BERTHS ETC 0 0.00 0.00 0.00 0.00 0
190
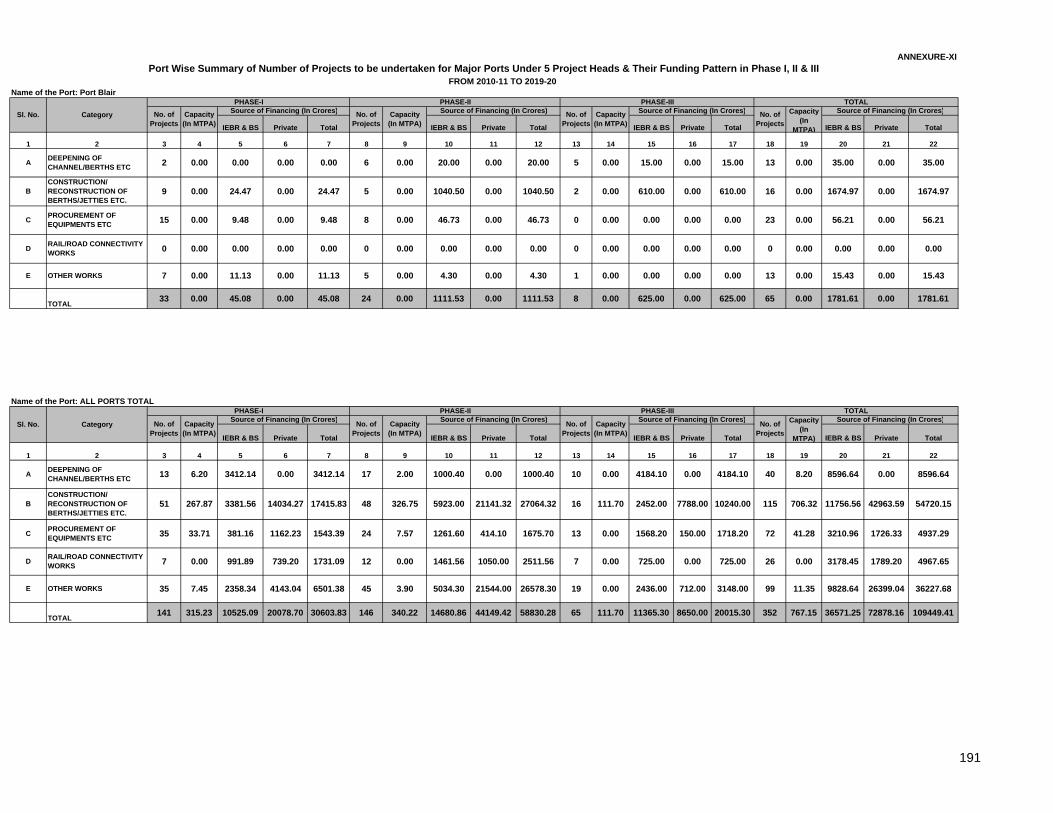
ANNEXURE-XIPort Wise Summary of Number of Projects to be undertaken for Major Ports Under 5 Project Heads & Their Funding Pattern in Phase I, II & III
FROM 2010-11 TO 2019-20
IEBR & BS Private Total IEBR & BS Private Total IEBR & BS Private Total IEBR & BS Private Total
1 2 3 4 5 6 7 8 9 10 11 12 13 14 15 16 17 18 19 20 21 22
TOTAL 33 0.00 45.08 0.00 45.08 24 0.00 1111.53 0.00 1111.53 8 0.00 625.00 0.00 625.00 65 0.00 1781.61 0.00 1781.61
IEBR & BS Private Total IEBR & BS Private Total IEBR & BS Private Total IEBR & BS Private Total
1 2 3 4 5 6 7 8 9 10 11 12 13 14 15 16 17 18 19 20 21 22
TOTAL 141 315.23 10525.09 20078.70 30603.83 146 340.22 14680.86 44149.42 58830.28 65 111.70 11365.30 8650.00 20015.30 352 767.15 36571.25 72878.16 109449.41
Name of the Port: Port Blair
Sl. No. Category
PHASE-I PHASE-II PHASE-III TOTAL
No. of Projects
Capacity (In MTPA)
Source of Financing (In Crores) No. of Projects
Capacity (In MTPA)
Source of Financing (In Crores) No. of Projects
Capacity (In MTPA)
Source of Financing (In Crores) No. of Projects
Capacity (In
MTPA)
Source of Financing (In Crores)
A DEEPENING OF CHANNEL/BERTHS ETC 2 0.00 0.00 0.00 0.00 6 0.00 20.00 0.00 20.00 5 0.00 15.00 0.00 15.00 13 0.00 35.00 0.00 35.00
BCONSTRUCTION/ RECONSTRUCTION OF BERTHS/JETTIES ETC.
9 0.00 24.47 0.00 24.47 5 0.00 1040.50 0.00 1040.50 2 0.00 610.00 0.00 610.00 16 0.00 1674.97 0.00 1674.97
C PROCUREMENT OF EQUIPMENTS ETC 15 0.00 9.48 0.00 9.48 8 0.00 46.73 0.00 46.73 0 0.00 0.00 0.00 0.00 23 0.00 56.21 0.00 56.21
D RAIL/ROAD CONNECTIVITY WORKS 0 0.00 0.00 0.00 0.00 0 0.00 0.00 0.00 0.00 0 0.00 0.00 0.00 0.00 0 0.00 0.00 0.00 0.00
E OTHER WORKS 7 0.00 11.13 0.00 11.13 0.00 0.005 0.00 4.30 0.00 15.43 0.00 15.43
Name of the Port: ALL PORTS TOTAL
0.00 0.00 13 0.004.30 1
Sl. No. Category
PHASE-I PHASE-II PHASE-III TOTAL
No. of Projects
Capacity (In MTPA)
Source of Financing (In Crores) No. of Projects
Capacity (In MTPA)
Source of Financing (In Crores) No. of Projects
Capacity (In MTPA)
Source of Financing (In Crores) No. of Projects
Capacity (In
MTPA)
Source of Financing (In Crores)
A DEEPENING OF CHANNEL/BERTHS ETC 13 6.20 3412.14 0.00 3412.14 17 2.00 1000.40 0.00 1000.40 10 0.00 4184.10 0.00 4184.10 40 8.20 8596.64 0.00 8596.64
BCONSTRUCTION/ RECONSTRUCTION OF BERTHS/JETTIES ETC.
51 267.87 3381.56 14034.27 17415.83 48 326.75 5923.00 21141.32 27064.32 16 111.70 2452.00 7788.00 10240.00 115 706.32 11756.56 42963.59 54720.15
C PROCUREMENT OF EQUIPMENTS ETC 35 33.71 381.16 1162.23 1543.39 24 7.57 1261.60 414.10 1675.70 13 0.00 1568.20 150.00 1718.20 72 41.28 3210.96 1726.33 4937.29
D RAIL/ROAD CONNECTIVITY WORKS 7 0.00 991.89 739.20 1731.09 12 0.00 1461.56 1050.00 2511.56 7 0.00 725.00 0.00 725.00 26 0.00 3178.45 1789.20 4967.65
E OTHER WORKS 35 7.45 2358.34 4143.04 6501.38 45 3.90 5034.30 21544.00 26578.30 19 0.00 2436.00 712.00 3148.00 99 11.35 9828.64 26399.04 36227.68
191
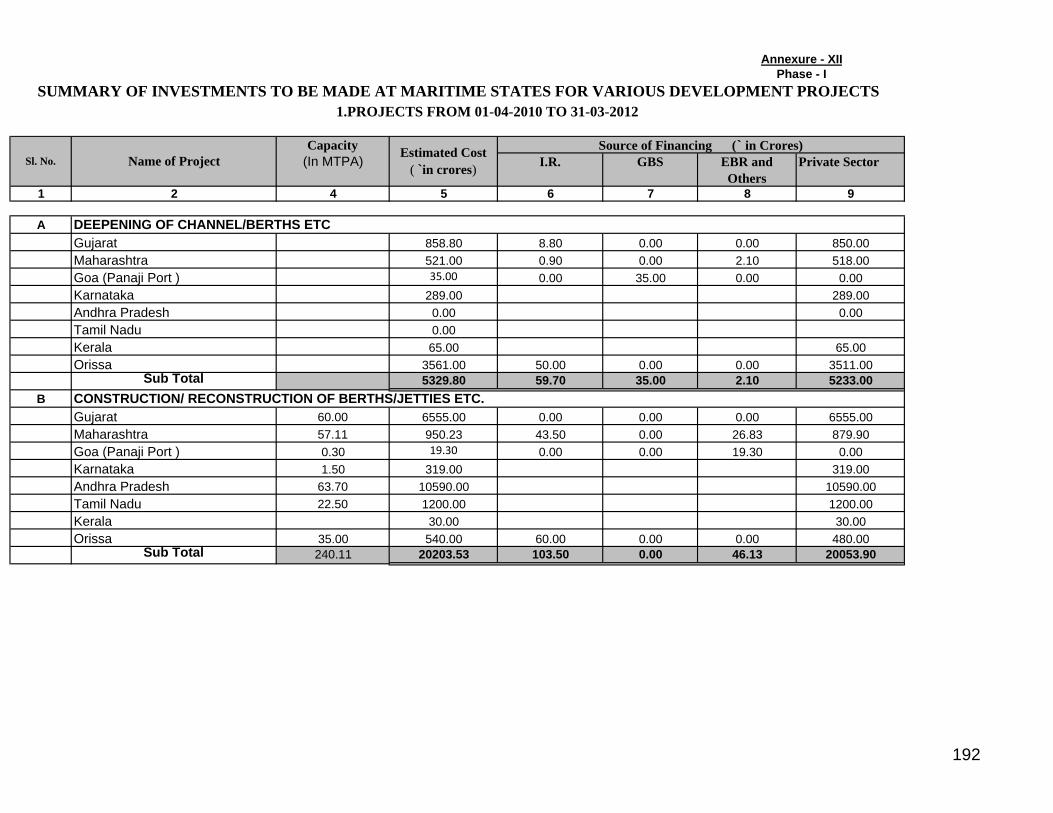
Capacity (In MTPA) I.R. GBS EBR and
Others Private Sector
1 2 4 5 6 7 8 9
AGujarat 858.80 8.80 0.00 0.00 850.00Maharashtra 521.00 0.90 0.00 2.10 518.00Goa (Panaji Port ) 35.00 0.00 35.00 0.00 0.00Karnataka 289.00 289.00Andhra Pradesh 0.00 0.00Tamil Nadu 0.00Kerala 65.00 65.00Orissa 3561.00 50.00 0.00 0.00 3511.00
Sub Total 5329.80 59.70 35.00 2.10 5233.00B
Gujarat 60.00 6555.00 0.00 0.00 0.00 6555.00Maharashtra 57.11 950.23 43.50 0.00 26.83 879.90Goa (Panaji Port ) 0.30 19.30 0.00 0.00 19.30 0.00Karnataka 1.50 319.00 319.00Andhra Pradesh 63.70 10590.00 10590.00Tamil Nadu 22.50 1200.00 1200.00Kerala 30.00 30.00Orissa 35.00 540.00 60.00 0.00 0.00 480.00
Sub Total 240.11 20203.53 103.50 0.00 46.13 20053.90
DEEPENING OF CHANNEL/BERTHS ETC
CONSTRUCTION/ RECONSTRUCTION OF BERTHS/JETTIES ETC.
Annexure - XIIPhase - I
SUMMARY OF INVESTMENTS TO BE MADE AT MARITIME STATES FOR VARIOUS DEVELOPMENT PROJECTS1.PROJECTS FROM 01-04-2010 TO 31-03-2012
Sl. No. Name of Project Estimated Cost ( `in crores)
Source of Financing (` in Crores)
192
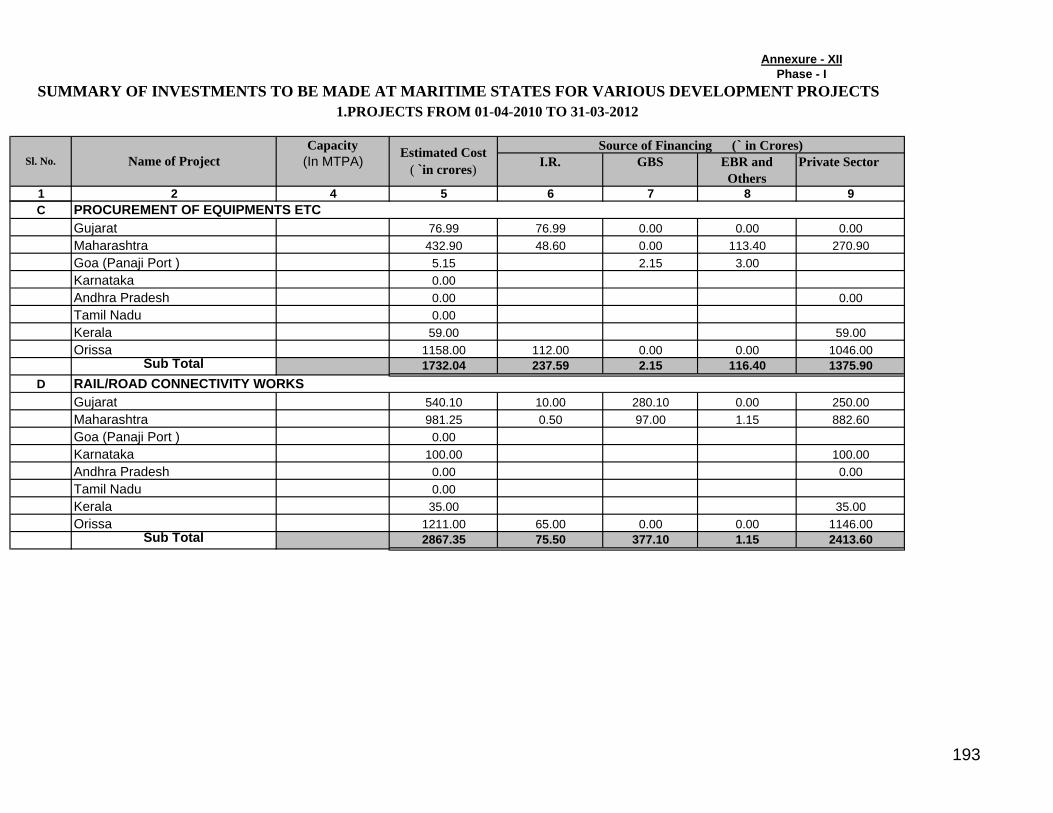
Capacity (In MTPA) I.R. GBS EBR and
Others Private Sector
1 2 4 5 6 7 8 9
Annexure - XIIPhase - I
SUMMARY OF INVESTMENTS TO BE MADE AT MARITIME STATES FOR VARIOUS DEVELOPMENT PROJECTS1.PROJECTS FROM 01-04-2010 TO 31-03-2012
Sl. No. Name of Project Estimated Cost ( `in crores)
Source of Financing (` in Crores)
CGujarat 76.99 76.99 0.00 0.00 0.00Maharashtra 432.90 48.60 0.00 113.40 270.90Goa (Panaji Port ) 5.15 2.15 3.00Karnataka 0.00Andhra Pradesh 0.00 0.00Tamil Nadu 0.00Kerala 59.00 59.00Orissa 1158.00 112.00 0.00 0.00 1046.00
Sub Total 1732.04 237.59 2.15 116.40 1375.90D
Gujarat 540.10 10.00 280.10 0.00 250.00Maharashtra 981.25 0.50 97.00 1.15 882.60Goa (Panaji Port ) 0.00Karnataka 100.00 100.00Andhra Pradesh 0.00 0.00Tamil Nadu 0.00Kerala 35.00 35.00Orissa 1211.00 65.00 0.00 0.00 1146.00
Sub Total 2867.35 75.50 377.10 1.15 2413.60
PROCUREMENT OF EQUIPMENTS ETC
RAIL/ROAD CONNECTIVITY WORKS
193
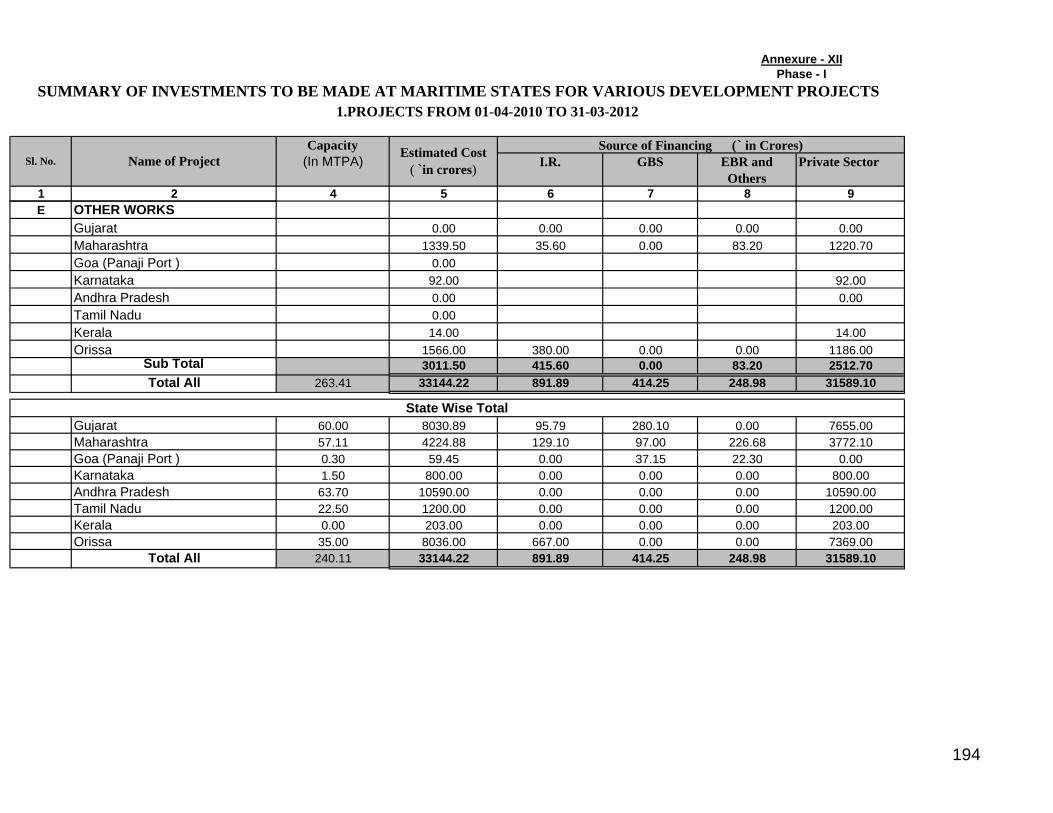
Capacity (In MTPA) I.R. GBS EBR and
Others Private Sector
1 2 4 5 6 7 8 9
Annexure - XIIPhase - I
SUMMARY OF INVESTMENTS TO BE MADE AT MARITIME STATES FOR VARIOUS DEVELOPMENT PROJECTS1.PROJECTS FROM 01-04-2010 TO 31-03-2012
Sl. No. Name of Project Estimated Cost ( `in crores)
Source of Financing (` in Crores)
E OTHER WORKSGujarat 0.00 0.00 0.00 0.00 0.00Maharashtra 1339.50 35.60 0.00 83.20 1220.70Goa (Panaji Port ) 0.00Karnataka 92.00 92.00Andhra Pradesh 0.00 0.00Tamil Nadu 0.00Kerala 14.00 14.00Orissa 1566.00 380.00 0.00 0.00 1186.00
Sub Total 3011.50 415.60 0.00 83.20 2512.70Total All 263.41 33144.22 891.89 414.25 248.98 31589.10
Gujarat 60.00 8030.89 95.79 280.10 0.00 7655.00Maharashtra 57.11 4224.88 129.10 97.00 226.68 3772.10Goa (Panaji Port ) 0.30 59.45 0.00 37.15 22.30 0.00Karnataka 1.50 800.00 0.00 0.00 0.00 800.00Andhra Pradesh 63.70 10590.00 0.00 0.00 0.00 10590.00Tamil Nadu 22.50 1200.00 0.00 0.00 0.00 1200.00Kerala 0.00 203.00 0.00 0.00 0.00 203.00Orissa 35.00 8036.00 667.00 0.00 0.00 7369.00
Total All 240.11 33144.22 891.89 414.25 248.98 31589.10
State Wise Total
194
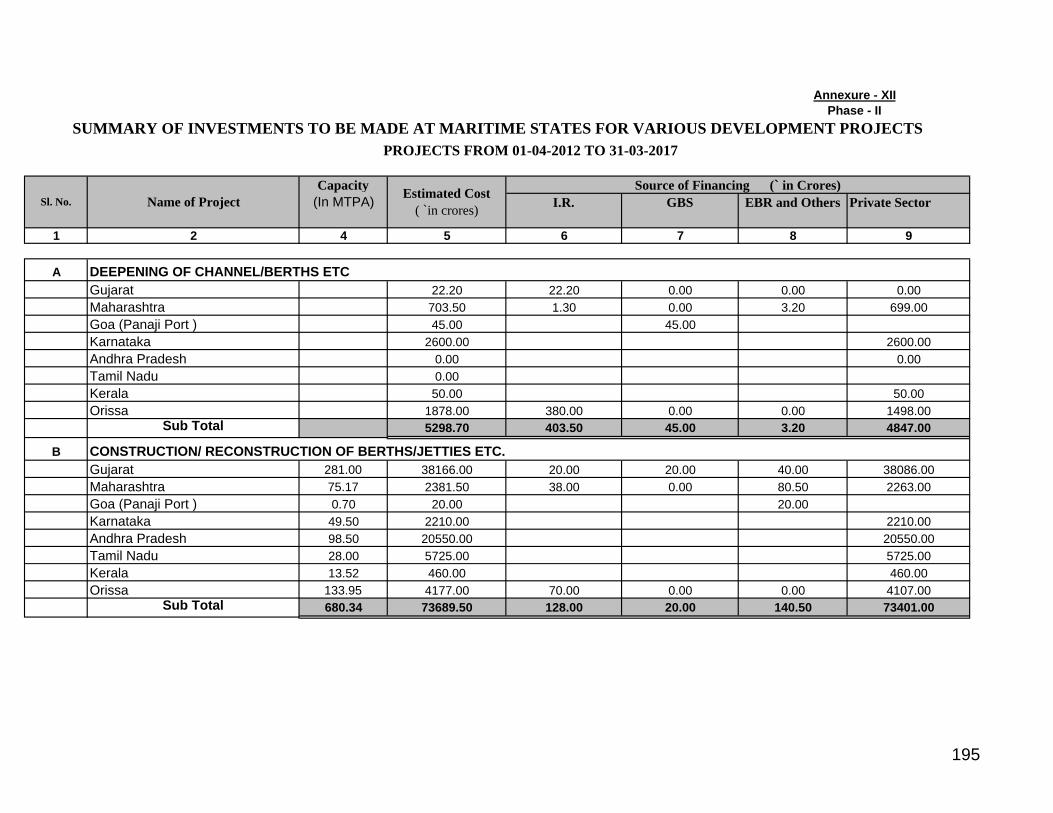
Capacity (In MTPA) I.R. GBS EBR and Others Private Sector
1 2 4 5 6 7 8 9
AGujarat 22.20 22.20 0.00 0.00 0.00Maharashtra 703.50 1.30 0.00 3.20 699.00Goa (Panaji Port ) 45.00 45.00Karnataka 2600.00 2600.00Andhra Pradesh 0.00 0.00Tamil Nadu 0.00Kerala 50.00 50.00Orissa 1878.00 380.00 0.00 0.00 1498.00
Sub Total 5298.70 403.50 45.00 3.20 4847.00
BGujarat 281.00 38166.00 20.00 20.00 40.00 38086.00Maharashtra 75.17 2381.50 38.00 0.00 80.50 2263.00Goa (Panaji Port ) 0.70 20.00 20.00Karnataka 49.50 2210.00 2210.00Andhra Pradesh 98.50 20550.00 20550.00Tamil Nadu 28.00 5725.00 5725.00Kerala 13.52 460.00 460.00Orissa 133.95 4177.00 70.00 0.00 0.00 4107.00
Sub Total 680.34 73689.50 128.00 20.00 140.50 73401.00
Annexure - XIIPhase - II
SUMMARY OF INVESTMENTS TO BE MADE AT MARITIME STATES FOR VARIOUS DEVELOPMENT PROJECTS PROJECTS FROM 01-04-2012 TO 31-03-2017
Sl. No. Name of Project Estimated Cost ( `in crores)
Source of Financing (` in Crores)
DEEPENING OF CHANNEL/BERTHS ETC
CONSTRUCTION/ RECONSTRUCTION OF BERTHS/JETTIES ETC.
195

Capacity (In MTPA) I.R. GBS EBR and Others Private Sector
1 2 4 5 6 7 8 9
Annexure - XIIPhase - II
SUMMARY OF INVESTMENTS TO BE MADE AT MARITIME STATES FOR VARIOUS DEVELOPMENT PROJECTS PROJECTS FROM 01-04-2012 TO 31-03-2017
Sl. No. Name of Project Estimated Cost ( `in crores)
Source of Financing (` in Crores)
CGujarat 0Maharashtra 2511.80 213.45 0.00 497.85 1800.50Goa (Panaji Port ) 16.00 11.25 4.75Karnataka 425.00 425.00Andhra Pradesh 0.00 0.00Tamil Nadu 0.00Kerala 45.00 45.00Orissa 2616.00 70.00 0.00 0.00 2546.00
Sub Total 5613.80 283.45 11.25 502.60 4816.50
DGujarat 2739.90 136.00 777.90 22.00 1804.00Maharashtra 504.41 20.61 0.00 53.80 430.00Goa (Panaji Port ) 0.00Karnataka 58.00 58.00Andhra Pradesh 0.00 0.00Tamil Nadu 0.00Kerala 260.00 260.00Orissa 2300.00 185.00 0.00 0.00 2115.00
Sub Total 5862.31 341.61 777.90 75.80 4667.00
PROCUREMENT OF EQUIPMENTS ETC
RAIL/ROAD CONNECTIVITY WORKS
196
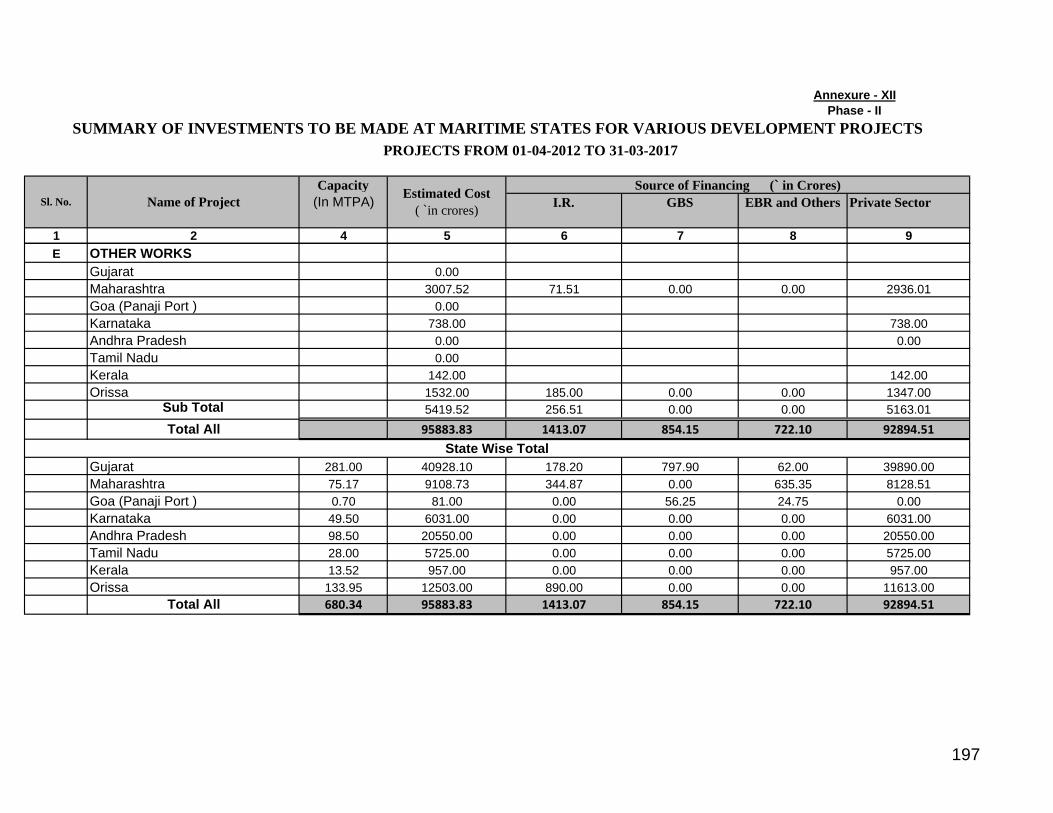
Capacity (In MTPA) I.R. GBS EBR and Others Private Sector
1 2 4 5 6 7 8 9
Annexure - XIIPhase - II
SUMMARY OF INVESTMENTS TO BE MADE AT MARITIME STATES FOR VARIOUS DEVELOPMENT PROJECTS PROJECTS FROM 01-04-2012 TO 31-03-2017
Sl. No. Name of Project Estimated Cost ( `in crores)
Source of Financing (` in Crores)
E OTHER WORKSGujarat 0.00Maharashtra 3007.52 71.51 0.00 0.00 2936.01Goa (Panaji Port ) 0.00Karnataka 738.00 738.00Andhra Pradesh 0.00 0.00Tamil Nadu 0.00Kerala 142.00 142.00Orissa 1532.00 185.00 0.00 0.00 1347.00
Sub Total 5419.52 256.51 0.00 0.00 5163.01Total All 95883.83 1413.07 854.15 722.10 92894.51
Gujarat 281.00 40928.10 178.20 797.90 62.00 39890.00Maharashtra 75.17 9108.73 344.87 0.00 635.35 8128.51Goa (Panaji Port ) 0.70 81.00 0.00 56.25 24.75 0.00Karnataka 49.50 6031.00 0.00 0.00 0.00 6031.00Andhra Pradesh 98.50 20550.00 0.00 0.00 0.00 20550.00Tamil Nadu 28.00 5725.00 0.00 0.00 0.00 5725.00Kerala 13.52 957.00 0.00 0.00 0.00 957.00Orissa 133.95 12503.00 890.00 0.00 0.00 11613.00
Total All 680.34 95883.83 1413.07 854.15 722.10 92894.51
State Wise Total
197

Capacity (In MTPA) I.R. GBS EBR and
Others Private Sector
1 2 4 5 6 7 8 9
AGujarat 13.30 13.30Maharashtra 529.60 1.80 0.00 4.20 523.60Goa (Panaji Port ) 60.00 60.00Andhra Pradesh 0.00 0.00Kerala 37.00 37.00Orissa 200.00 150.00 0.00 0.00 50.00
Sub Total 839.90 165.10 60.00 4.20 610.60
BGujarat 279.90 25026.00 0.00 0.00 0.00 25026.00Maharashtra 22.82 1043.40 14.49 0.00 35.81 993.10Goa (Panaji Port ) 0.00Andhra Pradesh 33.00 2400.00 2400.00Kerala 6.60 490.00 490.00Orissa 30.29 965.00 300.00 0.00 0.00 665.00
Sub Total 372.61 29924.40 314.49 0.00 35.81 29574.10
C
GujaratMaharashtra 1835.09 118.19 0.00 275.80 1441.10Goa (Panaji Port ) 0.50 2.25 2.25Andhra Pradesh 0.00 0.00Kerala 38.00 38.00Orissa 1055.00 150.00 0.00 0.00 905.00
Sub Total 2930.34 268.19 2.25 275.80 2384.10
DGujarat 242.30 0.00 242.30 0.00 0.00Maharashtra 5.60 5.60
Annexure - XIIPhase - III
SUMMARY OF INVESTMENTS TO BE MADE AT MARITIME STATES FOR VARIOUS DEVELOPMENT PROJECTSPROJECTS FROM 01-04-2017 TO 31-03-2020
Sl. No. Name of Project Estimated Cost ( `in crores)
Source of Financing (` in Crores)
DEEPENING OF CHANNEL/BERTHS ETC
CONSTRUCTION/ RECONSTRUCTION OF BERTHS/JETTIES ETC.
PROCUREMENT OF EQUIPMENTS ETC
RAIL/ROAD CONNECTIVITY WORKS
198
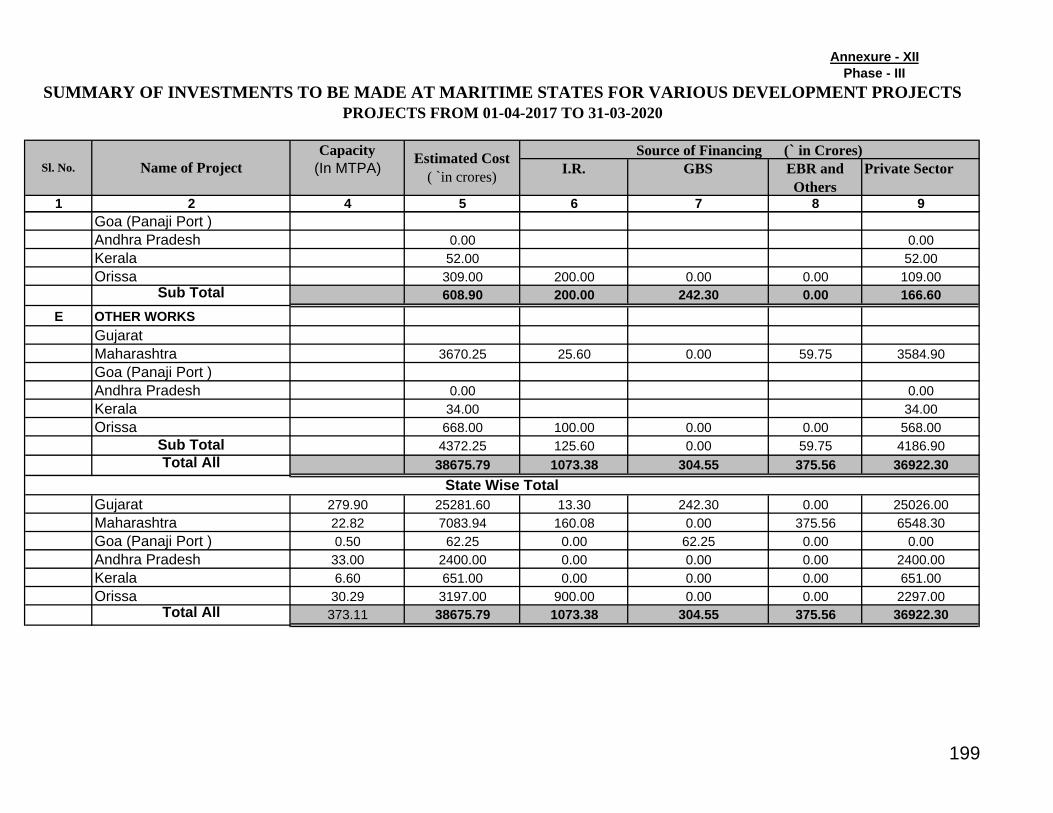
Capacity (In MTPA) I.R. GBS EBR and
Others Private Sector
1 2 4 5 6 7 8 9
Annexure - XIIPhase - III
SUMMARY OF INVESTMENTS TO BE MADE AT MARITIME STATES FOR VARIOUS DEVELOPMENT PROJECTSPROJECTS FROM 01-04-2017 TO 31-03-2020
Sl. No. Name of Project Estimated Cost ( `in crores)
Source of Financing (` in Crores)
Goa (Panaji Port )Andhra Pradesh 0.00 0.00Kerala 52.00 52.00Orissa 309.00 200.00 0.00 0.00 109.00
Sub Total 608.90 200.00 242.30 0.00 166.60E OTHER WORKS
GujaratMaharashtra 3670.25 25.60 0.00 59.75 3584.90Goa (Panaji Port )Andhra Pradesh 0.00 0.00Kerala 34.00 34.00Orissa 668.00 100.00 0.00 0.00 568.00
Sub Total 4372.25 125.60 0.00 59.75 4186.90Total All 38675.79 1073.38 304.55 375.56 36922.30
Gujarat 279.90 25281.60 13.30 242.30 0.00 25026.00Maharashtra 22.82 7083.94 160.08 0.00 375.56 6548.30Goa (Panaji Port ) 0.50 62.25 0.00 62.25 0.00 0.00Andhra Pradesh 33.00 2400.00 0.00 0.00 0.00 2400.00Kerala 6.60 651.00 0.00 0.00 0.00 651.00Orissa 30.29 3197.00 900.00 0.00 0.00 2297.00
Total All 373.11 38675.79 1073.38 304.55 375.56 36922.30
State Wise Total
199
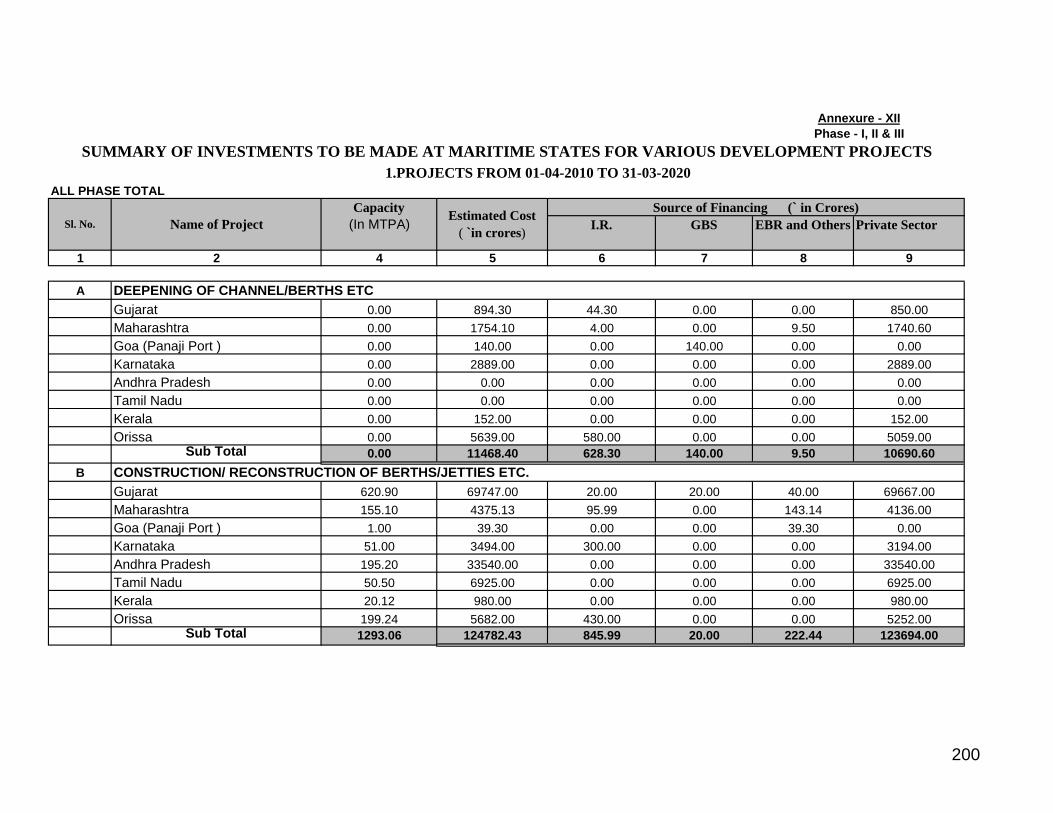
Capacity (In MTPA) I.R. GBS EBR and Others Private Sector
1 2 4 5 6 7 8 9
AGujarat 0.00 894.30 44.30 0.00 0.00 850.00Maharashtra 0.00 1754.10 4.00 0.00 9.50 1740.60Goa (Panaji Port ) 0.00 140.00 0.00 140.00 0.00 0.00Karnataka 0.00 2889.00 0.00 0.00 0.00 2889.00Andhra Pradesh 0.00 0.00 0.00 0.00 0.00 0.00Tamil Nadu 0.00 0.00 0.00 0.00 0.00 0.00Kerala 0.00 152.00 0.00 0.00 0.00 152.00Orissa 0.00 5639.00 580.00 0.00 0.00 5059.00
Sub Total 0.00 11468.40 628.30 140.00 9.50 10690.60B
Gujarat 620.90 69747.00 20.00 20.00 40.00 69667.00Maharashtra 155.10 4375.13 95.99 0.00 143.14 4136.00Goa (Panaji Port ) 1.00 39.30 0.00 0.00 39.30 0.00Karnataka 51.00 3494.00 300.00 0.00 0.00 3194.00Andhra Pradesh 195.20 33540.00 0.00 0.00 0.00 33540.00Tamil Nadu 50.50 6925.00 0.00 0.00 0.00 6925.00Kerala 20.12 980.00 0.00 0.00 0.00 980.00Orissa 199.24 5682.00 430.00 0.00 0.00 5252.00
Sub Total 1293.06 124782.43 845.99 20.00 222.44 123694.00
Sl. No. Name of Project Estimated Cost ( `in crores)
Source of Financing (` in Crores)
Annexure - XIIPhase - I, II & III
SUMMARY OF INVESTMENTS TO BE MADE AT MARITIME STATES FOR VARIOUS DEVELOPMENT PROJECTS1.PROJECTS FROM 01-04-2010 TO 31-03-2020
DEEPENING OF CHANNEL/BERTHS ETC
CONSTRUCTION/ RECONSTRUCTION OF BERTHS/JETTIES ETC.
ALL PHASE TOTAL
200

Capacity (In MTPA) I.R. GBS EBR and Others Private Sector
1 2 4 5 6 7 8 9
Sl. No. Name of Project Estimated Cost ( `in crores)
Source of Financing (` in Crores)
Annexure - XIIPhase - I, II & III
SUMMARY OF INVESTMENTS TO BE MADE AT MARITIME STATES FOR VARIOUS DEVELOPMENT PROJECTS1.PROJECTS FROM 01-04-2010 TO 31-03-2020
ALL PHASE TOTAL
CGujarat 0.00 76.99 76.99 0.00 0.00 0.00Maharashtra 0.00 4779.79 380.24 0.00 887.05 3512.50Goa (Panaji Port ) 0.50 23.40 0.00 15.65 7.75 0.00Karnataka 0.00 425.00 0.00 0.00 0.00 425.00Andhra Pradesh 0.00 0.00 0.00 0.00 0.00 0.00Tamil Nadu 0.00 0.00 0.00 0.00 0.00 0.00Kerala 0.00 142.00 0.00 0.00 0.00 142.00Orissa 0.00 4829.00 332.00 0.00 0.00 4497.00
Sub Total 0.50 10276.18 789.23 15.65 894.80 8576.50D
Gujarat 0.00 3522.30 146.00 1300.30 22.00 2054.00Maharashtra 0.00 1491.26 21.11 97.00 54.95 1318.20Goa (Panaji Port ) 0.00 0.00 0.00 0.00 0.00 0.00Karnataka 0.00 158.00 0.00 0.00 0.00 158.00Andhra Pradesh 0.00 0.00 0.00 0.00 0.00 0.00Tamil Nadu 0.00 0.00 0.00 0.00 0.00 0.00Kerala 0.00 347.00 0.00 0.00 0.00 347.00Orissa 0.00 3820.00 450.00 0.00 0.00 3370.00
Sub Total 0.00 9338.56 617.11 1397.30 76.95 7247.20
PROCUREMENT OF EQUIPMENTS ETC
RAIL/ROAD CONNECTIVITY WORKS
201

Capacity (In MTPA) I.R. GBS EBR and Others Private Sector
1 2 4 5 6 7 8 9
Sl. No. Name of Project Estimated Cost ( `in crores)
Source of Financing (` in Crores)
Annexure - XIIPhase - I, II & III
SUMMARY OF INVESTMENTS TO BE MADE AT MARITIME STATES FOR VARIOUS DEVELOPMENT PROJECTS1.PROJECTS FROM 01-04-2010 TO 31-03-2020
ALL PHASE TOTAL
E OTHER WORKSGujarat 0.00 0.00 0.00 0.00 0.00 0.00Maharashtra 0.00 8017.27 132.71 0.00 142.95 7741.61Goa (Panaji Port ) 0.00 0.00 0.00 0.00 0.00 0.00Karnataka 0.00 92.00 0.00 0.00 0.00 92.00Andhra Pradesh 0.00 0.00 0.00 0.00 0.00 0.00Tamil Nadu 0.00 0.00 0.00 0.00 0.00 0.00Kerala 0.00 190.00 0.00 0.00 0.00 190.00Orissa 0.00 3766.00 665.00 0.00 0.00 3101.00
Sub Total 0.00 12065.27 797.71 0.00 142.95 11124.61Total All 1293.56 167930.84 3678.34 1572.95 1346.64 161332.91
Gujarat 620.90 74240.59 287.29 1320.30 62.00 72571.00Maharashtra 155.10 20417.55 634.05 97.00 1237.59 18448.91Goa (Panaji Port ) 1.50 202.70 0.00 155.65 47.05 0.00Karnataka 51.00 7058.00 300.00 0.00 0.00 6758.00Andhra Pradesh 195.20 33540.00 0.00 0.00 0.00 33540.00Tamil Nadu 50.50 6925.00 0.00 0.00 0.00 6925.00Kerala 20.12 1811.00 0.00 0.00 0.00 1811.00Orissa 199.24 23736.00 2457.00 0.00 0.00 21279.00
Total All 1293.56 167930.84 3678.34 1572.95 1346.64 161332.91
State Wise Total
202


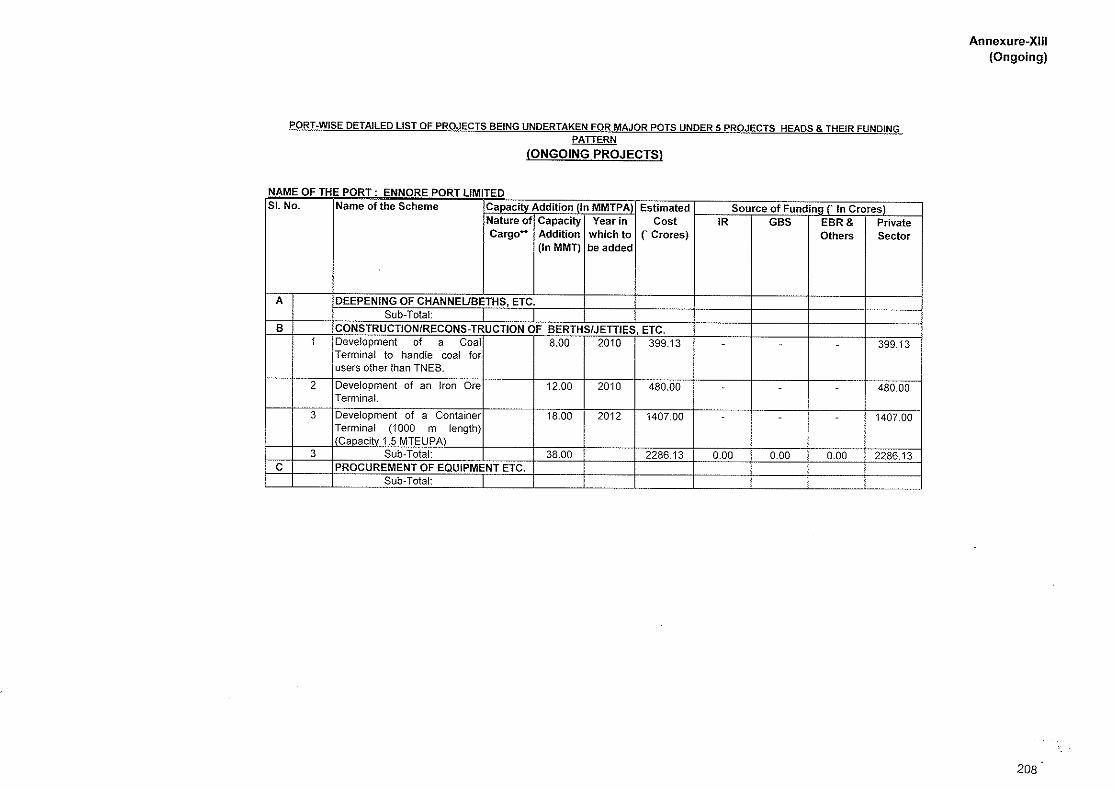
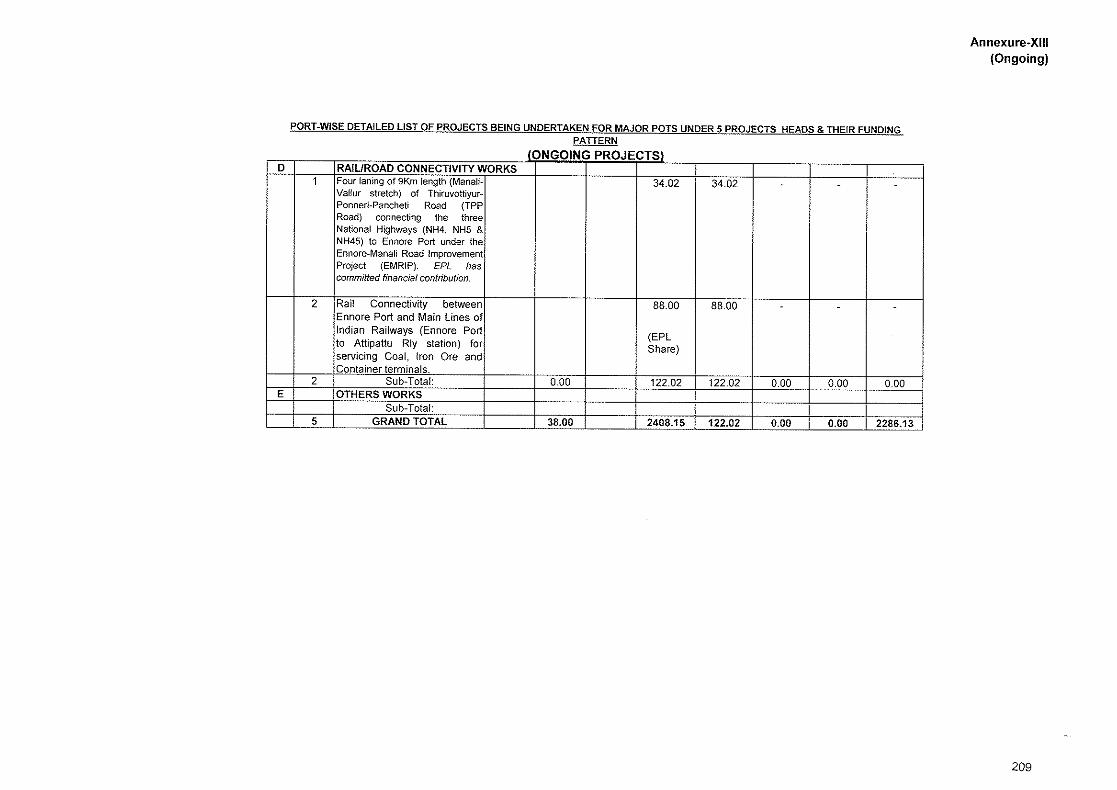


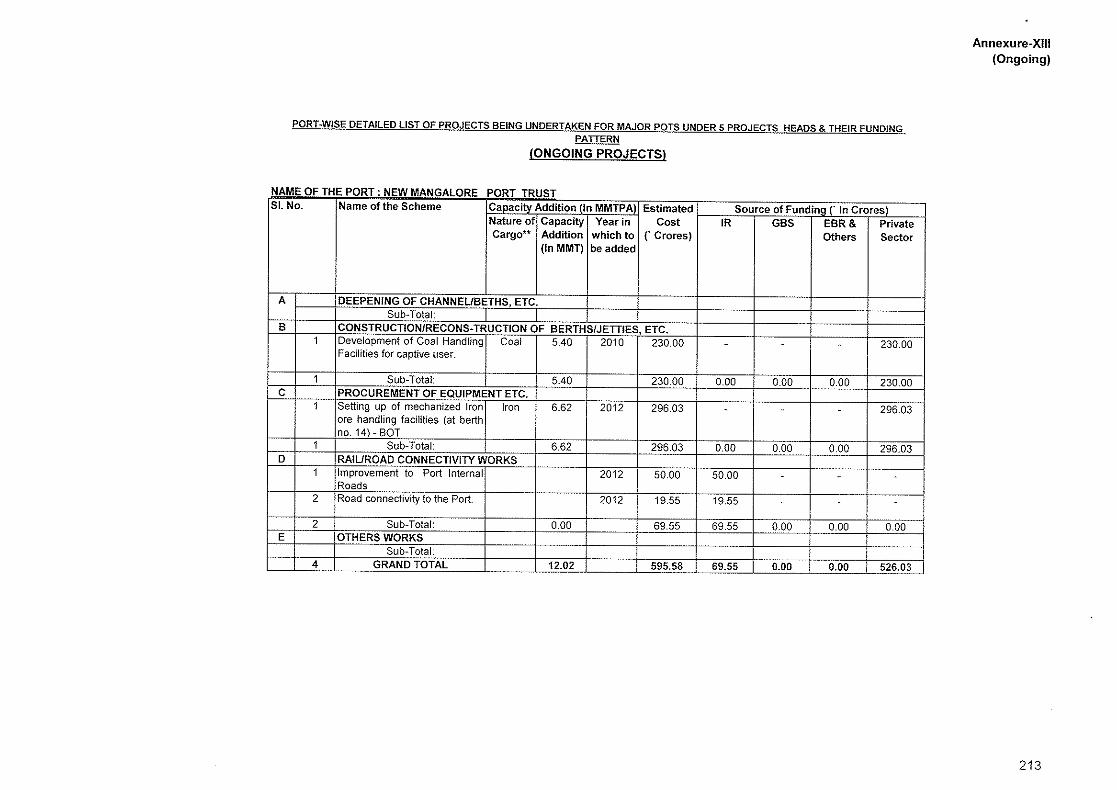

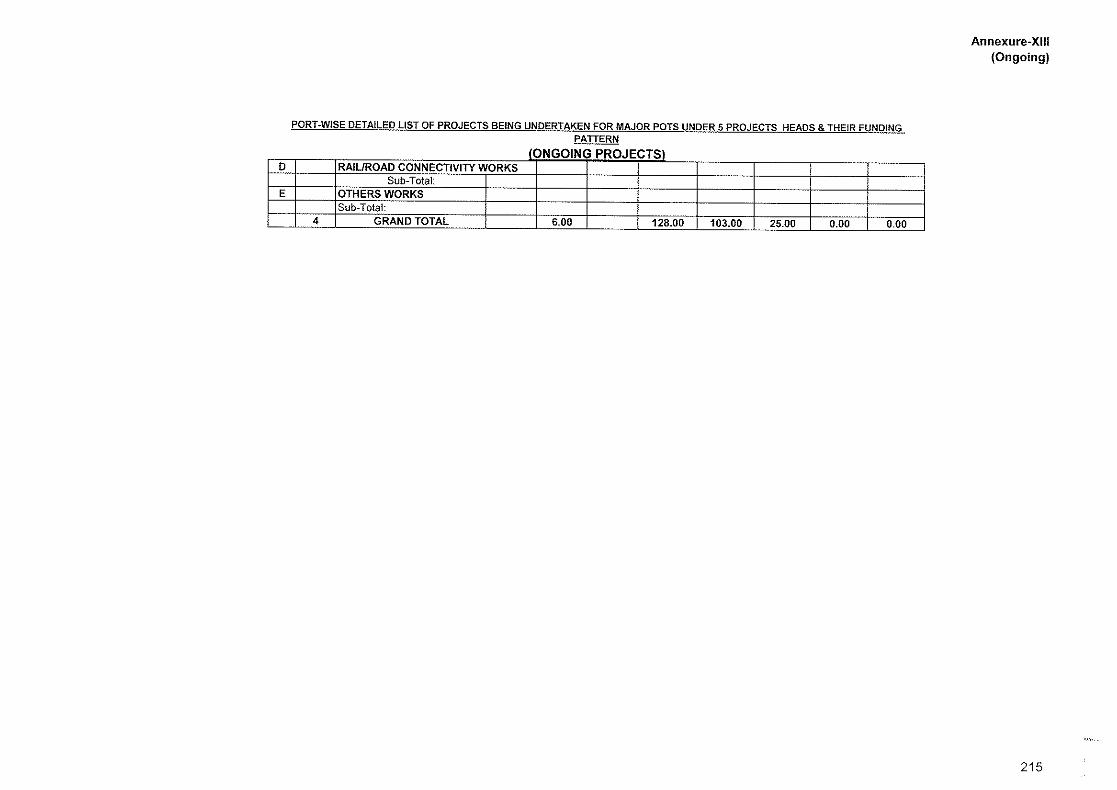
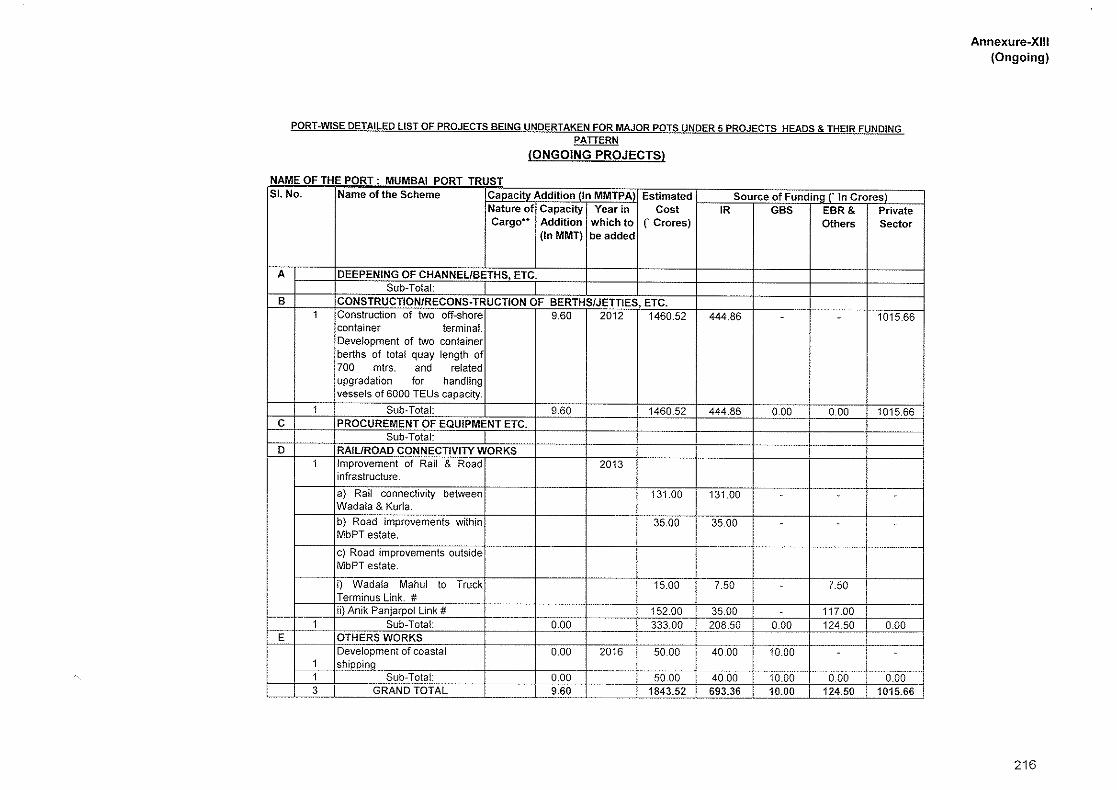
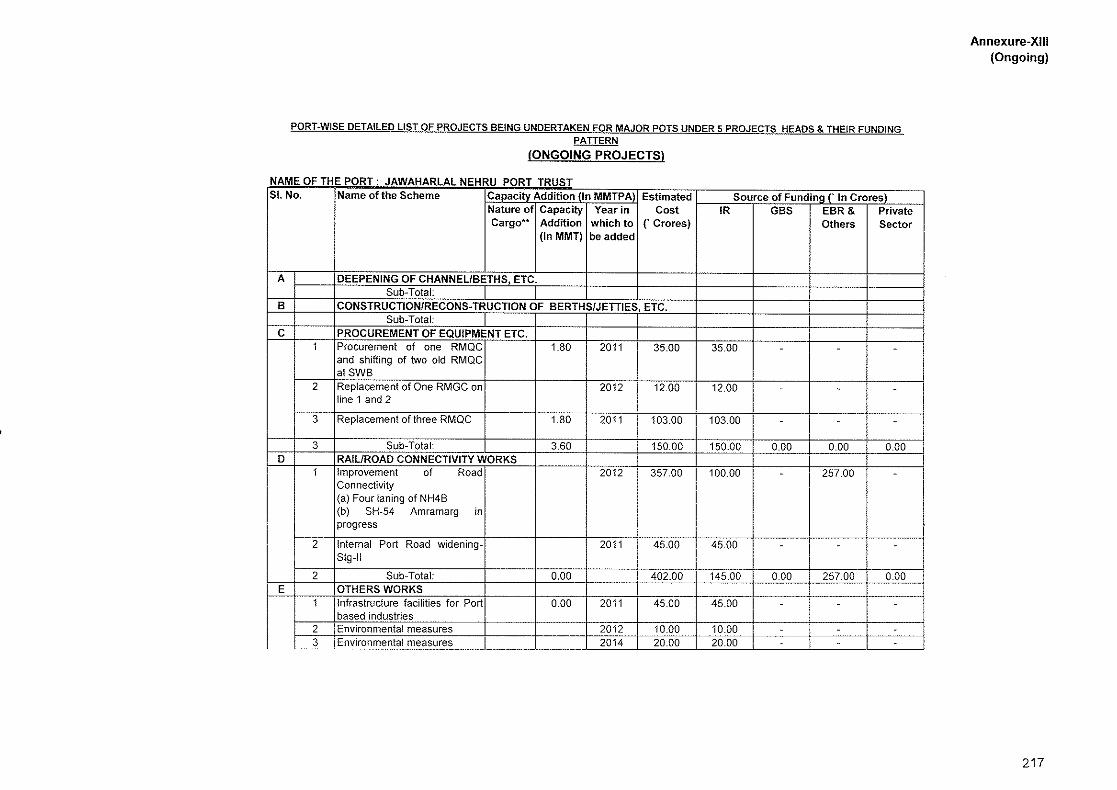
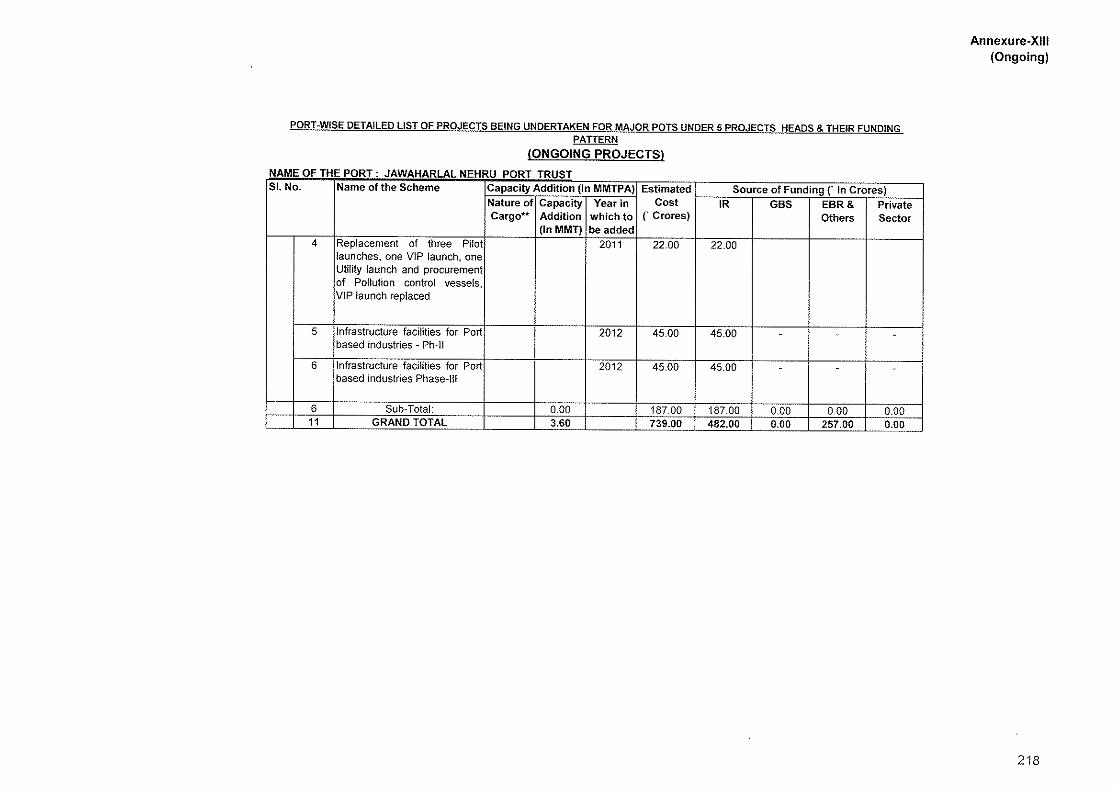

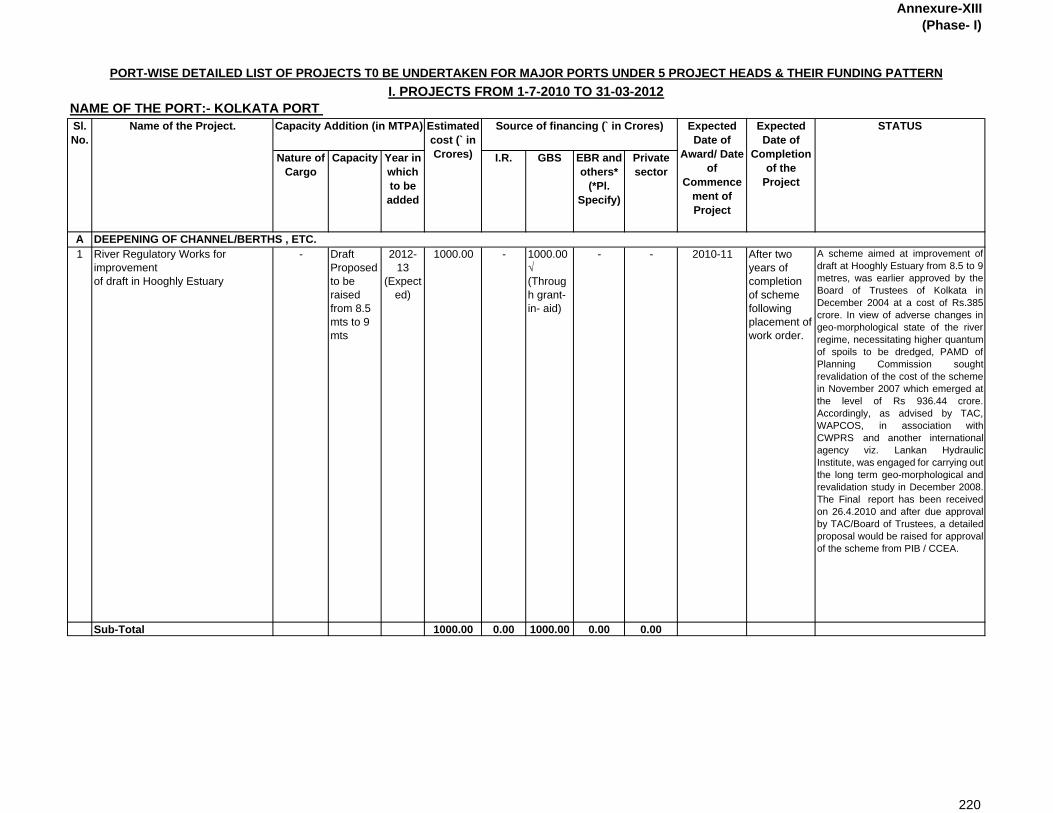
Annexure-XIII(Phase- I)
Nature of Cargo
Capacity Year in which to be added
I.R. GBS EBR and others*
(*Pl. Specify)
Private sector
A1 River Regulatory Works for
improvement of draft in Hooghly Estuary
- Draft Proposed to be raised from 8.5 mts to 9 mts
2012-13
(Expected)
1000.00 - 1000.00 √ (Through grant- in- aid)
- - 2010-11 After two years of completion of scheme following placement of work order.
A scheme aimed at improvement ofdraft at Hooghly Estuary from 8.5 to 9metres, was earlier approved by theBoard of Trustees of Kolkata inDecember 2004 at a cost of Rs.385crore. In view of adverse changes ingeo-morphological state of the riverregime, necessitating higher quantumof spoils to be dredged, PAMD ofPlanning Commission soughtrevalidation of the cost of the schemein November 2007 which emerged atthe level of Rs 936.44 crore.Accordingly, as advised by TAC,WAPCOS, in association withCWPRS and another internationalagency viz. Lankan HydraulicInstitute, was engaged for carrying outthe long term geo-morphological andrevalidation study in December 2008.The Final report has been receivedon 26.4.2010 and after due approvalby TAC/Board of Trustees, a detailedproposal would be raised for approvalof the scheme from PIB / CCEA.
Sub-Total 1000.00 0.00 1000.00 0.00 0.00
PORT-WISE DETAILED LIST OF PROJECTS T0 BE UNDERTAKEN FOR MAJOR PORTS UNDER 5 PROJECT HEADS & THEIR FUNDING PATTERNI. PROJECTS FROM 1-7-2010 TO 31-03-2012
NAME OF THE PORT:- KOLKATA PORT Capacity Addition (in MTPA) Estimated
cost (` in Crores)
Source of financing (` in Crores) Expected Date of
Award/ Date of
Commencement of Project
STATUSSl. No.
Name of the Project. Expected Date of
Completion of the
Project
DEEPENING OF CHANNEL/BERTHS , ETC.
220

Annexure-XIII(Phase- I)
Nature of Cargo
Capacity Year in which to be added
I.R. GBS EBR and others*
(*Pl. Specify)
Private sector
PORT-WISE DETAILED LIST OF PROJECTS T0 BE UNDERTAKEN FOR MAJOR PORTS UNDER 5 PROJECT HEADS & THEIR FUNDING PATTERNI. PROJECTS FROM 1-7-2010 TO 31-03-2012
NAME OF THE PORT:- KOLKATA PORT Capacity Addition (in MTPA) Estimated
cost (` in Crores)
Source of financing (` in Crores) Expected Date of
Award/ Date of
Commencement of Project
STATUSSl. No.
Name of the Project. Expected Date of
Completion of the
Project
B1 Construction of 1 riverine Multi-
purpose jetty upstream of 3rd Oil Jetty (HDC)
Dry Bulk, container
3.27 2012-13 270.00[Estimate made by
CES]
- - - 270.00 √(Through PPP)
2010-11 2012-13
RFQ document has been issuedon 19.2. 2010 for execution of thescheme on DBFOT basis. Lastdate of receipt of offers extendedtill 31.8.2010.Exploratory effortsbeing made to examine legal/technical feasibility for awardingthe construction of the berth onnomination basis for whichMinistry's advice has beensought.
2 Construction of 1 riverine multi-purpose upstream of Haldia Lock
Dry Bulk, container
2.00 2012-13 140.00 - - - 140.00 √ Through PPP)
2011-12 2012-13
Feasibility Study is beingundertaken.
3 Transloading facilities at Sandheads/ Orissa Coast for midstream loading/ unloading of Cargo
Dry Bulk, container
6.00 2012-13 350.00(Indicative
)
- - - 350.00 √(Through PPP)
2011-12 2012-13
Expression of Interest (EOI) wasearlier invited for transloading ofdry bulk cargo at Sandheads/Konica Sand Anchorage for whichresponses were received.Ministry formed a Working Groupwith representatives of StateGovts of West Bengal, Orissaand KoPT to look into theterritorial, technical andcommercial issues involved toensure smooth operationalisationof the project, which remainedunresolved.
CONSTRUCTION /RECONSTRUCTION OF BERTHS/JETTIES, ETC.
221

Annexure-XIII(Phase- I)
Nature of Cargo
Capacity Year in which to be added
I.R. GBS EBR and others*
(*Pl. Specify)
Private sector
PORT-WISE DETAILED LIST OF PROJECTS T0 BE UNDERTAKEN FOR MAJOR PORTS UNDER 5 PROJECT HEADS & THEIR FUNDING PATTERNI. PROJECTS FROM 1-7-2010 TO 31-03-2012
NAME OF THE PORT:- KOLKATA PORT Capacity Addition (in MTPA) Estimated
cost (` in Crores)
Source of financing (` in Crores) Expected Date of
Award/ Date of
Commencement of Project
STATUSSl. No.
Name of the Project. Expected Date of
Completion of the
Project
4 Infrastructure Upgradation and Allied Works in and around Dock Area at KDS in 11th & 12th Plan
Not directly related to capacity augmentation but would help capacity augmentation scheme like berths equipment to realise their optimal efficacies
2013-14 41.90 41.90 - - - 2010-11 2013-14
2013-14 Scheme has been sanctioned bythe Board of Trustees in Feb'10.
Sub-Total 11.27 801.90 41.90 0.00 0.00 760.00C1 Procurement/Replacement of Cargo
Handling Equipment( at KDS)
Container Details may be firmed up
once the modalities of
the BOT/OOM contract are
finalised. (Capacity 1.00 million tonnes)
2012-13 - - - - √ Details may be firmed up once the modalities of the BOT/OOM contract are finalised. 2011-12
2012-13 Induction of various equipment,aimed at improved containerhandling capability of one KDSberth, including 1 Mobile HarbourCrane, 2 Reach Stackers, 3RTGs, 6 Tractor-Trailercombination has been accordedsanction by the Board of Trusteesof KoPT and NIT has since beenpublished
2 Procurement of a Research-cum-survey Craft in replacement of RSVAnusandhani
- - 2012-13 23.00 - 23.00 - - 2010-11/ 2012-13
2012-13 NIT has been issued for procurement of craft. Offers are under scrutiny.
Sub-Total 1.00 23.00 0.00 23.00 0.00 0.00D
Sub-Total 0.00 0.00 0.00 0.00 0.00E
Sub-Total 0.00 0.00 0.00 0.00 0.00OTHER WORKS
PROCUREMENT OF EQUIPMENTS ETC.
RAIL/ROAD CONNECTIVITY WORKS
222

Annexure-XIII(Phase- I)
Nature of Cargo
Capacity Year in which to be added
I.R. GBS EBR and others*
(*Pl. Specify)
Private sector
PORT-WISE DETAILED LIST OF PROJECTS T0 BE UNDERTAKEN FOR MAJOR PORTS UNDER 5 PROJECT HEADS & THEIR FUNDING PATTERNI. PROJECTS FROM 1-7-2010 TO 31-03-2012
NAME OF THE PORT:- KOLKATA PORT Capacity Addition (in MTPA) Estimated
cost (` in Crores)
Source of financing (` in Crores) Expected Date of
Award/ Date of
Commencement of Project
STATUSSl. No.
Name of the Project. Expected Date of
Completion of the
Project
GRAND TOTAL 12.27 1824.90 41.90 1023.00 0.00 760.00
223

Annexure-XIII( Phase-II)
Nature of Cargo
Capacity Year in which to be added
I.R. GBS EBR and others*
(*Pl. specify)
Private sector
A
Sub Total 0.00 0.00 0.00 0.00 0.00 0.00B1 Development of Infrastructure
and allied works viz.,Construction of four ContainerHandling Jetties at Diamondharbour Container Terminal(A/C KDS)
Container 1.65 M TEUs (or around 25 million tonnes)
2014‐15 (Indicative)
1233.00(As per
2008 estimate)
‐ ‐ ‐ 1233.00 √ (PPP)
2011‐12 2014‐15
2014‐15 Construction of four container handling jetties at theproposed Diamond Harbour Container Terminal wasearlier plsnnrf, withan envisaged cost of Rs 1233 Crore anda Projected Container traffic of 1.65 million TEUs in termsof the recommendation of a high Powered committee setup by the Ministry/Feasibility Study Undertaken by aConsultant.The Feasibility Report, as submitted by theConsultant. was approved by the Trustees in September2008but the scheme has been kepton hold,since Ministryof Defence, till recently had not agreed to transfer land atthe proposed project site. Recently Ministry of Defencehas concurred on availabitlity of land at Diamond Harbourin lieu of commensurate landat Roychawk.
2 Development of full‐fledgedCargo handling Facilities atSaugor (A/C KDS)
Dry Bulk, liquid bulk, Container
60.00 M Tonnes
2015‐16 3000.00 [Indicative]
‐ ‐ ‐ 300.00 √ (PPP)
2011‐12 2014‐15
2014‐15 The sailent details of the project were easiser around 2003‐04forwarded development of economic affairs Ministry ofFinance, whichin turn, had requested the JapaneseGovernment to carry out a feasibility study through JICA.JICA has earlier taken up a pre‐feasibility study. In themeanwshileMinistry took up a larger project vizDevelopment of deep sea port in the Coast of WestBengalon which action was to betaken by Govt of WestBengal. Accordingly the Sugarproject of KOPT became anon‐starter.As the deep sea port project has seen nodevelopment in the last three years. Expression of interest(EOI) was recently invited for development of facilitiesinitially for handling dry bulk cargo and containers atSugar Islandabout 150 km or 80 nautical miles south ofkolkata. The port facillity at Saugor will have the potentialto handle dry bulk cargo like cooking Coal, thermal coaliron ore, detc and container and also liquidcargo. Therehas been a very good response from the developers andtender has already been floated seeking engagment of aconsultancy.
3 Construction of Port Facility atSalukkhali (Haldia Dock II) (A/CHDC)
‐ 20 M Tonnes
2014‐15 (Indicative)
2000.00 ‐ ‐ ‐ 2000.00 √ (PPP)
2011‐12 2014‐15
2014‐15 NIT has already been issued for construction of fiveberths at the proposed Port facility at Salukkhali(Haldi Dock II)
PORT-WISE DETAILED LIST OF PROJECTS T0 BE UNDERTAKEN FOR MAJOR PORTS UNDER 5 PROJECT HEADS & THEIR FUNDING PATTERN
II. PROJECTS FROM 1-4-2012 TO 31-03-2017NAME OF THE PORT:- KOLKATA PORT
Sl. No.
Name of the Project. Capacity Addition (in MTPA) Estimated cost (` in Crores)
Source of financing (̀ in Crores) Expected Date of Award/ Date of
Commencement of Project
Expected Date of
Completion of the
Project
CONSTRUCTION /RECONSTRUCTION OF BERTHS/JETTIES, ETC.
STATUS
DEEPENING OF CHANNEL/BERTHS , ETC.
224

Annexure-XIII( Phase-II)
Nature of Cargo
Capacity Year in which to be added
I.R. GBS EBR and others*
(*Pl. specify)
Private sector
PORT-WISE DETAILED LIST OF PROJECTS T0 BE UNDERTAKEN FOR MAJOR PORTS UNDER 5 PROJECT HEADS & THEIR FUNDING PATTERN
II. PROJECTS FROM 1-4-2012 TO 31-03-2017NAME OF THE PORT:- KOLKATA PORT
Sl. No.
Name of the Project. Capacity Addition (in MTPA) Estimated cost (` in Crores)
Source of financing (̀ in Crores) Expected Date of Award/ Date of
Commencement of Project
Expected Date of
Completion of the
Project
STATUS
4 Construction of 6 Riverine barge Jetties ,upstream of lock Entrance at HDC
‐ 4.5 M Tonnes
2012‐13 300.00 ‐ ‐ ‐ 300.00 √ (PPP)
2011‐12 2012‐13
2012‐13
5 Works of Civic Infrastructureincluding augmentationschemes (A/C HDC)
‐ Not directly related to capacity
augmentation but would help
capacity augmentation
scheme.
2016‐17 300.00 300.00 ‐ ‐ ‐ 2013‐14 2016‐17
2016‐17 These include works of various civic infrastructureexpected to be taken up in 12th Plan through IR atHDC of KOPT
6 Works of civic infrastructureand other allied Works (A/CKDS)
‐ ‐do‐ 2016‐18 50.00 50.00 ‐ ‐ ‐ 2013‐14 2016‐17
2016‐17 These include works of various civic infrastructureexpected to be taken up in 12th Plan through IR atKDS of KOPT
Sub Total 109.50 6883.00 350.00 0.00 0.00 6533.00C
1 Equipment Mechanisationof Betths 4b 5,9 &13atHDC
- 2.00 M Tones
2016-17 300.00 - - - 300.00 2013‐14 2016‐17
By 2016-17
2 Procurement of StackerCum Reciamer for Iron Orehandloing at Berth No 3(HDC)
- 1.00 M Tones
2012-13 24.37 (indicative)
24.37 (Under
Revision)
- - - 2013‐14 2016‐17
2016-17 In rerms of comprehensive report of Conaultant earlierengaged. KOPT Board has, in principle approved ofprocurement of 3 nos 1500 tph capacity ore Stacker -cum Reclaimer (SCR)and engagement of a ProjectManagement Consultant (PMC) with regard totendering,procurement etc of the equipment. NIT forengagement of PMC is under process.
3 Replacement procurementof various craft viz GrabDredger Midnapur, JetDredger and SuctionDredger Chumi (a/c KDS)
- - 2016-17 240.00 240.00 - - - 2013‐14 2016‐17
2016-17 Vatioud craft envisaged for procurement in 12th FiveYear Plan
4 Procurement of variousequipment viz Crawler /TyreMounted Mobile Cranesand 4 Locomotives (A/CKDS)
- - - 64.10 -
-
- 64.10 2014‐15 2016‐17
2016-17
Sub Total 3.00 628.47 264.37 0.00 0.00 364.10D RAIL/ROAD CONNECTIVITY WORKS
PROCUREMENT OF EQUIPMENTS ETC.
225
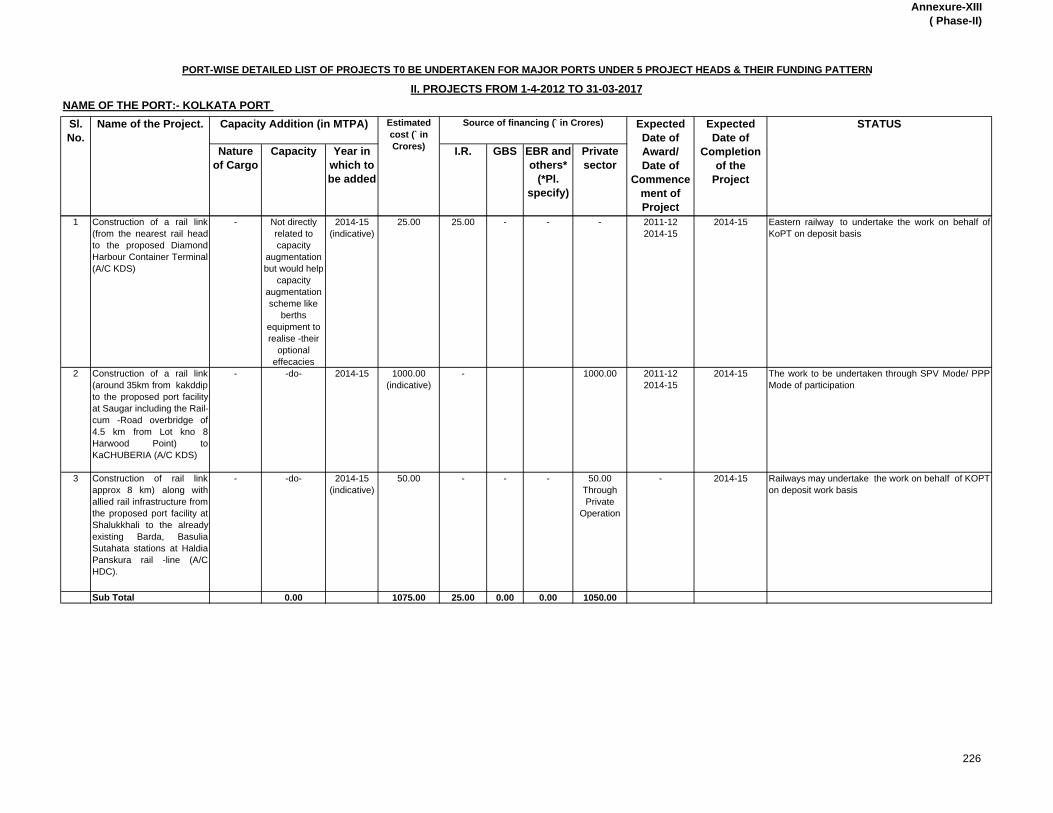
Annexure-XIII( Phase-II)
Nature of Cargo
Capacity Year in which to be added
I.R. GBS EBR and others*
(*Pl. specify)
Private sector
PORT-WISE DETAILED LIST OF PROJECTS T0 BE UNDERTAKEN FOR MAJOR PORTS UNDER 5 PROJECT HEADS & THEIR FUNDING PATTERN
II. PROJECTS FROM 1-4-2012 TO 31-03-2017NAME OF THE PORT:- KOLKATA PORT
Sl. No.
Name of the Project. Capacity Addition (in MTPA) Estimated cost (` in Crores)
Source of financing (̀ in Crores) Expected Date of Award/ Date of
Commencement of Project
Expected Date of
Completion of the
Project
STATUS
1 Construction of a rail link(from the nearest rail headto the proposed DiamondHarbour Container Terminal(A/C KDS)
- Not directly related to capacity
augmentation but would help
capacity augmentation scheme like
berths equipment to realise -their
optional effecacies
2014-15 (indicative)
25.00 25.00 - - - 2011-12 2014-15
2014-15 Eastern railway to undertake the work on behalf ofKoPT on deposit basis
2 Construction of a rail link(around 35km from kakddipto the proposed port facilityat Saugar including the Rail-cum -Road overbridge of4.5 km from Lot kno 8Harwood Point) toKaCHUBERIA (A/C KDS)
- -do- 2014-15 1000.00 (indicative)
- 1000.00 2011-12 2014-15
2014-15 The work to be undertaken through SPV Mode/ PPPMode of participation
3 Construction of rail linkapprox 8 km) along withallied rail infrastructure fromthe proposed port facility atShalukkhali to the alreadyexisting Barda, BasuliaSutahata stations at HaldiaPanskura rail -line (A/CHDC).
- -do- 2014-15 (indicative)
50.00 - - - 50.00 Through Private
Operation
- 2014-15 Railways may undertake the work on behalf of KOPTon deposit work basis
Sub Total 0.00 1075.00 25.00 0.00 0.00 1050.00
226

Annexure-XIII( Phase-II)
Nature of Cargo
Capacity Year in which to be added
I.R. GBS EBR and others*
(*Pl. specify)
Private sector
PORT-WISE DETAILED LIST OF PROJECTS T0 BE UNDERTAKEN FOR MAJOR PORTS UNDER 5 PROJECT HEADS & THEIR FUNDING PATTERN
II. PROJECTS FROM 1-4-2012 TO 31-03-2017NAME OF THE PORT:- KOLKATA PORT
Sl. No.
Name of the Project. Capacity Addition (in MTPA) Estimated cost (` in Crores)
Source of financing (̀ in Crores) Expected Date of Award/ Date of
Commencement of Project
Expected Date of
Completion of the
Project
STATUS
E1 Setting up of New
Passenger Terminal (A/CKDS).
- - - 4.00 (indicative)
- - - 4.00 Through Private
Operation
- - Parcel of land along the Bank of River Hooghly atMillenium Park has already been licensed fordeveloment of cruise tourism in the river which isplying up to Sunderbans; another location at OutramJetty No 12 has been assigned to an operator sinceOct 06 for operation of local River Cruises which alsohas started.
2 Setting up of IWTTerminals, development ofMechanised loading/unloading facilities at theIWT Terminal (A/C KDS).
- 0.50 MTones
- 100.00 (indicative)
40.00 - - 60.00 Through Private
Operation
- 2016-17 Several private jettities as well as those by IWAIhave come up/ are under construction along the riverbank (Botentical Gardens, Budge etc) which wouldcater to movement of traffic though iwt mode. Amodern IWT Terminal is also being constructed byIWAI in Kolkatta for which KOPT has allotted land atNo 2 Garden Reach Jetty. Also IWAI has beenrequested to come up with a technical Feasibilitystudy along with State Govt for construction of jetty etcat Haldia where around 4 acres of KOPT land andaround 7.
Sub Total 0.50 104.00 40.00 0.00 0.00 64.00GRAND TOTAL 113.00 8690.47 679.37 0.00 0.00 8011.10
OTHER WORKS
227
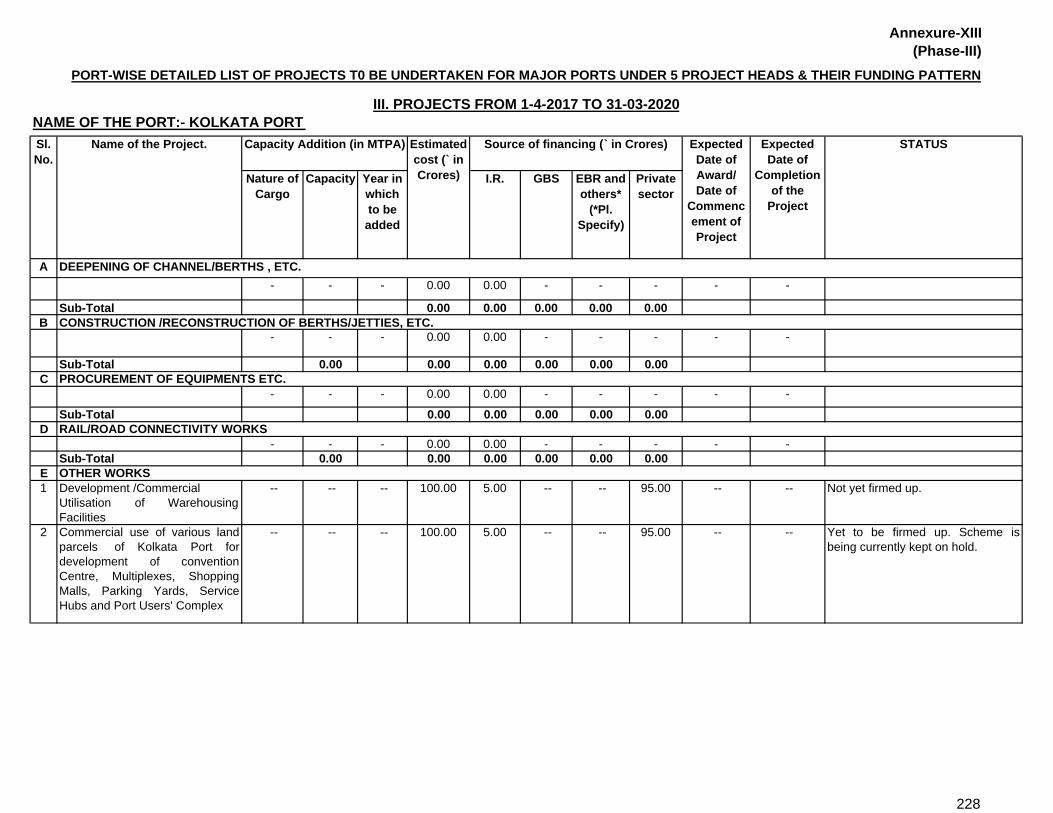
Annexure-XIII(Phase-III)
Nature of Cargo
Capacity Year in which to be
added
I.R. GBS EBR and others*
(*Pl. Specify)
Private sector
A- - - 0.00 0.00 - - - - -
Sub-Total 0.00 0.00 0.00 0.00 0.00B
- - - 0.00 0.00 - - - - -
Sub-Total 0.00 0.00 0.00 0.00 0.00 0.00C
- - - 0.00 0.00 - - - - -
Sub-Total 0.00 0.00 0.00 0.00 0.00D
- - - 0.00 0.00 - - - - -Sub-Total 0.00 0.00 0.00 0.00 0.00 0.00
E1 Development /Commercial
Utilisation of WarehousingFacilities
-- -- -- 100.00 5.00 -- -- 95.00 -- -- Not yet firmed up.
2 Commercial use of various landparcels of Kolkata Port fordevelopment of conventionCentre, Multiplexes, ShoppingMalls, Parking Yards, ServiceHubs and Port Users' Complex
-- -- -- 100.00 5.00 -- -- 95.00 -- -- Yet to be firmed up. Scheme isbeing currently kept on hold.
RAIL/ROAD CONNECTIVITY WORKS
OTHER WORKS
PORT-WISE DETAILED LIST OF PROJECTS T0 BE UNDERTAKEN FOR MAJOR PORTS UNDER 5 PROJECT HEADS & THEIR FUNDING PATTERN
III. PROJECTS FROM 1-4-2017 TO 31-03-2020NAME OF THE PORT:- KOLKATA PORT Sl. No.
Name of the Project. Capacity Addition (in MTPA) Estimated cost (` in Crores)
Source of financing (` in Crores) STATUS
DEEPENING OF CHANNEL/BERTHS , ETC.
CONSTRUCTION /RECONSTRUCTION OF BERTHS/JETTIES, ETC.
PROCUREMENT OF EQUIPMENTS ETC.
Expected Date of Award/ Date of
Commencement of Project
Expected Date of
Completion of the
Project
228

Annexure-XIII(Phase-III)
Nature of Cargo
Capacity Year in which to be
added
I.R. GBS EBR and others*
(*Pl. Specify)
Private sector
PORT-WISE DETAILED LIST OF PROJECTS T0 BE UNDERTAKEN FOR MAJOR PORTS UNDER 5 PROJECT HEADS & THEIR FUNDING PATTERN
III. PROJECTS FROM 1-4-2017 TO 31-03-2020NAME OF THE PORT:- KOLKATA PORT Sl. No.
Name of the Project. Capacity Addition (in MTPA) Estimated cost (` in Crores)
Source of financing (` in Crores) STATUSExpected Date of Award/ Date of
Commencement of Project
Expected Date of
Completion of the
Project
3 Development of Riverfront &existing Ghats in River Hooghlyfor promotion of tourism,Amusement Parks & setting up ofFood Marts, Cafetarias,Meditation Centres, Health Hubslike Ayurvedic Therapy Centres.Development of Vedic Villagessetting up of Parks and Gardens,shops & other establishments
-- -- -- 60.00 35.00 -- -- 25.00 -- -- Barring beautification of a few ghatsalong the river front , the schemeover-all is yet to be firmed up. Beingcurrently kept on hold.
Sub-Total -- -- -- 260.00 45.00 0.00 0.00 215.00 -- --GRAND TOTAL 260.00 45.00 0.00 0.00 215.00
229

Annexure-XIII(Phase- I)
Nature of Cargo
Capacity Year in which to be added
I.R. GBS EBR and others*
(*Pl. Specify)
Private sector
A1 Enhancement of draught at existing
dock system from 12.5 m to 14.0 mto cater to Panamax Vessels.
-- 5.00 ( 2.5 POL
& 2.5 Thermal
Coal)
2011 40.00 40.00 -- -- -- Nov.,2010 May,2011 Bids received on 09.07.2010 andare under scrutiny.
Sub-Total 5.00 40.00 40.00B1 Development of Multi Purpose
Berth to handle clean cargoincluding container on BOT basis.
Clean cargo,
container
5.00 2014 387.31 58.20 -- -- 329.11 05.07.2010/ Jul.,2011
Jun.,2014 Financial bids opened on23.06.2010. Letter of Award hasbeen issued in favour of H1bidder (Consortium of Sterlite -Leighton).
2 Construction of Southern Oil Jettyat Paradip Port.
Crude Oil/POL Products
10.00 2013 191.09 191.09 -- -- -- Oct.,2011 Mar.,2013 EFC memorandum has beensubmitted to Ministry on22.05.2010. The queries raised byMinistry on capital cost andproject completion period havebeen complied. The project is atappraisal stage.
3 Extension of Break Water -- -- -- 6.00 6.00 -- -- -- Nov.,2010 Oct.,2011 Bids have been received on21.05.2010 & are underevaluation.
4 Installation of 2nd SPM by IOCL (Ph-I) & Installation of 3rd SPM byIOCL (Ph-II).
Crude Oil 11.00 11.00
2012 2013
1492.33 -- -- 1492.33(IOCL)
-- Dec.,2010 Apr.,2012 Apr., 2013
This will be taken up by Indian OilCorporation Ltd.
Sub-Total 37.00 2076.73 255.29 1492.33 329.11
Expected Date of
Completion of the Project
DEEPENING OF CHANNEL/BERTHS , ETC.
CONSTRUCTION /RECONSTRUCTION OF BERTHS/JETTIES, ETC.
Estimated cost (` in Crores)
Source of financing (̀ in Crores)
PORT-WISE DETAILED LIST OF PROJECTS T0 BE UNDERTAKEN FOR MAJOR PORTS UNDER 5 PROJECT HEADS & THEIR FUNDING PATTERN
I. PROJECTS FROM 1-7-2010 TO 31-03-2012NAME OF THE PORT:- PARADIP PORT TRUST
Capacity Addition (in MTPA) Expected Date of
Award/ Date of
Commencement of Project
STATUSSl. No.
Name of the Project.
230

Annexure-XIII(Phase- I)
Nature of Cargo
Capacity Year in which to be added
I.R. GBS EBR and others*
(*Pl. Specify)
Private sector
Expected Date of
Completion of the Project
Estimated cost (` in Crores)
Source of financing (̀ in Crores)
PORT-WISE DETAILED LIST OF PROJECTS T0 BE UNDERTAKEN FOR MAJOR PORTS UNDER 5 PROJECT HEADS & THEIR FUNDING PATTERN
I. PROJECTS FROM 1-7-2010 TO 31-03-2012NAME OF THE PORT:- PARADIP PORT TRUST
Capacity Addition (in MTPA) Expected Date of
Award/ Date of
Commencement of Project
STATUSSl. No.
Name of the Project.
C1 Replacement & Procurement of
Locomotives (1 No.) -- -- -- 11.00 11.00 -- -- -- Jan.,2011 Mar.,2012 Continuing Schemes:-
New Procurement- 1No.Replacement- 3 Nos.New locomotive was procured on23.07.08.1st & 2nd replacementlocomotives were procured on16.07.08 & 16.03.10 respectively.This 3rd replacement locomotiveis likely to be procured by31.03.2012.
2 Replacement of Wagon Tippler (1 No.)
-- -- -- 9.68 9.68 -- -- -- Feb.,2012 Aug.,2013 Continuing Schemes:- LOI &W.O. have been issued forreplacement of one WagonTippler at a cost of Rs. 0.87Crores. This work is likely to becompleted by 07.11.2012. This2nd replacement is likely to becompleted by 31.08.2013.
3 Mechanization of CQ 3 berth Pellets 4.00 Mar 2012
50.00 - -- -- 50.00 Dec.,2010 Mar.,2012
Sub-Total 4.00 70.68 20.68 0.00 0.00 50.00D
Sub-TotalNIL
PROCUREMENT OF EQUIPMENTS ETC.
RAIL/ROAD CONNECTIVITY WORKS
231
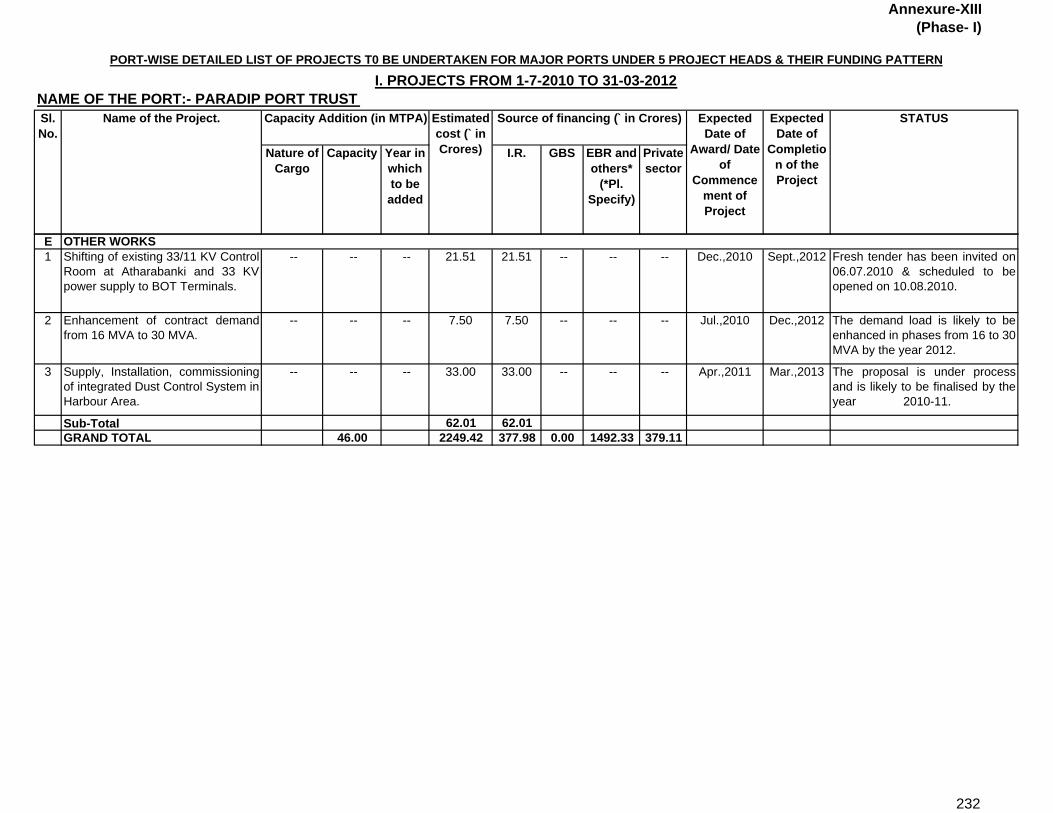
Annexure-XIII(Phase- I)
Nature of Cargo
Capacity Year in which to be added
I.R. GBS EBR and others*
(*Pl. Specify)
Private sector
Expected Date of
Completion of the Project
Estimated cost (` in Crores)
Source of financing (̀ in Crores)
PORT-WISE DETAILED LIST OF PROJECTS T0 BE UNDERTAKEN FOR MAJOR PORTS UNDER 5 PROJECT HEADS & THEIR FUNDING PATTERN
I. PROJECTS FROM 1-7-2010 TO 31-03-2012NAME OF THE PORT:- PARADIP PORT TRUST
Capacity Addition (in MTPA) Expected Date of
Award/ Date of
Commencement of Project
STATUSSl. No.
Name of the Project.
E1 Shifting of existing 33/11 KV Control
Room at Atharabanki and 33 KVpower supply to BOT Terminals.
-- -- -- 21.51 21.51 -- -- -- Dec.,2010 Sept.,2012 Fresh tender has been invited on06.07.2010 & scheduled to beopened on 10.08.2010.
2 Enhancement of contract demandfrom 16 MVA to 30 MVA.
-- -- -- 7.50 7.50 -- -- -- Jul.,2010 Dec.,2012 The demand load is likely to beenhanced in phases from 16 to 30MVA by the year 2012.
3 Supply, Installation, commissioningof integrated Dust Control System inHarbour Area.
-- -- -- 33.00 33.00 -- -- -- Apr.,2011 Mar.,2013 The proposal is under processand is likely to be finalised by theyear 2010-11.
Sub-Total 62.01 62.01GRAND TOTAL 46.00 2249.42 377.98 0.00 1492.33 379.11
OTHER WORKS
232

Annexure-XIII(Phase-II)
Nature of Cargo
Capacity Year in which to be
added
I.R. GBS EBR and others*
(*Pl. specify)
Private sector
A
1 Deepening of Channel toincrease draught from 16.0 m to18.5 m to handle 1,85,000 DWTVessels.
-- -- -- 260.00 130.00 130.00 -- -- Jul.,2014 Jun.,2015 The proposal will be processed afteraward of the offshore Breakwater.
Sub-Total 260.00 130.00 130.00B1 Development of Western Dock on
BOT basis at Paradip Port.Bulk
Cargo like Iron ore, coal etc.
15.00 2014 530.00 60.00 -- -- 470.00 Jul.,2012 Jun.,2014 In the process of DPR study.
2 Construction of OffshoreBreakwater.
-- -- -- 1000.00 1000.00 -- -- -- Jul.,2012 Jun.,2015 Bids have been received forpreparation of DPR, DetailedEngineering & EnvironmentalImpact Assessment study.
Sub-Total 15.00 1530.00 1060.00 470.00C1 Replacement & Procurement of
Locomotives (3 Nos.) -- -- -- 50.60 50.60 -- -- -- Sep.,2013 Dec.,2018 One locomotive will be replaced by
31.12.2014, the work order of whichis likely to be issued by 30.09.2013.Another two locomotives will bereplaced by 31.12.2016, the workorder of which is likely to be issuedby 30.09.2015.
Sub-Total 50.60 50.60
STATUS
DEEPENING OF CHANNEL/BERTHS , ETC.
CONSTRUCTION /RECONSTRUCTION OF BERTHS/JETTIES, ETC.
PROCUREMENT OF EQUIPMENTS ETC.
Estimated cost (` in Crores)
Source of financing (` in Crores)
PORT-WISE DETAILED LIST OF PROJECTS T0 BE UNDERTAKEN FOR MAJOR PORTS UNDER 5 PROJECT HEADS & THEIR FUNDING PATTERN
II. PROJECTS FROM 1-4-2012 TO 31-03-2017NAME OF THE PORT:- PARADIP PORT TRUST Sl. No.
Name of the Project. Capacity Addition (in MTPA) Expected Date of Award/ Date of
Commencement of Project
Expected Date of
Completion of the Project
333
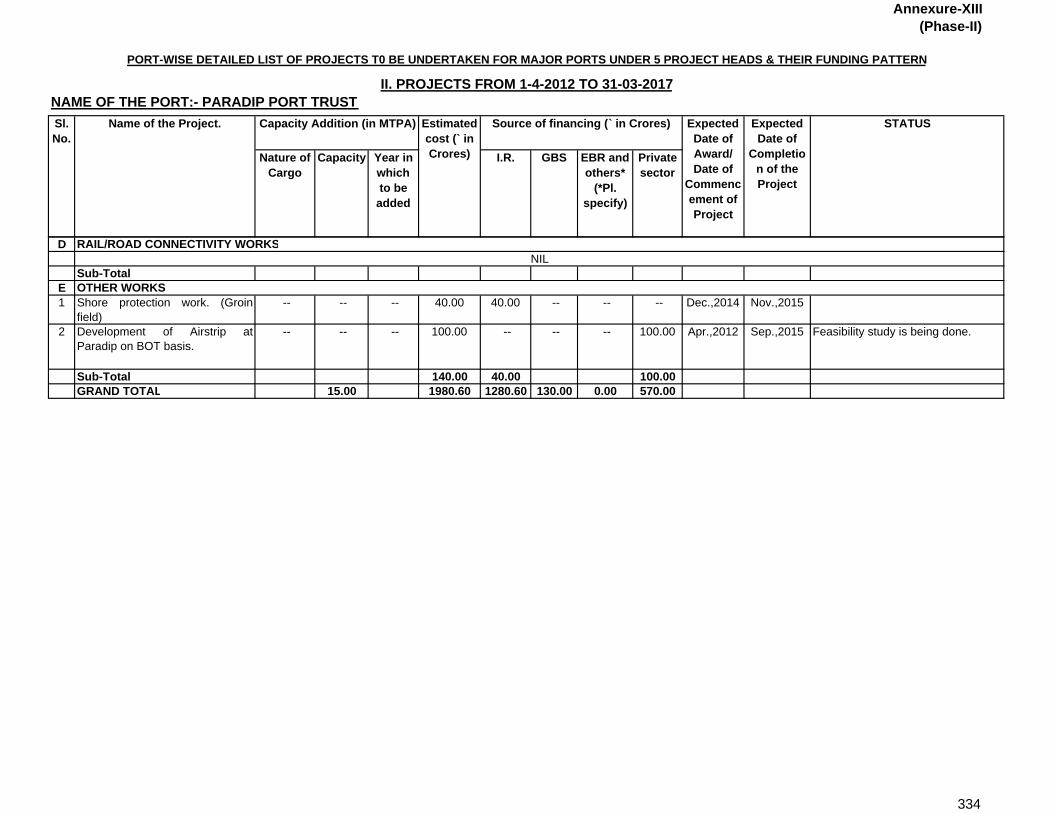
Annexure-XIII(Phase-II)
Nature of Cargo
Capacity Year in which to be
added
I.R. GBS EBR and others*
(*Pl. specify)
Private sector
STATUSEstimated cost (` in Crores)
Source of financing (` in Crores)
PORT-WISE DETAILED LIST OF PROJECTS T0 BE UNDERTAKEN FOR MAJOR PORTS UNDER 5 PROJECT HEADS & THEIR FUNDING PATTERN
II. PROJECTS FROM 1-4-2012 TO 31-03-2017NAME OF THE PORT:- PARADIP PORT TRUST Sl. No.
Name of the Project. Capacity Addition (in MTPA) Expected Date of Award/ Date of
Commencement of Project
Expected Date of
Completion of the Project
D
Sub-TotalE1 Shore protection work. (Groin
field) -- -- -- 40.00 40.00 -- -- -- Dec.,2014 Nov.,2015
2 Development of Airstrip atParadip on BOT basis.
-- -- -- 100.00 -- -- -- 100.00 Apr.,2012 Sep.,2015 Feasibility study is being done.
Sub-Total 140.00 40.00 100.00GRAND TOTAL 15.00 1980.60 1280.60 130.00 0.00 570.00
RAIL/ROAD CONNECTIVITY WORKS
OTHER WORKS
NIL
334
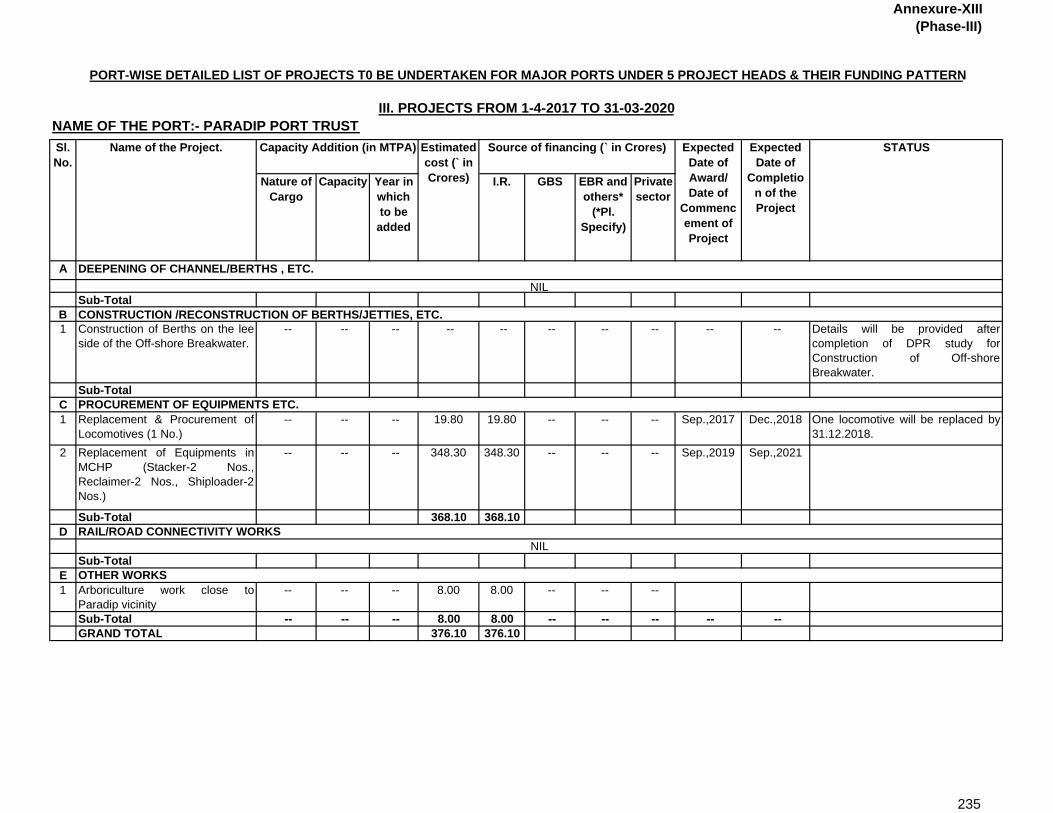
Annexure-XIII(Phase-III)
Nature of Cargo
Capacity Year in which to be
added
I.R. GBS EBR and others*
(*Pl. Specify)
Private sector
A
Sub-TotalB1 Construction of Berths on the lee
side of the Off-shore Breakwater. -- -- -- -- -- -- -- -- -- -- Details will be provided after
completion of DPR study forConstruction of Off-shoreBreakwater.
Sub-TotalC1 Replacement & Procurement of
Locomotives (1 No.) -- -- -- 19.80 19.80 -- -- -- Sep.,2017 Dec.,2018 One locomotive will be replaced by
31.12.2018.2 Replacement of Equipments in
MCHP (Stacker-2 Nos.,Reclaimer-2 Nos., Shiploader-2Nos.)
-- -- -- 348.30 348.30 -- -- -- Sep.,2019 Sep.,2021
Sub-Total 368.10 368.10D
Sub-TotalE1 Arboriculture work close to
Paradip vicinity -- -- -- 8.00 8.00 -- -- --
Sub-Total -- -- -- 8.00 8.00 -- -- -- -- --GRAND TOTAL 376.10 376.10
STATUS
DEEPENING OF CHANNEL/BERTHS , ETC.
CONSTRUCTION /RECONSTRUCTION OF BERTHS/JETTIES, ETC.
PROCUREMENT OF EQUIPMENTS ETC.
RAIL/ROAD CONNECTIVITY WORKS
OTHER WORKS
NIL
NIL
PORT-WISE DETAILED LIST OF PROJECTS T0 BE UNDERTAKEN FOR MAJOR PORTS UNDER 5 PROJECT HEADS & THEIR FUNDING PATTERN
III. PROJECTS FROM 1-4-2017 TO 31-03-2020NAME OF THE PORT:- PARADIP PORT TRUST Sl. No.
Name of the Project. Capacity Addition (in MTPA) Estimated cost (` in Crores)
Source of financing (` in Crores) Expected Date of Award/ Date of
Commencement of Project
Expected Date of
Completion of the Project
235
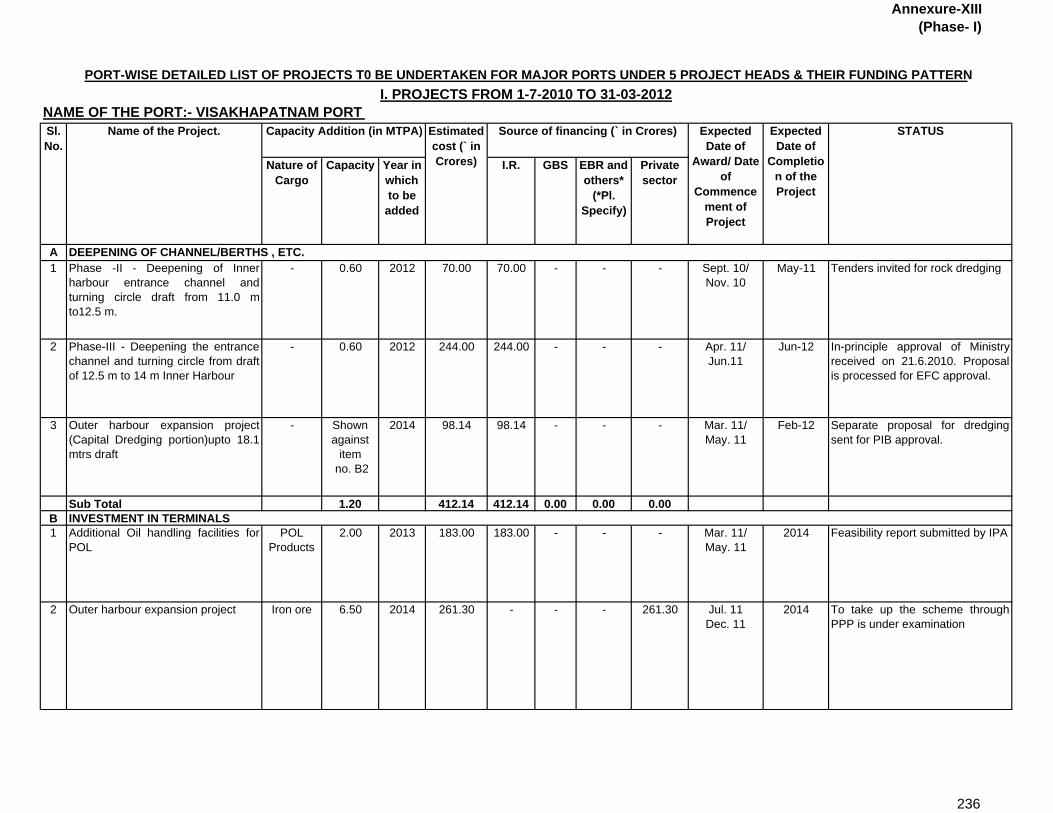
Annexure-XIII(Phase- I)
Nature of Cargo
Capacity Year in which to be
added
I.R. GBS EBR and others*
(*Pl. Specify)
Private sector
A1 Phase -II - Deepening of Inner
harbour entrance channel andturning circle draft from 11.0 mto12.5 m.
- 0.60 2012 70.00 70.00 - - - Sept. 10/Nov. 10
May-11 Tenders invited for rock dredging
2 Phase-III - Deepening the entrancechannel and turning circle from draftof 12.5 m to 14 m Inner Harbour
- 0.60 2012 244.00 244.00 - - - Apr. 11/Jun.11
Jun-12 In-principle approval of Ministryreceived on 21.6.2010. Proposalis processed for EFC approval.
3 Outer harbour expansion project(Capital Dredging portion)upto 18.1mtrs draft
- Shown against
item no. B2
2014 98.14 98.14 - - - Mar. 11/May. 11
Feb-12 Separate proposal for dredgingsent for PIB approval.
Sub Total 1.20 412.14 412.14 0.00 0.00 0.00B1 Additional Oil handling facilities for
POLPOL
Products2.00 2013 183.00 183.00 - - - Mar. 11/
May. 112014 Feasibility report submitted by IPA
2 Outer harbour expansion project Iron ore 6.50 2014 261.30 - - - 261.30 Jul. 11Dec. 11
2014 To take up the scheme throughPPP is under examination
PORT-WISE DETAILED LIST OF PROJECTS T0 BE UNDERTAKEN FOR MAJOR PORTS UNDER 5 PROJECT HEADS & THEIR FUNDING PATTERNI. PROJECTS FROM 1-7-2010 TO 31-03-2012
NAME OF THE PORT:- VISAKHAPATNAM PORT Capacity Addition (in MTPA) Estimated
cost (` in Crores)
Source of financing (` in Crores) Expected Date of
Award/ Date of
Commencement of Project
STATUSSl. No.
Name of the Project. Expected Date of
Completion of the Project
DEEPENING OF CHANNEL/BERTHS , ETC.
INVESTMENT IN TERMINALS
236

Annexure-XIII(Phase- I)
Nature of Cargo
Capacity Year in which to be
added
I.R. GBS EBR and others*
(*Pl. Specify)
Private sector
PORT-WISE DETAILED LIST OF PROJECTS T0 BE UNDERTAKEN FOR MAJOR PORTS UNDER 5 PROJECT HEADS & THEIR FUNDING PATTERNI. PROJECTS FROM 1-7-2010 TO 31-03-2012
NAME OF THE PORT:- VISAKHAPATNAM PORT Capacity Addition (in MTPA) Estimated
cost (` in Crores)
Source of financing (` in Crores) Expected Date of
Award/ Date of
Commencement of Project
STATUSSl. No.
Name of the Project. Expected Date of
Completion of the Project
3 Construction of WQ.7 Berth in theInner harbour including mechanisedhandling facilities for handlingAlumina and Other Dry bulk.(DBFOT basis)
Alumina & Other Dry
bulk
5.66 2013 239.66 - - - 239.66 Sept. 10/Dec. 10
Oct-12 Approval of the Ministry received.Award of Concession bySeptember 2010
4 Construction of WQ.8 Berth in theInner harbour including mechanisedhandling facilities for handlingAlumina and Other Dry bulk.(DBFOT basis)
Alumina & Other Dry
bulk
5.66 2013 244.66 -- -- -- 244.66 Sept. 10/Dec. 10
Oct-12 Approval of the Ministry received.Award of Concession bySeptember 2010
5 Development of WQ6 berth in theInner Harbour for Multi cargo
Multi cargo
2.08 2013 114.50 -- -- -- 114.50 31/07/2010/Oct. 10
Oct-12 Concession Agreement signed on 31.7.2010.
6 Construction of EQ10 berth in Inner harbour for liquid cargo
Liquid cargo
1.84 2013 55.38 -- -- -- 55.38 Aug. 2010/Nov. 2010
Aug-12 Project awarded. Signing of Concession agreement by August 2010
7 Strengthening of EQ7, WQ4& WQ5berths to cater to 12.5 mtrs draftvessels
Coal, fertiliser
and other bulk cargo
0.50 2012 18.00 18.00 - - - Sept. 2012 /Oct. 2012
Mar. 2014 Will be taken up afterstrengthening of 5 berths in 1stphase.
8 Development of EQ1A on Southside of EQ1 in inner harbour onDBFOT basis
Steam coal
7.36 2013 313.39 -- -- -- 313.39 Oct. 10 /Dec. 10
Dec-13 PPPAC meeting to be held by MinistryGovt. approval awaited.
9 Development of EQ 1 berth onSouth sode of East Quay byreplacement of EQ 2 berth in innerharbour on DBFOT basis.
Thermal coal
6.40 2013 323.18 -- -- -- 323.18 Oct. 10 /Dec. 10
Dec-13 PPPAC meeting to be held by MinistryGovt. approval awaited.
10 Development/ Strengthening/Modification of Berths and Jetties
Multi cargo
0.50 2012 70.00 70.00 -- -- -- --
a) WQ1 return end upto RCC lay byjetty
- - 2011 (21.00) (21.00) -- -- -- Sept. 10/Oct. 10
Mar-12
b) WQ8 return end - - 2011 (19.00) (19.00) -- -- -- Sept. 10/Oct. 10
Mar-12
c) Development of Jetties at SLCanal
- - 2012 (21.00) (21.00) -- -- -- March-11 Sep-12 In the Process for approval
Tenders under finalisation
237
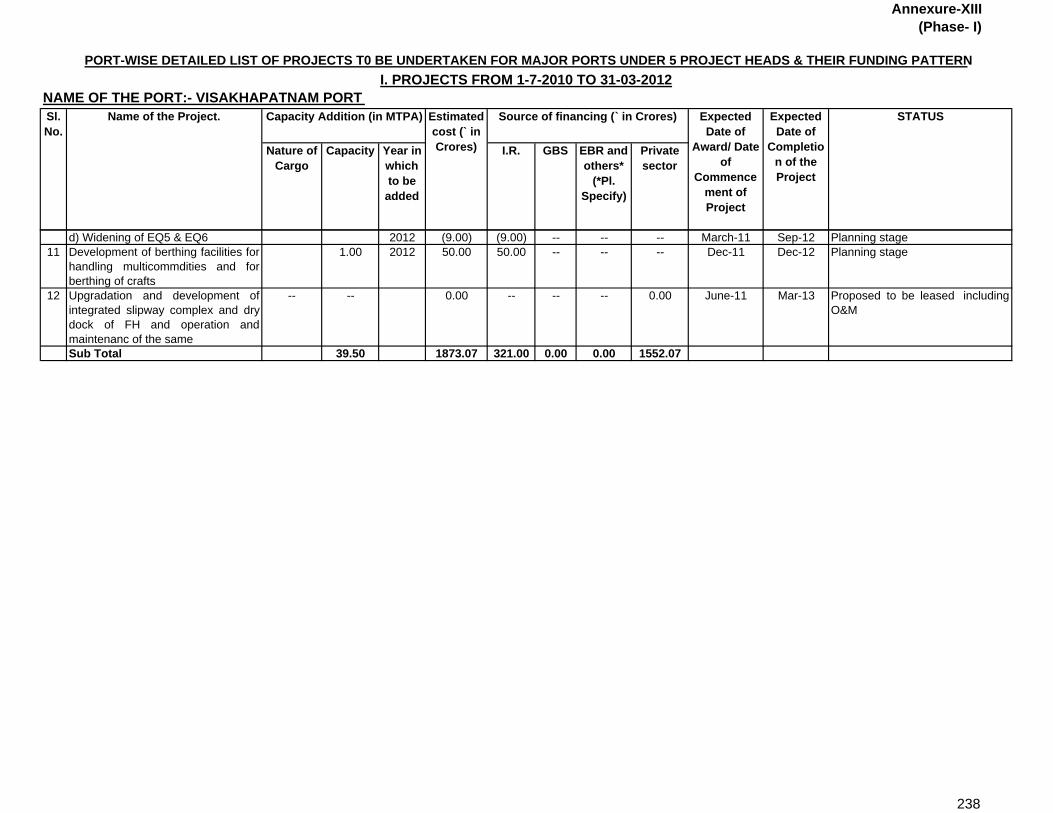
Annexure-XIII(Phase- I)
Nature of Cargo
Capacity Year in which to be
added
I.R. GBS EBR and others*
(*Pl. Specify)
Private sector
PORT-WISE DETAILED LIST OF PROJECTS T0 BE UNDERTAKEN FOR MAJOR PORTS UNDER 5 PROJECT HEADS & THEIR FUNDING PATTERNI. PROJECTS FROM 1-7-2010 TO 31-03-2012
NAME OF THE PORT:- VISAKHAPATNAM PORT Capacity Addition (in MTPA) Estimated
cost (` in Crores)
Source of financing (` in Crores) Expected Date of
Award/ Date of
Commencement of Project
STATUSSl. No.
Name of the Project. Expected Date of
Completion of the Project
d) Widening of EQ5 & EQ6 2012 (9.00) (9.00) -- -- -- March-11 Sep-12 Planning stage11 Development of berthing facilities for
handling multicommdities and forberthing of crafts
1.00 2012 50.00 50.00 -- -- -- Dec-11 Dec-12 Planning stage
12 Upgradation and development ofintegrated slipway complex and drydock of FH and operation andmaintenanc of the same
-- -- 0.00 -- -- -- 0.00 June-11 Mar-13 Proposed to be leased includingO&M
Sub Total 39.50 1873.07 321.00 0.00 0.00 1552.07
238
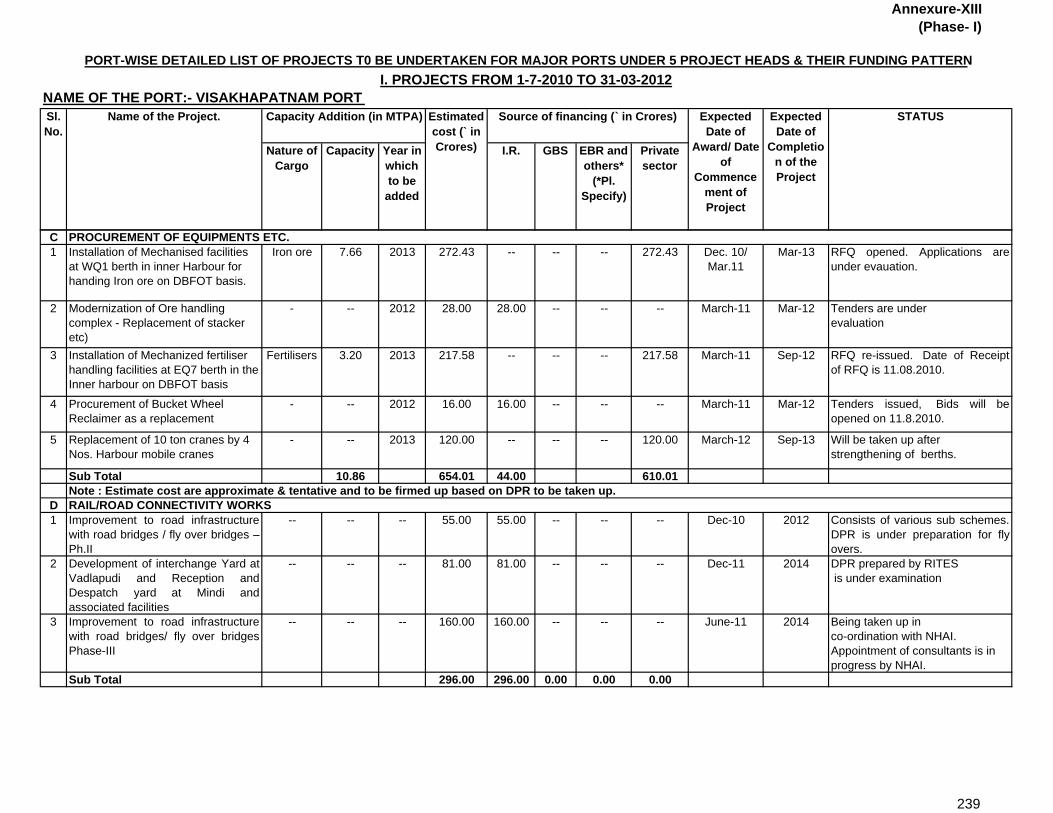
Annexure-XIII(Phase- I)
Nature of Cargo
Capacity Year in which to be
added
I.R. GBS EBR and others*
(*Pl. Specify)
Private sector
PORT-WISE DETAILED LIST OF PROJECTS T0 BE UNDERTAKEN FOR MAJOR PORTS UNDER 5 PROJECT HEADS & THEIR FUNDING PATTERNI. PROJECTS FROM 1-7-2010 TO 31-03-2012
NAME OF THE PORT:- VISAKHAPATNAM PORT Capacity Addition (in MTPA) Estimated
cost (` in Crores)
Source of financing (` in Crores) Expected Date of
Award/ Date of
Commencement of Project
STATUSSl. No.
Name of the Project. Expected Date of
Completion of the Project
C1 Installation of Mechanised facilities
at WQ1 berth in inner Harbour for handing Iron ore on DBFOT basis.
Iron ore 7.66 2013 272.43 -- -- -- 272.43 Dec. 10/Mar.11
Mar-13 RFQ opened. Applications areunder evauation.
2 Modernization of Ore handling complex - Replacement of stacker etc)
- -- 2012 28.00 28.00 -- -- -- March-11 Mar-12 Tenders are under evaluation
3 Installation of Mechanized fertiliser handling facilities at EQ7 berth in the Inner harbour on DBFOT basis
Fertilisers 3.20 2013 217.58 -- -- -- 217.58 March-11 Sep-12 RFQ re-issued. Date of Receiptof RFQ is 11.08.2010.
4 Procurement of Bucket Wheel Reclaimer as a replacement
- -- 2012 16.00 16.00 -- -- -- March-11 Mar-12 Tenders issued, Bids will beopened on 11.8.2010.
5 Replacement of 10 ton cranes by 4 Nos. Harbour mobile cranes
- -- 2013 120.00 -- -- -- 120.00 March-12 Sep-13 Will be taken up after strengthening of berths.
Sub Total 10.86 654.01 44.00 610.01Note : Estimate cost are approximate & tentative and to be firmed up based on DPR to be taken up.
D1 Improvement to road infrastructure
with road bridges / fly over bridges –Ph.II
-- -- -- 55.00 55.00 -- -- -- Dec-10 2012 Consists of various sub schemes.DPR is under preparation for flyovers.
2 Development of interchange Yard atVadlapudi and Reception andDespatch yard at Mindi andassociated facilities
-- -- -- 81.00 81.00 -- -- -- Dec-11 2014 DPR prepared by RITES is under examination
3 Improvement to road infrastructurewith road bridges/ fly over bridgesPhase-III
-- -- -- 160.00 160.00 -- -- -- June-11 2014 Being taken up in co-ordination with NHAI. Appointment of consultants is in progress by NHAI.
Sub Total 296.00 296.00 0.00 0.00 0.00
PROCUREMENT OF EQUIPMENTS ETC.
RAIL/ROAD CONNECTIVITY WORKS
239
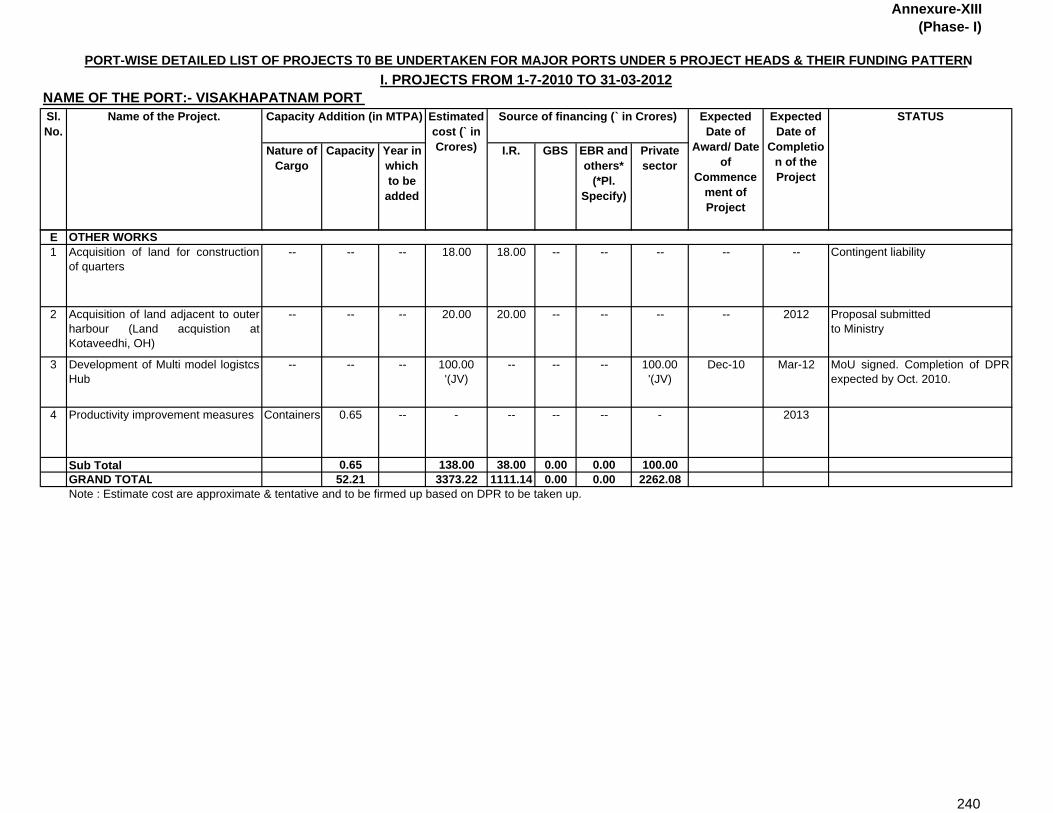
Annexure-XIII(Phase- I)
Nature of Cargo
Capacity Year in which to be
added
I.R. GBS EBR and others*
(*Pl. Specify)
Private sector
PORT-WISE DETAILED LIST OF PROJECTS T0 BE UNDERTAKEN FOR MAJOR PORTS UNDER 5 PROJECT HEADS & THEIR FUNDING PATTERNI. PROJECTS FROM 1-7-2010 TO 31-03-2012
NAME OF THE PORT:- VISAKHAPATNAM PORT Capacity Addition (in MTPA) Estimated
cost (` in Crores)
Source of financing (` in Crores) Expected Date of
Award/ Date of
Commencement of Project
STATUSSl. No.
Name of the Project. Expected Date of
Completion of the Project
E1 Acquisition of land for construction
of quarters -- -- -- 18.00 18.00 -- -- -- -- -- Contingent liability
2 Acquisition of land adjacent to outerharbour (Land acquistion atKotaveedhi, OH)
-- -- -- 20.00 20.00 -- -- -- -- 2012 Proposal submitted to Ministry
3 Development of Multi model logistcsHub
-- -- -- 100.00'(JV)
-- -- -- 100.00'(JV)
Dec-10 Mar-12 MoU signed. Completion of DPRexpected by Oct. 2010.
4 Productivity improvement measures Containers 0.65 -- - -- -- -- - 2013
Sub Total 0.65 138.00 38.00 0.00 0.00 100.00GRAND TOTAL 52.21 3373.22 1111.14 0.00 0.00 2262.08Note : Estimate cost are approximate & tentative and to be firmed up based on DPR to be taken up.
OTHER WORKS
240
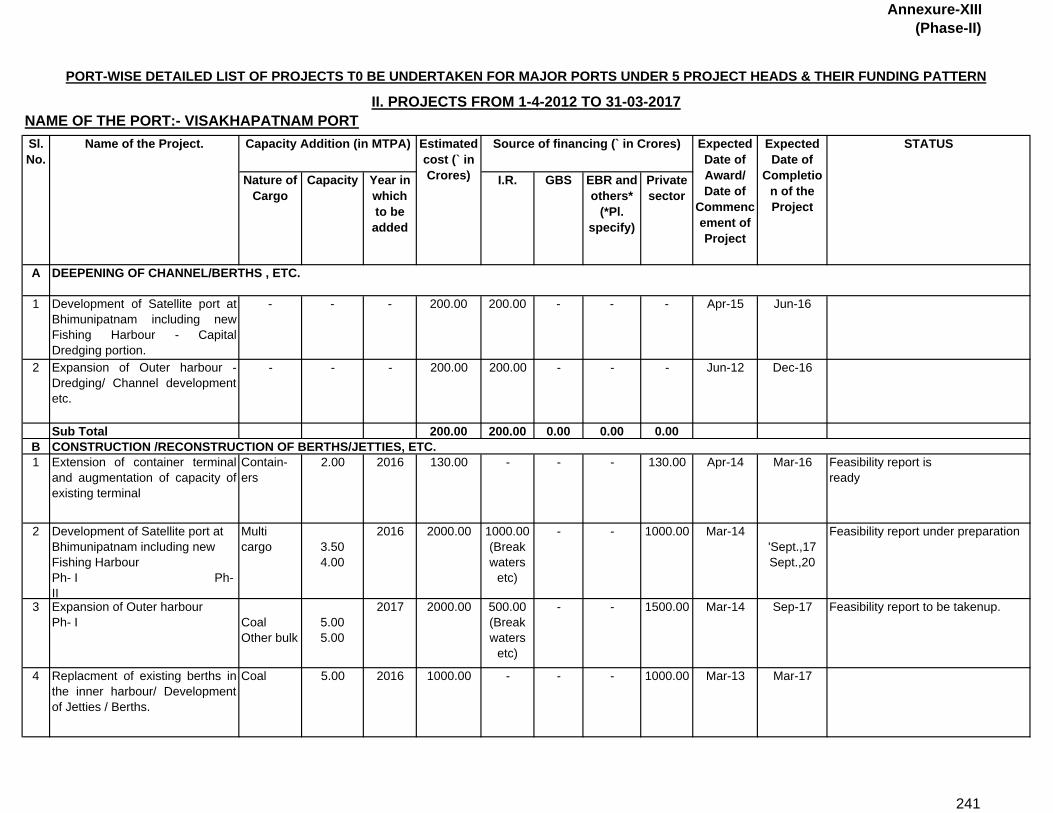
Annexure-XIII(Phase-II)
Nature of Cargo
Capacity Year in which to be added
I.R. GBS EBR and others*
(*Pl. specify)
Private sector
A
1 Development of Satellite port atBhimunipatnam including newFishing Harbour - CapitalDredging portion.
- - - 200.00 200.00 - - - Apr-15 Jun-16
2 Expansion of Outer harbour -Dredging/ Channel developmentetc.
- - - 200.00 200.00 - - - Jun-12 Dec-16
Sub Total 200.00 200.00 0.00 0.00 0.00B1 Extension of container terminal
and augmentation of capacity ofexisting terminal
Contain-ers
2.00 2016 130.00 - - - 130.00 Apr-14 Mar-16 Feasibility report is ready
2 Development of Satellite port at Bhimunipatnam including new Fishing Harbour Ph- I Ph-II
Multi cargo
3.50 4.00
2016 2000.00 1000.00(Break waters
etc)
- - 1000.00 Mar-14 'Sept.,17 Sept.,20
Feasibility report under preparation
3 Expansion of Outer harbour Ph- I
Coal Other bulk
5.00 5.00
2017 2000.00 500.00(Break waters
etc)
- - 1500.00 Mar-14 Sep-17 Feasibility report to be takenup.
4 Replacment of existing berths inthe inner harbour/ Developmentof Jetties / Berths.
Coal 5.00 2016 1000.00 - - - 1000.00 Mar-13 Mar-17
PORT-WISE DETAILED LIST OF PROJECTS T0 BE UNDERTAKEN FOR MAJOR PORTS UNDER 5 PROJECT HEADS & THEIR FUNDING PATTERN
II. PROJECTS FROM 1-4-2012 TO 31-03-2017NAME OF THE PORT:- VISAKHAPATNAM PORT Sl. No.
Name of the Project. Capacity Addition (in MTPA) Estimated cost (` in Crores)
Source of financing (` in Crores) Expected Date of Award/ Date of
Commencement of Project
Expected Date of
Completion of the Project
STATUS
DEEPENING OF CHANNEL/BERTHS , ETC.
CONSTRUCTION /RECONSTRUCTION OF BERTHS/JETTIES, ETC.
241
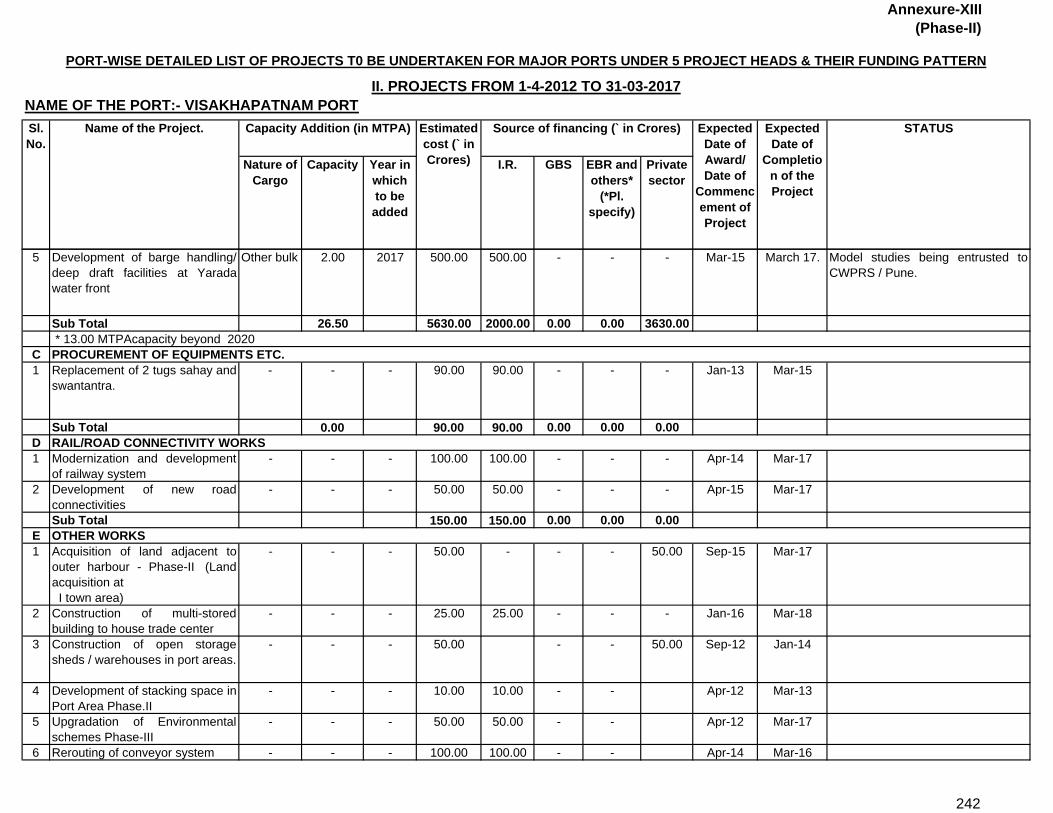
Annexure-XIII(Phase-II)
Nature of Cargo
Capacity Year in which to be added
I.R. GBS EBR and others*
(*Pl. specify)
Private sector
PORT-WISE DETAILED LIST OF PROJECTS T0 BE UNDERTAKEN FOR MAJOR PORTS UNDER 5 PROJECT HEADS & THEIR FUNDING PATTERN
II. PROJECTS FROM 1-4-2012 TO 31-03-2017NAME OF THE PORT:- VISAKHAPATNAM PORT Sl. No.
Name of the Project. Capacity Addition (in MTPA) Estimated cost (` in Crores)
Source of financing (` in Crores) Expected Date of Award/ Date of
Commencement of Project
Expected Date of
Completion of the Project
STATUS
5 Development of barge handling/deep draft facilities at Yaradawater front
Other bulk 2.00 2017 500.00 500.00 - - - Mar-15 March 17. Model studies being entrusted toCWPRS / Pune.
Sub Total 26.50 5630.00 2000.00 0.00 0.00 3630.00 * 13.00 MTPAcapacity beyond 2020
C1 Replacement of 2 tugs sahay and
swantantra.- - - 90.00 90.00 - - - Jan-13 Mar-15
Sub Total 0.00 90.00 90.00 0.00 0.00 0.00D1 Modernization and development
of railway system- - - 100.00 100.00 - - - Apr-14 Mar-17
2 Development of new roadconnectivities
- - - 50.00 50.00 - - - Apr-15 Mar-17
Sub Total 150.00 150.00 0.00 0.00 0.00E1 Acquisition of land adjacent to
outer harbour - Phase-II (Landacquisition at I town area)
- - - 50.00 - - - 50.00 Sep-15 Mar-17
2 Construction of multi-storedbuilding to house trade center
- - - 25.00 25.00 - - - Jan-16 Mar-18
3 Construction of open storagesheds / warehouses in port areas.
- - - 50.00 - - 50.00 Sep-12 Jan-14
4 Development of stacking space inPort Area Phase.II
- - - 10.00 10.00 - - Apr-12 Mar-13
5 Upgradation of Environmentalschemes Phase-III
- - - 50.00 50.00 - - Apr-12 Mar-17
6 Rerouting of conveyor system - - - 100.00 100.00 - - Apr-14 Mar-16
RAIL/ROAD CONNECTIVITY WORKS
OTHER WORKS
PROCUREMENT OF EQUIPMENTS ETC.
242

Annexure-XIII(Phase-II)
Nature of Cargo
Capacity Year in which to be added
I.R. GBS EBR and others*
(*Pl. specify)
Private sector
PORT-WISE DETAILED LIST OF PROJECTS T0 BE UNDERTAKEN FOR MAJOR PORTS UNDER 5 PROJECT HEADS & THEIR FUNDING PATTERN
II. PROJECTS FROM 1-4-2012 TO 31-03-2017NAME OF THE PORT:- VISAKHAPATNAM PORT Sl. No.
Name of the Project. Capacity Addition (in MTPA) Estimated cost (` in Crores)
Source of financing (` in Crores) Expected Date of Award/ Date of
Commencement of Project
Expected Date of
Completion of the Project
STATUS
7 Upgradationm of existinginfrastructural facilities (for allassets)
- - - - - - - Apr-12 Mar-17
8 Upgradation of ORS & dry dock - - - 100.00 - - 100.00 Jan-15 Dec-16 Proposed to leased out includingO&M
9 Information technology phase-III - - - 10.00 10.00 - - Apr-12 Mar-17
SubTotal 395.00 195.00 0.00 0.00 200.00GRAND TOTAL 26.50 6465.00 2635.00 0.00 0.00 3830.00 *13.00 MTPAcapacity beyond 2020
243

Annexure-XIII( Phase-III)
Nature of Cargo
Capacity Year in which to be
added
I.R. GBS EBR and others*
(*Pl. Specify)
Private sector
A1 Development of Second Entrance
channel to Inner Harbour- - - 1000.00 1000.00 - - - April 2018. March 2021. Fesibility to be entrusted
2 Development of existing entrancechannel into two way channel
- - - 500.00 500.00 - - - Sept 2019. March 2022. Fesibility to be entrusted
Sub-Total 0.00 1500.00 1500.00 0.00 0.00 0.00B1 Augumentation of Off Shore
Tanker Terminal (OSTT) to caterto 200000 DWT Tankers
- 2.00 100.00 100.00 - - - April 2019. March 2021.
2 Relocation of Oil mooring facilityin the Outer Harbour betweenLPG and OSTT berths
- 2.00 200.00 200.00 - - - April 2019. Sept 2020. Fesibility to be entrusted
3 Expansion of Outer Harbour -Stage -II
- 5.00 2021 2000.00 1000.00 - - 1000.00 Sept 2019. March 2022. Fesibility to be entrusted
Sub-Total 9.00 2300.00 1300.00 0.00 0.00 1000.00C
Sub-Total 0.00 0.00 0.00 0.00 0.00 0.00
PORT-WISE DETAILED LIST OF PROJECTS T0 BE UNDERTAKEN FOR MAJOR PORTS UNDER 5 PROJECT HEADS & THEIR FUNDING PATTERN
III. PROJECTS FROM 1-4-2017 TO 31-03-2020NAME OF THE PORT:- VISAKHAPATNAM PORT Sl. No.
Name of the Project. Capacity Addition (in MTPA) Estimated cost (` in Crores)
Source of financing (` in Crores) STATUS
DEEPENING OF CHANNEL/BERTHS , ETC.
CONSTRUCTION /RECONSTRUCTION OF BERTHS/JETTIES, ETC.
PROCUREMENT OF EQUIPMENTS ETC.
Expected Date of Award/ Date of
Commencement of Project
Expected Date of
Completion of the
Project
244

Annexure-XIII( Phase-III)
Nature of Cargo
Capacity Year in which to be
added
I.R. GBS EBR and others*
(*Pl. Specify)
Private sector
Sl. No.
Name of the Project. Capacity Addition (in MTPA) Estimated cost (` in Crores)
Source of financing (` in Crores) STATUSExpected Date of Award/ Date of
Commencement of Project
Expected Date of
Completion of the
Project
D1 Construction of flyover bridges in
Port operational areas. - - - 100.00 100.00 - - - Jun-17 Mar-19 Fesibility to be entrusted
2 Modernization and developmentof railway system. Phase. II
- - - 50.00 50.00 - - - Apr-17 Mar-20 Fesibility to be entrusted
3 Development of new roadconnectivities Phase.II
- - - 50.00 50.00 - - - Apr-17 Mar-20 Fesibility to be entrusted
Sub-Total 0.00 200.00 200.00 0.00 0.00 0.00E1 Development of stacking space in
Port Area Phase.III- - - 50.00 50.00 - - - Apr-17 Mar-18
2 Upgradation of Environmentalschemes Phase-IV
- - - 50.00 50.00 - - - Apr-17 Mar-18
Sub-Total - 0.00 - 100.00 100.00 0.00 0.00 0.00GRAND TOTAL 9.00 4100.00 3100.00 0.00 0.00 1000.00Note : Estimate cost are approximate & tentative and to be firmed up based on DPR to be taken up.
RAIL/ROAD CONNECTIVITY WORKS
OTHER WORKS
245
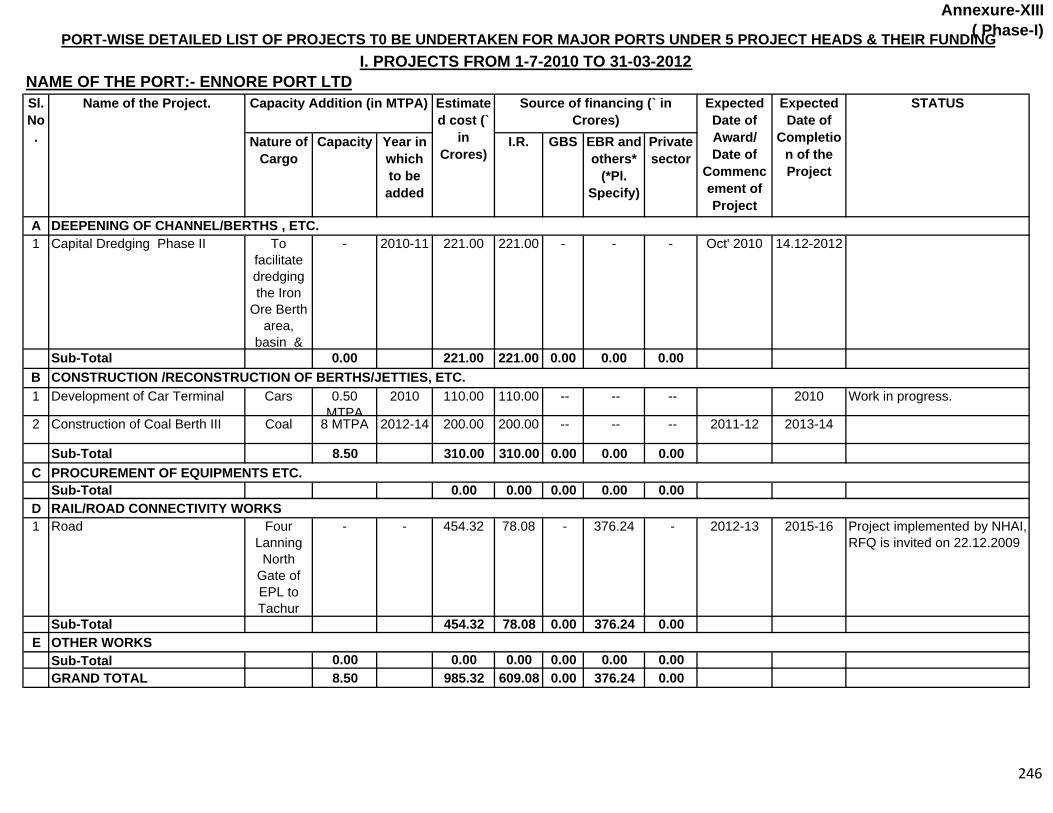
Annexure-XIII( Phase-I)
Nature of Cargo
Capacity Year in which to be added
I.R. GBS EBR and others*
(*Pl. Specify)
Private sector
A1 Capital Dredging Phase II To
facilitate dredging the Iron
Ore Berth area,
basin &
- 2010-11 221.00 221.00 - - - Oct' 2010 14.12-2012
Sub-Total 0.00 221.00 221.00 0.00 0.00 0.00B1 Development of Car Terminal Cars 0.50
MTPA2010 110.00 110.00 -- -- -- 2010 Work in progress.
2 Construction of Coal Berth III Coal 8 MTPA 2012-14 200.00 200.00 -- -- -- 2011-12 2013-14
Sub-Total 8.50 310.00 310.00 0.00 0.00 0.00C
Sub-Total 0.00 0.00 0.00 0.00 0.00D1 Road Four
Lanning North
Gate of EPL to Tachur
- - 454.32 78.08 - 376.24 - 2012-13 2015-16 Project implemented by NHAI,RFQ is invited on 22.12.2009
Sub-Total 454.32 78.08 0.00 376.24 0.00E
Sub-Total 0.00 0.00 0.00 0.00 0.00 0.00GRAND TOTAL 8.50 985.32 609.08 0.00 376.24 0.00
RAIL/ROAD CONNECTIVITY WORKS
OTHER WORKS
PROCUREMENT OF EQUIPMENTS ETC.
STATUS
DEEPENING OF CHANNEL/BERTHS , ETC.
CONSTRUCTION /RECONSTRUCTION OF BERTHS/JETTIES, ETC.
PORT-WISE DETAILED LIST OF PROJECTS T0 BE UNDERTAKEN FOR MAJOR PORTS UNDER 5 PROJECT HEADS & THEIR FUNDING I. PROJECTS FROM 1-7-2010 TO 31-03-2012
NAME OF THE PORT:- ENNORE PORT LTDSl. No.
Name of the Project. Capacity Addition (in MTPA) Estimated cost (`
in Crores)
Source of financing (` in Crores)
Expected Date of Award/ Date of
Commencement of Project
Expected Date of
Completion of the Project
246

Annexure-XIII(Phase-II)
Nature of Cargo
Capacity Year in which to be added
I.R. GBS EBR and others*
(*Pl. Specify)
Private sector
A1 Capital Dredging Phase III To
facilitate dredging
in the container
berth
- - 219.00 219.00 - - - 2012-13 2013-14 Synchronising with containterterminal project
Sub-Total 0.00 219.00 219.00 0.00 0.00 0.00B1 Beths/Jetties etc., Developm
ent ofLNG Terminal
2.50 - 100.00 - - - 100.00 2014-15 - Project is to be developed byIndion Oil Corporation
2 Beths/Jetties etc., 2nd MLTTerminal
3.00 - 200.00 200.00 - - - 2014-15 - Will be taken after 7 years ofcommercial operation of MLT1 or after achievingthroughput of 2.10 MTwhichever is earlier.
3 Upgradation of Coal HandlingFacility
Coal 4.00 - 57.00 57.00 - - - 2014-15 -
Sub-Total 9.50 357.00 257.00 0.00 0.00 100.00C
Sub-Total 0.00 0.00 0.00 0.00 0.00D1 New Chord Line linking Puttur
Attipattu To
facilitate Iron Ore Traffic
- - 446.00 223.00 - 223.00 - - - Railways are working out thefinal locations.
Sub-Total 0.00 446.00 223.00 0.00 223.00 0.00
RAIL/ROAD CONNECTIVITY WORKS
STATUS
DEEPENING OF CHANNEL/BERTHS , ETC.
CONSTRUCTION /RECONSTRUCTION OF BERTHS/JETTIES, ETC.
PROCUREMENT OF EQUIPMENTS ETC.
Estimated cost (`
in Crores)
Source of financing (` in Crores)
PORT-WISE DETAILED LIST OF PROJECTS T0 BE UNDERTAKEN FOR MAJOR PORTS UNDER 5 PROJECT HEADS & THEIR FUNDING II.PROJECTS FROM 1-4-2012 TO 31-3-2017
NAME OF THE PORT:- ENNORE PORT LTDSl. No.
Name of the Project. Capacity Addition (in MTPA) Expected Date of Award/ Date of
Commencement of Project
Expected Date of
Completion of the Project
247

Annexure-XIII(Phase-II)
Nature of Cargo
Capacity Year in which to be added
I.R. GBS EBR and others*
(*Pl. Specify)
Private sector
STATUSEstimated cost (`
in Crores)
Source of financing (` in Crores)
PORT-WISE DETAILED LIST OF PROJECTS T0 BE UNDERTAKEN FOR MAJOR PORTS UNDER 5 PROJECT HEADS & THEIR FUNDING II.PROJECTS FROM 1-4-2012 TO 31-3-2017
NAME OF THE PORT:- ENNORE PORT LTDSl. No.
Name of the Project. Capacity Addition (in MTPA) Expected Date of Award/ Date of
Commencement of Project
Expected Date of
Completion of the Project
ESub-Total 0.00 0.00 0.00 0.00 0.00 0.00GRAND TOTAL 9.50 1022.00 699.00 0.00 223.00 100.00
OTHER WORKS
248

Annexure-XIII( Phase-III)
Nature of Cargo
Capacity Year in which to be added
I.R. GBS EBR and others*
(*Pl. Specify)
Private
sector
ASub-Total 0.00 0.00 0.00 0.00 0.00 0.00
B
Sub-Total0.00 0.00 0.00 0.00 0.00 0.00
C
Sub-Total0.00 0.00 0.00 0.00 0.00 0.00
D
Sub-Total0.00 0.00 0.00 0.00 0.00 0.00
ESub-Total 0.00 0.00 0.00 0.00 0.00 0.00GRAND TOTAL 0.00 0.00 0.00 0.00 0.00 0.00
RAIL/ROAD CONNECTIVITY WORKS
OTHER WORKS
STATUS
DEEPENING OF CHANNEL/BERTHS , ETC.
CONSTRUCTION /RECONSTRUCTION OF BERTHS/JETTIES, ETC.
PROCUREMENT OF EQUIPMENTS ETC.
Estimated cost (`
in Crores)
Source of financing (` in Crores)
PORT-WISE DETAILED LIST OF PROJECTS T0 BE UNDERTAKEN FOR MAJOR PORTS UNDER 5 PROJECT HEADS & THEIR FUNDING III.PROJECTS FROM 1-4-2017 TO 31-3-2020
NAME OF THE PORT:- ENNORE PORT LTDSl. No.
Name of the Project. Capacity Addition (in MTPA) Expected Date of Award/ Date of
Commencement of Project
Expected Date of
Completion of the Project
249

Annexure-XIII( Phase-I)
NAME OF THE PORT: CHENNAI PORT
Nature of Cargo Capacity Year in which to be added
I.R GBS EBR and Others* (*pl.
Specify)
Private Sector
A
1 Development of Basin andChannels for Mega
Container - 2018 561.00 561.00 - - - 2011 2017
Sub-Total 0.00 561.00 561.00 0.00 0.00 0.00B1 Creation of Mega container
terminal to the north of theBharathi Dock (excludingdredging component)
Container 48.00 2018 3125.00 - - - 3125.00 2011 2017 Proposal taken up forimplementation under PPPmode.MoS approval awaitedfor issuse of RFP.
2 Construction of additionalberth (Ro-Ro) at southernend of Container terminalalong with Multi-levelstackyard for automobiles
General cargo 1.50 2013 94.80 0.80 - - 94.00 Aug-11 Aug-13 Proposal taken up forimplementation under PPPmode. Preparation ofFeasibility report is underprogress.
3 New Berth 200 M long inBharati Dock (Renamed as)Development of Bargehandling facilities at ChennaiPort under PPP mode
Liquid Cargo 1.00 2013 40.00 0.50 - - 39.50 Aug-11 Aug-13 Proposal taken up forimplementation under PPPmode. Preparation ofFeasibility report is underprogress.
Sub total 50.50 3259.80 1.30 0.00 0.00 3258.50C Furnished seperately
D1 Ennore-Manali Expressway - - 2012 600.0 Equity-
139.80 & Loan to project-110.68
- - 460.20 by SPV
2002 2012 Rs.38Crs already paid withthe approval of MoS.MoS approval awaited forenhanced equity and loanassistance.
Sub total 0.00 600.00 139.80 0.00 0.00 460.20
PROCUREMENT OF EQUIPMENTS ETC.,
RAIL/ROAD CONNECTIVITY WORKS
CONSTRUCTION/ RECONSTRUCTION OF BERTHS/JETTIES, Etc.,
DEEPENING OF CHANNEL/BERTHS, ETC
Expected date of
Award /Date of
Commencement of
Project
PORT-WISE DETAILED LIST OF PROJECTS TO BE UNDERTAKEN FOR MAJOR PORTS UNDER 5 PROJECTS HEADS & THEIR FUNDING PATTERNI. PROJECTS FROM 1-7-2010 TO 31-3-2012
Expected date of
Completion of Project
STATUS Name of the SchemeSl. No.
Capacity Addition (in MTPA) Estimated Cost (`Crores)
Source of Financing (` in Crores)
250
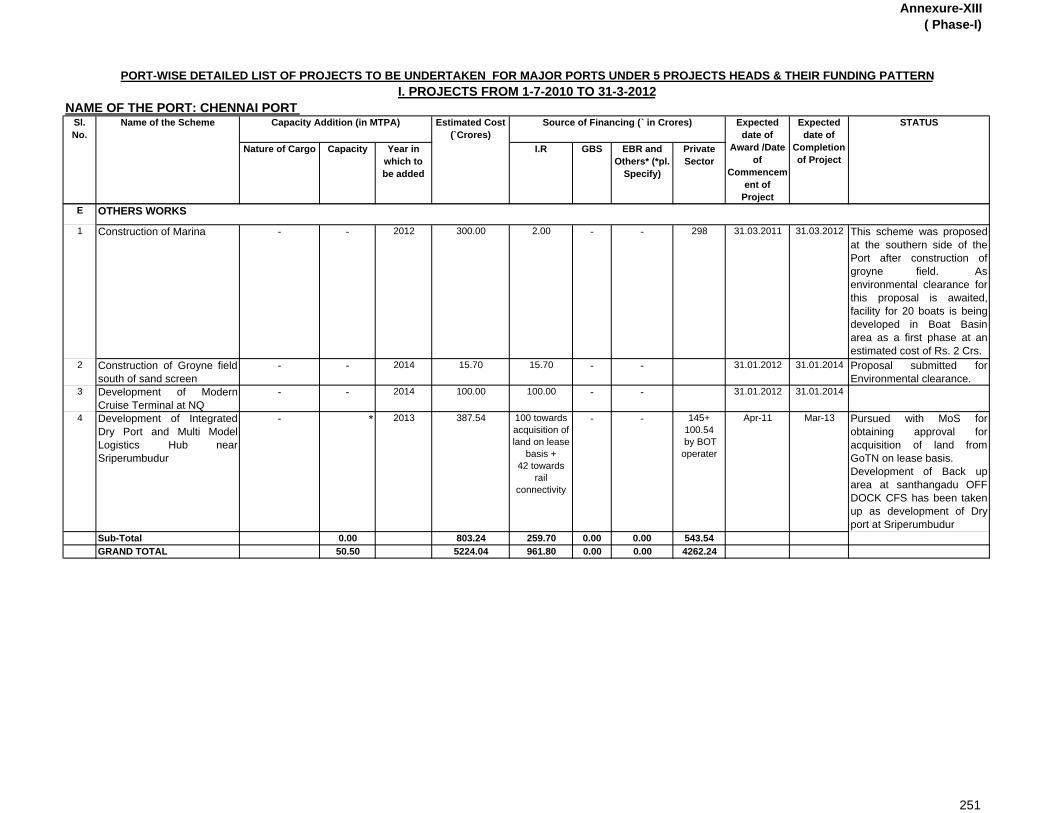
Annexure-XIII( Phase-I)
NAME OF THE PORT: CHENNAI PORT
Nature of Cargo Capacity Year in which to be added
I.R GBS EBR and Others* (*pl.
Specify)
Private Sector
Expected date of
Award /Date of
Commencement of
Project
PORT-WISE DETAILED LIST OF PROJECTS TO BE UNDERTAKEN FOR MAJOR PORTS UNDER 5 PROJECTS HEADS & THEIR FUNDING PATTERNI. PROJECTS FROM 1-7-2010 TO 31-3-2012
Expected date of
Completion of Project
STATUS Name of the SchemeSl. No.
Capacity Addition (in MTPA) Estimated Cost (`Crores)
Source of Financing (` in Crores)
E
1 Construction of Marina - - 2012 300.00 2.00 - - 298 31.03.2011 31.03.2012 This scheme was proposedat the southern side of thePort after construction ofgroyne field. Asenvironmental clearance forthis proposal is awaited,facility for 20 boats is beingdeveloped in Boat Basinarea as a first phase at anestimated cost of Rs. 2 Crs.
2 Construction of Groyne fieldsouth of sand screen
- - 2014 15.70 15.70 - - 31.01.2012 31.01.2014 Proposal submitted forEnvironmental clearance.
3 Development of ModernCruise Terminal at NQ
- - 2014 100.00 100.00 - - 31.01.2012 31.01.2014
4 Development of IntegratedDry Port and Multi ModelLogistics Hub nearSriperumbudur
- * 2013 387.54 100 towards acquisition of land on lease
basis +42 towards
rail connectivity
- - 145+100.54
by BOT operater
Apr-11 Mar-13 Pursued with MoS forobtaining approval foracquisition of land fromGoTN on lease basis.Development of Back uparea at santhangadu OFFDOCK CFS has been takenup as development of Dryport at Sriperumbudur
Sub-Total 0.00 803.24 259.70 0.00 0.00 543.54GRAND TOTAL 50.50 5224.04 961.80 0.00 0.00 4262.24
OTHERS WORKS
251
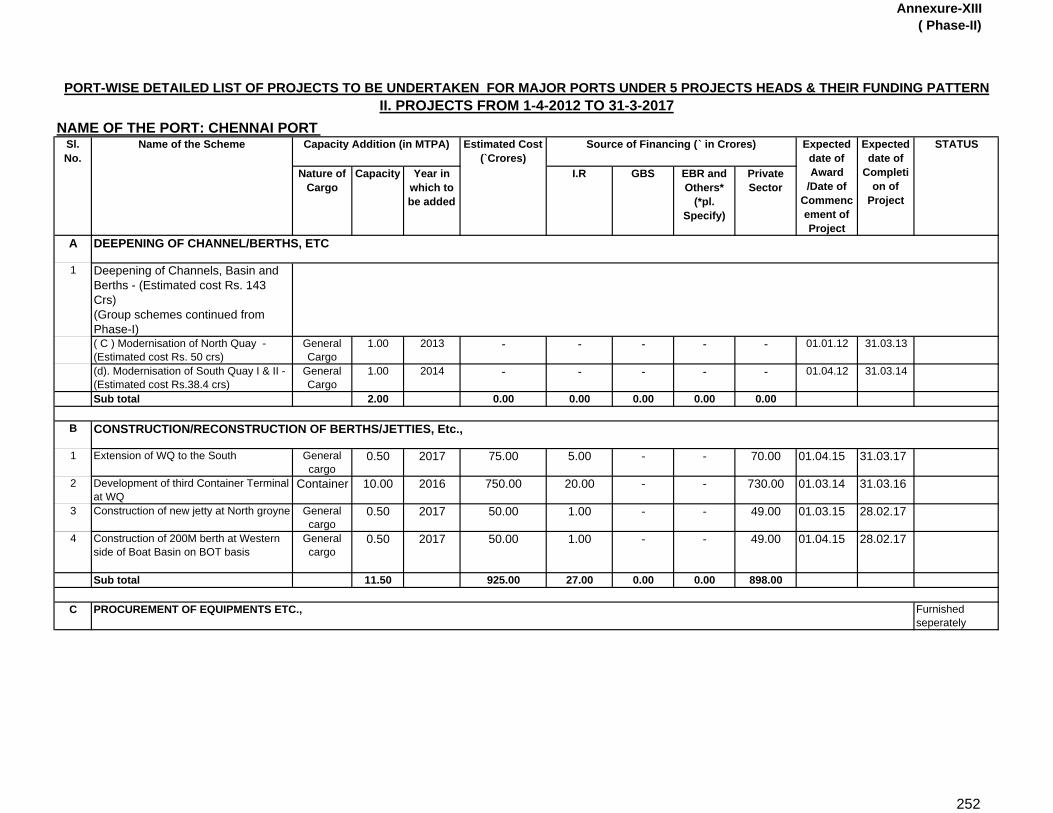
Annexure-XIII( Phase-II)
NAME OF THE PORT: CHENNAI PORT
Nature of Cargo
Capacity Year in which to be added
I.R GBS EBR and Others*
(*pl. Specify)
Private Sector
A
1 Deepening of Channels, Basin and Berths - (Estimated cost Rs. 143 Crs)(Group schemes continued from Phase-I)( C ) Modernisation of North Quay - (Estimated cost Rs. 50 crs)
General Cargo
1.00 2013 - - - - - 01.01.12 31.03.13
(d). Modernisation of South Quay I & II -(Estimated cost Rs.38.4 crs)
General Cargo
1.00 2014 - - - - - 01.04.12 31.03.14
Sub total 2.00 0.00 0.00 0.00 0.00 0.00
B
1 Extension of WQ to the South General cargo
0.50 2017 75.00 5.00 - - 70.00 01.04.15 31.03.17
2 Development of third Container Terminal at WQ
Container 10.00 2016 750.00 20.00 - - 730.00 01.03.14 31.03.16
3 Construction of new jetty at North groyne General cargo
0.50 2017 50.00 1.00 - - 49.00 01.03.15 28.02.17
4 Construction of 200M berth at Western side of Boat Basin on BOT basis
General cargo
0.50 2017 50.00 1.00 - - 49.00 01.04.15 28.02.17
Sub total 11.50 925.00 27.00 0.00 0.00 898.00
C Furnished seperately
DEEPENING OF CHANNEL/BERTHS, ETC
CONSTRUCTION/RECONSTRUCTION OF BERTHS/JETTIES, Etc.,
PROCUREMENT OF EQUIPMENTS ETC.,
PORT-WISE DETAILED LIST OF PROJECTS TO BE UNDERTAKEN FOR MAJOR PORTS UNDER 5 PROJECTS HEADS & THEIR FUNDING PATTERNII. PROJECTS FROM 1-4-2012 TO 31-3-2017
Sl. No.
Name of the Scheme Capacity Addition (in MTPA) Estimated Cost (`Crores)
Source of Financing (` in Crores) Expected date of Award
/Date of Commencement of Project
Expected date of
Completion of
Project
STATUS
252
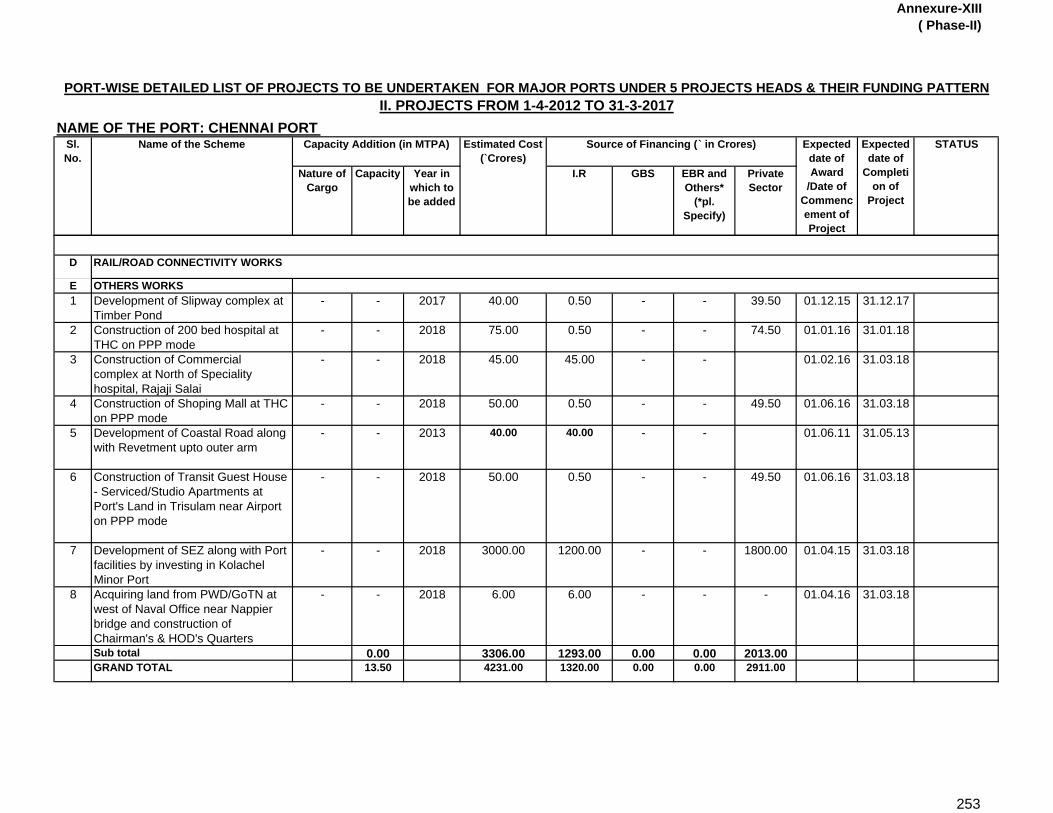
Annexure-XIII( Phase-II)
NAME OF THE PORT: CHENNAI PORT
Nature of Cargo
Capacity Year in which to be added
I.R GBS EBR and Others*
(*pl. Specify)
Private Sector
PORT-WISE DETAILED LIST OF PROJECTS TO BE UNDERTAKEN FOR MAJOR PORTS UNDER 5 PROJECTS HEADS & THEIR FUNDING PATTERNII. PROJECTS FROM 1-4-2012 TO 31-3-2017
Sl. No.
Name of the Scheme Capacity Addition (in MTPA) Estimated Cost (`Crores)
Source of Financing (` in Crores) Expected date of Award
/Date of Commencement of Project
Expected date of
Completion of
Project
STATUS
D
E OTHERS WORKS1 Development of Slipway complex at
Timber Pond- - 2017 40.00 0.50 - - 39.50 01.12.15 31.12.17
2 Construction of 200 bed hospital at THC on PPP mode
- - 2018 75.00 0.50 - - 74.50 01.01.16 31.01.18
3 Construction of Commercial complex at North of Speciality hospital, Rajaji Salai
- - 2018 45.00 45.00 - - 01.02.16 31.03.18
4 Construction of Shoping Mall at THC on PPP mode
- - 2018 50.00 0.50 - - 49.50 01.06.16 31.03.18
5 Development of Coastal Road along with Revetment upto outer arm
- - 2013 40.00 40.00 - - 01.06.11 31.05.13
6 Construction of Transit Guest House - Serviced/Studio Apartments at Port's Land in Trisulam near Airport on PPP mode
- - 2018 50.00 0.50 - - 49.50 01.06.16 31.03.18
7 Development of SEZ along with Port facilities by investing in Kolachel Minor Port
- - 2018 3000.00 1200.00 - - 1800.00 01.04.15 31.03.18
8 Acquiring land from PWD/GoTN at west of Naval Office near Nappier bridge and construction of Chairman's & HOD's Quarters
- - 2018 6.00 6.00 - - - 01.04.16 31.03.18
Sub total 0.00 3306.00 1293.00 0.00 0.00 2013.00GRAND TOTAL 13.50 4231.00 1320.00 0.00 0.00 2911.00
RAIL/ROAD CONNECTIVITY WORKS
253
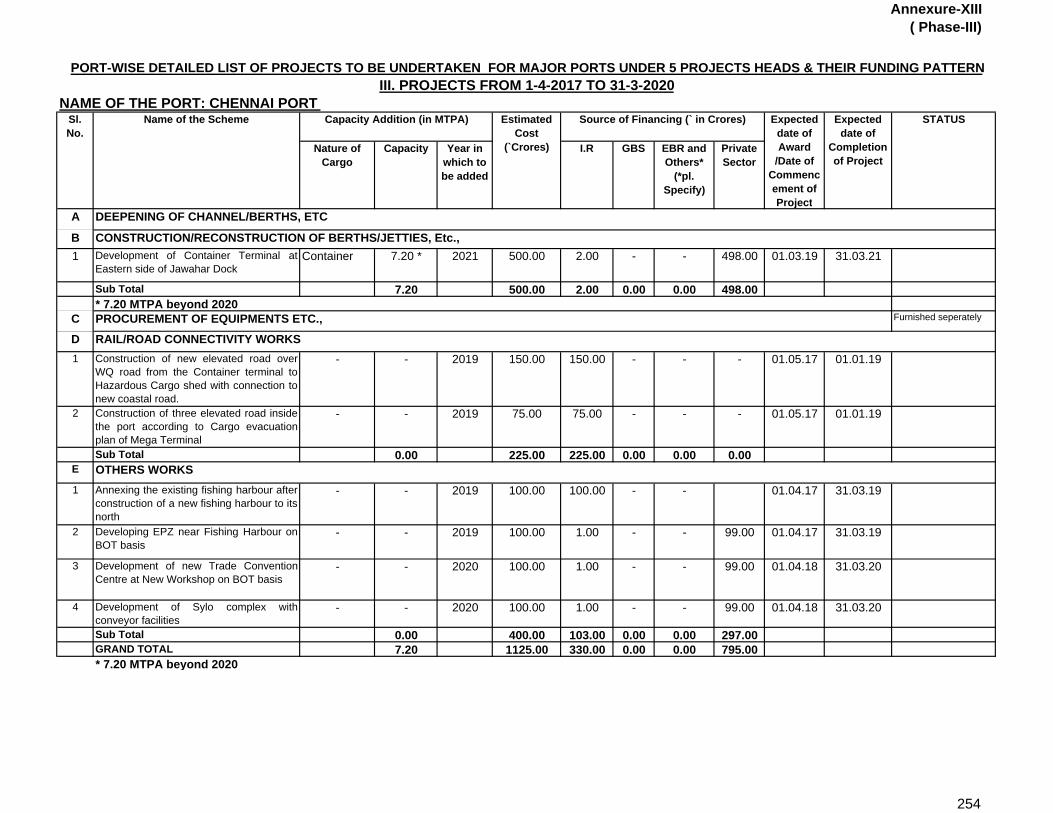
Annexure-XIII( Phase-III)
NAME OF THE PORT: CHENNAI PORT
Nature of Cargo
Capacity Year in which to be added
I.R GBS EBR and Others*
(*pl. Specify)
Private Sector
A
B1 Development of Container Terminal at
Eastern side of Jawahar DockContainer 7.20 * 2021 500.00 2.00 - - 498.00 01.03.19 31.03.21
Sub Total 7.20 500.00 2.00 0.00 0.00 498.00* 7.20 MTPA beyond 2020
C Furnished seperately
D1 Construction of new elevated road over
WQ road from the Container terminal toHazardous Cargo shed with connection tonew coastal road.
- - 2019 150.00 150.00 - - - 01.05.17 01.01.19
2 Construction of three elevated road insidethe port according to Cargo evacuationplan of Mega Terminal
- - 2019 75.00 75.00 - - - 01.05.17 01.01.19
Sub Total 0.00 225.00 225.00 0.00 0.00 0.00E
1 Annexing the existing fishing harbour afterconstruction of a new fishing harbour to itsnorth
- - 2019 100.00 100.00 - - 01.04.17 31.03.19
2 Developing EPZ near Fishing Harbour onBOT basis
- - 2019 100.00 1.00 - - 99.00 01.04.17 31.03.19
3 Development of new Trade ConventionCentre at New Workshop on BOT basis
- - 2020 100.00 1.00 - - 99.00 01.04.18 31.03.20
4 Development of Sylo complex withconveyor facilities
- - 2020 100.00 1.00 - - 99.00 01.04.18 31.03.20
Sub Total 0.00 400.00 103.00 0.00 0.00 297.00GRAND TOTAL 7.20 1125.00 330.00 0.00 0.00 795.00* 7.20 MTPA beyond 2020
DEEPENING OF CHANNEL/BERTHS, ETC
CONSTRUCTION/RECONSTRUCTION OF BERTHS/JETTIES, Etc.,
PROCUREMENT OF EQUIPMENTS ETC.,
Estimated Cost
(`Crores)
Source of Financing (` in Crores)
PORT-WISE DETAILED LIST OF PROJECTS TO BE UNDERTAKEN FOR MAJOR PORTS UNDER 5 PROJECTS HEADS & THEIR FUNDING PATTERNIII. PROJECTS FROM 1-4-2017 TO 31-3-2020
Sl. No.
Name of the Scheme Capacity Addition (in MTPA)
OTHERS WORKS
Expected date of Award
/Date of Commencement of Project
Expected date of
Completion of Project
STATUS
RAIL/ROAD CONNECTIVITY WORKS
254
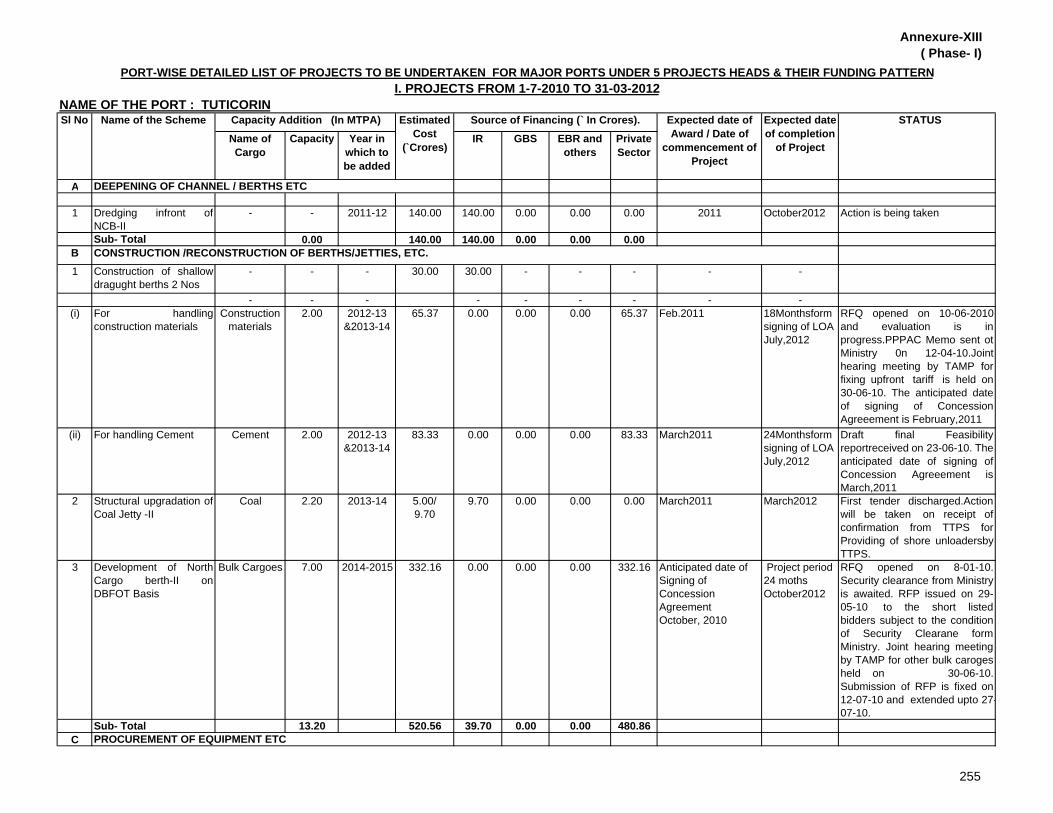
Annexure-XIII( Phase- I)
Name of Cargo
Capacity Year in which to be added
IR GBS EBR and others
Private Sector
A
1 Dredging infront ofNCB-II
- - 2011-12 140.00 140.00 0.00 0.00 0.00 2011 October2012 Action is being taken
Sub- Total 0.00 140.00 140.00 0.00 0.00 0.00B1 Construction of shallow
dragught berths 2 Nos- - - 30.00 30.00 - - - - -
- - - - - - - - -(i) For handling
construction materialsConstruction
materials2.00 2012-13
&2013-1465.37 0.00 0.00 0.00 65.37 Feb.2011 18Monthsform
signing of LOA July,2012
RFQ opened on 10-06-2010and evaluation is inprogress.PPPAC Memo sent otMinistry 0n 12-04-10.Jointhearing meeting by TAMP forfixing upfront tariff is held on30-06-10. The anticipated dateof signing of ConcessionAgreeement is February,2011
(ii) For handling Cement Cement 2.00 2012-13 &2013-14
83.33 0.00 0.00 0.00 83.33 March2011 24Monthsform signing of LOA July,2012
Draft final Feasibilityreportreceived on 23-06-10. Theanticipated date of signing ofConcession Agreeement isMarch,2011
2 Structural upgradation ofCoal Jetty -II
Coal 2.20 2013-14 5.00/ 9.70
9.70 0.00 0.00 0.00 March2011 March2012 First tender discharged.Actionwill be taken on receipt ofconfirmation from TTPS forProviding of shore unloadersbyTTPS.
3 Development of NorthCargo berth-II onDBFOT Basis
Bulk Cargoes 7.00 2014-2015 332.16 0.00 0.00 0.00 332.16 Anticipated date of Signing of Concession Agreement October, 2010
Project period 24 moths October2012
RFQ opened on 8-01-10.Security clearance from Ministryis awaited. RFP issued on 29-05-10 to the short listedbidders subject to the conditionof Security Clearane formMinistry. Joint hearing meetingby TAMP for other bulk carogesheld on 30-06-10.Submission of RFP is fixed on12-07-10 and extended upto 27-07-10.
Sub- Total 13.20 520.56 39.70 0.00 0.00 480.86C
PORT-WISE DETAILED LIST OF PROJECTS TO BE UNDERTAKEN FOR MAJOR PORTS UNDER 5 PROJECTS HEADS & THEIR FUNDING PATTERN
NAME OF THE PORT : TUTICORINSl No Name of the Scheme Capacity Addition (In MTPA)
I. PROJECTS FROM 1-7-2010 TO 31-03-2012
Expected date of completion
of Project
STATUS
PROCUREMENT OF EQUIPMENT ETC
CONSTRUCTION /RECONSTRUCTION OF BERTHS/JETTIES, ETC.
Estimated Cost
(`Crores)
Source of Financing (` In Crores). Expected date of Award / Date of
commencement of Project
DEEPENING OF CHANNEL / BERTHS ETC
255

Annexure-XIII( Phase- I)
Name of Cargo
Capacity Year in which to be added
IR GBS EBR and others
Private Sector
PORT-WISE DETAILED LIST OF PROJECTS TO BE UNDERTAKEN FOR MAJOR PORTS UNDER 5 PROJECTS HEADS & THEIR FUNDING PATTERN
NAME OF THE PORT : TUTICORINSl No Name of the Scheme Capacity Addition (In MTPA)
I. PROJECTS FROM 1-7-2010 TO 31-03-2012
Expected date of completion
of Project
STATUS Estimated Cost
(`Crores)
Source of Financing (` In Crores). Expected date of Award / Date of
commencement of Project
1 Conversion of BerthNo.8 as secondcontainer Terminal
Container 4.80 2012-2013 150 /312.12 0.00 0.00 0.00 312.12 June2011 March2012 Based on the Judgementearlier tender was discharged.Government has to finalise thePolicy decision on restriction ofMonopoly. Action will be takenon receipt of the abvoe policy.
2 Up Gradation ofmechanical handlinginfrastructure at TPTBOT Basis
NA 8.30 80.10 0.00 0.00 0.00 80.10 Anticipated date of Signing of
Concession Agreement
February, 2011
Project period is 6 months
months
RFQ opened on 18-06-10 andevaluatin is in progress..TAMPapplication for fixing fupfronttariff sent on 25-02-10.Memo,RFP and DCA furnishedto Ministry on 29-05-10.Jointhearing Meeting by TAMP heldon 30-06-10.
Sub Total 13.10 392.22 0.00 0.00 0.00 392.22D1 Rail connectivity from
marshalling to Hareislnd- Phase - I,II& III
- - - 101.77 101.77 0.00 0.00 0.00
Sub Total 101.77 101.77 0.00 0.00 0.00E OTHER WORKS
Sub Total 0.00 0.00 0.00 0.00 0.00 0.00
GRAND TOTAL 26.30 1154.55 281.47 0.00 0.00 873.08
RAIL / ROAD CONNECITIVITY WOKS
256

Annexure-XIII( Phase-II)
Name of
Cargo
Capacity Year in which to
be added
IR GBS EBR and others
Private Sector
A1 Dredging in front of
North Cargo Berth -III- - - 140.00 140.00 0.00 0.00 0.00 2016 2017 will be taken up in
appropriate time2 Dredging in front of North
Cargo Berth -IV - - - - - - - - 2019 2020 will be taken up in
appropriate timeSub- Total 0.00 140.00 140.00 0.00 0.00 0.00
B1 Construction of North
Cargo Berth-IIICoal 7.00 2016-17 332.16 0.00 0.00 0.00 332.16 2015 2017 Preparation of Techno
Feasibility Report is in progess
2 Construction of North cargo Berth -IV
Coal 7.00 2019-20 332.16 0.00 0.00 0.00 332.16 2017 2019 Preparation of Techno Feasibility Report is in progess
Sub- Total 14.00 664.32 0.00 0.00 0.00 664.32C
Sub- Total 0.00 0.00 0.00 0.00 0.00D1 Double laning of rail
connectivity frommarshalling yard to wharfend
- - 2016-17 40.00 40.00 0.00 0.00 0.00 2016 2017 Feasibility is being studied.
2 Zone-B Strengtheningand Improvementincluding capital dredgingupto 10.70m draught,Breakwater construction,Construction of Berths,construction of Fly overfor evacuation of cargo tothe storage yard atMunicipal link Road.
- - 2016-17 600.00 600.00 0.00 0.00 0.00 - -
Sub- Total 0.00 640.00 640.00 0.00 0.00 0.00E OTHER WORKS
Sub Total 0.00 0.00 0.00 0.00 0.00 0.00GRAND TOTAL 14.00 1444.32 780.00 0.00 0.00 664.32
PORT-WISE DETAILED LIST OF PROJECTS TO BE UNDERTAKEN FOR MAJOR PORTS UNDER 5 PROJECTS HEADS & THEIR FUNDING PATTERN
NAME OF THE PORT : TUTICORIN
Sl No
Name of the Scheme Capacity Addition (In MTPA)
Expected date of Award / Date of commencement
of Project
Expected date of completion
of Project
STATUS
II PROJECTS FROM 1-4-2012 TO 31-03-2017
RAIL / ROAD CONNECITIVITY WOKS
CONSTRUCTION / RECONSTRUCTIONOF BERTHS/JETTIES, ETC.
Nil
Estimated Cost
(`Crores)
Source of Financing (̀ In Crores).
DEEPENING OF CHANNEL / BERTHS ETC
PROCUREMENT OF EQUIPMENT ETC.,
257

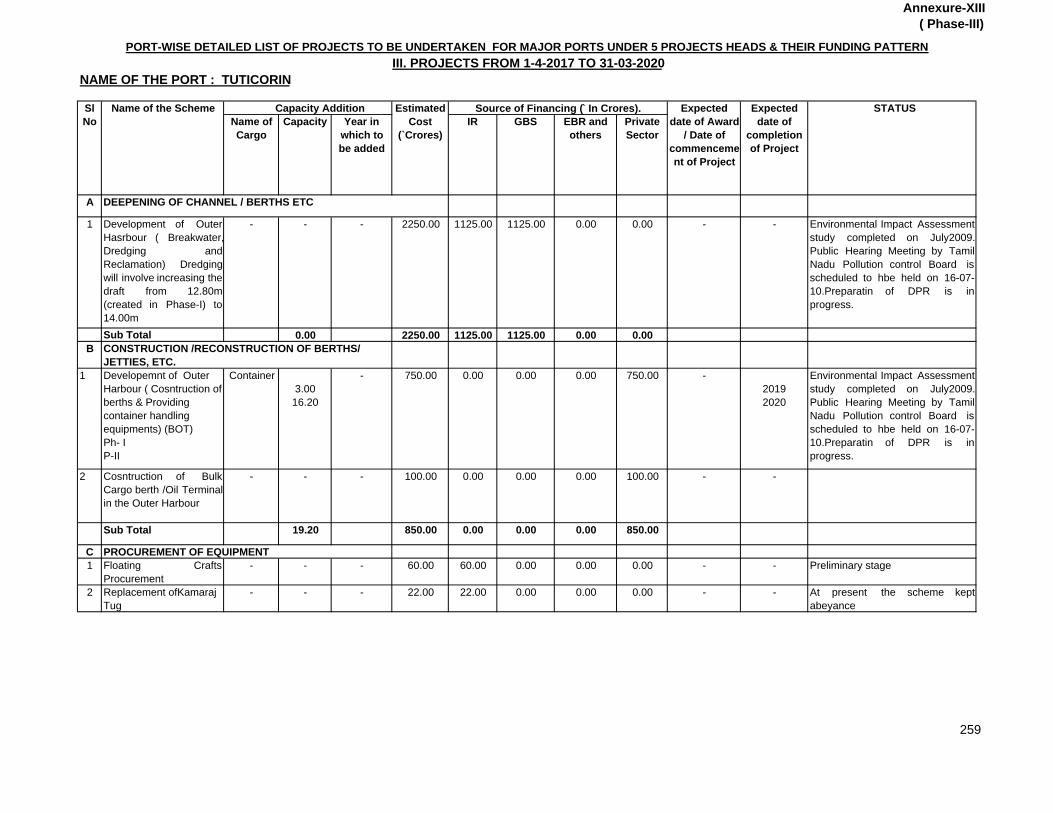
Annexure-XIII( Phase-III)
Name of Cargo
Capacity Year in which to be added
IR GBS EBR and others
Private Sector
A
1 Development of OuterHasrbour ( Breakwater,Dredging andReclamation) Dredgingwill involve increasing thedraft from 12.80m(created in Phase-I) to14.00m
- - - 2250.00 1125.00 1125.00 0.00 0.00 - - Environmental Impact Assessmentstudy completed on July2009.Public Hearing Meeting by TamilNadu Pollution control Board isscheduled to hbe held on 16-07-10.Preparatin of DPR is inprogress.
Sub Total 0.00 2250.00 1125.00 1125.00 0.00 0.00B
1 Developemnt of Outer Harbour ( Cosntruction of berths & Providing container handling equipments) (BOT) Ph- I P-II
Container 3.00 16.20
- 750.00 0.00 0.00 0.00 750.00 - 2019 2020
Environmental Impact Assessmentstudy completed on July2009.Public Hearing Meeting by TamilNadu Pollution control Board isscheduled to hbe held on 16-07-10.Preparatin of DPR is inprogress.
2 Cosntruction of BulkCargo berth /Oil Terminalin the Outer Harbour
- - - 100.00 0.00 0.00 0.00 100.00 - -
Sub Total 19.20 850.00 0.00 0.00 0.00 850.00
C1 Floating Crafts
Procurement- - - 60.00 60.00 0.00 0.00 0.00 - - Preliminary stage
2 Replacement ofKamaraj Tug
- - - 22.00 22.00 0.00 0.00 0.00 - - At present the scheme keptabeyance
PROCUREMENT OF EQUIPMENT
Source of Financing (̀ In Crores).
PORT-WISE DETAILED LIST OF PROJECTS TO BE UNDERTAKEN FOR MAJOR PORTS UNDER 5 PROJECTS HEADS & THEIR FUNDING PATTERNIII. PROJECTS FROM 1-4-2017 TO 31-03-2020
NAME OF THE PORT : TUTICORIN
Sl No
Name of the Scheme Capacity Addition Estimated Cost
(`Crores)
STATUS
DEEPENING OF CHANNEL / BERTHS ETC
CONSTRUCTION /RECONSTRUCTION OF BERTHS/ JETTIES, ETC.
Expected date of Award
/ Date of commencement of Project
Expected date of
completion of Project
259

Annexure-XIII( Phase-III)
Name of Cargo
Capacity Year in which to be added
IR GBS EBR and others
Private Sector
Source of Financing (̀ In Crores).
PORT-WISE DETAILED LIST OF PROJECTS TO BE UNDERTAKEN FOR MAJOR PORTS UNDER 5 PROJECTS HEADS & THEIR FUNDING PATTERNIII. PROJECTS FROM 1-4-2017 TO 31-03-2020
NAME OF THE PORT : TUTICORIN
Sl No
Name of the Scheme Capacity Addition Estimated Cost
(`Crores)
STATUS Expected date of Award
/ Date of commencement of Project
Expected date of
completion of Project
3 Convdersion of Berth No9 as container Terminal(BOT)
Container - - 150.00 0.00 0.00 0.00 150.00 - -
Sub Total 0.00 232.00 82.00 0.00 0.00 150.00
D
1 Constructin of Separateapproach /roadconnectivity to OuterHarbour
- - - 100.00 100.00 0.00 0.00 0.00 - -
2 Provisionof Elevatedroadconnecting outer harbourwith the VOC roadbeyond the VOC statuejunction
- - 2019-20 200.00 200.00 0.00 0.00 0.00 2019 2020 Part of Outer Harbour connectivity improvement Project.
Sub Total 0.00 300.00 300.00 0.00 0.00 0.00E OTHER WORKS1 Reclamation and Heavy
duty pavement- - - 15.00 15.00 0.00 0.00 0.00 - - Preliminary stage.
2 Construction ofInternationalShip buildingyard
- - - 200.00 0.00 0.00 0.00 200.00 - - Budgetary offer called for thepreparation of report forConstruction of Ship Building Yardunder PPP mode on 18-11-2008. The offer received from theempanelled advisory services forthe preparation of DPR has beendischarged. The proposed projectrequires huge land area. Action isbeing taken for acquisition ofadditional land from DistrictAdministration.
3 Construction of Separatesignal staion includingprovision for VTMS andprocurement of 2 Nos 32T BP Tug, 1 No of 45 TBP Tug 2Nos of Pilotlaunch, 3 Nos of Mooringboat
- - - 60.00 60.00 0.00 0.00 0.00 - - Preliminary stage.
Sub Total 0.00 275.00 75.00 0.00 0.00 200.00GRAND TOTAL 19.20 3907.00 1582.00 1125.00 0.00 1200.00
RAIL / ROAD CONNECITIVITY WOKS
260

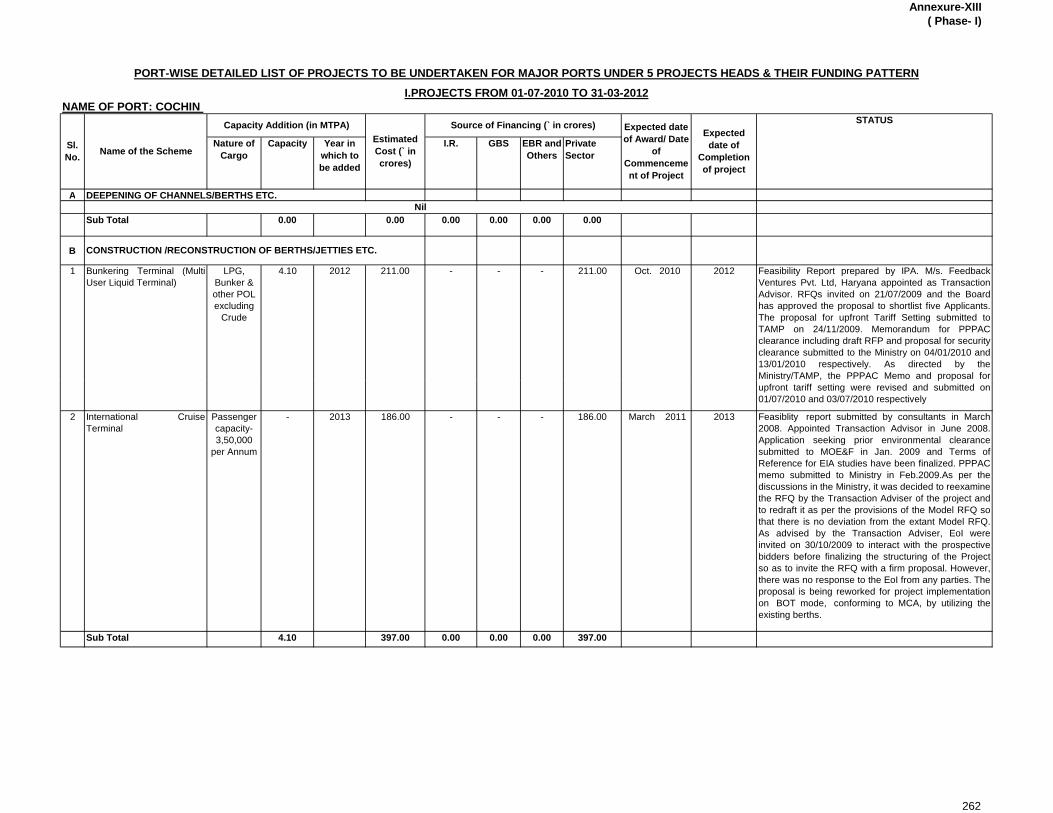
Annexure-XIII( Phase- I)
NAME OF PORT: COCHIN
Nature of Cargo
Capacity Year in which to be added
I.R. GBS EBR and Others
Private Sector
A
Sub Total 0.00 0.00 0.00 0.00 0.00 0.00
B
1 Bunkering Terminal (MultiUser Liquid Terminal)
LPG, Bunker & other POL excluding
Crude
4.10 2012 211.00 - - - 211.00 Oct. 2010 2012 Feasibility Report prepared by IPA. M/s. FeedbackVentures Pvt. Ltd, Haryana appointed as TransactionAdvisor. RFQs invited on 21/07/2009 and the Boardhas approved the proposal to shortlist five Applicants.The proposal for upfront Tariff Setting submitted toTAMP on 24/11/2009. Memorandum for PPPACclearance including draft RFP and proposal for securityclearance submitted to the Ministry on 04/01/2010 and13/01/2010 respectively. As directed by theMinistry/TAMP, the PPPAC Memo and proposal for
Expected date of
Completion of project
Capacity Addition (in MTPA) Source of Financing (` in crores)
CONSTRUCTION /RECONSTRUCTION OF BERTHS/JETTIES ETC.
NilDEEPENING OF CHANNELS/BERTHS ETC.
PORT-WISE DETAILED LIST OF PROJECTS TO BE UNDERTAKEN FOR MAJOR PORTS UNDER 5 PROJECTS HEADS & THEIR FUNDING PATTERN
I.PROJECTS FROM 01-07-2010 TO 31-03-2012
Expected date of Award/ Date
of Commencement of Project
STATUS
Sl. No. Name of the Scheme
Estimated Cost (` in crores)
y p pupfront tariff setting were revised and submitted on01/07/2010 and 03/07/2010 respectively
2 International CruiseTerminal
Passenger capacity-3,50,000
per Annum
- 2013 186.00 - - - 186.00 March 2011 2013 Feasiblity report submitted by consultants in March2008. Appointed Transaction Advisor in June 2008.Application seeking prior environmental clearancesubmitted to MOE&F in Jan. 2009 and Terms ofReference for EIA studies have been finalized. PPPACmemo submitted to Ministry in Feb.2009.As per thediscussions in the Ministry, it was decided to reexaminethe RFQ by the Transaction Adviser of the project andto redraft it as per the provisions of the Model RFQ sothat there is no deviation from the extant Model RFQ.As advised by the Transaction Adviser, EoI wereinvited on 30/10/2009 to interact with the prospectivebidders before finalizing the structuring of the Projectso as to invite the RFQ with a firm proposal. However,there was no response to the EoI from any parties. Theproposal is being reworked for project implementationon BOT mode, conforming to MCA, by utilizing theexisting berths.
Sub Total 4.10 397.00 0.00 0.00 0.00 397.00
262

Annexure-XIII( Phase- I)
NAME OF PORT: COCHIN
Nature of Cargo
Capacity Year in which to be added
I.R. GBS EBR and Others
Private Sector
Expected date of
Completion of project
Capacity Addition (in MTPA) Source of Financing (` in crores)
PORT-WISE DETAILED LIST OF PROJECTS TO BE UNDERTAKEN FOR MAJOR PORTS UNDER 5 PROJECTS HEADS & THEIR FUNDING PATTERN
I.PROJECTS FROM 01-07-2010 TO 31-03-2012
Expected date of Award/ Date
of Commencement of Project
STATUS
Sl. No. Name of the Scheme
Estimated Cost (` in crores)
C1 Procurement of 2 Nos
Electric Level Luffing Crane - - - 34.00 34.00 - - - 1.10.2010 31.3.2013 Project already sanctioned by the Port Trust Board.
Since the area where Cranes are proposed forinstallation, is coming under the flying funnel of IndianNavy, Navy's clerance for the height restriction, isnecessary before processing procurement. The matterhas been taken up with Navy and the clerance isawaited.
2 Replacement & Modificationof Cargo handlingequipments
- - - 50.00 50.00 - - - 1.4.2011 31.3.2012 Proposal to be submitted
Sub Total 0.00 84.00 84.00 0.00 0.00 0.00
DNIL
PROCUREMENT OF EQUIPMENT ETC.
RAIL/ROAD CONNECTIVITY WORKS
E1 Reclamation &
Development of land atS/End of W/Island- LandDevelopment works
- - - 10.00 10.00 - - - 2011 2012 Construction of reclamation wall and filling workcompleted in March 2007. Land development works will be taken up on finalisation of redevelopment plan forW/Island.
2 Upgradation of fire fightingsystem
- - - 20.00 20.00 - - - 1.4.2011 31.3.2012 Feasibility of modifying the fire fighting facilities is beingcarried out using in house expertise and in consultationwith BPCL
Sub Total 0.00 30.00 30.00 0.00 0.00 0.00
GRANT TOTAL 4.10 511.00 114.00 0.00 0.00 397.00
OTHER WORKS
263

Annexure-XIII( Phase-II)
NAME OF PORT: COCHIN
Nature of Cargo
Capacity Year in which to be added
I.R. GBS EBR and Others
Private Sector
Aincreased draft (in meters)
1 Capital Dredging for creation of Berth Basin for ICTT -Phase-III A for extension of berth
- - 2013 26.4* - 26.40 - - 2013 2013 *As per DPR To be taken up in line with Phase-II development of ICTT
2 Deepening of EKM channel (Q5 to Q7 frontage)
- - 2017 35.00 35.00 - - 2016 2017 Preliminary stage of planning
3 Deepening of Mattancherry Channel - - 2017 50.00 50.00 - 2016 2017 Preliminary stage of planningSub Total 0.00 111.40 35.00 76.40 0.00 0.00
B1 LNG Re-gassification Terminal - Phase II LNG 2.50 2016 1200.00 - - - 1200.00 2012 2015 Implementation by PLL.
2 International Container Transshipment Terminal - Phase II Extension of berth by 300m & providing related facilities
Container
6.25 2013 150.00 - - - 150.00 2012 2013 Implementation by BOT operator
3 Reconstruction of STB POL - - 40.00 40.00 - - 2013 2013 Preliminary stage of planning
4 Reconstruction of NTB POL - - 40.00 40.00 - - 2014 2014 Preliminary stage of planning
5 Liquid cargo jetty in M/channel POL 2.00 2016 40.00 - - 40.00 2015 2016 Preliminary stage of planning
6 Strengthening of Q5 to Q7 berths of E/wharf
GC 1.00 2017 40.00 40.00 - - 2015 2017 Preliminary stage of planning
7 Reconstruction of Mattancherry wharf Phase-II
Coal & Misc.
1.00 2017 100.00 - - 100.00 2015 2017 Preliminary stage of planning
Sub Total 12.75 1610.00 120.00 0.00 0.00 1490.00C
1 Spill over Scheme Procurement of 2 Nos Electric Level Luffing Crane
- - - 15.00 15.00 - - - 01.10.2010 31.3.2013
2 New Schemes Procurement of Equipments
- - - 110.00 110.00 - - - 1.4.2012 31.3.2017 The Q7,8 & 9 now occupied by M/sIGTPL, will become vacant when theyshift to ICTT, Vallarpadam. In order tohandle bulk cargoes and the containers,it is proposed to procure suitableequipments
Sub Total 0.00 125.00 125.00 0.00 0.00 0.00D1 Widening to four-lane and
strengthening of NH 47 A- - - 40.00 40.00 2015 2017 To be executed by NHAI
Sub Total - 0.00 - 40.00 0.00 0.00 40.00 0.00
Estimated Cost (` in crores)
Source of Financing (` in crores) Expected date of Award/ Date
of Commencement of Project
Expected date of Completion
of project
RAIL/ROAD CONNECTIVITY WORKS
PORT-WISE DETAILED LIST OF PROJECTS TO BE UNDERTAKEN FOR MAJOR PORTS UNDER 5 PROJECTS HEADS & THEIR FUNDING PATTERN
II. PROJECTS FROM 01-04-2012 TO 31-03-2017
Sl. No.
Name of the Scheme Capacity Addition (in MTPA) STATUS
PROCUREMENT OF EQUIPMENT ETC.
DEEPENING OF CHANNELS/BERTHS ETC.
CONSTRUCTION /RECONSTRUCTION OF BERTHS/JETTIES ETC.
264
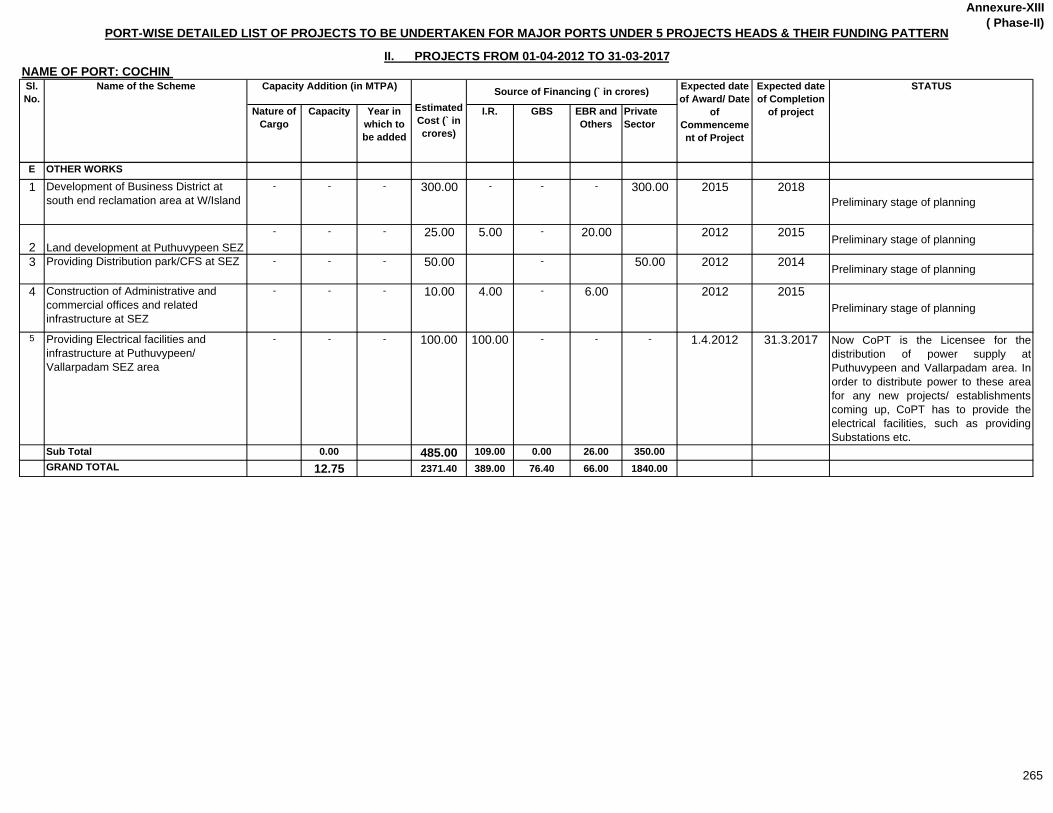
Annexure-XIII( Phase-II)
NAME OF PORT: COCHIN
Nature of Cargo
Capacity Year in which to be added
I.R. GBS EBR and Others
Private Sector
Estimated Cost (` in crores)
Source of Financing (` in crores) Expected date of Award/ Date
of Commencement of Project
Expected date of Completion
of project
PORT-WISE DETAILED LIST OF PROJECTS TO BE UNDERTAKEN FOR MAJOR PORTS UNDER 5 PROJECTS HEADS & THEIR FUNDING PATTERN
II. PROJECTS FROM 01-04-2012 TO 31-03-2017
Sl. No.
Name of the Scheme Capacity Addition (in MTPA) STATUS
E OTHER WORKS
1 Development of Business District at south end reclamation area at W/Island
- - - 300.00 - - - 300.00 2015 2018Preliminary stage of planning
2 Land development at Puthuvypeen SEZ- - - 25.00 5.00 - 20.00 2012 2015 Preliminary stage of planning
3 Providing Distribution park/CFS at SEZ - - - 50.00 - 50.00 2012 2014 Preliminary stage of planning
4 Construction of Administrative and commercial offices and related infrastructure at SEZ
- - - 10.00 4.00 - 6.00 2012 2015Preliminary stage of planning
5 Providing Electrical facilities and infrastructure at Puthuvypeen/ Vallarpadam SEZ area
- - - 100.00 100.00 - - - 1.4.2012 31.3.2017 Now CoPT is the Licensee for thedistribution of power supply atPuthuvypeen and Vallarpadam area. Inorder to distribute power to these areafor any new projects/ establishmentscoming up, CoPT has to provide theelectrical facilities, such as providingSubstations etc.
Sub Total 0.00 485.00 109.00 0.00 26.00 350.00GRAND TOTAL 12.75 2371.40 389.00 76.40 66.00 1840.00
265
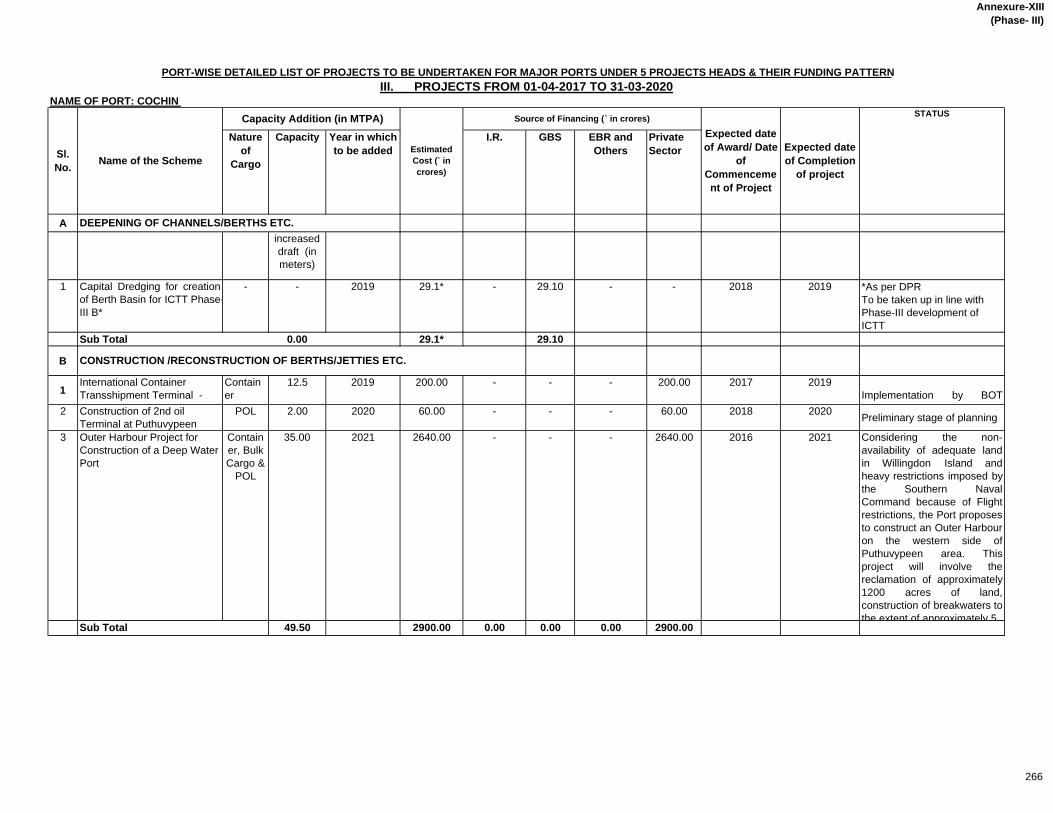
Annexure-XIII(Phase- III)
NAME OF PORT: COCHIN
Nature of
Cargo
Capacity Year in which to be added
I.R. GBS EBR and Others
Private Sector
Aincreased draft (in meters)
1 Capital Dredging for creationof Berth Basin for ICTT Phase-III B*
- - 2019 29.1* - 29.10 - - 2018 2019 *As per DPR To be taken up in line with Phase-III development of ICTT
Sub Total 0.00 29.1* 29.10
B
1International Container Transshipment Terminal -
Container
12.5 2019 200.00 - - - 200.00 2017 2019Implementation by BOT
2 Construction of 2nd oil Terminal at Puthuvypeen
POL 2.00 2020 60.00 - - - 60.00 2018 2020 Preliminary stage of planning
3 Outer Harbour Project for Construction of a Deep Water Port
Container, Bulk Cargo &
POL
35.00 2021 2640.00 - - - 2640.00 2016 2021 Considering the non-availability of adequate landin Willingdon Island andheavy restrictions imposed bythe Southern NavalCommand because of Flightrestrictions, the Port proposesto construct an Outer Harbouron the western side ofPuthuvypeen area. Thisproject will involve thereclamation of approximately1200 acres of land,construction of breakwaters tothe extent of approximately 5
Sub Total 49.50 2900.00 0.00 0.00 0.00 2900.00
DEEPENING OF CHANNELS/BERTHS ETC.
CONSTRUCTION /RECONSTRUCTION OF BERTHS/JETTIES ETC.
PORT-WISE DETAILED LIST OF PROJECTS TO BE UNDERTAKEN FOR MAJOR PORTS UNDER 5 PROJECTS HEADS & THEIR FUNDING PATTERNIII. PROJECTS FROM 01-04-2017 TO 31-03-2020
Sl. No. Name of the Scheme
Capacity Addition (in MTPA) STATUS
Estimated Cost (` in crores)
Source of Financing (` in crores)
Expected date of Award/ Date
of Commencement of Project
Expected date of Completion
of project
266
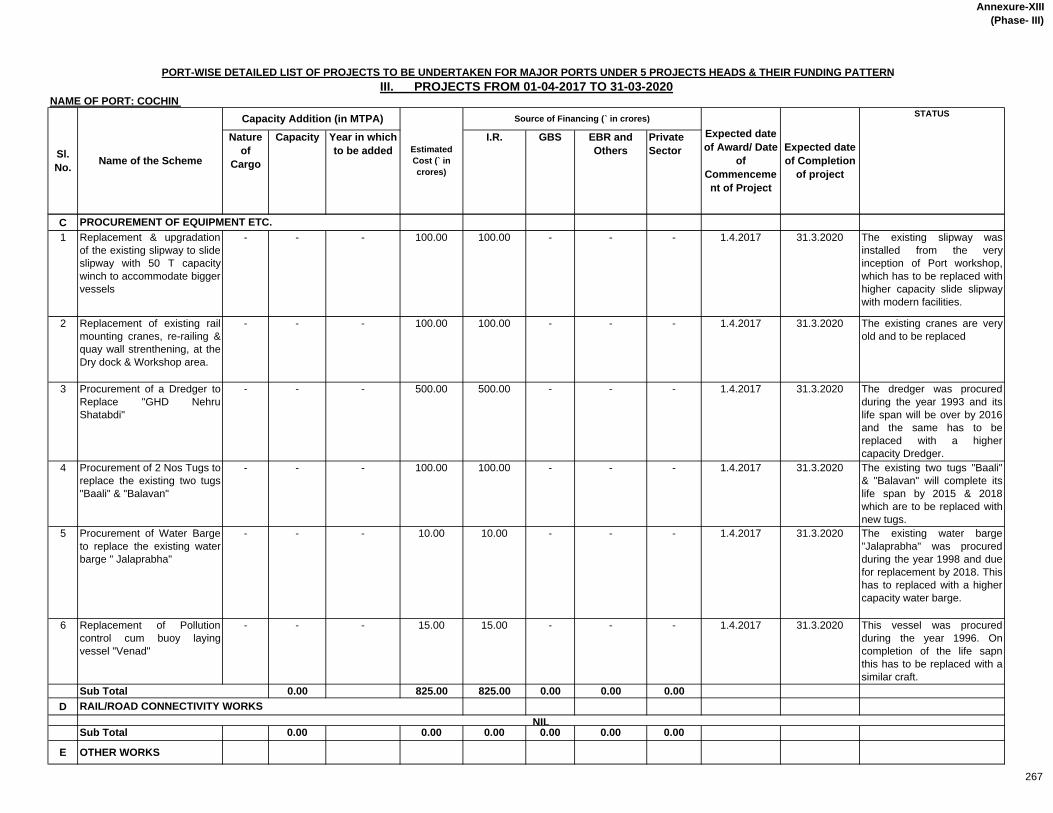
Annexure-XIII(Phase- III)
NAME OF PORT: COCHIN
Nature of
Cargo
Capacity Year in which to be added
I.R. GBS EBR and Others
Private Sector
PORT-WISE DETAILED LIST OF PROJECTS TO BE UNDERTAKEN FOR MAJOR PORTS UNDER 5 PROJECTS HEADS & THEIR FUNDING PATTERNIII. PROJECTS FROM 01-04-2017 TO 31-03-2020
Sl. No. Name of the Scheme
Capacity Addition (in MTPA) STATUS
Estimated Cost (` in crores)
Source of Financing (` in crores)
Expected date of Award/ Date
of Commencement of Project
Expected date of Completion
of project
C1 Replacement & upgradation
of the existing slipway to slideslipway with 50 T capacitywinch to accommodate biggervessels
- - - 100.00 100.00 - - - 1.4.2017 31.3.2020 The existing slipway wasinstalled from the veryinception of Port workshop,which has to be replaced withhigher capacity slide slipwaywith modern facilities.
2 Replacement of existing railmounting cranes, re-railing &quay wall strenthening, at theDry dock & Workshop area.
- - - 100.00 100.00 - - - 1.4.2017 31.3.2020 The existing cranes are veryold and to be replaced
3 Procurement of a Dredger toReplace "GHD NehruShatabdi"
- - - 500.00 500.00 - - - 1.4.2017 31.3.2020 The dredger was procuredduring the year 1993 and itslife span will be over by 2016and the same has to bereplaced with a highercapacity Dredger.
4 Procurement of 2 Nos Tugs toreplace the existing two tugs"Baali" & "Balavan"
- - - 100.00 100.00 - - - 1.4.2017 31.3.2020 The existing two tugs "Baali"& "Balavan" will complete itslife span by 2015 & 2018which are to be replaced withnew tugs.
5 Procurement of Water Bargeto replace the existing waterbarge " Jalaprabha"
- - - 10.00 10.00 - - - 1.4.2017 31.3.2020 The existing water barge"Jalaprabha" was procuredduring the year 1998 and duefor replacement by 2018. Thishas to replaced with a highercapacity water barge.
6 Replacement of Pollutioncontrol cum buoy layingvessel "Venad"
- - - 15.00 15.00 - - - 1.4.2017 31.3.2020 This vessel was procuredduring the year 1996. Oncompletion of the life sapnthis has to be replaced with asimilar craft.
Sub Total 0.00 825.00 825.00 0.00 0.00 0.00D
Sub Total 0.00 0.00 0.00 0.00 0.00 0.00
E OTHER WORKS
NIL
PROCUREMENT OF EQUIPMENT ETC.
RAIL/ROAD CONNECTIVITY WORKS
267
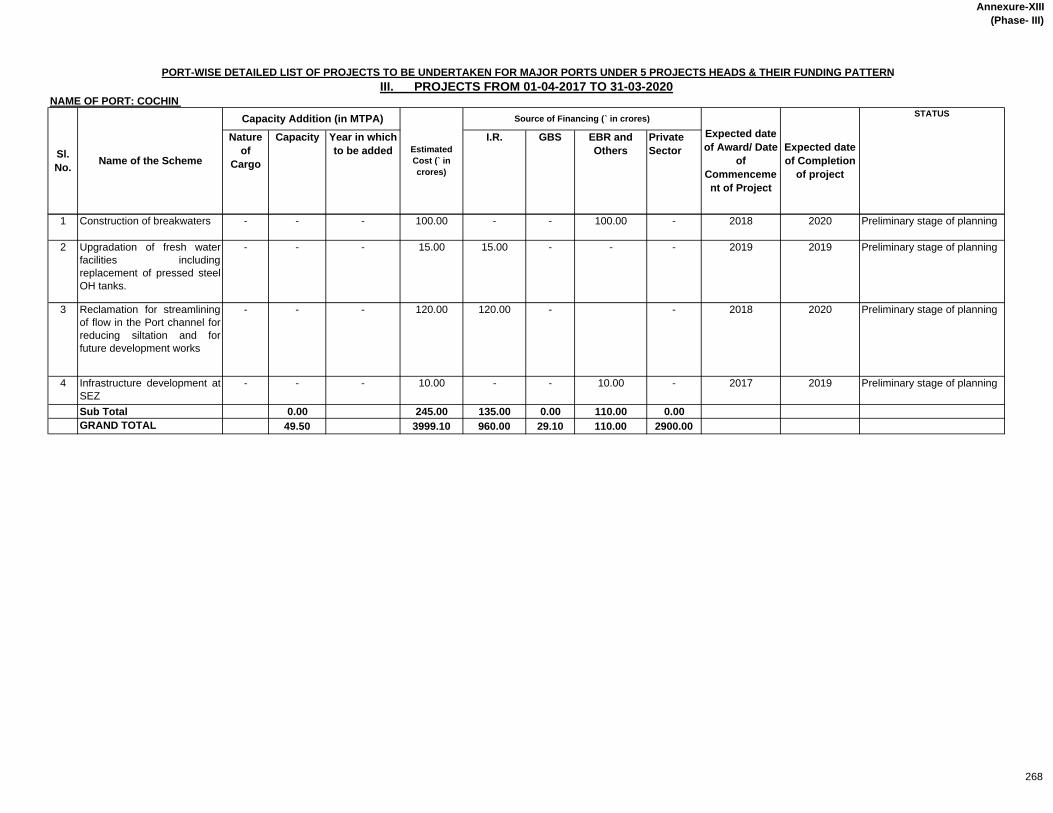
Annexure-XIII(Phase- III)
NAME OF PORT: COCHIN
Nature of
Cargo
Capacity Year in which to be added
I.R. GBS EBR and Others
Private Sector
PORT-WISE DETAILED LIST OF PROJECTS TO BE UNDERTAKEN FOR MAJOR PORTS UNDER 5 PROJECTS HEADS & THEIR FUNDING PATTERNIII. PROJECTS FROM 01-04-2017 TO 31-03-2020
Sl. No. Name of the Scheme
Capacity Addition (in MTPA) STATUS
Estimated Cost (` in crores)
Source of Financing (` in crores)
Expected date of Award/ Date
of Commencement of Project
Expected date of Completion
of project
1 Construction of breakwaters - - - 100.00 - - 100.00 - 2018 2020 Preliminary stage of planning
2 Upgradation of fresh waterfacilities includingreplacement of pressed steelOH tanks.
- - - 15.00 15.00 - - - 2019 2019 Preliminary stage of planning
3 Reclamation for streamliningof flow in the Port channel forreducing siltation and forfuture development works
- - - 120.00 120.00 - - 2018 2020 Preliminary stage of planning
4 Infrastructure development atSEZ
- - - 10.00 - - 10.00 - 2017 2019 Preliminary stage of planning
Sub Total 0.00 245.00 135.00 0.00 110.00 0.00GRAND TOTAL 49.50 3999.10 960.00 29.10 110.00 2900.00
268
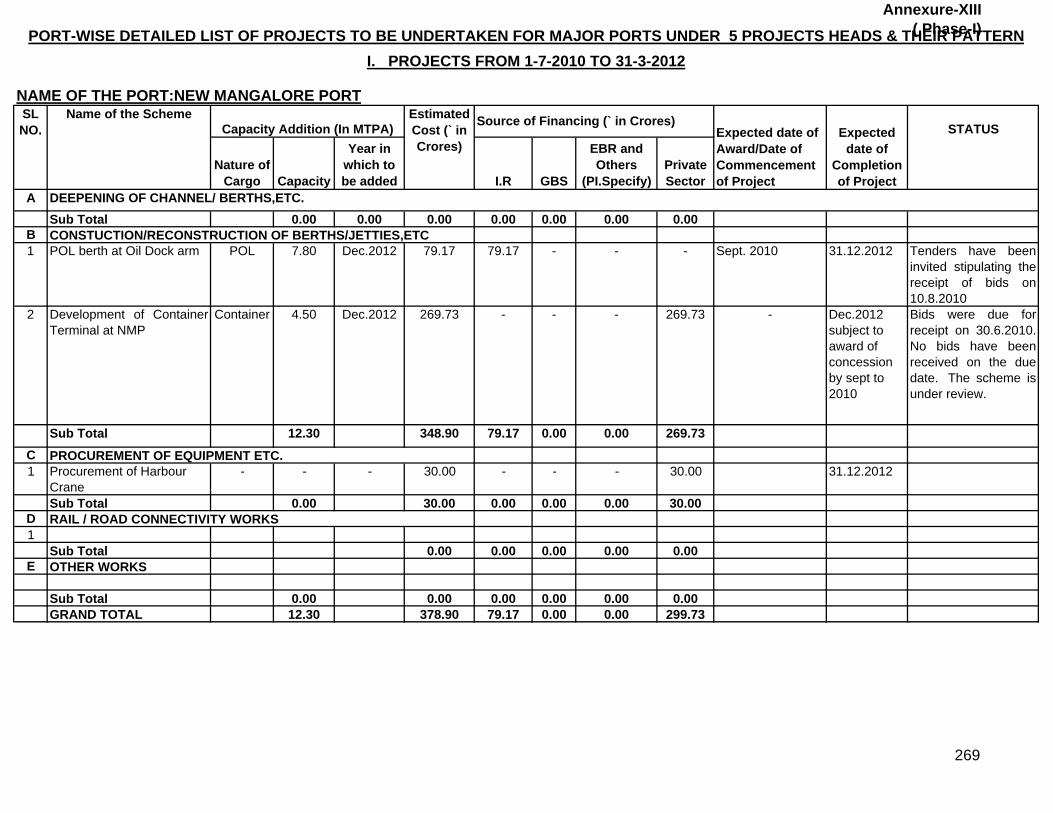
Annexure-XIII( Phase-I)
NAME OF THE PORT:NEW MANGALORE PORT
STATUS
Nature of Cargo Capacity
Year in which to be added I.R GBS
EBR and Others
(PI.Specify)Private Sector
ASub Total 0.00 0.00 0.00 0.00 0.00 0.00 0.00
B1 POL berth at Oil Dock arm POL 7.80 Dec.2012 79.17 79.17 - - - Sept. 2010 31.12.2012 Tenders have been
invited stipulating thereceipt of bids on10.8.2010
2 Development of ContainerTerminal at NMP
Container 4.50 Dec.2012 269.73 - - - 269.73 - Dec.2012 subject to award of concession by sept to 2010
Bids were due forreceipt on 30.6.2010.No bids have beenreceived on the duedate. The scheme isunder review.
Sub Total 12.30 348.90 79.17 0.00 0.00 269.73C1 Procurement of Harbour
Crane- - - 30.00 - - - 30.00 31.12.2012
Sub Total 0.00 30.00 0.00 0.00 0.00 30.00D1
Sub Total 0.00 0.00 0.00 0.00 0.00E OTHER WORKS
Sub Total 0.00 0.00 0.00 0.00 0.00 0.00GRAND TOTAL 12.30 378.90 79.17 0.00 0.00 299.73
PORT-WISE DETAILED LIST OF PROJECTS TO BE UNDERTAKEN FOR MAJOR PORTS UNDER 5 PROJECTS HEADS & THEIR PATTERNI. PROJECTS FROM 1-7-2010 TO 31-3-2012
Capacity Addition (In MTPA)Estimated Cost (` in Crores)
Source of Financing (` in Crores)Expected date of Award/Date of Commencement of Project
Expected date of
Completion of Project
CONSTUCTION/RECONSTRUCTION OF BERTHS/JETTIES,ETC
PROCUREMENT OF EQUIPMENT ETC.
RAIL / ROAD CONNECTIVITY WORKS
SL NO.
Name of the Scheme
DEEPENING OF CHANNEL/ BERTHS,ETC.
269

Annexure-IX ( Phase-II)
STATUS
Nature of Cargo
Capacity Year in which to be added
I.R GBS EBR and Others
(PI.Specify
Private Sector
ASub Total 0.00 0.00 0.00 0.00 0.00 0.00 0.00
B1 Coal handling Berth at
Western Dock armCoal 6.00 2015 147.00 147.00 - - -
2 Multipurpose General Cargo Berth
Fertilizer 5.00 2015 150.00 150.00 - - -
3 SBM to POL Crude 18.00 2015 850.00 - - - 850.00 2015 MRPL Projects
Sub Total 29.00 1147.00 297.00 0.00 0.00 850.00C
Sub Total 0.00 0.00 0.00 0.00 0.00 0.00 0.00D
Sub Total 0.00 0.00 0.00 0.00 0.00 0.00 0.00E OTHER WORKS
GRAND TOTAL 29.00 1147.00 297.00 0.00 0.00 850.00
SL NO.
Name of the SchemeNAME OF THE PORT:NEW MANGALORE PORT
PORT-WISE DETAILED LIST OF PROJECTS TO BE UNDERTAKEN FOR MAJOR PORTS UNDER 5 PROJECTS HEADS & THEIR II. PROJECTS FROM 1-4-2012 TO 31-3-2017
Estimated Cost (` in Crores)
Source of Financing (` in Crores)
CONSTUCTION/RECONSTRUCTION OF BERTHS/JETTIES,ETC
PROCUREMENT OF EQUIPMENT ETC.
RAIL / ROAD CONNECTIVITY WORKS
Expected date of Award/Date of Commencement of Project
Expected date of
Completion of Project
Capacity Addition (In MTPA)
DEEPENING OF CHANNEL/ BERTHS,ETC.
270

Annexure-XIII( Phase-III)
STATUS
Nature of
Cargo
Capacity Year in which to be added
I.R GBS EBR and Others
(*PI.Specify)
Private Sector
A1 Deepening of Channel and
lagoon Area to increase draftfrom 15.1 / 15.4 to 17.0 m
- - - 390.00 390.00 - - -
Sub Total 0.00 390.00 390.00B
Sub Total 0.00 0.00 0.00 0.00 0.00 0.00 0.00C
Sub Total 0.00 0.00 0.00 0.00 0.00 0.00 0.00D
Sub Total 0.00 0.00 0.00 0.00 0.00 0.00 0.00E OTHER WORKS
Sub Total 0.00 0.00 0.00 0.00 0.00 0.00 0.00GRAND TOTAL 0.00 390.00 390.00 0.00 0.00 0.00
NAME OF THE PORT:NEW MANGALORE PORT
PORT-WISE DETAILED LIST OF PROJECTS TO BE UNDERTAKEN FOR MAJOR PORTS UNDER 5 PROJECTS HEADS & THEIR PATTERN
III. PROJECTS FROM 1-4-2017 TO 31-3-2020
Capacity Addition (In MTPA) Estimated Cost (` in Crores)
Source of Financing (` in Crores) Expected date of Award/Date of Commencement of Project
Expected date of
Completion of Project
CONSTUCTION/RECONSTRUCTION OF BERTHS/JETTIES,ETC
RAIL / ROAD CONNECTIVITY WORKS
PROCUREMENT OF EQUIPMENT ETC.
SL NO.
Name of the Scheme
DEEPENING OF CHANNEL/ BERTHS,ETC.
271

Annexure-XIII( Phase-I)
Nature of Cargo
Capacity Year in which to be added
I.R. GBS EBR and others*
(*Pl. Specify)
Private sector
A
Sub-Total 0.00 0.00 0.00 0.00 0.00 0.00B1 Development of Coal Berth Coal 7.00 2013 496.00 - - - 496.0 May.,2010 Mar ,2013 Work in progress
Sub-Total 7.00 496.00 0.00 0.00 0.00 496.00C
Sub-Total 0.00 0.00 0.00 0.00 0.00 0.00D
Sub-TotalE
Sub-Total 0.00 0.00 0.00 0.00 0.00 0.00GRAND TOTAL 7.00 496.00 0.00 0.00 0.00 496.00
PORT-WISE DETAILED LIST OF PROJECTS TO BE UNDERTAKEN FOR MAJOR PORTS UNDER 5 PROJECT HEADS & THEIR FUNDING PATTERNI. PROJECTS FROM 1-7-2010 TO 31-03-2012
NAME OF THE PORT:- MORMUGAO PORT TRUST Capacity Addition (in MTPA) Estimated
cost (` in Crores)
Source of financing (̀ in Crores) Expected Date of
Award/ Date of
Commencement of Project
STATUSSl. No.
Name of the Project.
CONSTRUCTION /RECONSTRUCTION OF BERTHS/JETTIES, ETC.
PROCUREMENT OF EQUIPMENTS ETC.
OTHER WORKS
Expected Date of
Completion of the Project
NIL
DEEPENING OF CHANNEL/BERTHS , ETC.
RAIL/ROAD CONNECTIVITY WORKS
272

Annexure-XIII( Phase-II)
Nature of Cargo
Capacity Year in which to be added
I.R. GBS EBR and others*
(*Pl. specify)
Private sector
A
Sub Total 0.00 0.00 0.00 0.00B1 Mechanistion of Berth No. 11 for
handling coal (taken in lieu ofModification of existing Generalcargo berth to handle Iron ore)
Coal 4.00 2014 425.00 -- -- -- 425.00 -- Mar,2014 RFQ invited but subject torelocation of Kharewada fishingjetty
2 Construction of 2 berths at VascoBay
General Cargo
4.00 2016 800.00 -- -- -- 800.00 -- Mar,2016 Port is in the process ofrehabilitating encroachers from theproject site. Development ispossible only if the slums andfi hi j tt l t d3 Development of Iron Ore
Terminal at West of Breakwaterat MPT
Iron Ore 8.00 2015 721.00 0.00 -- -- 721.00 Sep.,2013 Mar,2015 RFQ invited
Sub Total 16.00 1946.00 0.00 0.00 0.00 1946.00C1 Modernization of Mechanical
Ore Handling system (Thisscheme is in lieu of Replacementof 1 bucket wheel reclaimer andReplacement 2 nos. ofshiploaders.
Iron Ore 2.00 2014 445.80 135.20 -- 310.60 -- Sep.,2013 Mar,2014 PIB note submitted to Ministry
Sub-Total 2.00 445.80 135.20 0.00 310.60 0.00D
SubTotal
PORT-WISE DETAILED LIST OF PROJECTS TO BE UNDERTAKEN FOR MAJOR PORTS UNDER 5 PROJECT HEADS & THEIR FUNDING PATTERN
II. PROJECTS FROM 1-4-2012 TO 31-03-2017NAME OF THE PORT:- MORMUGAO PORT TRUST Sl. No.
Name of the Project. Capacity Addition (in MTPA) Estimated cost (` in Crores)
Source of financing (` in Crores) Expected Date of Award/ Date of
Commencement of Project
Expected Date of
Completion of the Project
STATUS
DEEPENING OF CHANNEL/BERTHS , ETC.
CONSTRUCTION /RECONSTRUCTION OF BERTHS/JETTIES, ETC.
PROCUREMENT OF EQUIPMENTS ETC.
RAIL/ROAD CONNECTIVITY WORKSNIL
273

Annexure-XIII( Phase-II)
Nature of Cargo
Capacity Year in which to be added
I.R. GBS EBR and others*
(*Pl. specify)
Private sector
PORT-WISE DETAILED LIST OF PROJECTS TO BE UNDERTAKEN FOR MAJOR PORTS UNDER 5 PROJECT HEADS & THEIR FUNDING PATTERN
II. PROJECTS FROM 1-4-2012 TO 31-03-2017NAME OF THE PORT:- MORMUGAO PORT TRUST Sl. No.
Name of the Project. Capacity Addition (in MTPA) Estimated cost (` in Crores)
Source of financing (` in Crores) Expected Date of Award/ Date of
Commencement of Project
Expected Date of
Completion of the Project
STATUS
E
SubTotalGRAND TOTAL 18.00 2391.80 135.20 0.00 310.60 1946.00
NILOTHER WORKS
274

Annexure-XIII(Phase-III)
Nature of Cargo
Capacity Year in which to be added
I.R. GBS EBR and others*
(*Pl. Specify)
Private sector
A
Sub-TotalB
Sub-TotalC
Sub-TotalD
Sub-TotalE
Sub-TotalGRAND TOTAL 0.00 0.00
Expected Date of Award/ Date of
Commencement of Project
RAIL/ROAD CONNECTIVITY WORKS
Source of financing (` in Crores)
NIL
NIL
PORT-WISE DETAILED LIST OF PROJECTS TO BE UNDERTAKEN FOR MAJOR PORTS UNDER 5 PROJECT HEADS & THEIR FUNDING PATTERN
III. PROJECTS FROM 1-4-2017 TO 31-03-2020NAME OF THE PORT:- MORMUGAO PORT TRUST Sl. No.
Name of the Project. Capacity Addition (in MTPA)
OTHER WORKS
Expected Date of
Completion of the Project
NIL
Estimated cost (` in Crores)
NIL
STATUS
DEEPENING OF CHANNEL/BERTHS , ETC.
CONSTRUCTION /RECONSTRUCTION OF BERTHS/JETTIES, ETC.
PROCUREMENT OF EQUIPMENTS ETC.
NIL
275

Annexure-XIII
(Phase-I)
Nature of
Cargo
Capacity Year in
which to
be added
I.R. GBS EBR and
Others
(Pl.
Specify)
Private
Sector
A
1 Deepening of main harbour channel
to (-) 13.5 m cd including providing
anchorages. (Cost Rs. 900, also
appearing in JNPT and Mumbai
Share is Rs. 100)
- - - 100.00 100.00 - - - Dec.2010 Jan. 2012 Work being execuated by JNPT. MbPT's
contribution is 1/8th of cost of common portion.
Soil investigation and revised estimate are being
processed by JNPT.
2 Capital dredging for deepening
approach channel to 2nd chemical
berth at Pir Pau to increase draft to
14 m.
- - - 138.00 138.00 - - - Feb.2012 Mar. 2013 Work yet to be awarded.
Sub Total 0.00 238.00 238.00 0.00 0.00 0.00
B
1 Construction of second berth for
handling liquid chemicals/specialised
grades of POL off New Pir Pau Pier.
POL 2.00 2012 116.00 116.00 - - - Dec. 2010 Dec. 2012 Tender for dredging work re-invited and opened
on 21.08.2009 has been scrutinised. Shortlisting
approved by the Board and price bid opened on
11.01.10 & scrutinised. Since offer is high,
negotiations are under process.
Design for berthing dolphin & mooring dolphin
received from PMC. Tender for civil work invited
on 03.11.09, opened on 18.03.10 is under
scrutiny.
2 Dredging & Infrastructure
development for handling bigger ships
at 18 to 21 ID, harbour wall berths.
General
Cargo
7.00 2012 353.00 353.00 - - - Dec. 2010 July 2012 Tender for dredging work received and opened
on 28.07.08, was processed & negotiated twice
with bidder as directed by the Board. However,
Board during its meeting held on 27.01.2009
discharged the tender. Tender for dredging re-
invited on 23.04.09 and opened on 12.08.09 has
been scrutinised. The recommendations for
shortlisting of bidders submitted to the Chairman
on 04.06.10.
Tender for civil work invited on 07.08.08. Tender
opened on 31.07.09 has been scrutinised and
discharged in March 2010.
Sub Total : 9.00 469.00 469.00 0.00 0.00 0.00
C
1 Replacement of 3 nos. high capacity
ELL wharf cranes.(New)
- - - 40.00 40.00 - - - Dec. 2010 Feb. 2012 Scheme at preliminary stage.
2 Procurement of 1 no. Passenger
Launch in replacement of M.L.
Kamini.
- - - 8.00 8.00 - - - Nov. 2010 Mar. 2012 Estimate has been prepared & audit concurrence
to estimate is received. Board note is being
prepared. Proposal is under review by Standing
Committee.
Capacity Addition (In MTPA)
DEEPENING OF CHANNEL/BERTHS. ETC.
CONSTRUCTION / RECONSTRUCTION OF BERTHS/JETTIES ETC.
PROCUREMENT OF EQUIPMENTS ETC.
Source of Financing (` In crores)Sl.
No.
PORT-WISE DETAILED LIST OF PROJECTS TO BE UNDERTAKEN FOR MAJOR PORTS UNDER 5 PROJECTS HEADS & THEIR PATTERN
I. PROJECTS FROM 1-7-2010 TO 31-3-2012
NAME OF THE PORT : MUMBAI PORTName of the Scheme Estimated
Cost (` In
crores)
Expected date
of Award / Date
of
Commencemen
t of Project
Expected
date of
Completion
of Project
STATUS
276
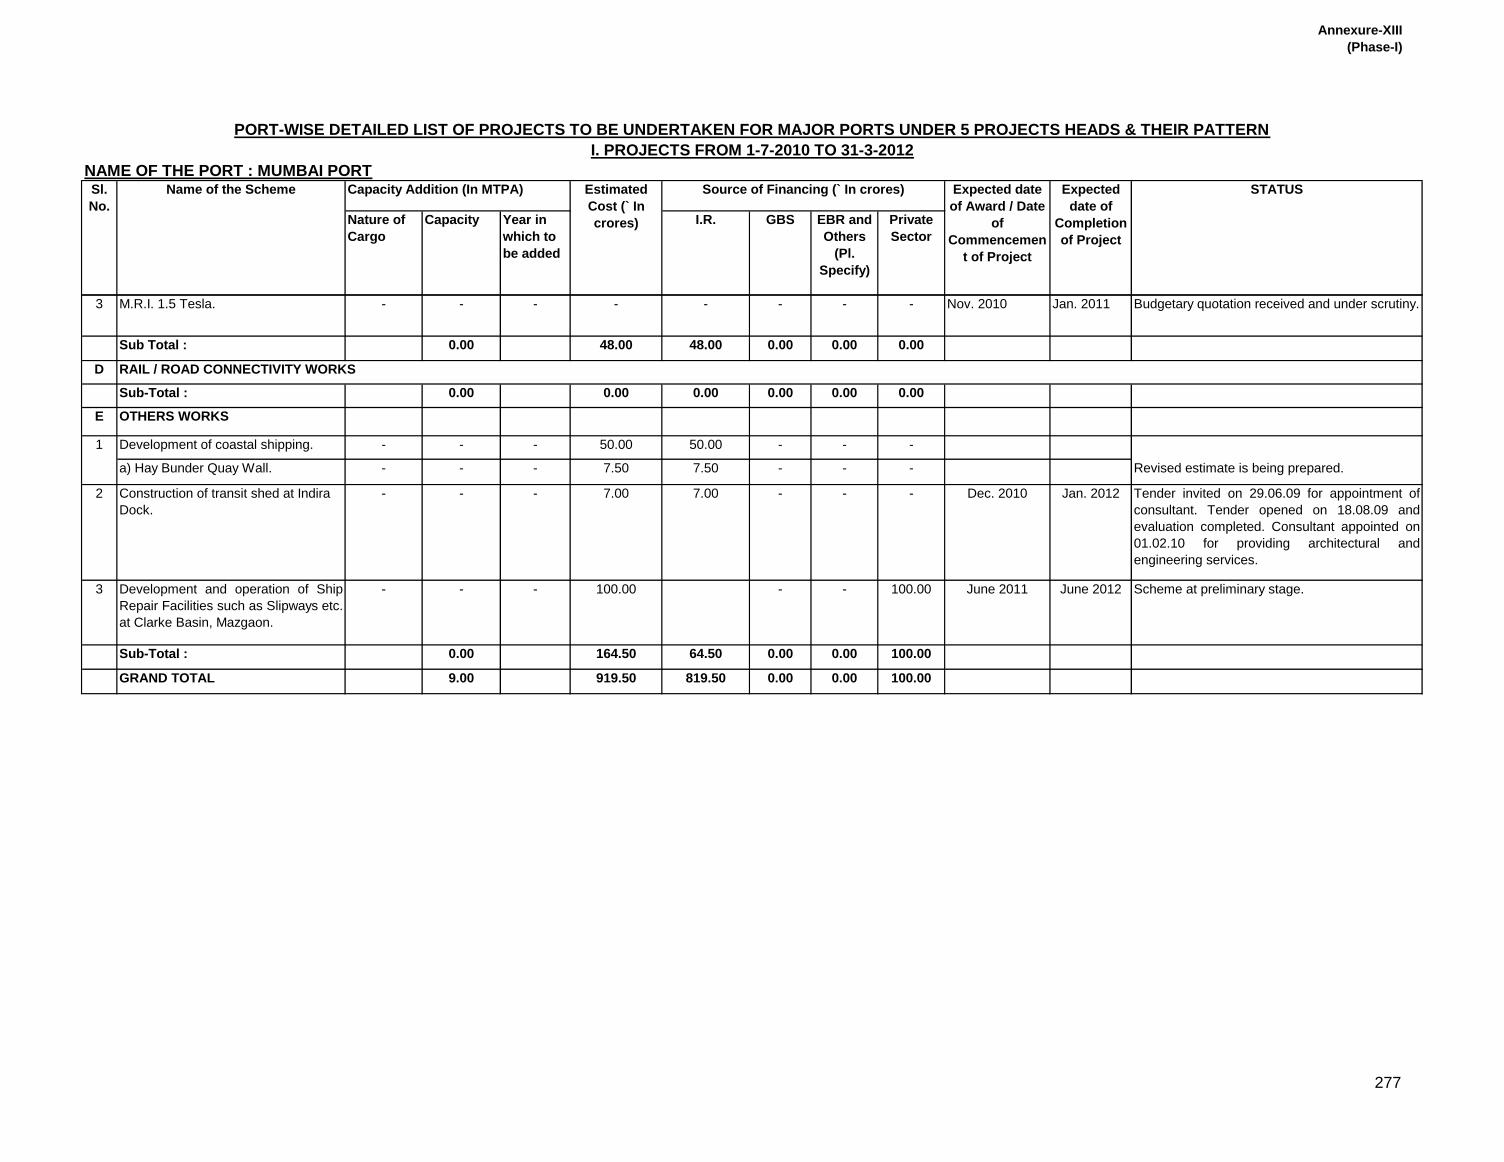
Annexure-XIII
(Phase-I)
Nature of
Cargo
Capacity Year in
which to
be added
I.R. GBS EBR and
Others
(Pl.
Specify)
Private
Sector
Capacity Addition (In MTPA) Source of Financing (` In crores)Sl.
No.
PORT-WISE DETAILED LIST OF PROJECTS TO BE UNDERTAKEN FOR MAJOR PORTS UNDER 5 PROJECTS HEADS & THEIR PATTERN
I. PROJECTS FROM 1-7-2010 TO 31-3-2012
NAME OF THE PORT : MUMBAI PORTName of the Scheme Estimated
Cost (` In
crores)
Expected date
of Award / Date
of
Commencemen
t of Project
Expected
date of
Completion
of Project
STATUS
3 M.R.I. 1.5 Tesla. - - - - - - - - Nov. 2010 Jan. 2011 Budgetary quotation received and under scrutiny.
Sub Total : 0.00 48.00 48.00 0.00 0.00 0.00
D
Sub-Total : 0.00 0.00 0.00 0.00 0.00 0.00
E OTHERS WORKS
1 Development of coastal shipping. - - - 50.00 50.00 - - -
a) Hay Bunder Quay Wall. - - - 7.50 7.50 - - - Revised estimate is being prepared.
2 Construction of transit shed at Indira
Dock.
- - - 7.00 7.00 - - - Dec. 2010 Jan. 2012 Tender invited on 29.06.09 for appointment of
consultant. Tender opened on 18.08.09 and
evaluation completed. Consultant appointed on
01.02.10 for providing architectural and
engineering services.
3 Development and operation of Ship
Repair Facilities such as Slipways etc.
at Clarke Basin, Mazgaon.
- - - 100.00 - - 100.00 June 2011 June 2012 Scheme at preliminary stage.
Sub-Total : 0.00 164.50 64.50 0.00 0.00 100.00
GRAND TOTAL 9.00 919.50 819.50 0.00 0.00 100.00
RAIL / ROAD CONNECTIVITY WORKS
277
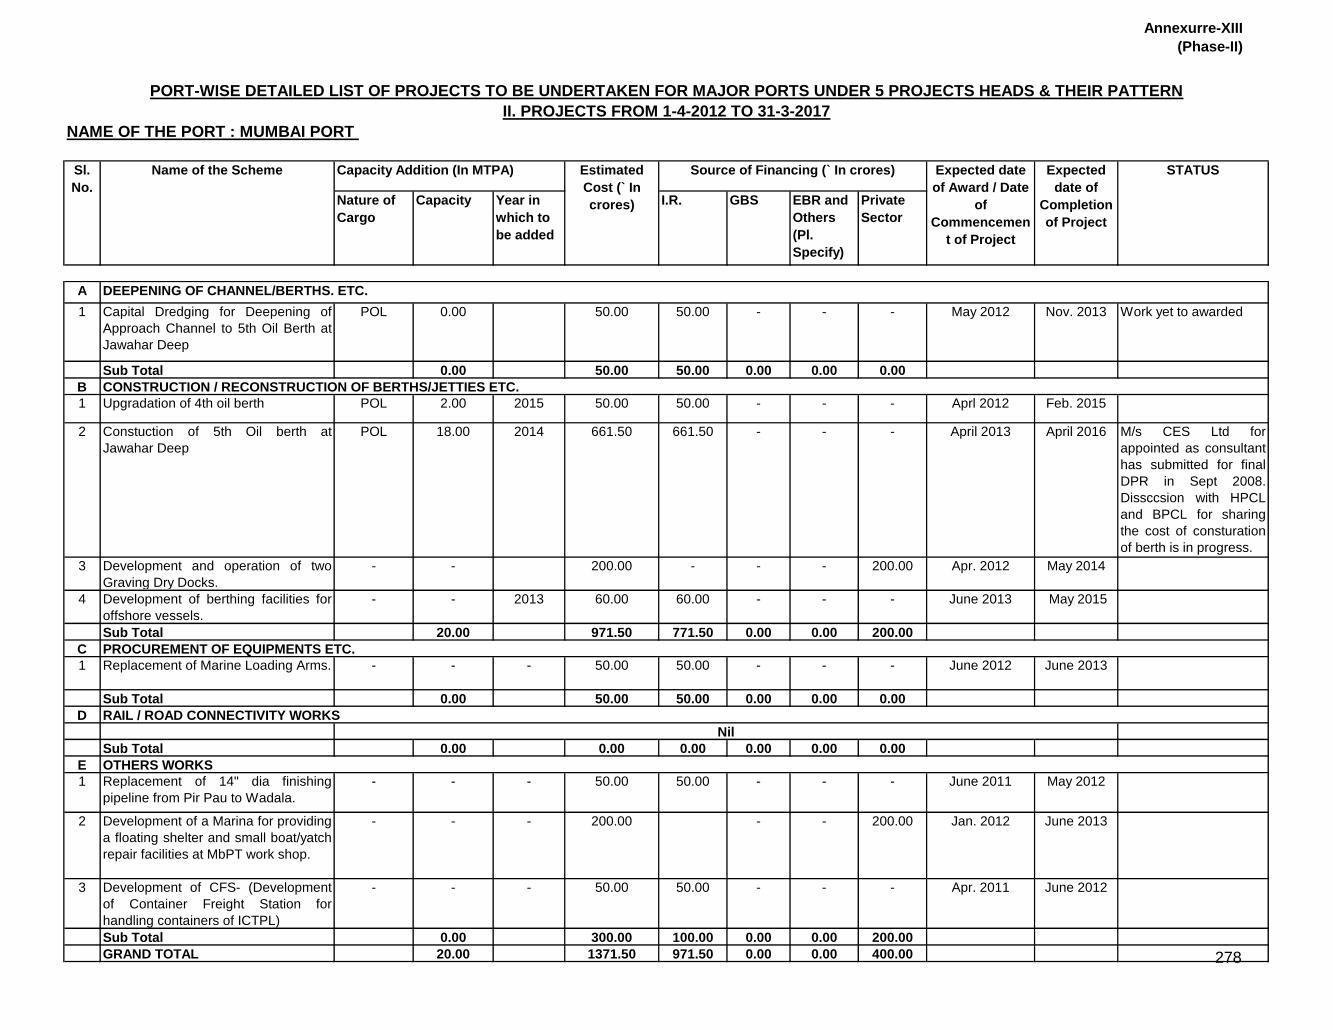
Annexurre-XIII
(Phase-II)
Nature of
Cargo
Capacity Year in
which to
be added
I.R. GBS EBR and
Others
(Pl.
Specify)
Private
Sector
A
1 Capital Dredging for Deepening of
Approach Channel to 5th Oil Berth at
Jawahar Deep
POL 0.00 50.00 50.00 - - - May 2012 Nov. 2013 Work yet to awarded
Sub Total 0.00 50.00 50.00 0.00 0.00 0.00
B
1 Upgradation of 4th oil berth POL 2.00 2015 50.00 50.00 - - - Aprl 2012 Feb. 2015
2 Constuction of 5th Oil berth at
Jawahar Deep
POL 18.00 2014 661.50 661.50 - - - April 2013 April 2016 M/s CES Ltd for
appointed as consultant
has submitted for final
DPR in Sept 2008.
Dissccsion with HPCL
and BPCL for sharing
the cost of consturation
of berth is in progress.
3 Development and operation of two
Graving Dry Docks.
- - 200.00 - - - 200.00 Apr. 2012 May 2014
4 Development of berthing facilities for
offshore vessels.
- - 2013 60.00 60.00 - - - June 2013 May 2015
Sub Total 20.00 971.50 771.50 0.00 0.00 200.00
C
1 Replacement of Marine Loading Arms. - - - 50.00 50.00 - - - June 2012 June 2013
Sub Total 0.00 50.00 50.00 0.00 0.00 0.00
D
Sub Total 0.00 0.00 0.00 0.00 0.00 0.00
E
1 Replacement of 14" dia finishing
pipeline from Pir Pau to Wadala.
- - - 50.00 50.00 - - - June 2011 May 2012
2 Development of a Marina for providing
a floating shelter and small boat/yatch
repair facilities at MbPT work shop.
- - - 200.00 - - 200.00 Jan. 2012 June 2013
3 Development of CFS- (Development
of Container Freight Station for
handling containers of ICTPL)
- - - 50.00 50.00 - - - Apr. 2011 June 2012
Sub Total 0.00 300.00 100.00 0.00 0.00 200.00
GRAND TOTAL 20.00 1371.50 971.50 0.00 0.00 400.00
RAIL / ROAD CONNECTIVITY WORKS
OTHERS WORKS
Source of Financing (` In crores) Expected date
of Award / Date
of
Commencemen
t of Project
Expected
date of
Completion
of Project
STATUS
Nil
DEEPENING OF CHANNEL/BERTHS. ETC.
CONSTRUCTION / RECONSTRUCTION OF BERTHS/JETTIES ETC.
PROCUREMENT OF EQUIPMENTS ETC.
PORT-WISE DETAILED LIST OF PROJECTS TO BE UNDERTAKEN FOR MAJOR PORTS UNDER 5 PROJECTS HEADS & THEIR PATTERN
II. PROJECTS FROM 1-4-2012 TO 31-3-2017
NAME OF THE PORT : MUMBAI PORT
Sl.
No.
Name of the Scheme Capacity Addition (In MTPA) Estimated
Cost (` In
crores)
278

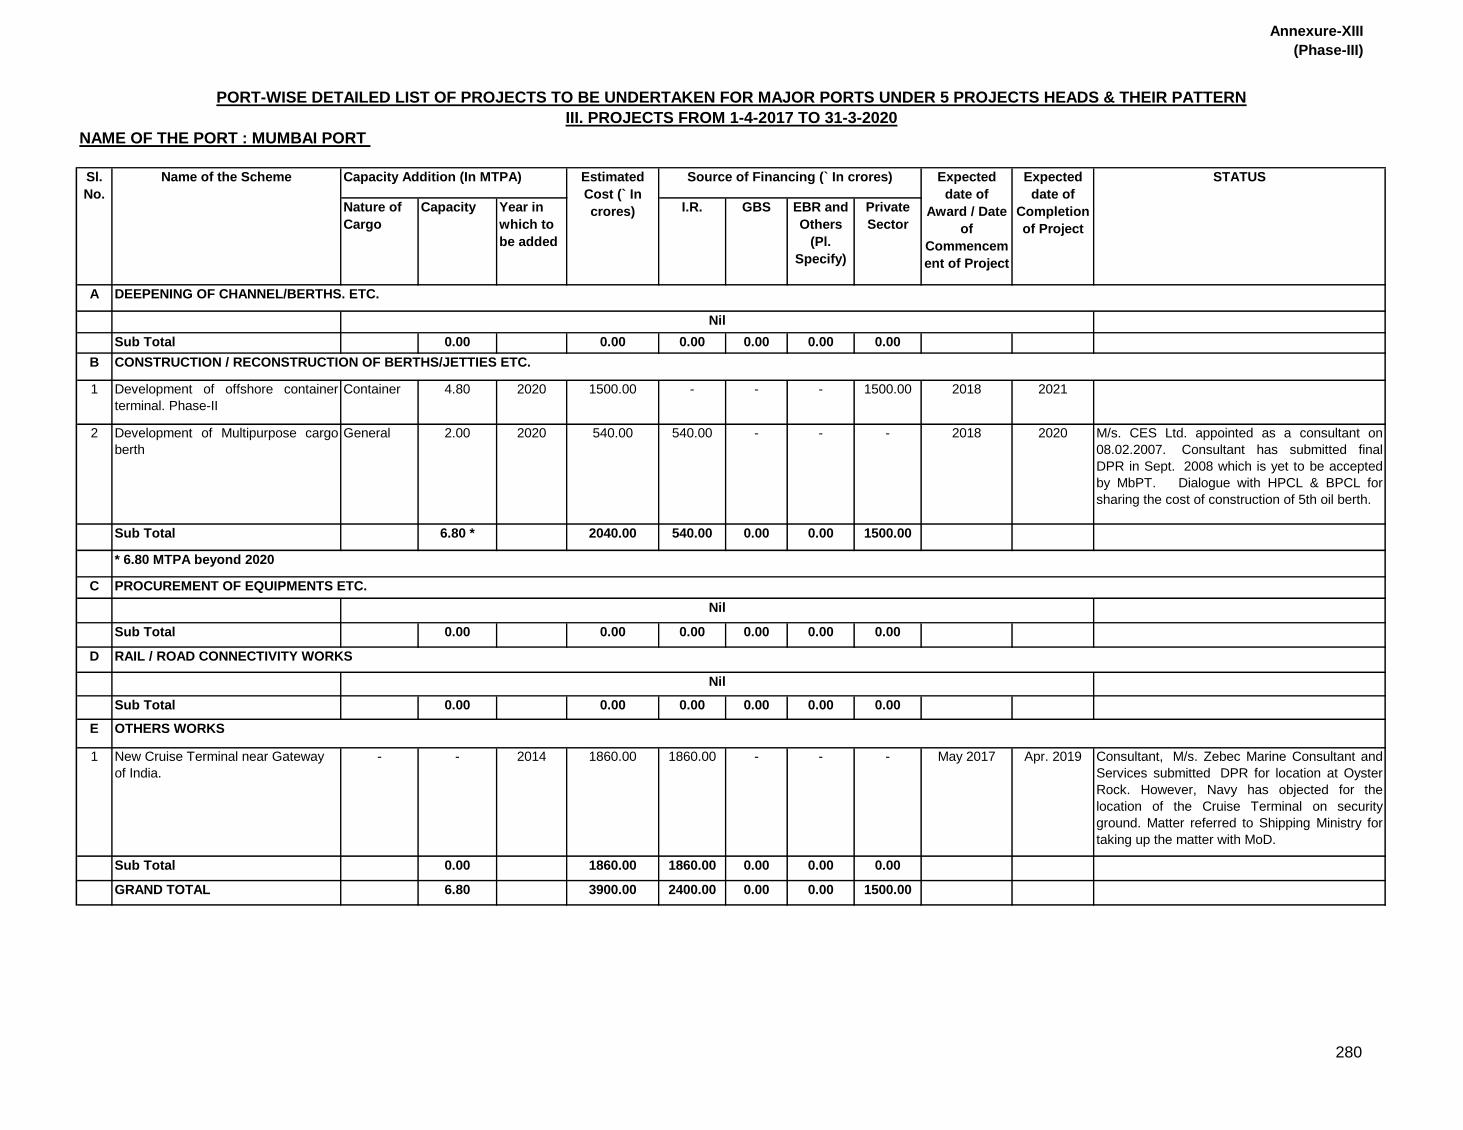
Annexure-XIII
(Phase-III)
Nature of
Cargo
Capacity Year in
which to
be added
I.R. GBS EBR and
Others
(Pl.
Specify)
Private
Sector
A
Sub Total 0.00 0.00 0.00 0.00 0.00 0.00
B
1 Development of offshore container
terminal. Phase-II
Container 4.80 2020 1500.00 - - - 1500.00 2018 2021
2 Development of Multipurpose cargo
berth
General 2.00 2020 540.00 540.00 - - - 2018 2020 M/s. CES Ltd. appointed as a consultant on
08.02.2007. Consultant has submitted final
DPR in Sept. 2008 which is yet to be accepted
by MbPT. Dialogue with HPCL & BPCL for
sharing the cost of construction of 5th oil berth.
Sub Total 6.80 * 2040.00 540.00 0.00 0.00 1500.00
* 6.80 MTPA beyond 2020
C
Sub Total 0.00 0.00 0.00 0.00 0.00 0.00
D
Sub Total 0.00 0.00 0.00 0.00 0.00 0.00
E
1 New Cruise Terminal near Gateway
of India.
- - 2014 1860.00 1860.00 - - - May 2017 Apr. 2019 Consultant, M/s. Zebec Marine Consultant and
Services submitted DPR for location at Oyster
Rock. However, Navy has objected for the
location of the Cruise Terminal on security
ground. Matter referred to Shipping Ministry for
taking up the matter with MoD.
Sub Total 0.00 1860.00 1860.00 0.00 0.00 0.00
GRAND TOTAL 6.80 3900.00 2400.00 0.00 0.00 1500.00
OTHERS WORKS
STATUS
PORT-WISE DETAILED LIST OF PROJECTS TO BE UNDERTAKEN FOR MAJOR PORTS UNDER 5 PROJECTS HEADS & THEIR PATTERN
III. PROJECTS FROM 1-4-2017 TO 31-3-2020
NAME OF THE PORT : MUMBAI PORT
Capacity Addition (In MTPA) Sl.
No.
DEEPENING OF CHANNEL/BERTHS. ETC.
Nil
Name of the Scheme Estimated
Cost (` In
crores)
Expected
date of
Award / Date
of
Commencem
ent of Project
Expected
date of
Completion
of Project
Source of Financing (` In crores)
Nil
CONSTRUCTION / RECONSTRUCTION OF BERTHS/JETTIES ETC.
PROCUREMENT OF EQUIPMENTS ETC.
RAIL / ROAD CONNECTIVITY WORKS
Nil
280
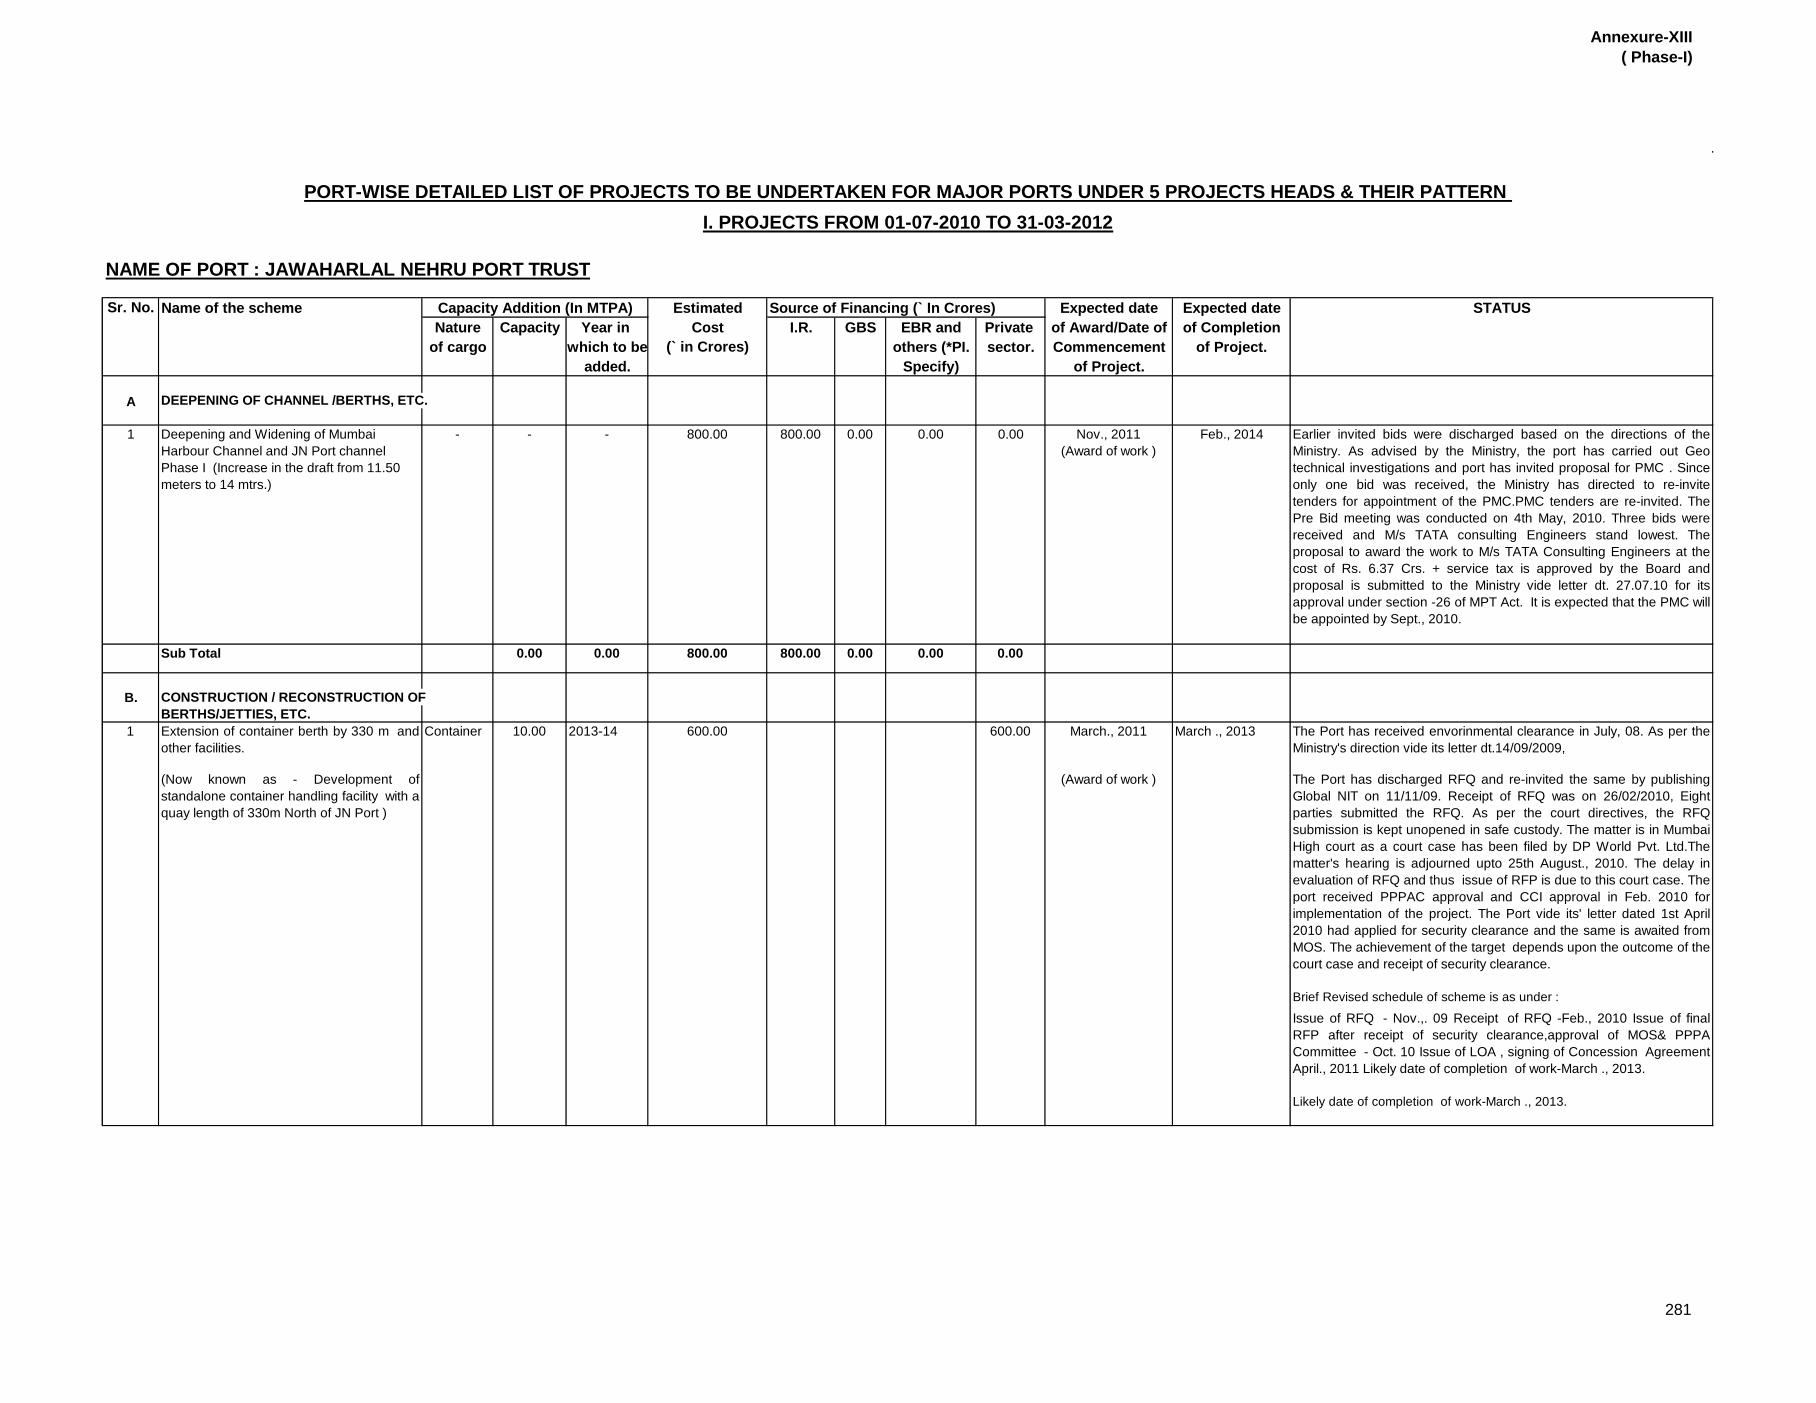
Annexure-XIII
( Phase-I)
NAME OF PORT : JAWAHARLAL NEHRU PORT TRUST
Sr. No. Name of the scheme Estimated Expected date Expected date STATUS
Nature Capacity Year in Cost I.R. GBS EBR and Private of Award/Date of of Completion
of cargo which to be (` in Crores) others (*PI. sector. Commencement of Project.
added. Specify) of Project.
A DEEPENING OF CHANNEL /BERTHS, ETC.
1 Deepening and Widening of Mumbai
Harbour Channel and JN Port channel
Phase I (Increase in the draft from 11.50
meters to 14 mtrs.)
- - - 800.00 800.00 0.00 0.00 0.00 Nov., 2011
(Award of work )
Feb., 2014 Earlier invited bids were discharged based on the directions of the
Ministry. As advised by the Ministry, the port has carried out Geo
technical investigations and port has invited proposal for PMC . Since
only one bid was received, the Ministry has directed to re-invite
tenders for appointment of the PMC.PMC tenders are re-invited. The
Pre Bid meeting was conducted on 4th May, 2010. Three bids were
received and M/s TATA consulting Engineers stand lowest. The
proposal to award the work to M/s TATA Consulting Engineers at the
cost of Rs. 6.37 Crs. + service tax is approved by the Board and
proposal is submitted to the Ministry vide letter dt. 27.07.10 for its
approval under section -26 of MPT Act. It is expected that the PMC will
be appointed by Sept., 2010.
Sub Total 0.00 0.00 800.00 800.00 0.00 0.00 0.00
B. CONSTRUCTION / RECONSTRUCTION OF
BERTHS/JETTIES, ETC.
1 Extension of container berth by 330 m and
other facilities.
Container 10.00 2013-14 600.00 600.00 March., 2011 March ., 2013 The Port has received envorinmental clearance in July, 08. As per the
Ministry's direction vide its letter dt.14/09/2009,
(Now known as - Development of
standalone container handling facility with a
quay length of 330m North of JN Port )
(Award of work ) The Port has discharged RFQ and re-invited the same by publishing
Global NIT on 11/11/09. Receipt of RFQ was on 26/02/2010, Eight
parties submitted the RFQ. As per the court directives, the RFQ
submission is kept unopened in safe custody. The matter is in Mumbai
High court as a court case has been filed by DP World Pvt. Ltd.The
matter's hearing is adjourned upto 25th August., 2010. The delay in
evaluation of RFQ and thus issue of RFP is due to this court case. The
port received PPPAC approval and CCI approval in Feb. 2010 for
implementation of the project. The Port vide its' letter dated 1st April
2010 had applied for security clearance and the same is awaited from
MOS. The achievement of the target depends upon the outcome of the
court case and receipt of security clearance.
Brief Revised schedule of scheme is as under :
Issue of RFQ - Nov.,. 09 Receipt of RFQ -Feb., 2010 Issue of final
RFP after receipt of security clearance,approval of MOS& PPPA
Committee - Oct. 10 Issue of LOA , signing of Concession Agreement
April., 2011 Likely date of completion of work-March ., 2013.
Likely date of completion of work-March ., 2013.
Source of Financing (` In Crores)
PORT-WISE DETAILED LIST OF PROJECTS TO BE UNDERTAKEN FOR MAJOR PORTS UNDER 5 PROJECTS HEADS & THEIR PATTERN
I. PROJECTS FROM 01-07-2010 TO 31-03-2012
Capacity Addition (In MTPA)
281
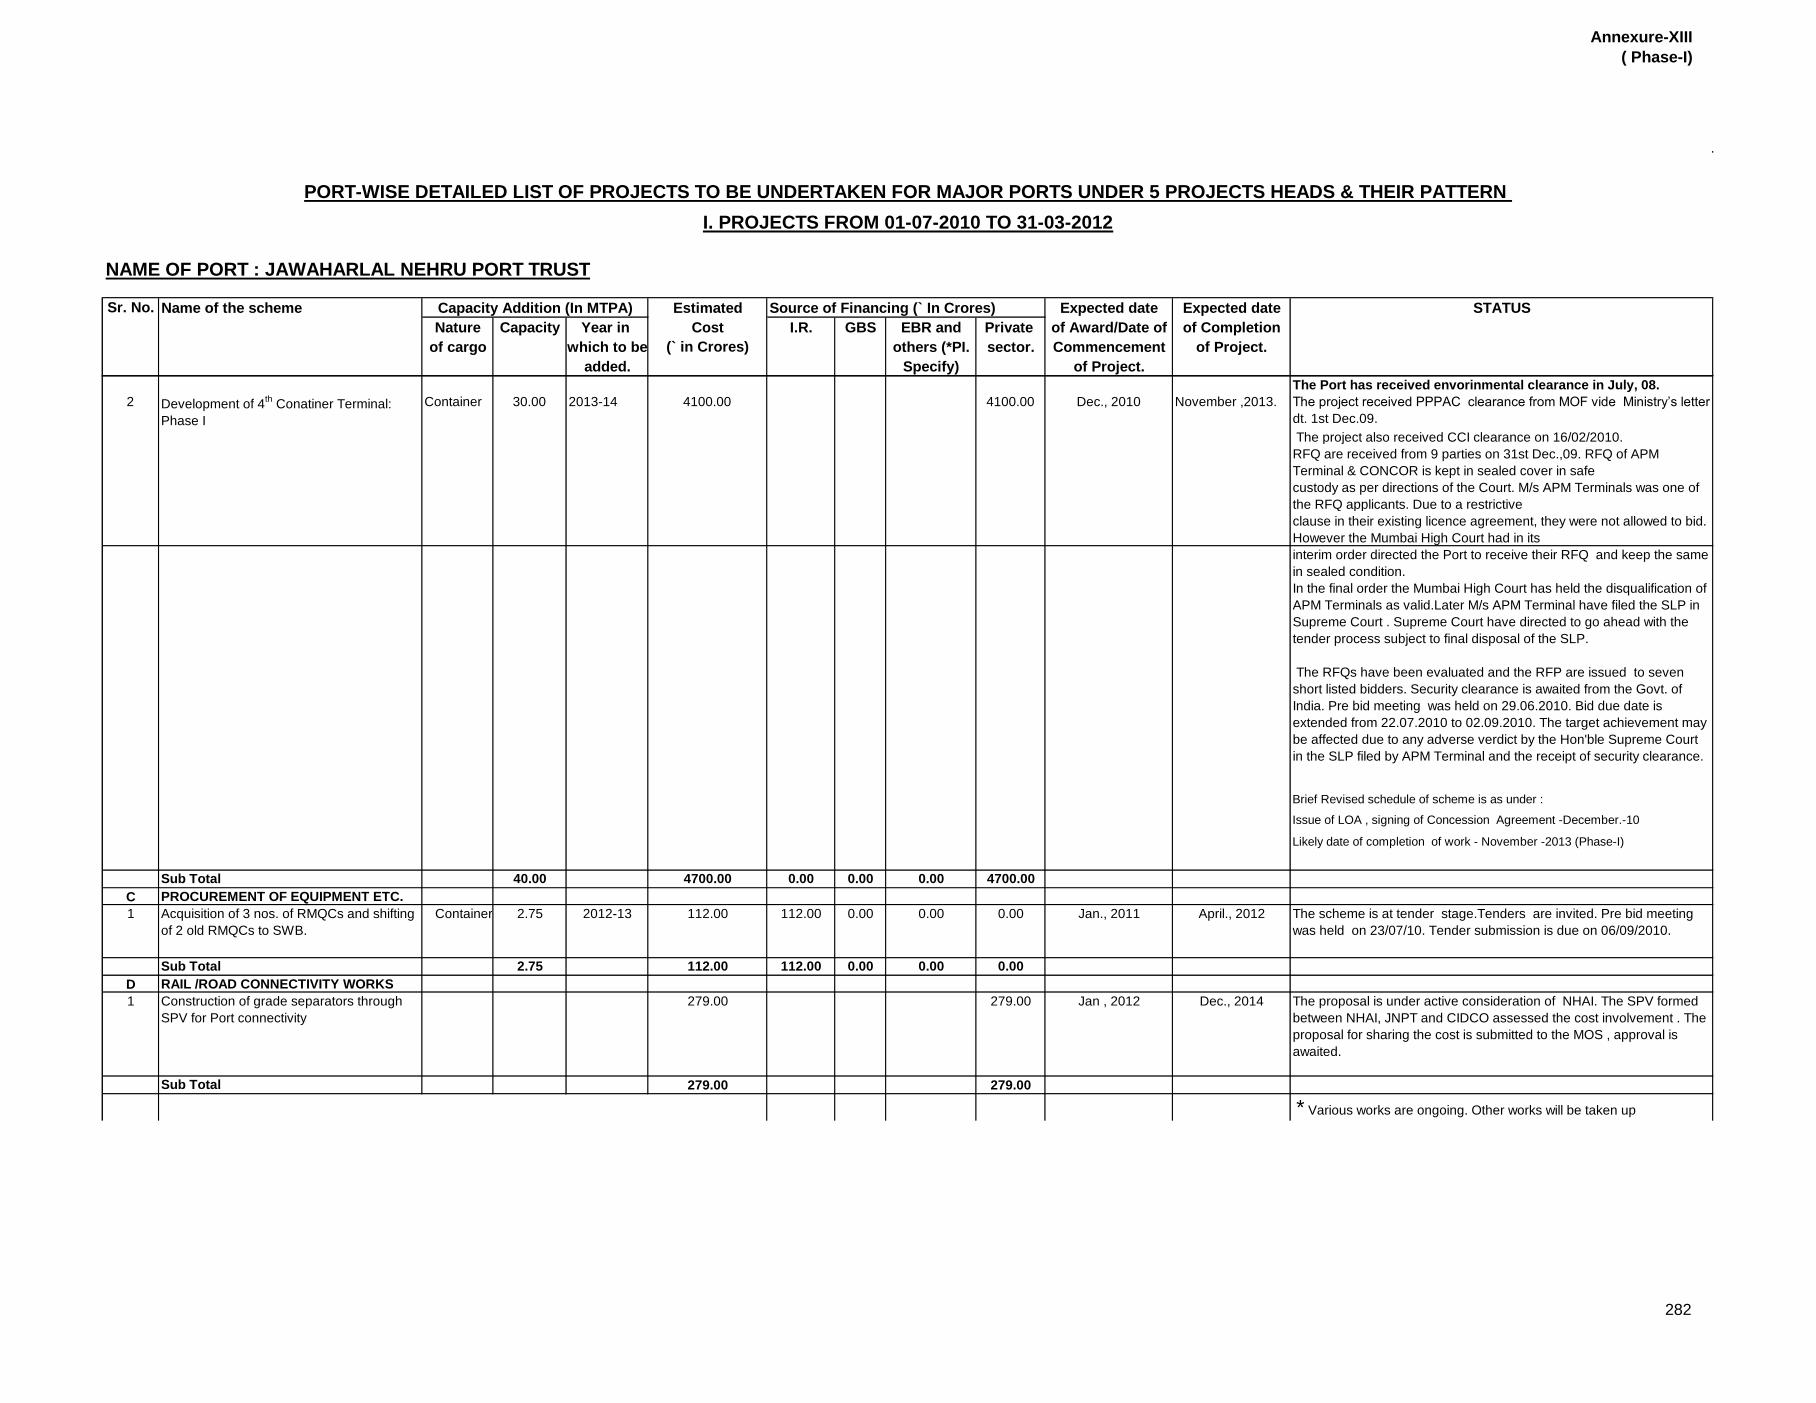
Annexure-XIII
( Phase-I)
NAME OF PORT : JAWAHARLAL NEHRU PORT TRUST
Sr. No. Name of the scheme Estimated Expected date Expected date STATUS
Nature Capacity Year in Cost I.R. GBS EBR and Private of Award/Date of of Completion
of cargo which to be (` in Crores) others (*PI. sector. Commencement of Project.
added. Specify) of Project.
Source of Financing (` In Crores)
PORT-WISE DETAILED LIST OF PROJECTS TO BE UNDERTAKEN FOR MAJOR PORTS UNDER 5 PROJECTS HEADS & THEIR PATTERN
I. PROJECTS FROM 01-07-2010 TO 31-03-2012
Capacity Addition (In MTPA)
The Port has received envorinmental clearance in July, 08.
2 Development of 4th
Conatiner Terminal:
Phase I
Container 30.00 2013-14 4100.00 4100.00 Dec., 2010 November ,2013. The project received PPPAC clearance from MOF vide Ministry’s letter
dt. 1st Dec.09.
The project also received CCI clearance on 16/02/2010.
RFQ are received from 9 parties on 31st Dec.,09. RFQ of APM
Terminal & CONCOR is kept in sealed cover in safe
custody as per directions of the Court. M/s APM Terminals was one of
the RFQ applicants. Due to a restrictive
clause in their existing licence agreement, they were not allowed to bid.
However the Mumbai High Court had in its
interim order directed the Port to receive their RFQ and keep the same
in sealed condition.
In the final order the Mumbai High Court has held the disqualification of
APM Terminals as valid.Later M/s APM Terminal have filed the SLP in
Supreme Court . Supreme Court have directed to go ahead with the
tender process subject to final disposal of the SLP.
The RFQs have been evaluated and the RFP are issued to seven
short listed bidders. Security clearance is awaited from the Govt. of
India. Pre bid meeting was held on 29.06.2010. Bid due date is
extended from 22.07.2010 to 02.09.2010. The target achievement may
be affected due to any adverse verdict by the Hon'ble Supreme Court
in the SLP filed by APM Terminal and the receipt of security clearance.
Brief Revised schedule of scheme is as under :
Issue of LOA , signing of Concession Agreement -December.-10
Likely date of completion of work - November -2013 (Phase-I)
Sub Total 40.00 4700.00 0.00 0.00 0.00 4700.00
C PROCUREMENT OF EQUIPMENT ETC.
1 Acquisition of 3 nos. of RMQCs and shifting
of 2 old RMQCs to SWB.
Container 2.75 2012-13 112.00 112.00 0.00 0.00 0.00 Jan., 2011 April., 2012 The scheme is at tender stage.Tenders are invited. Pre bid meeting
was held on 23/07/10. Tender submission is due on 06/09/2010.
Sub Total 2.75 112.00 112.00 0.00 0.00 0.00
D RAIL /ROAD CONNECTIVITY WORKS
1 Construction of grade separators through
SPV for Port connectivity
279.00 279.00 Jan , 2012 Dec., 2014 The proposal is under active consideration of NHAI. The SPV formed
between NHAI, JNPT and CIDCO assessed the cost involvement . The
proposal for sharing the cost is submitted to the MOS , approval is
awaited.
Sub Total 279.00 279.00
* Various works are ongoing. Other works will be taken up
282
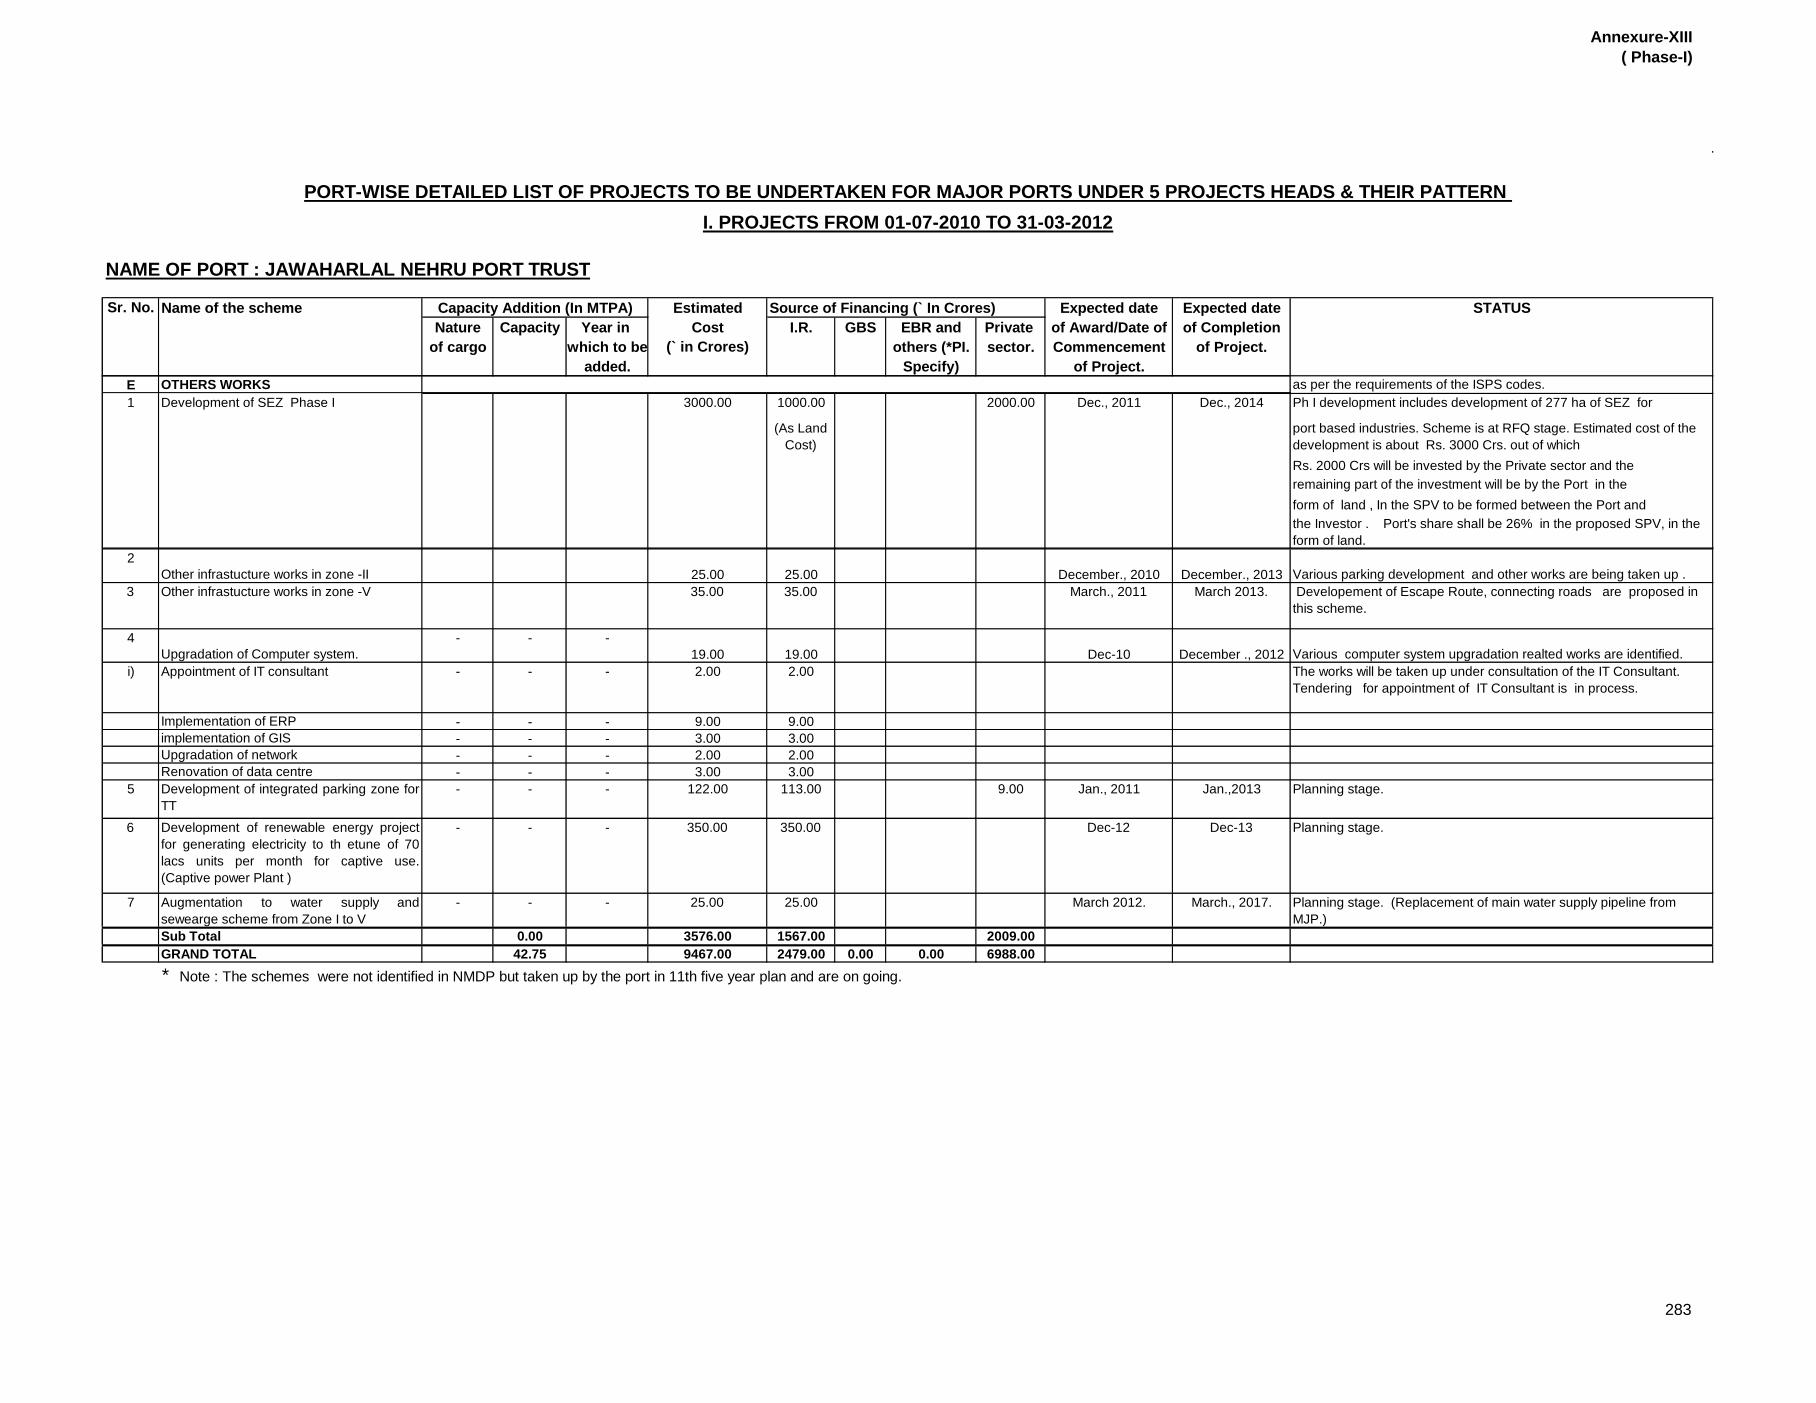
Annexure-XIII
( Phase-I)
NAME OF PORT : JAWAHARLAL NEHRU PORT TRUST
Sr. No. Name of the scheme Estimated Expected date Expected date STATUS
Nature Capacity Year in Cost I.R. GBS EBR and Private of Award/Date of of Completion
of cargo which to be (` in Crores) others (*PI. sector. Commencement of Project.
added. Specify) of Project.
Source of Financing (` In Crores)
PORT-WISE DETAILED LIST OF PROJECTS TO BE UNDERTAKEN FOR MAJOR PORTS UNDER 5 PROJECTS HEADS & THEIR PATTERN
I. PROJECTS FROM 01-07-2010 TO 31-03-2012
Capacity Addition (In MTPA)
E OTHERS WORKS as per the requirements of the ISPS codes.
1 Development of SEZ Phase I 3000.00 1000.00 2000.00 Dec., 2011 Dec., 2014 Ph I development includes development of 277 ha of SEZ for
(As Land
Cost)
port based industries. Scheme is at RFQ stage. Estimated cost of the
development is about Rs. 3000 Crs. out of which
Rs. 2000 Crs will be invested by the Private sector and the
remaining part of the investment will be by the Port in the
form of land , In the SPV to be formed between the Port and
the Investor . Port's share shall be 26% in the proposed SPV, in the
form of land.
2
Other infrastucture works in zone -II 25.00 25.00 December., 2010 December., 2013 Various parking development and other works are being taken up .
3 Other infrastucture works in zone -V 35.00 35.00 March., 2011 March 2013. Developement of Escape Route, connecting roads are proposed in
this scheme.
4
Upgradation of Computer system.
- - -
19.00 19.00 Dec-10 December ., 2012 Various computer system upgradation realted works are identified.
i) Appointment of IT consultant - - - 2.00 2.00 The works will be taken up under consultation of the IT Consultant.
Tendering for appointment of IT Consultant is in process.
Implementation of ERP - - - 9.00 9.00
implementation of GIS - - - 3.00 3.00
Upgradation of network - - - 2.00 2.00
Renovation of data centre - - - 3.00 3.00
5 Development of integrated parking zone for
TT
- - - 122.00 113.00 9.00 Jan., 2011 Jan.,2013 Planning stage.
6 Development of renewable energy project
for generating electricity to th etune of 70
lacs units per month for captive use.
(Captive power Plant )
- - - 350.00 350.00 Dec-12 Dec-13 Planning stage.
7 Augmentation to water supply and
sewearge scheme from Zone I to V
- - - 25.00 25.00 March 2012. March., 2017. Planning stage. (Replacement of main water supply pipeline from
MJP.)
Sub Total 0.00 3576.00 1567.00 2009.00
GRAND TOTAL 42.75 9467.00 2479.00 0.00 0.00 6988.00
* Note : The schemes were not identified in NMDP but taken up by the port in 11th five year plan and are on going.
283

Annexure-XIII
( Phase-II)
Nature of
Cargo
Capacity Year in
which
to be
added
I.R. GBS EBR and
others*
(*Pl.
specify)
Private
sector
A
B
1 * Development of 4th Conatiner
Terminal: Phase II
Container 30.00 2015-16 2600.00 0.00 - - 2600.00 Dec., 2013 Nov. 2015. The Phase II works are proposed
to be taken up after completion of
the 4th Contianer terminal Phase I .
Likely completion year Phase II:
2015-16.
Sub-Total 30.00 2600.00 0.00 0.00 0.00 2600.00
C
1 Acquisition of 6 RTYGCs Container - 2017 30.00 30.00 - - - 2016 2017 The Scheme is being reviewed in
view of report of National Tribunal
Award on manning Scale The
scheme will be converted into
replacement against 6 RTYGCs i.e.
3 acuired in 1995 & 3 in 1997 on
completion of their economic life.
2 Replacement of 1 RMGC Container - 2015 23.10 23.10 - - - 2014 2015 The Scheme is at Planning Stage
and will be included in 12th Five
year Plan. The estimated cost is
taken considering the award cost of
1 RMGC in 2009.
3 Acquisition of 4 RTYGCs Container - 2015 26.00 26.00 - - - - - The Scheme is at Planning Stage
and will be included in 12th Five
year Plan.
NAME OF THE PORT: JAWAHARLAL NEHRU PORT TRUST
PROCUREMENT OF EQUIPMENTS ETC.
Nil
DEEPENING OF CHANNEL/BERTHS , ETC.
CONSTRUCTION /RECONSTRUCTION OF BERTHS/JETTIES, ETC.
Expected
Date of
Award/
Date of
Commenc
ement of
Project
PORT-WISE DETAILED LIST OF PROJECTS TO BE UNDERTAKEN FOR MAJOR PORTS UNDER 5 PROJECTS HEADS & THEIR PATTERN
II. PROJECTS FROM 1-4-2012 TO 31-03-2017
Expected
Date of
Completion
of the
Project
STATUSSl.
No.
Name of the Project. Capacity Addition (in MTPA) Estimated
cost (` in
Crores)
Source of Financing (` In
Crores)
284

Annexure-XIII
( Phase-II)
Nature of
Cargo
Capacity Year in
which
to be
added
I.R. GBS EBR and
others*
(*Pl.
specify)
Private
sector
NAME OF THE PORT: JAWAHARLAL NEHRU PORT TRUST
Expected
Date of
Award/
Date of
Commenc
ement of
Project
PORT-WISE DETAILED LIST OF PROJECTS TO BE UNDERTAKEN FOR MAJOR PORTS UNDER 5 PROJECTS HEADS & THEIR PATTERN
II. PROJECTS FROM 1-4-2012 TO 31-03-2017
Expected
Date of
Completion
of the
Project
STATUSSl.
No.
Name of the Project. Capacity Addition (in MTPA) Estimated
cost (` in
Crores)
Source of Financing (` In
Crores)
4 Repalcement of 20 nos of Tractor
Trailer acquired in the year 2006.
Container - 2016 20.00 20.00 - - - 2015 2016 The scheme will be included in 12th
Five Year plan.The scheme will be
executed after review of completed
operational life time and health of
the equipment.
5 Acquisition of 2 nos super-post
panamax size RMQCs at Main
Container Berth and shifting of 2
nos existing RMQCs from MCB to
SDB.
Container 1.87 2017-18 90.00 90.00 0.00 0.00 0.00 March
.,2016
June., 2017 The scheme is prposed to be
included in 12th Five year plan.
Under this scheme it is proposed to
shift RMQC 3 & 4 (acuired in the
year 2002) from MCB to SDB and
the existing two RMQCs at SDB will
be replaced as they will be
completing their economical life & 2
new RMQCs acquired against these
will be palced on MCB. However,
Sub Total: 1.87 189.10 189.10 0.00 0.00 0.00
D
1 Construction of second
evacuation road from Container
Gate to CFS / Dronagiri
- - - 45.00 45.00 -- -- -- April 2015 Dec.,2017 The Techno-feasibility report is
submitted by the Consultants.
Proposal for development of the
road is being reviewed w.r.to the
mangroove problem and proposed
development of SEZ .
Sub-Total 0.00 0.00 45.00 45.00 0.00 0.00 0.00
RAIL/ROAD CONNECTIVITY WORKS
285

Annexure-XIII
( Phase-II)
Nature of
Cargo
Capacity Year in
which
to be
added
I.R. GBS EBR and
others*
(*Pl.
specify)
Private
sector
NAME OF THE PORT: JAWAHARLAL NEHRU PORT TRUST
Expected
Date of
Award/
Date of
Commenc
ement of
Project
PORT-WISE DETAILED LIST OF PROJECTS TO BE UNDERTAKEN FOR MAJOR PORTS UNDER 5 PROJECTS HEADS & THEIR PATTERN
II. PROJECTS FROM 1-4-2012 TO 31-03-2017
Expected
Date of
Completion
of the
Project
STATUSSl.
No.
Name of the Project. Capacity Addition (in MTPA) Estimated
cost (` in
Crores)
Source of Financing (` In
Crores)
E
1 Environmental measures - - - 5.00 5.00 -- -- -- April., 2012 March ,2017. Scheme is at planning stage.
Environmental measures for the
infrastructure development
pertaining to 4th Container Terminal
development will be under taken .
2 Development of SEZ Phase II -- -- -- 9000.00 3000.00 -- -- 6000.00 Jan., 2015 Dec., 2017
3 Automation of Conatiner gates -- -- -- 12.00 12.00 -- -- -- April.,
2012
March.,
2013.
Planning stage.
Sub Total 0.00 9017.00 3017.00 0.00 0.00 6000.00
GRAND TOTAL 31.87 11851.10 3251.10 0.00 0.00 8600.00
* Note : The scheme was not identified in NMDP but taken up by the port in 11th five year plan alongwith 4th Container Terminal PH I development.
OTHER WORKS
286
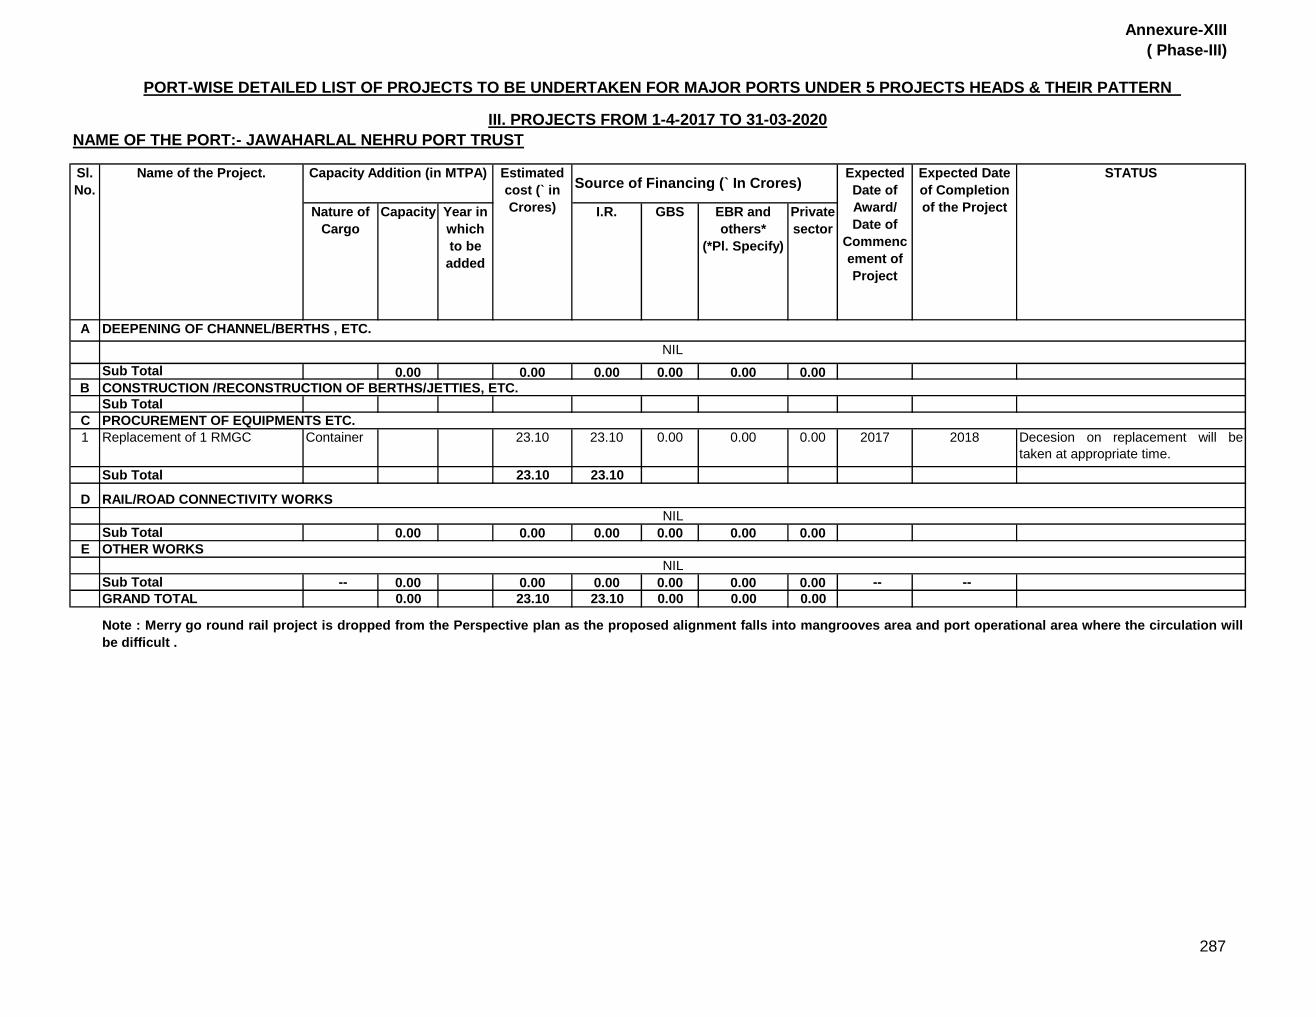
Annexure-XIII
( Phase-III)
Nature of
Cargo
Capacity Year in
which
to be
added
I.R. GBS EBR and
others*
(*Pl. Specify)
Private
sector
A
Sub Total 0.00 0.00 0.00 0.00 0.00 0.00B
Sub Total
C
1 Replacement of 1 RMGC Container 23.10 23.10 0.00 0.00 0.00 2017 2018 Decesion on replacement will be
taken at appropriate time.
Sub Total 23.10 23.10
D
Sub Total 0.00 0.00 0.00 0.00 0.00 0.00
E
Sub Total -- 0.00 0.00 0.00 0.00 0.00 0.00 -- --
GRAND TOTAL 0.00 23.10 23.10 0.00 0.00 0.00
STATUS
DEEPENING OF CHANNEL/BERTHS , ETC.
NIL
CONSTRUCTION /RECONSTRUCTION OF BERTHS/JETTIES, ETC.
NIL
Note : Merry go round rail project is dropped from the Perspective plan as the proposed alignment falls into mangrooves area and port operational area where the circulation will
be difficult .
PROCUREMENT OF EQUIPMENTS ETC.
RAIL/ROAD CONNECTIVITY WORKS
NIL
OTHER WORKS
PORT-WISE DETAILED LIST OF PROJECTS TO BE UNDERTAKEN FOR MAJOR PORTS UNDER 5 PROJECTS HEADS & THEIR PATTERN
III. PROJECTS FROM 1-4-2017 TO 31-03-2020
NAME OF THE PORT:- JAWAHARLAL NEHRU PORT TRUST
Sl.
No.
Name of the Project. Capacity Addition (in MTPA) Estimated
cost (` in
Crores)
Source of Financing (` In Crores)Expected
Date of
Award/
Date of
Commenc
ement of
Project
Expected Date
of Completion
of the Project
287

Annexure-XIII
( Phase-I)
NAME OF THE PORT:KANDLA PORT TRUST
Capacity Addition (in MTPA)
Nature of
Cargo
Capacity I.R. GBS EBR and others*
(Pl. Specify)
Private
Sector
A DEEPENING OF CHANNEL/BERTHS ETC. Nil
Sub Total 0.00 0.00 0.00 0.00 0.00 0.00
B CONSTRUCTION/RECONSTRUCTION OF
BERTHS/JETTIES ETC.
1 Development of dry bulk terminal off veera
near Tuna outside Kandla creek
General Dry
bulk cargo
excpet liquid
and container
14.00 2012-13 1140.00 240.00 - - 900.00 2010-11 2012-13 PPPAC and security clearance has been
received. Environment Clearance being
obtained. Upfront tariff being fixed with the
approval of TAMP.
2 Setting up of off-shore liquid terminal Liquid cargo 9.00 2012-13 830.00 0.00 - - 830.00 2010-11 2012-13 PPPAC memo alongwith draft RFP, RFQ
and DCA has been sent to the
Ministry.Environment Clearance being
obtained. Upfront tariff being fixed with the
approval of TAMP.
3 Barge handling facilities at Bunder basin on
PPP model
General cargo
excpet liquid
and container
4.50 2012-13 41.40 7.40 - - 34.00 2011-12 2012-13 Feasibility Report is under preparation.
4 Construction of barge jetty at IFFCO Captive cargo
(Raw material )
2.00 2012-13 27.00 0.00 - - 27.00 2010-11 2012-13 In-principle approval has been received
from SFC. DCA submitted to the Ministry
for approval,
5 Construction of barge jetty at Tuna General cargo
excpet liquid
and container
6.00 2012-13 100.00 100.00 - - 0.00 2011-12 2012-13 At planning stage, feasibility report is being
framed by Transaction Advisor.
Sub Total 35.50 2138.40 347.40 0.00 0.00 1791.00
Name of the Scheme Year in
which
to be
added
PORT-WISE DETAILED LIST OF PROJECTS TO BE UNDERTAKEN FOR MAJOR PORTS UNDER 5 PROJECT HEADS & THEIR FUNDING PATTERN
I. PROJECTS FROM 01-07-2010 TO 31-03-2012
Sl.
No.
Source of Financing (` in Crores) STATUSEstimated
Cost
(` in Crores)
Expected
date of
Award /
Date of
Commence
ment of
Project
Expected date
of Completion
of Project
288
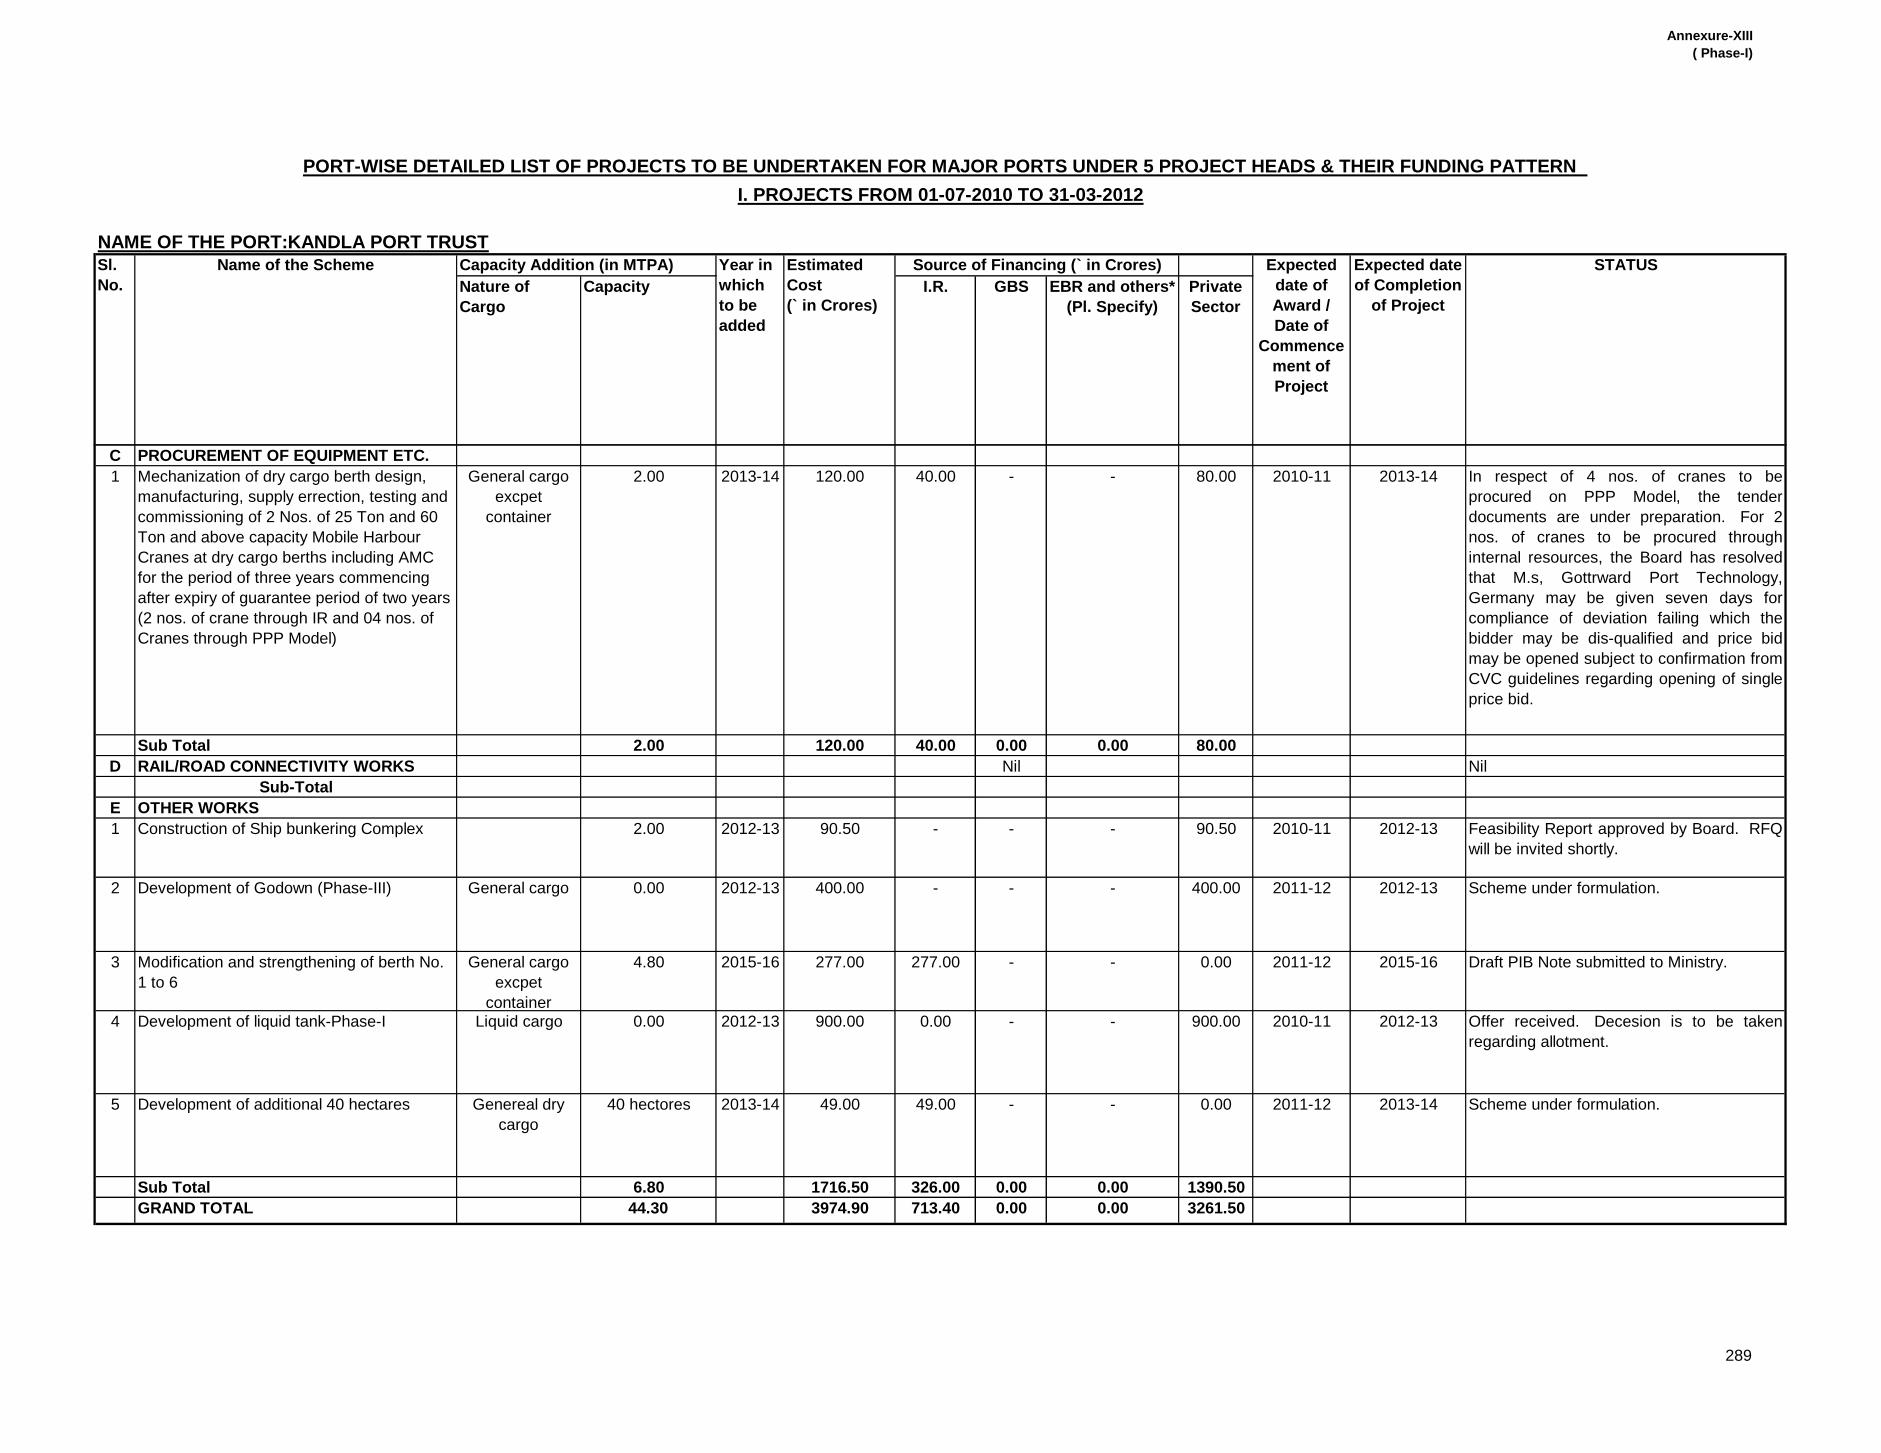
Annexure-XIII
( Phase-I)
NAME OF THE PORT:KANDLA PORT TRUST
Capacity Addition (in MTPA)
Nature of
Cargo
Capacity I.R. GBS EBR and others*
(Pl. Specify)
Private
Sector
Name of the Scheme Year in
which
to be
added
PORT-WISE DETAILED LIST OF PROJECTS TO BE UNDERTAKEN FOR MAJOR PORTS UNDER 5 PROJECT HEADS & THEIR FUNDING PATTERN
I. PROJECTS FROM 01-07-2010 TO 31-03-2012
Sl.
No.
Source of Financing (` in Crores) STATUSEstimated
Cost
(` in Crores)
Expected
date of
Award /
Date of
Commence
ment of
Project
Expected date
of Completion
of Project
C PROCUREMENT OF EQUIPMENT ETC.
1 Mechanization of dry cargo berth design,
manufacturing, supply errection, testing and
commissioning of 2 Nos. of 25 Ton and 60
Ton and above capacity Mobile Harbour
Cranes at dry cargo berths including AMC
for the period of three years commencing
after expiry of guarantee period of two years
(2 nos. of crane through IR and 04 nos. of
Cranes through PPP Model)
General cargo
excpet
container
2.00 2013-14 120.00 40.00 - - 80.00 2010-11 2013-14 In respect of 4 nos. of cranes to be
procured on PPP Model, the tender
documents are under preparation. For 2
nos. of cranes to be procured through
internal resources, the Board has resolved
that M.s, Gottrward Port Technology,
Germany may be given seven days for
compliance of deviation failing which the
bidder may be dis-qualified and price bid
may be opened subject to confirmation from
CVC guidelines regarding opening of single
price bid.
Sub Total 2.00 120.00 40.00 0.00 0.00 80.00
D RAIL/ROAD CONNECTIVITY WORKS Nil Nil
Sub-Total
E OTHER WORKS
1 Construction of Ship bunkering Complex 2.00 2012-13 90.50 - - - 90.50 2010-11 2012-13 Feasibility Report approved by Board. RFQ
will be invited shortly.
2 Development of Godown (Phase-III) General cargo 0.00 2012-13 400.00 - - - 400.00 2011-12 2012-13 Scheme under formulation.
3 Modification and strengthening of berth No.
1 to 6
General cargo
excpet
container
4.80 2015-16 277.00 277.00 - - 0.00 2011-12 2015-16 Draft PIB Note submitted to Ministry.
4 Development of liquid tank-Phase-I Liquid cargo 0.00 2012-13 900.00 0.00 - - 900.00 2010-11 2012-13 Offer received. Decesion is to be taken
regarding allotment.
5 Development of additional 40 hectares Genereal dry
cargo
40 hectores 2013-14 49.00 49.00 - - 0.00 2011-12 2013-14 Scheme under formulation.
Sub Total 6.80 1716.50 326.00 0.00 0.00 1390.50
GRAND TOTAL 44.30 3974.90 713.40 0.00 0.00 3261.50
289
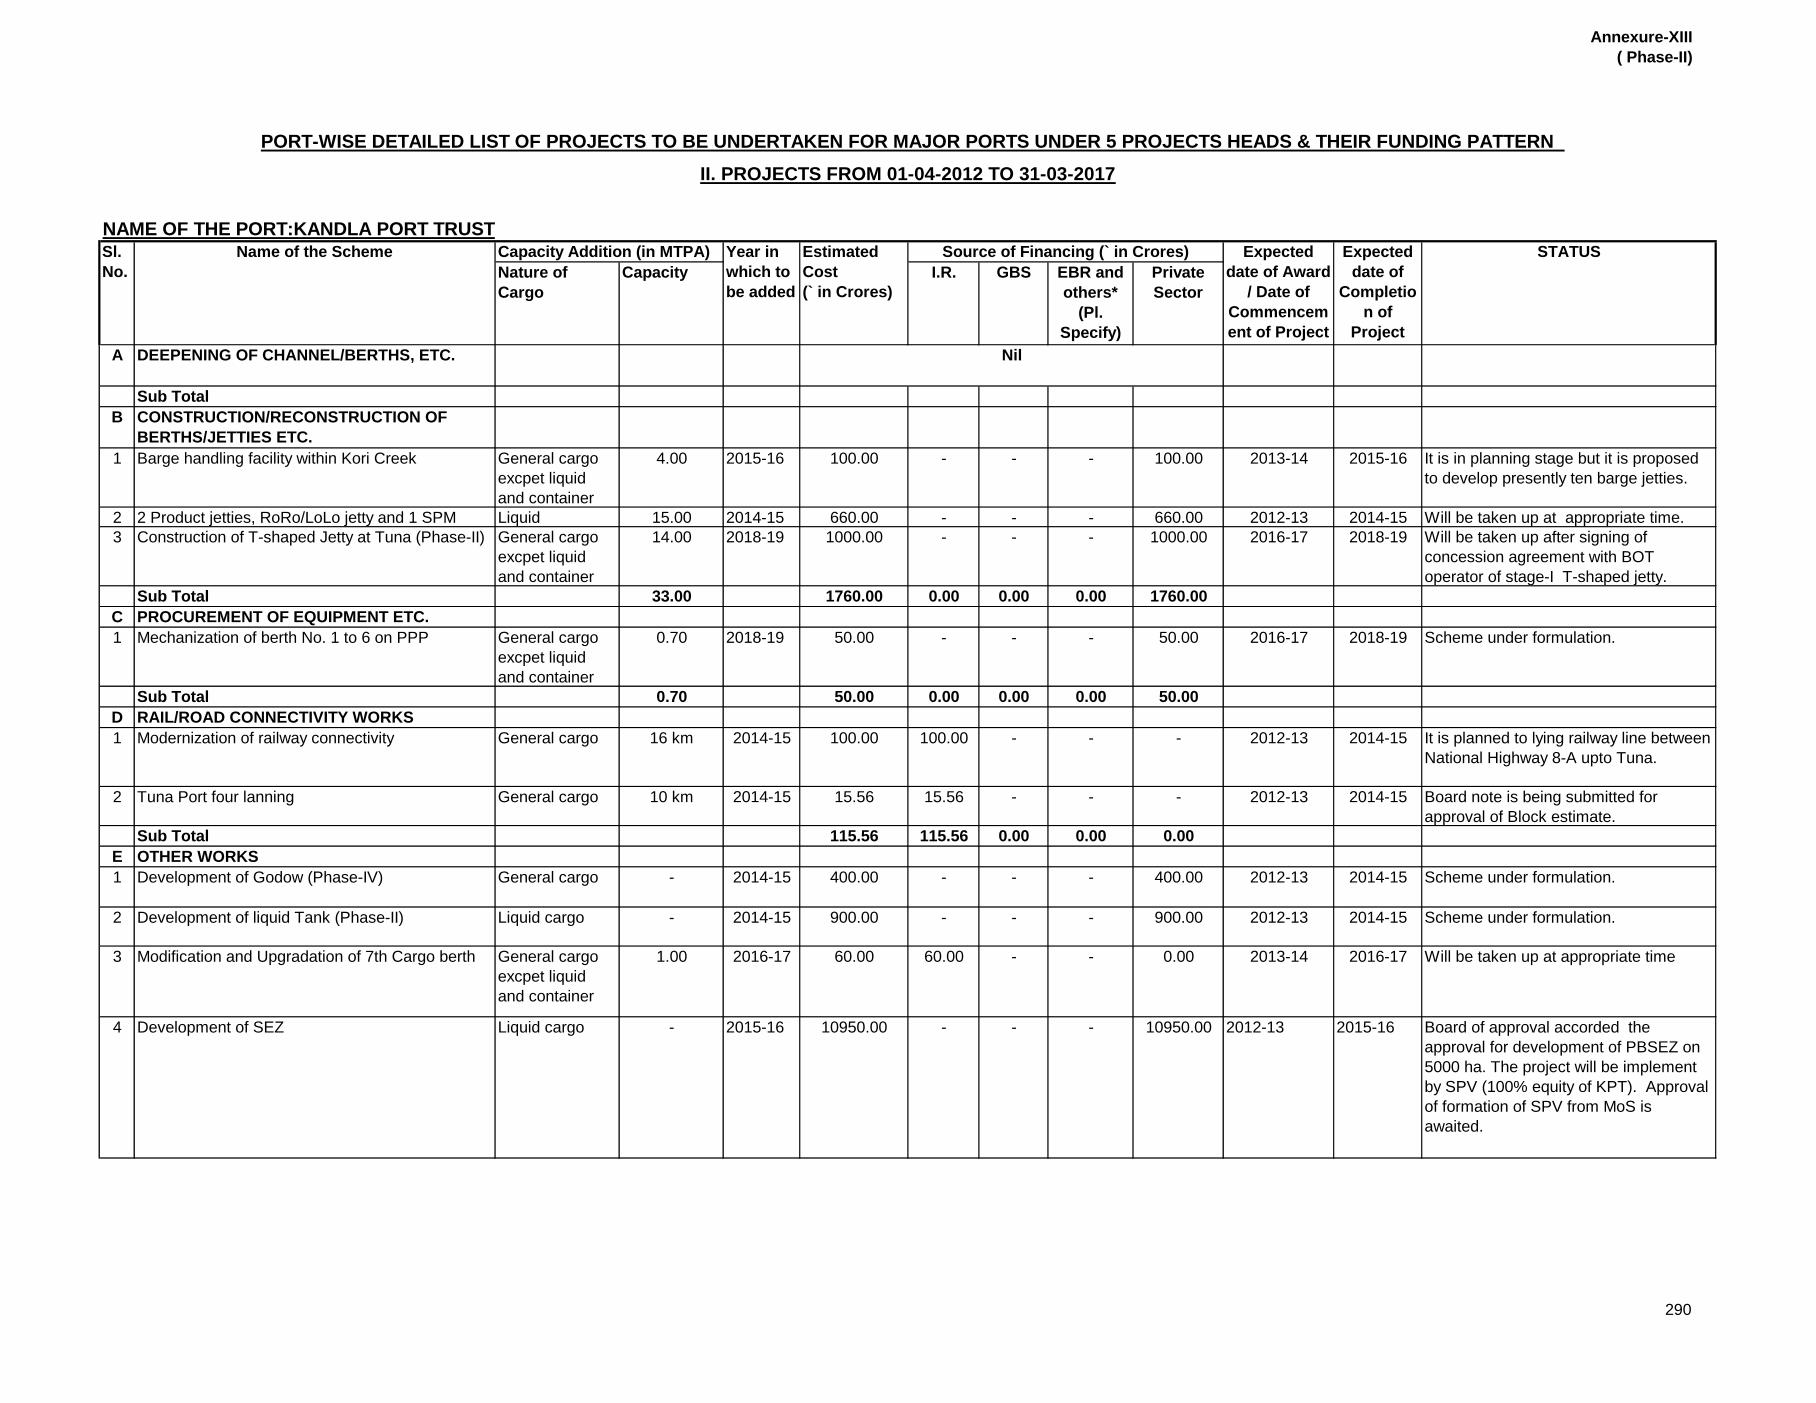
Annexure-XIII
( Phase-II)
NAME OF THE PORT:KANDLA PORT TRUSTCapacity Addition (in MTPA)
Nature of
Cargo
Capacity I.R. GBS EBR and
others*
(Pl.
Specify)
Private
Sector
A DEEPENING OF CHANNEL/BERTHS, ETC.
Sub Total
B CONSTRUCTION/RECONSTRUCTION OF
BERTHS/JETTIES ETC.
1 Barge handling facility within Kori Creek General cargo
excpet liquid
and container
4.00 2015-16 100.00 - - - 100.00 2013-14 2015-16 It is in planning stage but it is proposed
to develop presently ten barge jetties.
2 2 Product jetties, RoRo/LoLo jetty and 1 SPM Liquid 15.00 2014-15 660.00 - - - 660.00 2012-13 2014-15 Will be taken up at appropriate time.
3 Construction of T-shaped Jetty at Tuna (Phase-II) General cargo
excpet liquid
and container
14.00 2018-19 1000.00 - - - 1000.00 2016-17 2018-19 Will be taken up after signing of
concession agreement with BOT
operator of stage-I T-shaped jetty.
Sub Total 33.00 1760.00 0.00 0.00 0.00 1760.00
C PROCUREMENT OF EQUIPMENT ETC.
1 Mechanization of berth No. 1 to 6 on PPP General cargo
excpet liquid
and container
0.70 2018-19 50.00 - - - 50.00 2016-17 2018-19 Scheme under formulation.
Sub Total 0.70 50.00 0.00 0.00 0.00 50.00
D RAIL/ROAD CONNECTIVITY WORKS
Sub Total 115.56 115.56 0.00 0.00 0.00
E OTHER WORKS
4 Development of SEZ Liquid cargo - 2015-16 10950.00 - - - 10950.00 2012-13 2015-16 Board of approval accorded the
approval for development of PBSEZ on
5000 ha. The project will be implement
by SPV (100% equity of KPT). Approval
of formation of SPV from MoS is
awaited.
PORT-WISE DETAILED LIST OF PROJECTS TO BE UNDERTAKEN FOR MAJOR PORTS UNDER 5 PROJECTS HEADS & THEIR FUNDING PATTERN
II. PROJECTS FROM 01-04-2012 TO 31-03-2017
Sl.
No.
Name of the Scheme Year in
which to
be added
Estimated
Cost
(` in Crores)
Expected
date of Award
/ Date of
Commencem
ent of Project
Expected
date of
Completio
n of
Project
STATUSSource of Financing (` in Crores)
It is planned to lying railway line between
National Highway 8-A upto Tuna.
- 2012-13 2014-15
Nil
- - -
-
400.00
Board note is being submitted for
approval of Block estimate.
2014-15
Modification and Upgradation of 7th Cargo berth General cargo
excpet liquid
and container
1.00
- - 2012-13
Liquid cargo
Scheme under formulation.
Scheme under formulation.
Will be taken up at appropriate time
2012-13
-
400.00
2014-15
2 Tuna Port four lanning
1 General cargo Development of Godow (Phase-IV)
1 Modernization of railway connectivity General cargo 16 km
3
100.00 100.00 -
General cargo 15.56 15.5610 km 2014-15 -
2 Development of liquid Tank (Phase-II) - 2012-13900.00- -
- 2014-15
2014-15 900.00
2016-17 60.00 60.00
2014-15
2014-15
0.00 2013-14 2016-17--
290

Annexure-XIII
( Phase-II)
NAME OF THE PORT:KANDLA PORT TRUSTCapacity Addition (in MTPA)
Nature of
Cargo
Capacity I.R. GBS EBR and
others*
(Pl.
Specify)
Private
Sector
PORT-WISE DETAILED LIST OF PROJECTS TO BE UNDERTAKEN FOR MAJOR PORTS UNDER 5 PROJECTS HEADS & THEIR FUNDING PATTERN
II. PROJECTS FROM 01-04-2012 TO 31-03-2017
Sl.
No.
Name of the Scheme Year in
which to
be added
Estimated
Cost
(` in Crores)
Expected
date of Award
/ Date of
Commencem
ent of Project
Expected
date of
Completio
n of
Project
STATUSSource of Financing (` in Crores)
7 Ship Repair facility at Kandla on PPP Model 0.00 2014-15 337.00 0.00 - - 337.00 2012-13 2014-15 Scheme under formulation.
8 Deepening of the sogal channel beyond 13.00
mtrs.draft
- - 2017-18 100.00 100.00 - - - 2013-14 2017-18 The scheme will be taken up after
techno-econo feasiblity report.
Sub Total 3.40 12827.00 210.00 0.00 0.00 12617.00
GRAND TOTAL 37.10 14752.56 325.56 0.00 0.00 14427.00
2015-16 -
IIT, Madras is assigned the work of
check stability of oil jetties for handling
vessels of 13 m / 14 m draft.
General cargo --
5 Strengthening of liquid cargo jetty
6 Godown inside Custom bounded area
2.40Liquid cargo 50.00 50.00 - 2012-13
2018-19 -0.00 -30.00 30.00
- 2015-16
2016-17 2018-19
291

Annexure-XIII
( Phase-III)
NAME OF THE PORT: KANDLA PORT TRUST
Nature of Cargo Capacity Year in
which to
be added
I.R. GBS EBR and
others
Private
Sector
A
Sub Total 0.00 0.00 0.00 0.00 0.00 0.00 0.00
B
1 Construction of 3rd T-Shaped Jetty at
Tuna
General cargo
excpet liquid and
container
14.00 2019-20 1000.00 - - - 1000.00 2018-19 2019-20 Will be taken up at
appropriate time.
2 Creation of berthing facilities for liquid
cargo at Vadinar
Liquid cargo 6.00 2018-19 40.00 - - - 40.00 2017-18 2018-19 The Advisor submitted the
draft Feasibility report which
is under scrutiny.
Sub Total 20.00 1040.00 0.00 0.00 0.00 1040.00
C
1 Replacement of 5 Nos. of Tug - 5 tugs 2019-20 270.00 270.00 - - - 2018-19 2019-20 Will be taken up at
appropriate time.
Sub Total 5 tugs 270.00 270.00 0.00 0.00 0.00
D
Sub Total 0.00 0.00 0.00 0.00 0.00 0.00
E
Sub Total 0.00 0.00 0.00 0.00 0.00 0.00 0.00
GRAND TOTAL 20.00 1310.00 270.00 0.00 0.00 1040.00
PORT-WISE DETAILED LIST OF PROJECTS TO BE UNDERTAKEN FOR MAJOR PORTS UNDER 5 PROJECTS HEADS & THEIR FUNDING PATTERN
III. PROJECTS FROM 01-04-2017 TO 31-03-2020
STATUSExpected
date of
Award/Date
of
Commencem
ent of Project
Expected
date of
Completion
of Project
Sl.
No.
OTHER WORKS
RAIL/ROAD CONNECTIVITY WORKS
Source of Financing (` in Crores)Capacity Addition (in MMTPA)
DEEPENING OF CHANNEL/BERTHS, ETC.
Name of the Scheme
PROCUREMENT OF EQUIPMENT ETC.
CONSTRUCTION/RECONSTRUCTION OF BERTHS/JETTIES ETC.
Estimated
Cost
(` in Crores)
292

Annexure-XIII
( Phase-I)
Nature of
Cargo
Capacity Year in
which to
be
added
I.R. GBS EBR and
others*
(*Pl.
Specify)
Private
sector
A
1 Campbell Bay old jetty 6 to 8
Mtrs
2010-11 - - - - - - Estimate under preparation .
2 Campbell new Break water jetty 1 to 10
Mtrs
2010-11 - - - - - Oct' 2010 work in progress
Sub Total 0.00 0.00 0.00 0.00 0.00 0.00
B
1 Conducting feasibility study for
construction of jetty at Lalaji Bay
(Long Island)
- - 2010-11 0.60 0.00 0.60 - - after
approval the
work will be
commenced
12 months
after
approval
Estimate received and under
scrutiny
2 Construction of small jetty at
Tapong( Nancowrie )
- - 2011-12 3.50 0.00 3.50 - - - - Estimate under preparation .
3 Construction of a jetty at Upper
Katchal and connecting CC footpath
to Upper Katchal
- - 2011-12 3.50 0.00 3.50 - - - - Estimate under preparation .
4 Construction of jetty at Chowra - - 2011-12 4.00 0.00 4.00 - - - - Estimate under preparation .
5 Conducting feasiblity studies for
construction of Transshipment port
at South bay in Great Nicobar Island
- - 2010-11 4.97 0.00 4.97 - - 14th
Feb'2008
Sept'2010 Work in progress
6 Special repairs to Phoenix Bay jetty
at Port Blair
- - 2010-11 1.19 0.00 1.19 - - after
approval the
work will be
commenced
within 8
months after
approval.
Estimate received & under
scrutiny
7 Construction of passenger Shelter
roofing in front of entrance gate
No.1& III at Haddo Port Complex
- - 2010-11 0.87 0.00 0.87 - - after
approval the
work will be
commenced
- Estimate received & under
scrutiny.
8 Area development and beautification
of Neil Island Port
- - 2010-11 1.54 0.00 1.54 - - after
approval the
work will be
commenced
18th months
from the date
of sanction
Estimate received & under
scrutiny
STATUS
DEEPENING OF CHANNEL/BERTHS , ETC.
CONSTRUCTION /RECONSTRUCTION OF BERTHS/JETTIES, ETC.
Estimated
cost (` in
Crores)
Source of financing (` in Crores)
PORT-WISE DETAILED LIST OF PROJECTS T0 BE UNDERTAKEN FOR MAJOR PORTS UNDER 5 PROJECT HEADS & THEIR FUNDING PATTERN
I. PROJECTS FROM 1-7-2010 TO 31-03-2012
NAME OF THE PORT:- PORT BLAIR PORT TRUST
Sl.
No.
Name of the Project. Capacity Addition (in MTPA) Expected
Date of
Award/ Date
of
Commence
ment of
Project
Expected
Date of
Completion
of the
Project
293

Annexure-XIII
( Phase-I)
Nature of
Cargo
Capacity Year in
which to
be
added
I.R. GBS EBR and
others*
(*Pl.
Specify)
Private
sector
STATUSEstimated
cost (` in
Crores)
Source of financing (` in Crores)
PORT-WISE DETAILED LIST OF PROJECTS T0 BE UNDERTAKEN FOR MAJOR PORTS UNDER 5 PROJECT HEADS & THEIR FUNDING PATTERN
I. PROJECTS FROM 1-7-2010 TO 31-03-2012
NAME OF THE PORT:- PORT BLAIR PORT TRUST
Sl.
No.
Name of the Project. Capacity Addition (in MTPA) Expected
Date of
Award/ Date
of
Commence
ment of
Project
Expected
Date of
Completion
of the
Project
9 Techno Economic feasibility study
for establishement of Dry Dock
facilities at Port Blair
- - 2010-11 4.30 0.00 4.30 - - Aug'2010 36 weeks
from the date
of award of
work
Tender received and under
scrutiny.
Sub Total 0.00 24.47 0.00 24.47 0.00 0.00
C
1 Replacement of 1 No old 8 Ton
capcity Forklift and procurment of 1
No. additional 8 Ton Forklift for
Chatham Wharf.
- - 2010-11 0.73 0.00 0.73 - - after
approval the
work will be
commenced
within 8
months after
approval.
Estimate received & under
scrutiny.
2 Replacment of 6 Nos old 3 Ton
capcity forklif at Haddo Wharf.
- - 2010-11 0.62 0.00 0.62 - - after
approval the
work will be
commenced
within 6
months after
approval.
Estimate received & under
scrutiny.
3 Replacement of 2 Nos old 5 Ton
capcity Forklift at Haddo
- - 2010-11 0.43 0.00 0.43 - - after
approval the
work will be
commenced
within 6
months after
approval.
Estimate received & under
scrutiny
4 Replacement of the 6 Ton ELL
Wharf Crane stationed at Hut Bay
- - 2010-11 0.50 0.00 0.50 - - Estimate under preparation .
5 Providing of emergency battery bank
to Port Control Tower with trickle
charger at Chatham and Hut bay
- - 2011-12 0.05 0.00 0.05 - - 10-Nov March'11 Tender under preparation.
6 Supply , Installation and
commissioning of local navigation
Light Equipments at Rangat -
4Nos,,Mayabunder-1 ,Long Island
passage -13
- - 2011-12 0.60 0.00 0.60 - - work in progress.
7 Procurement and installation of
one No. XBIS for Port security at
Ports of A&N Islands
- - 2010-11 0.20 0.00 0.20 - - Nov'2010 Mar'2011 Tender under preparation.
PROCUREMENT OF EQUIPMENTS ETC.
294

Annexure-XIII
( Phase-I)
Nature of
Cargo
Capacity Year in
which to
be
added
I.R. GBS EBR and
others*
(*Pl.
Specify)
Private
sector
STATUSEstimated
cost (` in
Crores)
Source of financing (` in Crores)
PORT-WISE DETAILED LIST OF PROJECTS T0 BE UNDERTAKEN FOR MAJOR PORTS UNDER 5 PROJECT HEADS & THEIR FUNDING PATTERN
I. PROJECTS FROM 1-7-2010 TO 31-03-2012
NAME OF THE PORT:- PORT BLAIR PORT TRUST
Sl.
No.
Name of the Project. Capacity Addition (in MTPA) Expected
Date of
Award/ Date
of
Commence
ment of
Project
Expected
Date of
Completion
of the
Project
8 Procurement of Hazardous
materials identification system for
the use in the New Passenger
Terminal at Haddo Wharf
- - 2010-11 0.20 0.00 0.20 - - Nov-11 Mar'2012 Tender under preparation.
9 Installation of CCTV and Smart Card
Access systems at Port of A&N
Islands
- - 2010-11 0.98 0.00 0.98 - - letter of
acceptance
issued on
July'10
Sept'2010 Stores expected to be made
available at site around 15th
August for inspection and
subsequent in stallation
10 Supply and Installation of 4 Nos
navigation Lantern at Long Island
Range and Navigation Lantern for
Shore Beacon at coxen point at
Rangat
- - 2010-11 0.60 0.00 0.60 - - Nov'11 Mar-12 Tender under prepration.
11 Special repairs to 6Ton ELL Wharf
crane at Haddo Wharf
- - 2012-13 0.28 0.00 0.28 - - after
approval the
work will be
commenced
within 6
months after
approval.
Estimate received & under
scrutiny.
12 Special repairs to 25 Ton Capacity
Forklift at Haddo Wharf
- - 2010-11 0.19 0.00 0.19 - - after
approval the
work will be
commenced
within 9
months after
approval.
Estimate received & under
scrutiny
13 Special repairs to 3 Ton forklift at
Rangat
- - 2010-11 0.10 0.00 0.10 - - - - Estimate under preparation.
14 Acquisition of 500 Ton capacity self
propelled water barges
- - 2011-12 1.50 0.00 1.50 - - after
approval the
work will
commence
6 months
after
awarding of
work
Tender under preparation.
15 Aquisiton of inspection Launch - - 2011-12 2.50 0.00 2.50 - - after
approval the
work will
commence
6 months
after
awarding of
work
Tender under preparation.
Sub Total 0.00 9.48 0.00 9.48 0.00 0.00
D
Sub Total 0.00 0.00 0.00 0.00 0.00 0.00
E
RAIL/ROAD CONNECTIVITY WORKS
OTHER WORKS
295
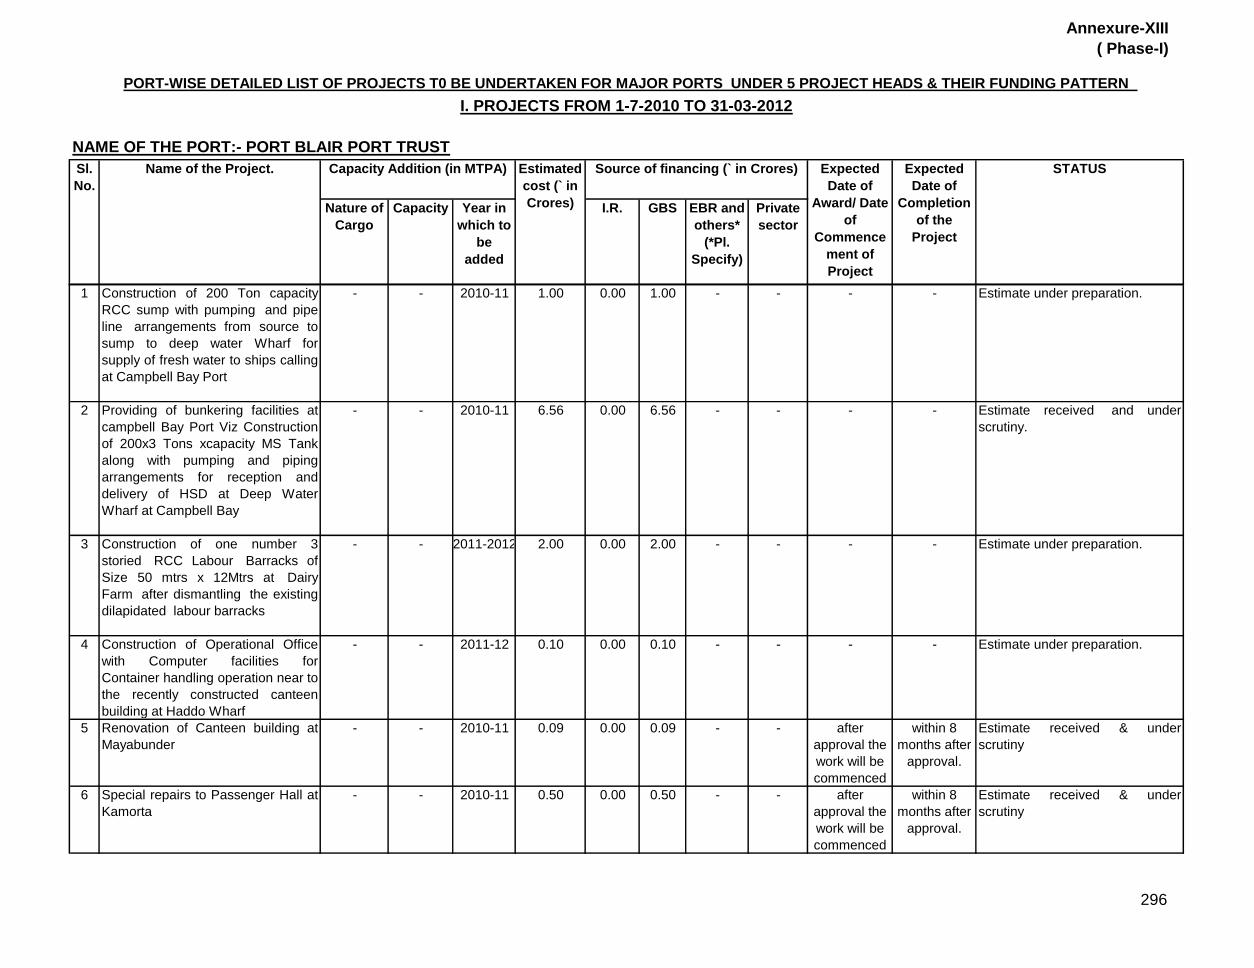
Annexure-XIII
( Phase-I)
Nature of
Cargo
Capacity Year in
which to
be
added
I.R. GBS EBR and
others*
(*Pl.
Specify)
Private
sector
STATUSEstimated
cost (` in
Crores)
Source of financing (` in Crores)
PORT-WISE DETAILED LIST OF PROJECTS T0 BE UNDERTAKEN FOR MAJOR PORTS UNDER 5 PROJECT HEADS & THEIR FUNDING PATTERN
I. PROJECTS FROM 1-7-2010 TO 31-03-2012
NAME OF THE PORT:- PORT BLAIR PORT TRUST
Sl.
No.
Name of the Project. Capacity Addition (in MTPA) Expected
Date of
Award/ Date
of
Commence
ment of
Project
Expected
Date of
Completion
of the
Project
1 Construction of 200 Ton capacity
RCC sump with pumping and pipe
line arrangements from source to
sump to deep water Wharf for
supply of fresh water to ships calling
at Campbell Bay Port
- - 2010-11 1.00 0.00 1.00 - - - - Estimate under preparation.
2 Providing of bunkering facilities at
campbell Bay Port Viz Construction
of 200x3 Tons xcapacity MS Tank
along with pumping and piping
arrangements for reception and
delivery of HSD at Deep Water
Wharf at Campbell Bay
- - 2010-11 6.56 0.00 6.56 - - - - Estimate received and under
scrutiny.
3 Construction of one number 3
storied RCC Labour Barracks of
Size 50 mtrs x 12Mtrs at Dairy
Farm after dismantling the existing
dilapidated labour barracks
- - 2011-2012 2.00 0.00 2.00 - - - - Estimate under preparation.
4 Construction of Operational Office
with Computer facilities for
Container handling operation near to
the recently constructed canteen
building at Haddo Wharf
- - 2011-12 0.10 0.00 0.10 - - - - Estimate under preparation.
5 Renovation of Canteen building at
Mayabunder
- - 2010-11 0.09 0.00 0.09 - - after
approval the
work will be
commenced
within 8
months after
approval.
Estimate received & under
scrutiny
6 Special repairs to Passenger Hall at
Kamorta
- - 2010-11 0.50 0.00 0.50 - - after
approval the
work will be
commenced
within 8
months after
approval.
Estimate received & under
scrutiny
296

Annexure-XIII
( Phase-I)
Nature of
Cargo
Capacity Year in
which to
be
added
I.R. GBS EBR and
others*
(*Pl.
Specify)
Private
sector
STATUSEstimated
cost (` in
Crores)
Source of financing (` in Crores)
PORT-WISE DETAILED LIST OF PROJECTS T0 BE UNDERTAKEN FOR MAJOR PORTS UNDER 5 PROJECT HEADS & THEIR FUNDING PATTERN
I. PROJECTS FROM 1-7-2010 TO 31-03-2012
NAME OF THE PORT:- PORT BLAIR PORT TRUST
Sl.
No.
Name of the Project. Capacity Addition (in MTPA) Expected
Date of
Award/ Date
of
Commence
ment of
Project
Expected
Date of
Completion
of the
Project
7 Construction of VHF station at
Baratang (Nilambur and Kadamta )
and Neil Island
- - 2010-11 0.88 0.00 0.88 - - after
approval the
work will be
commenced
within 12
months after
approval.
Estimate received for baratang &
under scrutiny
Sub Total 0.00 11.13 0.00 11.13 0.00 0.00
GRAND TOTAL 0.00 45.08 0.00 45.08 0.00 0.00
297
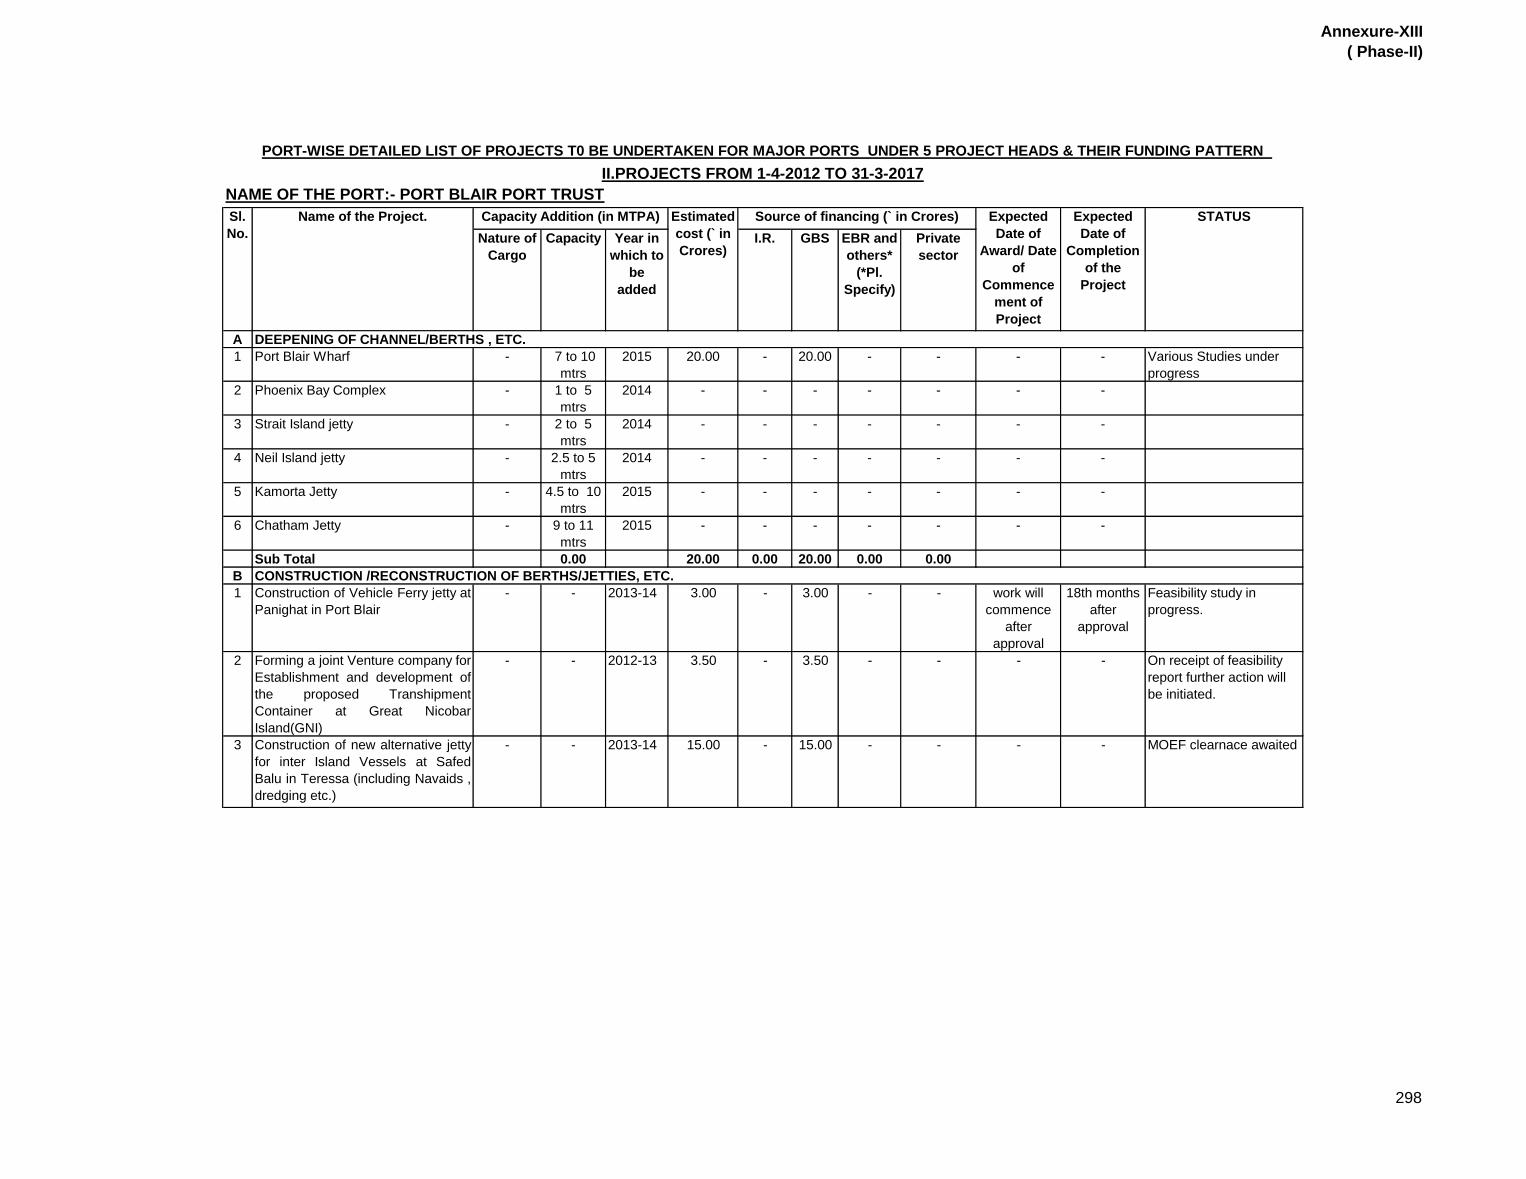
Annexure-XIII
( Phase-II)
Nature of
Cargo
Capacity Year in
which to
be
added
I.R. GBS EBR and
others*
(*Pl.
Specify)
Private
sector
A
1 Port Blair Wharf - 7 to 10
mtrs
2015 20.00 - 20.00 - - - - Various Studies under
progress
2 Phoenix Bay Complex - 1 to 5
mtrs
2014 - - - - - - -
3 Strait Island jetty - 2 to 5
mtrs
2014 - - - - - - -
4 Neil Island jetty - 2.5 to 5
mtrs
2014 - - - - - - -
5 Kamorta Jetty - 4.5 to 10
mtrs
2015 - - - - - - -
6 Chatham Jetty - 9 to 11
mtrs
2015 - - - - - - -
Sub Total 0.00 20.00 0.00 20.00 0.00 0.00
B
1 Construction of Vehicle Ferry jetty at
Panighat in Port Blair
- - 2013-14 3.00 - 3.00 - - work will
commence
after
approval
18th months
after
approval
Feasibility study in
progress.
2 Forming a joint Venture company for
Establishment and development of
the proposed Transhipment
Container at Great Nicobar
Island(GNI)
- - 2012-13 3.50 - 3.50 - - - - On receipt of feasibility
report further action will
be initiated.
3 Construction of new alternative jetty
for inter Island Vessels at Safed
Balu in Teressa (including Navaids ,
dredging etc.)
- - 2013-14 15.00 - 15.00 - - - - MOEF clearnace awaited
Expected
Date of
Completion
of the
Project
NAME OF THE PORT:- PORT BLAIR PORT TRUST
CONSTRUCTION /RECONSTRUCTION OF BERTHS/JETTIES, ETC.
DEEPENING OF CHANNEL/BERTHS , ETC.
STATUS
PORT-WISE DETAILED LIST OF PROJECTS T0 BE UNDERTAKEN FOR MAJOR PORTS UNDER 5 PROJECT HEADS & THEIR FUNDING PATTERN
II.PROJECTS FROM 1-4-2012 TO 31-3-2017
Sl.
No.
Name of the Project. Capacity Addition (in MTPA) Estimated
cost (` in
Crores)
Source of financing (` in Crores) Expected
Date of
Award/ Date
of
Commence
ment of
Project
298
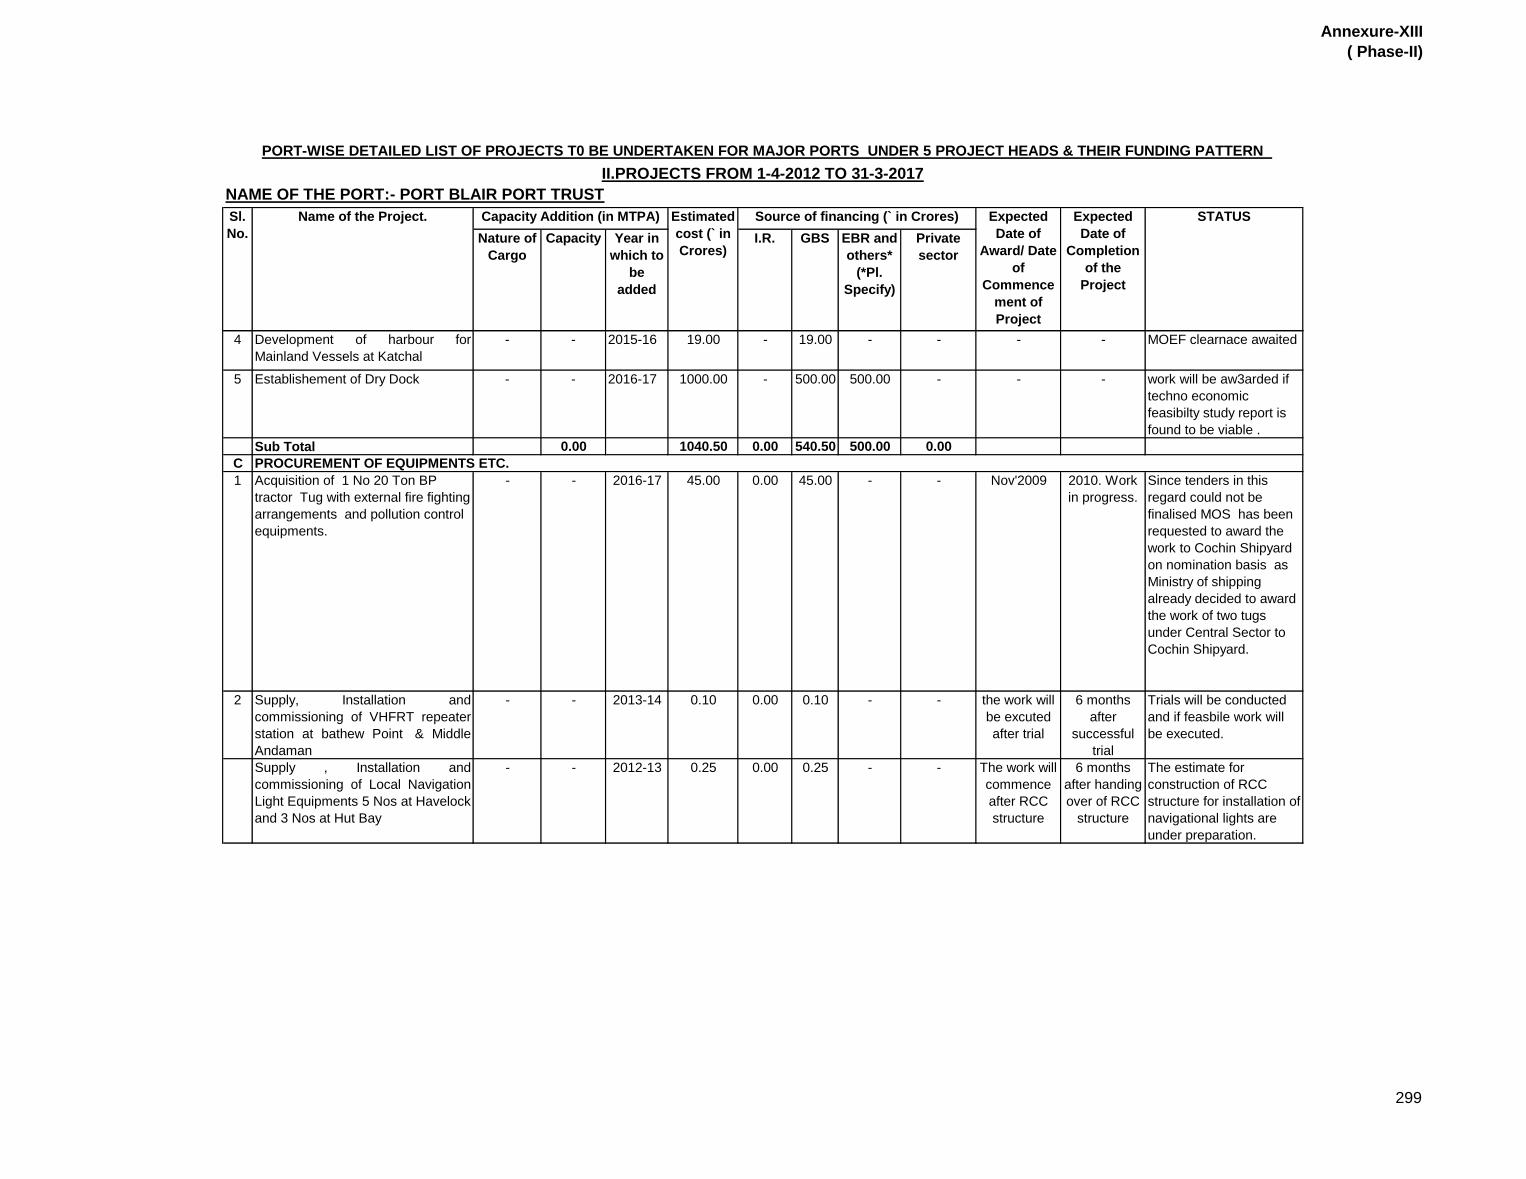
Annexure-XIII
( Phase-II)
Nature of
Cargo
Capacity Year in
which to
be
added
I.R. GBS EBR and
others*
(*Pl.
Specify)
Private
sector
Expected
Date of
Completion
of the
Project
NAME OF THE PORT:- PORT BLAIR PORT TRUST
STATUS
PORT-WISE DETAILED LIST OF PROJECTS T0 BE UNDERTAKEN FOR MAJOR PORTS UNDER 5 PROJECT HEADS & THEIR FUNDING PATTERN
II.PROJECTS FROM 1-4-2012 TO 31-3-2017
Sl.
No.
Name of the Project. Capacity Addition (in MTPA) Estimated
cost (` in
Crores)
Source of financing (` in Crores) Expected
Date of
Award/ Date
of
Commence
ment of
Project
4 Development of harbour for
Mainland Vessels at Katchal
- - 2015-16 19.00 - 19.00 - - - - MOEF clearnace awaited
5 Establishement of Dry Dock - - 2016-17 1000.00 - 500.00 500.00 - - - work will be aw3arded if
techno economic
feasibilty study report is
found to be viable .
Sub Total 0.00 1040.50 0.00 540.50 500.00 0.00
C
1 Acquisition of 1 No 20 Ton BP
tractor Tug with external fire fighting
arrangements and pollution control
equipments.
- - 2016-17 45.00 0.00 45.00 - - Nov'2009 2010. Work
in progress.
Since tenders in this
regard could not be
finalised MOS has been
requested to award the
work to Cochin Shipyard
on nomination basis as
Ministry of shipping
already decided to award
the work of two tugs
under Central Sector to
Cochin Shipyard.
2 Supply, Installation and
commissioning of VHFRT repeater
station at bathew Point & Middle
Andaman
- - 2013-14 0.10 0.00 0.10 - - the work will
be excuted
after trial
6 months
after
successful
trial
Trials will be conducted
and if feasbile work will
be executed.
Supply , Installation and
commissioning of Local Navigation
Light Equipments 5 Nos at Havelock
and 3 Nos at Hut Bay
- - 2012-13 0.25 0.00 0.25 - - The work will
commence
after RCC
structure
6 months
after handing
over of RCC
structure
The estimate for
construction of RCC
structure for installation of
navigational lights are
under preparation.
PROCUREMENT OF EQUIPMENTS ETC.
299
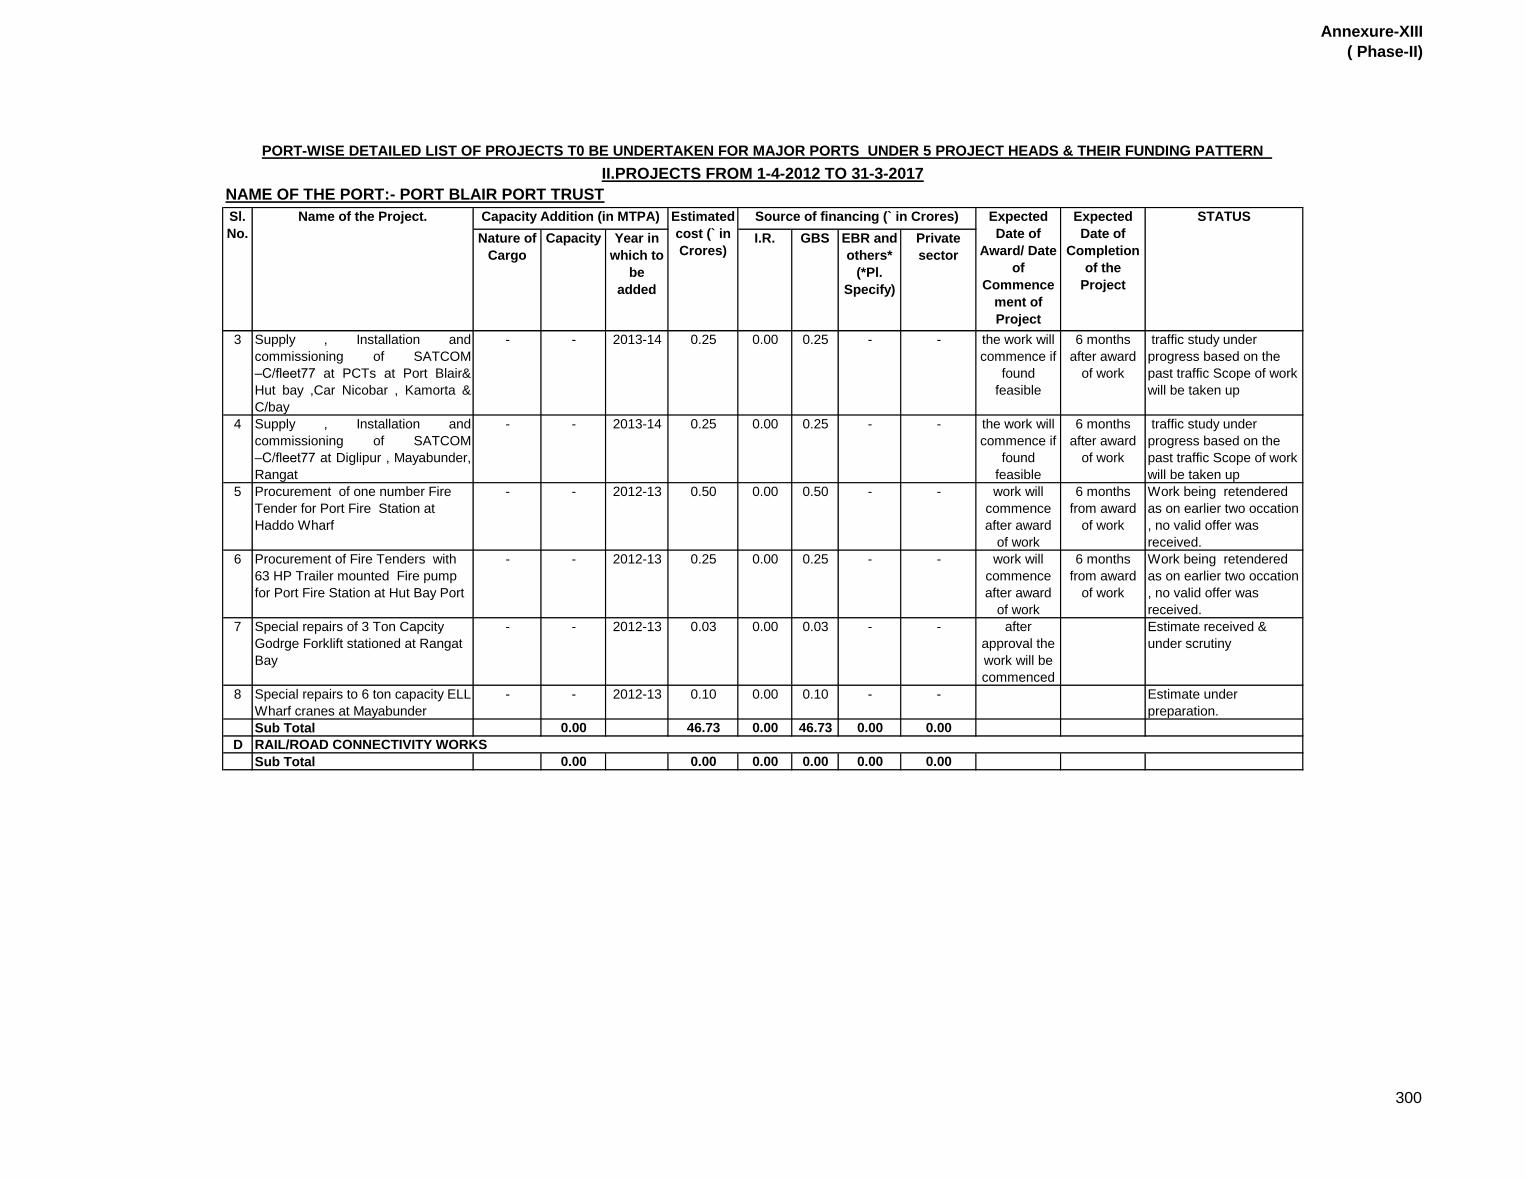
Annexure-XIII
( Phase-II)
Nature of
Cargo
Capacity Year in
which to
be
added
I.R. GBS EBR and
others*
(*Pl.
Specify)
Private
sector
Expected
Date of
Completion
of the
Project
NAME OF THE PORT:- PORT BLAIR PORT TRUST
STATUS
PORT-WISE DETAILED LIST OF PROJECTS T0 BE UNDERTAKEN FOR MAJOR PORTS UNDER 5 PROJECT HEADS & THEIR FUNDING PATTERN
II.PROJECTS FROM 1-4-2012 TO 31-3-2017
Sl.
No.
Name of the Project. Capacity Addition (in MTPA) Estimated
cost (` in
Crores)
Source of financing (` in Crores) Expected
Date of
Award/ Date
of
Commence
ment of
Project
3 Supply , Installation and
commissioning of SATCOM
–C/fleet77 at PCTs at Port Blair&
Hut bay ,Car Nicobar , Kamorta &
C/bay
- - 2013-14 0.25 0.00 0.25 - - the work will
commence if
found
feasible
6 months
after award
of work
traffic study under
progress based on the
past traffic Scope of work
will be taken up
4 Supply , Installation and
commissioning of SATCOM
–C/fleet77 at Diglipur , Mayabunder,
Rangat
- - 2013-14 0.25 0.00 0.25 - - the work will
commence if
found
feasible
6 months
after award
of work
traffic study under
progress based on the
past traffic Scope of work
will be taken up
5 Procurement of one number Fire
Tender for Port Fire Station at
Haddo Wharf
- - 2012-13 0.50 0.00 0.50 - - work will
commence
after award
of work
6 months
from award
of work
Work being retendered
as on earlier two occation
, no valid offer was
received.
6 Procurement of Fire Tenders with
63 HP Trailer mounted Fire pump
for Port Fire Station at Hut Bay Port
- - 2012-13 0.25 0.00 0.25 - - work will
commence
after award
of work
6 months
from award
of work
Work being retendered
as on earlier two occation
, no valid offer was
received.
7 Special repairs of 3 Ton Capcity
Godrge Forklift stationed at Rangat
Bay
- - 2012-13 0.03 0.00 0.03 - - after
approval the
work will be
commenced
Estimate received &
under scrutiny
8 Special repairs to 6 ton capacity ELL
Wharf cranes at Mayabunder
- - 2012-13 0.10 0.00 0.10 - - Estimate under
preparation.
Sub Total 0.00 46.73 0.00 46.73 0.00 0.00
D
Sub Total 0.00 0.00 0.00 0.00 0.00 0.00
RAIL/ROAD CONNECTIVITY WORKS
300
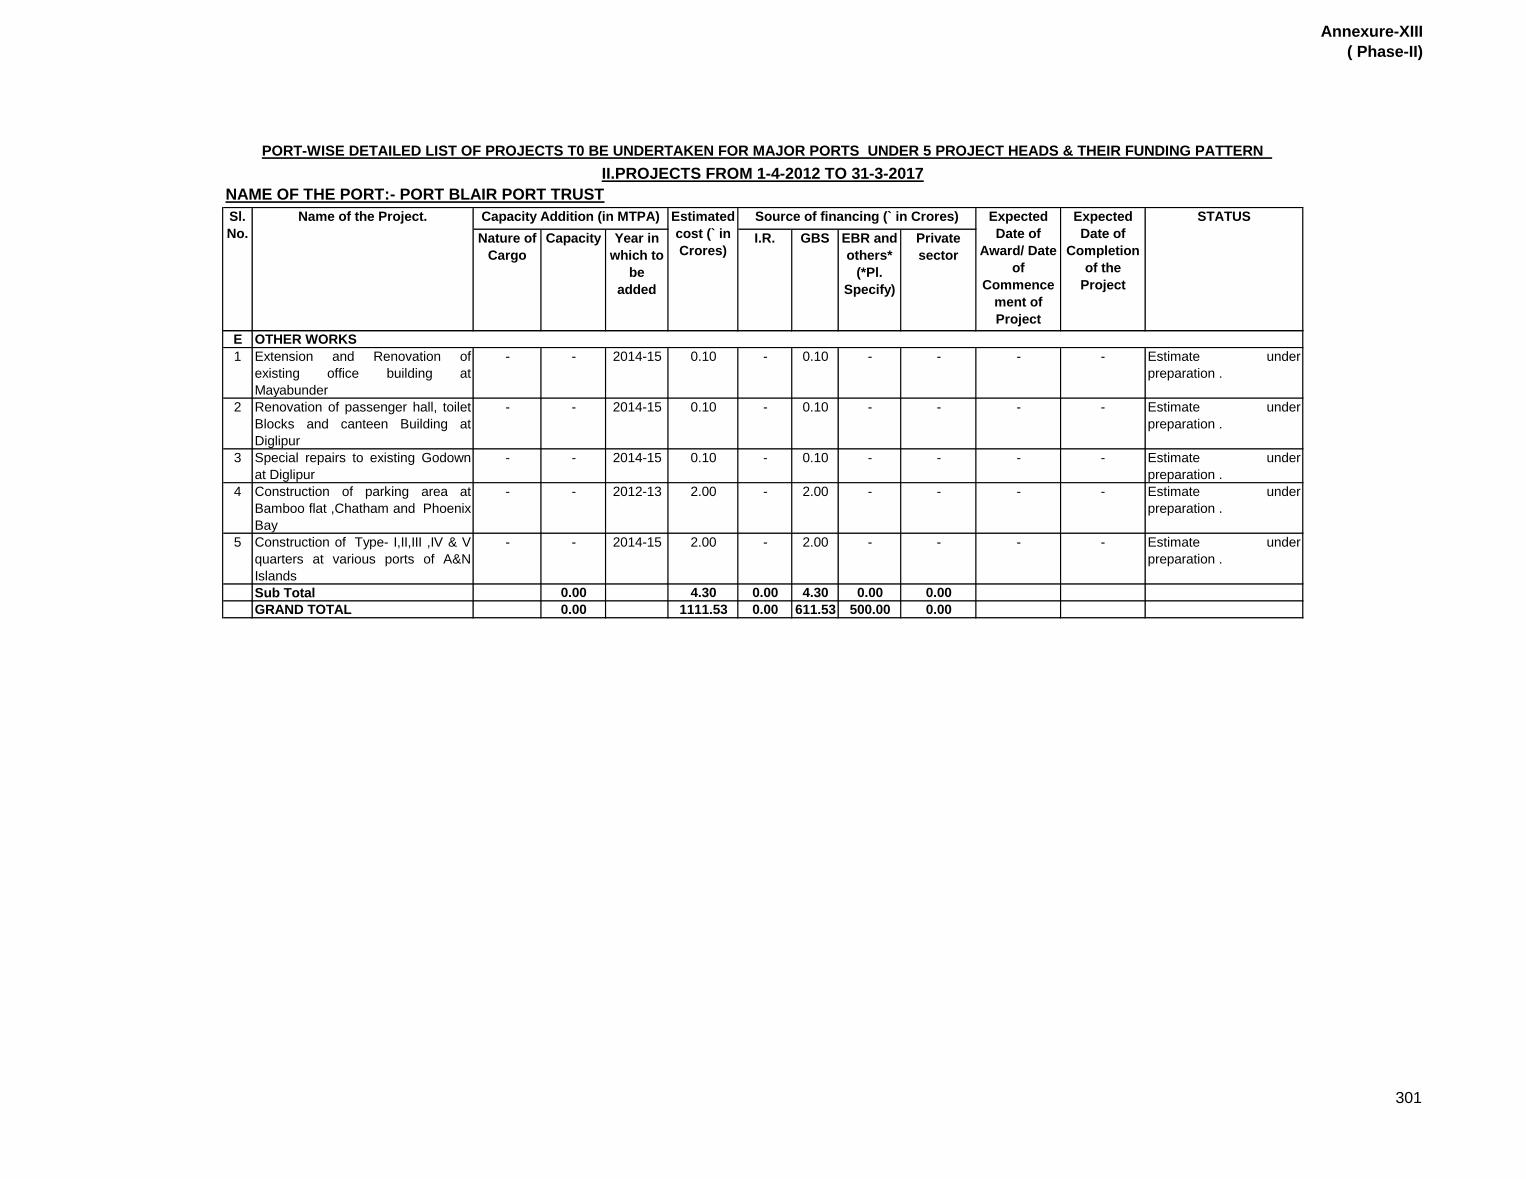
Annexure-XIII
( Phase-II)
Nature of
Cargo
Capacity Year in
which to
be
added
I.R. GBS EBR and
others*
(*Pl.
Specify)
Private
sector
Expected
Date of
Completion
of the
Project
NAME OF THE PORT:- PORT BLAIR PORT TRUST
STATUS
PORT-WISE DETAILED LIST OF PROJECTS T0 BE UNDERTAKEN FOR MAJOR PORTS UNDER 5 PROJECT HEADS & THEIR FUNDING PATTERN
II.PROJECTS FROM 1-4-2012 TO 31-3-2017
Sl.
No.
Name of the Project. Capacity Addition (in MTPA) Estimated
cost (` in
Crores)
Source of financing (` in Crores) Expected
Date of
Award/ Date
of
Commence
ment of
Project
E
1 Extension and Renovation of
existing office building at
Mayabunder
- - 2014-15 0.10 - 0.10 - - - - Estimate under
preparation .
2 Renovation of passenger hall, toilet
Blocks and canteen Building at
Diglipur
- - 2014-15 0.10 - 0.10 - - - - Estimate under
preparation .
3 Special repairs to existing Godown
at Diglipur
- - 2014-15 0.10 - 0.10 - - - - Estimate under
preparation .
4 Construction of parking area at
Bamboo flat ,Chatham and Phoenix
Bay
- - 2012-13 2.00 - 2.00 - - - - Estimate under
preparation .
5 Construction of Type- I,II,III ,IV & V
quarters at various ports of A&N
Islands
- - 2014-15 2.00 - 2.00 - - - - Estimate under
preparation .
Sub Total 0.00 4.30 0.00 4.30 0.00 0.00
GRAND TOTAL 0.00 1111.53 0.00 611.53 500.00 0.00
OTHER WORKS
301
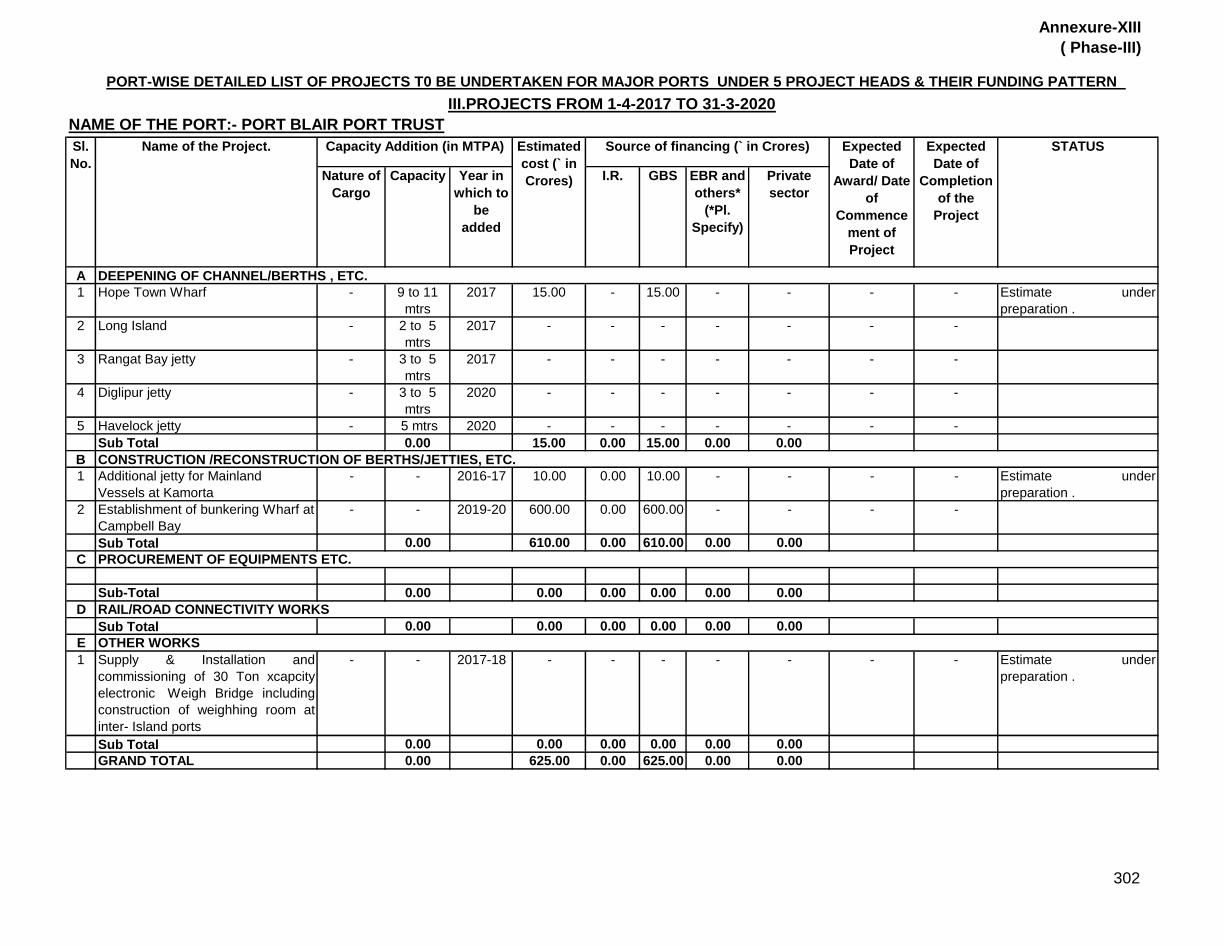
Annexure-XIII
( Phase-III)
Nature of
Cargo
Capacity Year in
which to
be
added
I.R. GBS EBR and
others*
(*Pl.
Specify)
Private
sector
A
1 Hope Town Wharf - 9 to 11
mtrs
2017 15.00 - 15.00 - - - - Estimate under
preparation .
2 Long Island - 2 to 5
mtrs
2017 - - - - - - -
3 Rangat Bay jetty - 3 to 5
mtrs
2017 - - - - - - -
4 Diglipur jetty - 3 to 5
mtrs
2020 - - - - - - -
5 Havelock jetty - 5 mtrs 2020 - - - - - - -
Sub Total 0.00 15.00 0.00 15.00 0.00 0.00
B
1 Additional jetty for Mainland
Vessels at Kamorta
- - 2016-17 10.00 0.00 10.00 - - - - Estimate under
preparation .
2 Establishment of bunkering Wharf at
Campbell Bay
- - 2019-20 600.00 0.00 600.00 - - - -
Sub Total 0.00 610.00 0.00 610.00 0.00 0.00
C
Sub-Total 0.00 0.00 0.00 0.00 0.00 0.00
D
Sub Total 0.00 0.00 0.00 0.00 0.00 0.00
E
1 Supply & Installation and
commissioning of 30 Ton xcapcity
electronic Weigh Bridge including
construction of weighhing room at
inter- Island ports
- - 2017-18 - - - - - - - Estimate under
preparation .
Sub Total 0.00 0.00 0.00 0.00 0.00 0.00
GRAND TOTAL 0.00 625.00 0.00 625.00 0.00 0.00
Source of financing (` in Crores)
OTHER WORKS
DEEPENING OF CHANNEL/BERTHS , ETC.
CONSTRUCTION /RECONSTRUCTION OF BERTHS/JETTIES, ETC.
PROCUREMENT OF EQUIPMENTS ETC.
RAIL/ROAD CONNECTIVITY WORKS
NAME OF THE PORT:- PORT BLAIR PORT TRUST
STATUS
PORT-WISE DETAILED LIST OF PROJECTS T0 BE UNDERTAKEN FOR MAJOR PORTS UNDER 5 PROJECT HEADS & THEIR FUNDING PATTERN
III.PROJECTS FROM 1-4-2017 TO 31-3-2020
Sl.
No.
Name of the Project. Capacity Addition (in MTPA) Expected
Date of
Award/ Date
of
Commence
ment of
Project
Expected
Date of
Completion
of the
Project
Estimated
cost (` in
Crores)
302

PART – III
SHIPPING
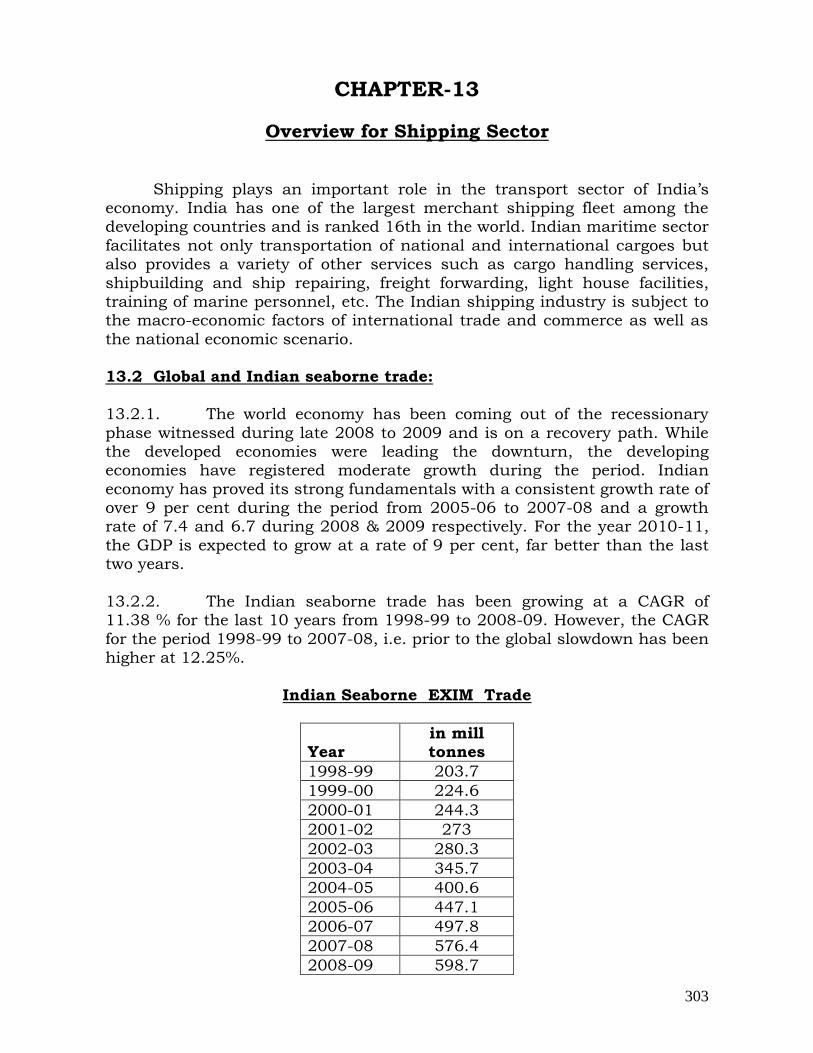
303
CHAPTER-13
Overview for Shipping Sector
Shipping plays an important role in the transport sector of India‟s economy. India has one of the largest merchant shipping fleet among the developing countries and is ranked 16th in the world. Indian maritime sector
facilitates not only transportation of national and international cargoes but also provides a variety of other services such as cargo handling services,
shipbuilding and ship repairing, freight forwarding, light house facilities, training of marine personnel, etc. The Indian shipping industry is subject to the macro-economic factors of international trade and commerce as well as
the national economic scenario. 13.2 Global and Indian seaborne trade:
13.2.1. The world economy has been coming out of the recessionary
phase witnessed during late 2008 to 2009 and is on a recovery path. While the developed economies were leading the downturn, the developing economies have registered moderate growth during the period. Indian
economy has proved its strong fundamentals with a consistent growth rate of over 9 per cent during the period from 2005-06 to 2007-08 and a growth rate of 7.4 and 6.7 during 2008 & 2009 respectively. For the year 2010-11,
the GDP is expected to grow at a rate of 9 per cent, far better than the last two years.
13.2.2. The Indian seaborne trade has been growing at a CAGR of 11.38 % for the last 10 years from 1998-99 to 2008-09. However, the CAGR
for the period 1998-99 to 2007-08, i.e. prior to the global slowdown has been higher at 12.25%.
Indian Seaborne EXIM Trade
Year in mill tonnes
1998-99 203.7
1999-00 224.6
2000-01 244.3
2001-02 273
2002-03 280.3
2003-04 345.7
2004-05 400.6
2005-06 447.1
2006-07 497.8
2007-08 576.4
2008-09 598.7
304
13.2.3. Considering the CAGR of 12.25%, the Indian seaborne trade can
be expected to grow from the last year‟s level of 598.70 million tonnes to the level of 2,134 million tonnes by the year 2020 (in terms of cargoes loaded
and unloaded in India) i.e. about 3.56 times the current trade. 13.2.4. The global seaborne trade during 2008 reached 8.17 billion
tonnes (total cargo loaded). During the past three decades, the annual average growth rate of world seaborne trade is estimated to have been 3.1% per annum. At this rate of growth, UNCTAD expects global seaborne trade to
increase by 44% by 2020 and double by 2031, potentially reaching 11.5 billion tonnes and 16.04 billion tonnes, respectively (Source:Review of Maritime Transport, 2008, UNCTAD (UNCTAD/RMT/2008)). 13.2.5. At the EXIM trade of 598.7 million tonnes, the Indian seaborne
trade constitutes about 3.66% of the global seaborne trade. Based on the above assumptions of Indian seaborne trade growing at 12.25% p.a. and
global seaborne trade growing at 3.1% p.a., by the year 2020 India‟s share in the world trade can reach a significant 9.3% from the current level of 3.66%.
13.3 Indian Shipping:
13.3.1. In terms of fleet size the Indian shipping industry is presently 10 million GT and forms a marginal share of just above 1% of the global fleet. While the Indian seaborne trade has been growing at a rate of 12.25%, the
share of Indian ships in carriage of the country's overseas trade has been declining over the years despite the total volume of cargo moving in India's trade expanding progressively. From about 40% in the late ‟80s, it has fallen
to around 8.4% (2008-09), which essentially indicates the tremendous scope for growth of Indian shipping.
13.3.2. One of the primary reasons for the declining trend in its share has been the inadequate growth of the Indian fleet, which is not
commensurate with the growth of the Indian seaborne trade. The share of Indian ships in the carriage of the country‟s overseas trade has been declining over the years. Considering the fact that the Indian seaborne trade
could increase 3.56 times by 2020, the Indian shipping tonnage needs to be augmented to similar levels in order to arrest further decline in the share of
Indian ships. Accordingly, the Indian shipping should aspire to reach a level of 130 million GT by 2020.
13.3.3. Ideally, the country should have adequate control on the shipping arrangements specifically from the point of view of creating strategic shipping reserves for import of commodities like crude oil and coal.
While increasing owned tonnage under the Indian flag would be the most ideal situation, control over shipping arrangements can also be achieved by way of in-chartering tonnage in the absence of owned tonnage by Indian

305
shipping companies. As a stop gap arrangement, till the time Indian tonnage increases to a significant level, the Indian shipping lines must be encouraged
to cater to larger share of India‟s seaborne trade, 1/3rd of which can be catered to by owned and time chartered tonnage and 2/3rd by controlled
tonnage. Accordingly, by 2020 the Indian shipping companies should at least reach a level of 43 million GT (1/3rd of targeted 130 million GT) which would be about 4.3 times the current level of 10 million GT. However,
creation of conducive environment for the shipping companies would be a prerequisite for the same.
13.3.4. In this backdrop, SCI will aim to achieve 30% of this 43 million GT identified above which is roughly about 13 million GT. Presently, SCI has
identified for the period 2010~2020 acquisition of 110 vessels of about 5.21 million GT at a total cost of Rs. 27,668 crores which will take SCI‟s total tonnage to about 7 million GT by 2020. SCI will aim to be a 13 million GT
company by 2020 including chartered vessels and will identify more vessels for acquisition and chartering to achieve the targeted tonnage.
***
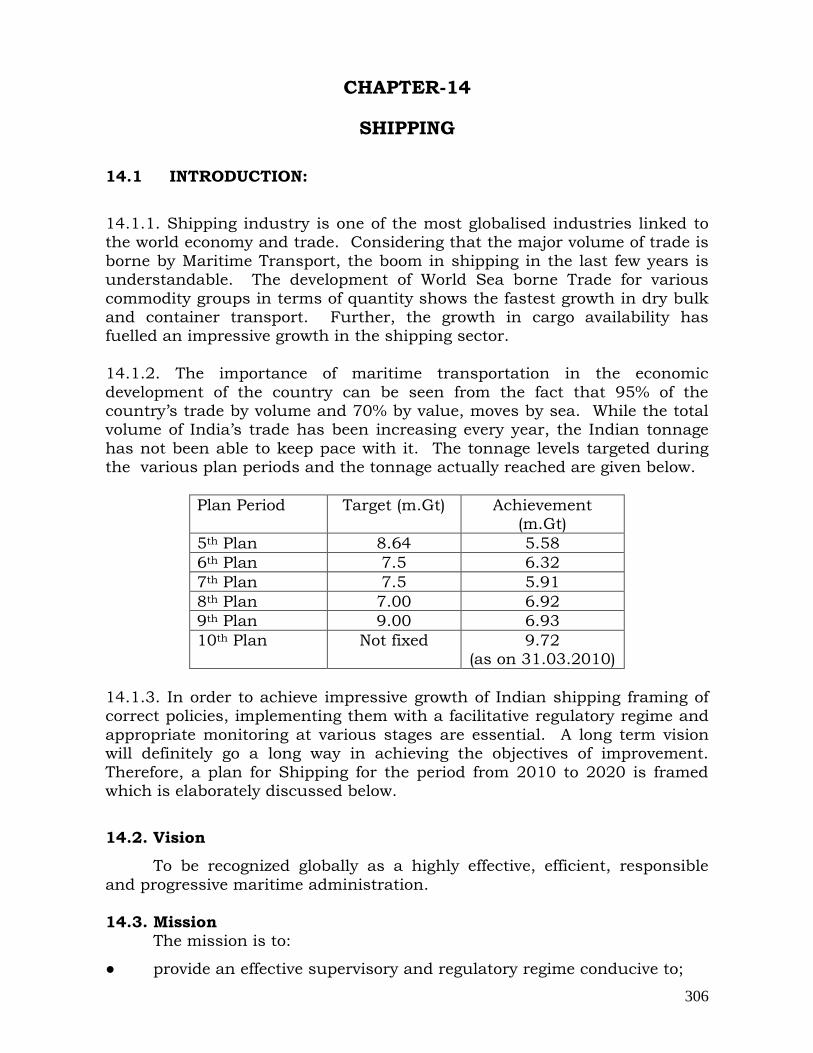
306
CHAPTER-14
SHIPPING
14.1 INTRODUCTION:
14.1.1. Shipping industry is one of the most globalised industries linked to the world economy and trade. Considering that the major volume of trade is
borne by Maritime Transport, the boom in shipping in the last few years is understandable. The development of World Sea borne Trade for various
commodity groups in terms of quantity shows the fastest growth in dry bulk and container transport. Further, the growth in cargo availability has fuelled an impressive growth in the shipping sector.
14.1.2. The importance of maritime transportation in the economic
development of the country can be seen from the fact that 95% of the country‟s trade by volume and 70% by value, moves by sea. While the total volume of India‟s trade has been increasing every year, the Indian tonnage
has not been able to keep pace with it. The tonnage levels targeted during the various plan periods and the tonnage actually reached are given below.
Plan Period Target (m.Gt) Achievement (m.Gt)
5th Plan 8.64 5.58
6th Plan 7.5 6.32
7th Plan 7.5 5.91
8th Plan 7.00 6.92
9th Plan 9.00 6.93
10th Plan Not fixed 9.72 (as on 31.03.2010)
14.1.3. In order to achieve impressive growth of Indian shipping framing of correct policies, implementing them with a facilitative regulatory regime and
appropriate monitoring at various stages are essential. A long term vision will definitely go a long way in achieving the objectives of improvement.
Therefore, a plan for Shipping for the period from 2010 to 2020 is framed which is elaborately discussed below.
14.2. Vision
To be recognized globally as a highly effective, efficient, responsible
and progressive maritime administration.
14.3. Mission The mission is to:
● provide an effective supervisory and regulatory regime conducive to;
307
1.1 achieve safe, efficient and secure shipping; 1.2 protect the marine environment; and
1.3 all round growth of the maritime industry;
● Develop and implement a holistic and integrated maritime development programme that has a positive impact on the national economy;
● Develop and implement policies that facilitate an environment which is conducive for promoting investment in the expansion of a modern merchant fleet under the Indian flag and develop globally competitive ship building and
repair facilities;
● Ensure good governance by adhering to the highest standards of integrity, quality and efficiency in delivery of shipping services through constant innovation, technology up-gradation and value addition;
● Develop measures to ensure compliance of relevant International
instruments relating to safety and security of ships, protection of environment and welfare of seafarers.
14.4. Strategies to achieve the mission
● Mindful, of the vision, challenges and the mission, four key strategic directions has been identified for enhancing effectiveness of maritime
administration, as under: 1.1 Development of regulatory framework;
1.2 Effective compliance of Safety and Environmental regulations; 1.3 Training, certification and database of Indian seafarers;
1.4 Monitoring and review mechanism. ● For each of the above four strategic directions, related activities have
been identified. These activities aim to implement the strategic directions over the coming years and will be updated regularly and tracked as part of
an ongoing integrated planning process; 14.5. Increasing Tonnage in the National Register:
Currently Indian Tonnage stands at 10.11 million GT and ranks 16th
in the world shipping Tonnage. The Indian flagged vessels are carrying presently around 8.4% of Indian export - import cargo. Indian Shipping
companies should aim to reach a level of 43 million GT by 2020 which will include owned and chartered tonnage. Out of this, 30 million GT may be the owned tonnage. For achieving this tonnage an investment of around Rs.
120,000 crores is estimated including private investment. Out of this, SCI has presently identified projects worth Rs.27,668.40 crores which will roughly take SCI owned tonnage to 7 million GT.
308
14.6. PROPOSED PROJECTS
14.6.1. Navigational Safety in Ports Committee (NSPC).
The above Committee was set up by the Ministry to look into
navigational safety aspects of private ports being set up all around the coast of India. In the light of the recent accidents within the jurisdiction of the major ports, it is imperative that the scope of NSPC may be extended to
major as well as minor ports and the duties to include port navigational safety issues, cargo related safety aspects, oversight function of oil pollution response mechanism and reception facilities in the ports etc. It is proposed
to set up an NSPC wing, which will carry out the oversight functions related to oil response, safety and navigational matters in the major and minor
ports. The estimated cost for setting up the NSPC Wing and the recurring cost for the next 5 years would be approximately 10 crores.
14.6.2 Ro-Ro Ferry Services.
In order to develop coastal shipping, it is proposed to setup jetties for the Ro-Ro Ferry service network in Gulf of Kutch, Gulf of Cambay and
western / southern coastal states up to Kerala. The Ro-Ro ferry service would save traveling distance, fossil fuel, and time. It also has the advantage of being the least polluting and environment friendly mode of transport and
it would decongest the road traffic. It is proposed to provide subsidy for construction of Ro-Ro jetties as an infrastructure with additional subsidy for
a project involving construction of a pairs of jetties in order to facilitate movement of cargo between specified ports and also to cater to specific cargoes. The Ro-Ro Ferry service will not only cater to transportation of
vehicles but also carry a substantial quantum of passengers and cargo. The approximate cost for setting up jetties would be 100 crores.
14.6.3 Pollution Response arrangements to deal with Pollution
incidents on the coast of India.
It has been observed that the Oil Pollution Response arrangements set
up in sea ports, oil terminals, offshore structures with the coast guard is inadequate to deal with major oil spill between 700-10,000 ton or above. Being party to OPRC Convention it is the obligation of Government of India
to establish adequacy in Oil Pollution Combating Equipment stockpiles along the coast line including the offshore area. The following is the estimated
expenditure in this regard:- There are 13 major ports and 62 operational non-major ports which
are dealing with EXIM trade. The approximate capital cost of inventory of Tier I level equipment is as follows :-
309
a. Major port inventory 1.5 crores
b. Minor port inventory 1 crores c. Oil Platform inventory 2 crores
d. SBM inventory 50 lacs
The estimated cost for the inventory, additional manpower / resources for undertaking the risk analysis, preparation of Regional mitigation plan, auditing, recurring expenditure, follow up action subsequent to a pollution
incident, settlement of claims, participation in the Fund meeting etc would be approximately 100 crores.
14.6.4 Designation of Emission Control Area (ECA).
In October 2008, International Maritime Organisation (IMO) agreed to amend MARPOL Annex VI adopting new tiers for control of NOx emission and sulphur contents in fuel. The most stringent of these new emission
standards apply to ships operating in designated ECAs, including the newly-designated North American ECA. The proposal is for designation of an
Emission Control Area (ECA) for specific portions of Indian coastal waters, for the control of nitrogen oxides (NOx), sulphur oxides (SOx), and particulate matter (PM) emissions. Adoption of the proposed ECA will result
in significant reduction in ambient levels of air pollution along the coast of India. This will result in achieving substantial benefits to human health and the environment.
The cost of implementing and complying with the ECA are expected to be small in comparison with the cost of achieving similar emissions reduction through additional controls on land-based sources. However, there
will be improvement in air quality, reduction in premature mortality and other benefits resulting from designation of the proposed ECA, which will be
a step forward for control of emissions.
As this proposal requires extensive research and data collection and inter-ministerial co-ordination, especially Ministry of Environment,
organizations like TERI, NEERI etc, a period of at least five years may be considered for preparation of the proposal. The total cost of the project is estimated to be Rs. 100 crores.
14.6.5 Proposal for designation of Particularly Sensitive Sea Areas.
Particularly Sensitive Sea Area (PSSA) is an area that needs special protection through action by International Maritime Organization (IMO), because of its significance for recognized ecological or socio-economic or
scientific reasons and which may be vulnerable to damage by international maritime activities.
It is proposed to carry out study for designation of the Lakshadweep
Island, Andaman and Nicobar Island and any other area which qualifies for

310
PSSA. The exercise will involve other Ministries, such as Ministry of Environment and Forests and organizations like NEERI, TERRI, to carry out
the study and prepare a proposal for IMO. The estimated cost of the project is around Rs. 50 Crores and the time frame for completing the report is
estimated to be 3 years.
14.6.6 Strengthening of Port State Control and Flag State Inspections.
All major IMO conventions mandate Port State Control and Flag State Inspection of vessels to be meticulously carried out by all member States.
India had already implemented this requirement. However, a complete implementation could not be practiced due the varied reasons and at present we are only able to carry out inspection of about 4% foreign ships calling at
Indian Ports under PSC and 40% of Indian ships under FSI. Indian Maritime Administration is recognized world over for its effectiveness in implementing such conventions. In order to have the quality of management
in our regulations and regulatory works, and to prevent sub standard foreign ships operating in our waters, these inspections have to be strengthened in
the years to come. The main constraint in the implementation is the availability of manpower. It is therefore proposed to recruit more surveyors for this propose so as to achieve 10% PSC inspections of foreign ships calling
at our Indian Ports by 2015 as mandated by IOMOU. It is also proposed to carry out 100% FSI inspections of Indian ships by 2020.
In order to enhance the PSC and FSI inspections, it is estimated that
an additional 200 surveyors will be required. The expenditure for this project is estimated to be around 100 crores.
14.6.7 Legislative updation.
With the rapid changes in the International Maritime Regulatory measures and as a result of adoption of various maritime IMO/ILO
Conventions, it becomes imperative to constantly update our national legislation, in order to keep pace with the International regulatory measures. It is envisioned that the period between the adoption of International
convention and National legislation be reduced to 3 years by 2015 and to 1 year by 2020. The following conventions are proposed to be legislated
between 2010 and 2020.
1. Ballast water Convention 2. Anti fowling Convention
3. Recycling Convention 4. HNS Convention
5. London Dumping Convention 6. Wreck Removal Convention 7. Bunker Convention
8. Maritime Labour Convention

311
In addition, the new conventions that are going to be adopted by IMO will also be taken up during the period. In the absence of regular legal
professionals in the directorate, the legal expertise has to be hired, the expenditure for which upto 2020 is expected to be Rupees 12 Corers.
14.6.8 Formation of Marine Casualty Investigation Cell.
Investigation into marine casualties, such as groundings, sinking, or
collision of vessels, or death, grievous injury to seafarers, is an obligation upon each flag state under the Article 94 (7) of UNCLOS. It requires each state to cause an inquiry to be held by a suitably qualified person.
Over the years, radical changes in the size and structure of the
Maritime industry have created the need for a more structured approach to investigating marine casualties and incidents. The complexities of handling investigations are heightened by the variations that exist across nations
between legal systems, difficulties of access to key witnesses across borders, and often the inadequate co-operation between countries, provoking
Government to urge the adoption of guidelines at the international level that give Substantially Interested States – being the state to which the victim or the accused belongs – observer status in investigations into shipboard crime
while recognizing the centrality of flag state jurisdiction. With the total strength of only 25 nautical officers spread over nine
MMDs on the coast of India, also tasked to attend to Life Saving Equipment surveys, Flag state inspections, Port state Control Inspections, Inspections of
Maritime Training Institutions, and the examinations of all candidates for Certificates of Competency for Mates, very few investigation reports could be followed up for drawing systemic lessons from them. In general terms, it
takes up-to nine months to a year to complete an investigation into a serious casualty and write a report.
The proposal for the formation of the Marine Casualty Investigation
Cell has already been approved by the Government with a staffing of nine
personnel. Funds to the tune of Rs.10 crores have been estimated for five years for further development of the cell. Budget provision for Rs. 4.5 crores has already been made in the Plan Budget of DG Shipping for the year 2010-
11. The project is proposed to be commenced during 2010-11 and to be made fully operational by 2015.
14.6.9 Voluntary IMO Member State Audit Scheme (VIMSAS).
India has offered for Voluntary IMO Member State Audit Scheme (VIMSAS) and will be audited from 13th September to 20th September, 2010. International Maritime Organization is working towards making the Audit
Scheme mandatory and commencement of an institutionalized audit scheme is expected to enter in to force by 2014.

312
Once, the Audit Scheme is made mandatory, the Member States may be required to be audited once in five years. The Scheme will enhance the
maritime administration‟s performance and also the port and Coastal State duties and responsibilities within the IMO instruments, which are of equal
importance to those of flag States in ensuring that global maritime transport is safe, efficient and environmentally sound. The expenditure for the preparatory work and the execution of the next round of audit, is estimated
to be Rs 2 crores.
14.6.10 Marine disaster emergency response (Emergency towing vessel).
A disaster prevention plan has been drawn up on the model of other maritime countries. Minimally, this would require the availability of at least
two 100 T bollard pull tugs on each coast; the basic equipment for tow and de-canting of bunker oil from tanks of ships in distress; and a team of salvagers who will be available at short notice. It is proposed to purchase
the heavy duty Emergency towing vessels and the basic equipment and, for the salvage expertise, to invite world renowned salvage companies to set up
their firms in India. The fund requirement for the procurement and operation of the Emergency Towing vessel is estimated to be Rs. 250 crores.
14.6.11 Ballast Water Management.
While transporting cargo, ships transfer around 0.66 billion tones of ballast sea water from one port to another and from one part of the world to
another. Since these ballast water contains various harmful micro organism it not only deteriorate the ocean but also affects the territorial waters of
other countries. The problem of bio invasion has therefore to be addressed at the earliest. The Marine Environment Protection Committee of the IMO has developed guidelines for the Ballast Water Management System.
On the basis of these guidelines, the safety, environmental acceptability, and biological properties of the ballast water are evaluated.
Such evaluation comprises, inter alia, the monitoring / assessment of quality of water in and around port, and also the ready availability of facility of Ballast water treatment verification technology. In the absence of the
verification technology facilities, such systems cannot be approved by the maritime administration.
However, as per the convention, all ships constructed after 2010
onwards have to install ballast water system. This compels India to develop its testing facilities. It is reported that Bilge Water Management Systems are
developed by multi-national companies that have a sales, service and spares network already in place around the world. The testing facilities for the appropriate certification of the technologies that are being developed are
rather practically not available.
In nutshell, the scheme involves two projects outlined below with financial implications:

313
PROJECT 1: Port biological baseline survey and risk assessment of nine major ports.
Subsequent to the conclusion of the Globallast pilot programme in the port of Mumbai, the field work related to “port biological baseline survey” and “risk assessment” at the ports of Goa and Visakhapatnam have been
completed.
In order to continue with the project an additional fund of Rs.15 crores for replicating the exercise at the ports of Kandla, Mangalore, Kochi,
Tuticorin, Chennai, Paradip, Kolkata & Haldia are required. Period of completion of the project is five years. The project is proposed to be completed as below with following budgetary estimations.
Phase Ports Estimate
Phase I Mangalore, Cochin, Chennai and Haldia
Rs. 8 Crores.
Phase II Kandla, Tuticorin, Paradeep and Kolkata
Rs. 7 Crores.
PROJECT 2 : Setting up of the facility of Ballast Water treatment
Technology: verification and certification.
Since there is a pronounced dearth of facility for this technology vis-à-vis the number of ships expected to join the world fleet in the next 7 to 8
years it is prudent of the Government, commercially and strategically to promote setting up of this testing facility, particularly since no such facility is available in South Asia, Middle east and Australia.
The cost of the project, as estimated by National Institute of Oceanography is approx. Rs 50 Crores, which includes a recurring expenditure of Rs. 3.9 Crors. The time estimated for the project to be
operational is 36 months with partial operation from the second year.
In a nut shell the total estimate and time required for the projects are as below:
Project Estimate Time Required
Project 1 Rs. 15 crores 5 Years
Project 2 Rs. 50 crores 3 3 Years
14.6.12 P & I - Club:
India is emerging as a major Maritime nation. In present day scenario the maritime insurance of the ships, wreck removal, maritime causality both
for the ship and seafarers are catered by P & I Clubs of foreign origin. Establishing the P & I Club in India not only brings increase in trade but
also provides foreign exchange earnings when these clubs are used by foreign companies. It is therefore proposed to initiate action for establishing one P & I Club in Indian League by 2015 and one more in the IG League by
2020. The initial expenditure for this is estimated approx. 2 crores.

314
14.6.13 Opening of a second register:
A strategic proposal to bring in a policy regime for opening a second
register was initiated aiming at attracting FDI. While conditions equal to the national are to be provided, the distinction is drawn by offering the national flag cabotage protection and for the second register, relaxation in manning
controls. It was considered that with the second register, the target of doubling of the Indian tonnage by 2020 is economically feasible.
No significant initiative to activate the scheme has taken place on the policy front. Further, the prevailing recessionary conditions have prompted
the Industry to seek further tightening of cabotage regulations. Demand for a liberalized manning regime, however, persists.
14.7. Comparison of financial aspects with periodicity of requirement.
The comparison of budgetary provisions given in the proposal with
periodicity of requirement is tabulated below : (Rs in crores)
No. Details Fund requirement
2010-12 2012-17 2018-20
1 Increasing tonnage in the National Register
30,000 60,000 30,000
2 Navigational Safety in Ports Committee (NSPC) - 10 -
3 Coastal Shipping - 70 30
4 Pollution Response arrangements to deal with Pollution incidents on the coast of India
-
70
30
5 Designation of Emission Control Area (ECA) subject to the ratification of MARPOL Annex VI by India
-
80
20
6 Proposal for designation of Particularly Sensitive Sea Areas
- 50 -
7 Strengthening of Port state control and flag state inspection
20 30 50
8 Legislative updation
02 07 03
9 Upgradation & Strengthening of Marine causality cell
04 06 00
10 Voluntary IMO Member State Audit Scheme (VIMSAS)
01 00 01
11 Emergency Towing Vessels (Marine disaster emergency response)
40 200 10
12 Ballast Water Management.
10 40 15
13 P & I Club
00 1.5 0.5
Total: 30077 60564.50 30159.50
Total: Rs. 120801 Crs.

315
14.8.The Shipping Corporation of India
14.8.1 Introduction
The Shipping Corporation of India is the country‟s premier Shipping
Line, presently owning a fleet of 74 vessels of 29.09 Lakh tonnes GT i.e.
51.13 Lakh tonnes DWT (as on 01.10.2010), with a share of about 32% (in DWT) of the total Indian tonnage. SCI‟s owned fleet includes Bulk carriers, Crude oil tankers, Product tankers, Container vessels, Passenger-cum-Cargo
vessels, Phosphoric Acid / Chemical carriers, LPG / Ammonia carriers and Offshore Supply Vessels. In addition, SCI mans / manages 64 vessels of 3.18
Lakh tonnes GT and 2.2 Lakh tonnes DWT on behalf of various Government and private organizations.
The Government of India has conferred the “Navratna” status to SCI on 01.08.2008; granting enhanced autonomy and delegation of powers to the
Company towards capital expenditure, formation of Joint Ventures, mergers, etc. During the year 2009-10, the company has earned net profit of Rs. 376.91 crore on turnover of Rs. 3,463.12 crore.
14.8.2. Vision:
To emerge as a team of inspired performers in the field of Maritime Transportation serving Indian and Global trades with focus on:
Maintaining its “Numero Uno” position in Indian Shipping
Establishing a major global presence in Energy – related, Dry Bulk
and niche container shipping markets.
Evolving suitable business models to exploit emerging opportunities
in Offshore Oil Sector, Port / Terminal Management, Logistics etc.
Safety of people and property and protection of Environment.
14.8.3. Mission:
To serve India‟s overseas and coastal seaborne trades as its primary
flag carrier and be an important player in the field of global maritime transportation as also in diverse fields like Offshore and other marine
transport infrastructure.
14.8.4. Present Status:
Sailing through for nearly five decades, the SCI today has a significant
presence on the global maritime map. The highly diversified fleet of the SCI
316
includes modern and fuel-efficient ships giving it a qualitative status as also a distinct competitive edge over other fleet owners.
Under the NMDP, SCI had envisaged acquisition of 76 vessels of
different types and sizes with an outlay requirement of about Rs. 15,000 crore. As against this, till date SCI has been able to order 43 vessels of total 2.00 million GT. Out of the 43 vessels ordered by SCI, 15 vessels of 1.096
million GT have been delivered to the company and balance 28 vessels are under construction at various shipyards. SCI had proposed acquisition of 4 Chemical tankers as part of the NMDP projects. However, these vessels have
been acquired under the SCI‟s Joint Venture company viz. SCI Forbes Pvt. Ltd. and these vessels have also been included as part of the NMDP.
Out of the balance 33 projects of NMDP, while some projects are under process, the remaining projects would be undertaken by the company during
the next two years. Accordingly, the balance projects of NMDP have been included under Phase-I projects of SCI‟s Perspective Plan 2010~2020.
14.8.5. Strategy:
Core Business:
SCI‟s strategy for the long term is guided by SCI‟s vision and mission statements stated above. To achieve these, SCI has taken into account the
phase out schedule of its older vessels by the year 2020 and the vessels which are presently on order and scheduled for delivery in next two years.
Replacement of the tonnage to be phased out is the first step towards ensuring that SCI is able to maintain its numero uno position. In order to maintain its market share and be able to serve India‟s overseas and coastal
seaborne trade as its primary flag carrier, SCI would acquire tonnage in addition to replacement of phased out vessels.
Transportation of Crude oil and Petroleum products has been SCI‟s core business and this segment is expected to grow substantially considering
India‟s energy requirements for the future. Taking this into account, by the year 2020, SCI plans to acquire 25 crude oil tankers of about 2.50 million GT, which would comprise of VLCC, Suezmax tankers, Aframax tankers and
4 MR size product tankers of about 0.12 million GT.
In the Dry Bulk sector, growth of coal fuelled Power generation is expected to increase import of Coal to India by manifold. At the same time, growth in infrastructure in developing Asian countries like India and China
would definitely increase the trade activities in this region. Under the Bulk carrier segment, SCI plans to acquire 30 vessels of about 1.40 million GT by the year 2020, comprising of Capesize, Kamsarmax and Supramax vessels.
SCI also proposes to acquire 4 Kamsarmax bulk carriers of 0.17 million GT through its Joint Venture company viz. SAIL SCI Pvt. Ltd.
317
In the container segment, SCI is currently catering to the trade in the European, Far-East and Middle-East regions and plans to increase its
market share in these sectors. Further, SCI also plans to enter new sectors, like the Mediterranean region, which are throwing major growth
opportunities. Accordingly, SCI plans to acquire 15 container vessels of about 0.72 million GT by the year 2020. SCI would be acquiring a mix of large and medium sized container vessels so as to effectively utilize them as
per the sector specific requirements. A detailed scenario for container services has been provided in Annexure-II.
In the offshore Services Sector, SCI plans to make further inroads by acquiring specialized Multi Support Vessels and Rigs. SCI has accordingly planned to acquire 23 offshore vessels of different capacities comprising of
AHTSVs, PSVs, MSV and Rig.
In the LPG and Chemical transportation segment, SCI plans to acquire
2 LPG carriers of 0.06 million GT and 4 Chemical tankers of 0.09 million GT. SCI also proposes to acquire 2 Chemical tankers of 0.04 million GT through its Joint Venture company viz. SCI Forbes Pvt. Ltd.
Considering the above opportunities available in the different shipping segments, the phasing out of SCI‟s older vessels and SCI‟s quest to become a global maritime player, SCI plans to acquire 110 vessels of about 5.21
million GT in the next ten years. This acquisition target includes SCI‟s 24 vessels on order (as of 01.01.2011) of about 0.74 million GT. Acquisition of
the proposed vessels would lead to the SCI fleet touching level of 7.0 million GT by 2020.
Inorganic / Lateral Growth:
In addition to expanding by way of acquisition of tonnage, SCI also plans to take the inorganic route so as to establish itself as an important
player in the field of global maritime transportation. SCI has already entered into Joint Venture (JV) agreements for LNG transportation, Chemical transportation and Dry bulk transportation with companies of international
repute. SCI further plans to enter other profitable segments by way of JV‟s and ensure that it is able to establish a global presence in major as well as
niche markets. 14.8.6. Proposed projects during 2010~2020:
SCI proposes to acquire 110 vessels of different types and sizes based
on the requirement of the trade. Out of the proposed 110 vessels, 24 vessels are presently on order (on going projects) which will be delivered to SCI by
2012. Balance 79 vessel acquisition projects will be processed by SCI and 7 vessel acquisition projects will be processed by SCI‟s Joint Venture companies in the dry bulk carrier, Chemical tanker and LNG segments. The
summary of the projects is enclosed at Annex-I. SCI would be reviewing its

318
acquisition strategy and streamline the same on an ongoing basis to determine the size of the vessels.
14.8.7. Financing of projects:
All the vessel acquisition projects proposed by SCI will be financed
through a mix of debt and equity, preferably in the ratio 80:20 (80% through commercial loan and 20% through Internal Resources). No Budgetary support will be required from Government for SCI‟s proposed projects.
The total investment required for SCI‟s vessel acquisition Plan during the period 2010~2020 is estimated to be Rs. 27,668.40 crore. The break up
of investment is as below:
Ongoing Projects - Rs. 4,765.00 crore
Phase – I Projects - Rs. 9,632.40 crore
Phase – II Projects - Rs. 13,271.00 crore

319
Annexure-I
Projects Proposed for the period 2010~2020
Name of the Project No. of
vessels Total GT
On going Projects
Aframax tankers 3 181,500
AHTSV (80T) 3 4,500
Handymax bulk carriers 6 204,000
Panamax bulk carriers 4 172,000
AHTSV(120T) 2 4,000
PSV 2 4,400
Kamsarmax bulk carriers 4 172,000
Sub Total 24 742,400
Phase-I Projects (2010-2015)
VLCCs 4 648,000
6500 TEU container vessels 3 220,500
3500 TEU container vessels 3 111,000
80T AHTSV 6 9,000
Kamsarmax bulk carriers # 4 172,000
Suezmax tankers 2 165,000
Aframax tankers 2 121,000
Capesize bulk carriers 4 408,000
Supramax bulk carriers 4 136,000
1500 TEU container vessels 3 60,000
LPG carriers 2 60,000
LNG tanker # 1 70,000
120T AHTSVs 2 4,000
Sub Total 40 2,184,500
Phase-II Projects (2015-2020)
VLCCs 4 648,000
80T AHTSVs 4 6,000
MR product tankers 4 116,000
Suezmax tankers 6 495,000
Kamsarmax bulk carriers 4 172,000
Jack Up Rig 1 6,000
1500 TEU container vessels 3 60,000
Supramax bulk carriers 4 136,000
MSV 1 5,500
8000 TEU container vessels 3 270,000
Chemical tankers 4 88,000
PSV 2 4,000
Aframax tankers 4 242,000
Chemical tankers# 2 40,000
Sub-Total 46 2,288,500
TOTAL 110 5,215,400
# - Projects to be taken up by SCI's JVCs

320
Project wise details of outlay
Name of Project
Approx. cost
(in Rs.
Crore)
Funding pattern Year of
project preparation/com
mencement
Expected date for
completion of
project
Budg
etary supp
ort
IEBR
(Rs. Crore)
Private /Other
Ongoing projects
Aframax Tankers 971.11 - 971.11 - 2007 2011
AHTSV (80T) 308.02 - 308.02 - 2007 2011
Handymax Bulk
carriers 1239.24 - 1239.24 - 2007 2012
Panamax Bulk carriers 1095.72 - 1095.72 - 2008 2012
AHTSV(120T) 280.60 - 280.60 - 2009 2011
PSV 257.60 - 257.60 - 2009 2011
Kamsarmax bulk carriers 612.72 - 612.72 - 2010 2012
Sub-Total 4765.00 4765.00 -
Phase-I Projects (2010-2015)
VLCCs 1932.00 - 1932.00 - 2010 2014
6500 TEU container vessels 1035.00 - 1035.00 - 2010 2013
3500 TEU container vessels 690.00 - 690.00 - 2010 2013
80T AHTSVs 552.00 - 552.00 - 2010 2013
Kamsarmax bulk
carriers# 644.00 - 322.00 322.00 2010 2013
Suezmax tankers 644.00 - 644.00 - 2011 2014
Capesize bulk carriers 1104.00 - 1104.00 - 2011 2014
Supramax tankers 588.80 - 588.80 - 2011 2014
LPG carriers 506.00 - 506.00 - 2011 2014
Aframax Tankers 552.00 - 552.00 - 2012 2015
1500 TEU container vessels 414.00 - 414.00 - 2012 2015
LNG carrier # 690.00 - 345.00 345.00 2012 2015
120T AHTSVs 280.60 - 280.60 - 2010 2012
Sub-Total 9632.40 - 8965.40 667.00

321
Phase-II Projects (2015-2020)
VLCCs 2125.20 - 2125.20 - 2013 2017
80T AHTSVs 404.80 - 404.80 - 2013 2016
MR product tankers 728.64 - 728.64 - 2013 2016
Suezmax tankers 2125.20 - 2125.20 - 2014 2017
Kamsarmax bulk
carriers 708.40 - 708.40 - 2014 2018
Jack Up Rig 506.00 506.00 2014 2018
1500 TEU 455.40 - 455.40 - 2015 2018
Supramax bulk
carriers 647.68 - 647.68 - 2015 2019
MSV 759.00 - 759.00 - 2015 2019
8000 TEU container vessels 1518.00 - 1518.00 - 2016 2020
Chemical Tankers 1254.88 - 1254.88 - 2016 2019
PSV 253.00 - 253.00 - 2017 2020
Aframax tankers 1214.40 - 1214.40 - 2017 2020
Chemical Tankers # 570.40 - 285.20 285.20 2017 2020
Sub-Total 13271.00 - 12985.80 285.2
TOTAL 27668.40 26716.20 952.20
# - Projects to be taken up by SCI's JVCs
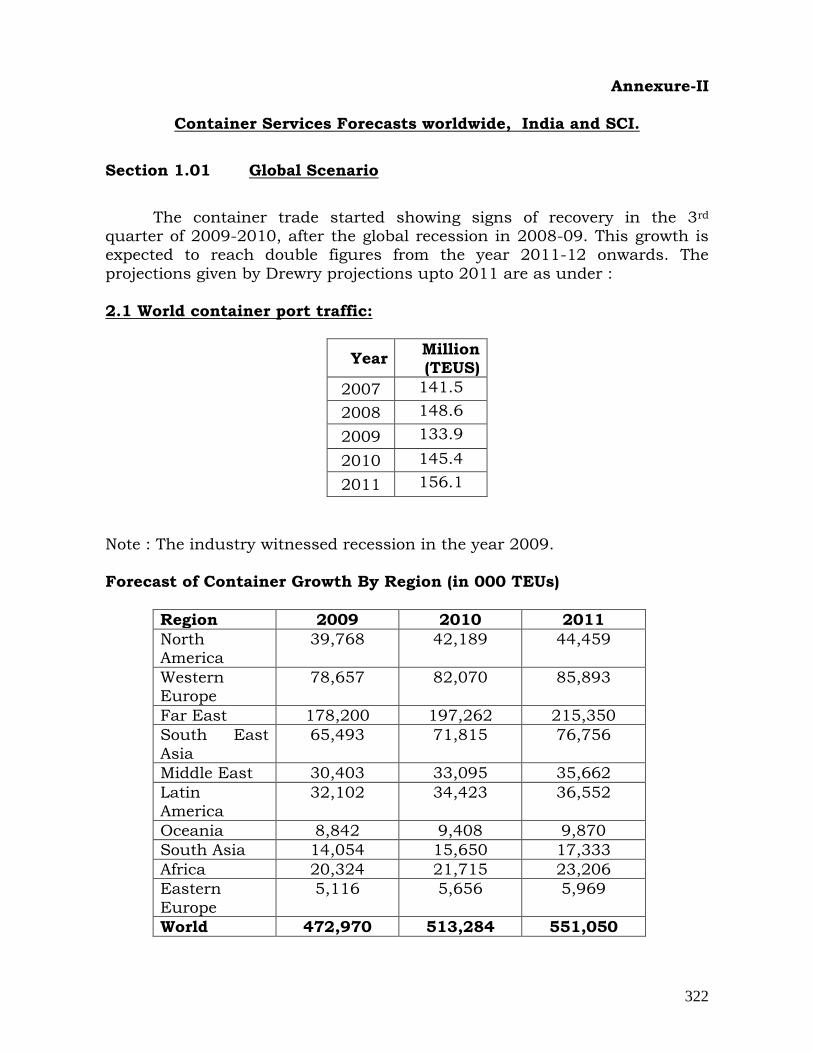
322
Annexure-II
Container Services Forecasts worldwide, India and SCI.
Section 1.01 Global Scenario
The container trade started showing signs of recovery in the 3rd quarter of 2009-2010, after the global recession in 2008-09. This growth is expected to reach double figures from the year 2011-12 onwards. The
projections given by Drewry projections upto 2011 are as under :
2.1 World container port traffic:
Year Million (TEUS)
2007 141.5
2008 148.6
2009 133.9
2010 145.4 2011 156.1
Note : The industry witnessed recession in the year 2009.
Forecast of Container Growth By Region (in 000 TEUs)
Region 2009 2010 2011
North America
39,768 42,189 44,459
Western Europe
78,657 82,070 85,893
Far East 178,200 197,262 215,350
South East
Asia
65,493 71,815 76,756
Middle East 30,403 33,095 35,662
Latin America
32,102 34,423 36,552
Oceania 8,842 9,408 9,870
South Asia 14,054 15,650 17,333
Africa 20,324 21,715 23,206
Eastern
Europe
5,116 5,656 5,969
World 472,970 513,284 551,050

323
Forecast of Growth of Containerization in % age (Region wise)
Region 2009 2010 2011
North America
-13.4% 6.1% 5.4%
Western Europe
-14.3% 4.3% 4.7%
Far East -8.4% 10.7% 9.2%
South East
Asia
-8.1% 9.7% 6.1%
Middle East -1.3% 8.9% 7.8%
Latin America
-13.4% 7.2% 6.2%
Oceania
-4.9% 6.2% 4.9%
South Asia -5% 11.4% 10.7%
Africa -2.1% 6.8% 6.9%
Eastern
Europe
-36.1% 10.6% 5.5%
World -9.8% 8.5% 7.4%
Source : Drewry : It may be noted that year 2009 was the recession year and not the general trend. All regions participated in the recovery, though South Asia and
Eastern Europe led the way with very strong growth of over 25%. Relative laggards were Oceania, Africa and Western Europe – all below 10% year-on-year(y-o-y)
Indeed, this picture is replicated in most regions, despite the very
strong y-o-y performance in the first quarter. In the most obvious interpretation, this could be seen as a re-establishment of normal seasonality trends. The industry is expected to regain its annual global
growth figures of 9.3% in the years to come. It may be noted that as per the forecasts, the world wide growth rate is
expected to be in the region of 7% per annum, with the South Asia region expected to have maximum growth in this market around 10-11% . India will
be a significant player of this growth. As the only Indian Shipping Line in the international container services trade, the role of SCI will also be significant as a participant in this expected growth of container shipping in South Asia.
The annual containerised throughput in the South Asia region is expected to reach about 40,870,000 TEUs by 2020 as against 17,333,000 TEUs expected to be achieved by 2011, assuming a CAGR of about 10% in the South Asia
region. Out of this 15 million TEUs should be controlled by Indian shipping interests out of which 5 million TEUs by owned/chartered vessels and 10
million TEUs by foreign flagged Indian controlled vessels. SCI aims to control 30% of the 5 million TEUs i.e. 1.5 million TEUs by 2020.

324
Indian Containerised Trade & Future Opportunities
New analysis from Frost & Sullivan, predicted India will be handling
21 million TEUs by 2014 from the 9 million TEUs in 2009. Asia is expected to be the most important region of growth after the recession ends in 2010-11. India will catch up with the increasing industrialization. Over the past
20 years, loaded global container traffic is estimated to have increased at an average annual rate of 9.3%, (which currently has been revised to 10%) and
Asia confirms its position as the most important region. (Source: Drewery - August 2009 and Presentation by Deutsche Bank Research). SCI’s CONTAINER TRADE:
SCI currently operates in a niche market and is a niche player serving the Indian EXIM Trade carrying the Indian Flag all over the world. This gives us a sense of National Pride as SCI, with its limited
capacity competes with the global container lines. Also all the SCI services are India Centric. SCI‟s presence in the market acts as a
stabilizer of freight rates for the Indian market, which is beneficial for the Indian consumers. Also, SCI, being the National line and flag carrier, SCI is important for carrying of the sensitive cargoes like defence GOI cargoes
etc.
SCI being a Public Sector Company needs to synchronize its goals with the Government objective on economic development. SCI needs to
ensure that the Indian Products are competitive in the Global market but at the same time we need to ensure that the Indian Exporter is not
exploited. SCI, also needs to ensure that he Indian Industry/Consumers get imported raw materials / goods at cheaper rate.
The trade lanes that SCI operates in and the tonnage that has been
deployed by SCI in the respective trade lanes is as given below:
EXISTING SERVICES :
Currently SCI has the following services:
(i). INDIAN SUB-CONTINENT EUROPE SERVICE (ISES)
Port Rotation: Colombo / Nhava Sheva / Pipavav / Mundra / Salalah / Felixtowe / Hamburg / Antwerp / Jeddah / Colombo.
(ii). INDFEX 1 SERVICE
Busan / Shanghai / Ningbo / Hong Kong / Singapore / Port Kelang / Colombo / Nhava Sheva / Colombo / Port Kelang / Singapore / Hong Kong
/ Busan

325
(iii). INDFEX 2 SERVICE
Xingang / Dalian / Qingdao / Busan / Hong Kong / Shekou /
Singapore / Port Kelang / Chennai / Vizag / Singapore / Hong Kong / Xingang.
(iv). SMILE SERVICE
Colombo / Mundra / Jebel Ali / Mundra / Pipavav / Cochin /
Tuticorin / Colombo
(v) IMED SERVICE
Colombo / Nhava Sheva / Mundra / Salalah / Port Said /Istanbul /
Barcelona / Genova / La Spezia / Port said / Salalah / Colombo.
The deployment of the vessels (owned / in-chartered) in the existing
container services is as follows :
1) ISES : SCI has three vessels in this service – 2 owned and 1 chartered,
namely:
Owned vessels : SCI CHENNAI (4400 TEUs) SCI MUMBAI (4400 TEUs)
In-chartered vessel : SCI NEW DELHI (3500 TEUs).
2) Indfex service : has one vessels, in-chartered vessels :
SCI KOLKATA (3500 TEUs)
3) Indfex 2 service : has one vessel, in-chartered vessel : SCI PRESTIGE (2850 TEUs)
4) Smile service : smile service has three SCI owned vessels, namely :
MV LAL BAHADUR SHASTRI (1870 TEUs)
MV INDIRA GANDHI (1870 TEUs)
MV RAJIV GANDHI (1870
TEUs)
5) IMED service: has 2 vessels, in-chartered vessel:.
HANSA INDIA ( 3424 teu)
SCI PRIDE ( 3129 teu)

326
EXPANSION PLANS FOR SCI CONTAINER SERVICES
SCI is in the process of upgrading the existing services that we
are catering to. We want to have a mix of the in chartered tonnage and
acquired tonnage which is the norm world over. SCI has already placed
an order for 3 x 6500 teu vessels which are likely to be delivered to SCI
from August 2013. Considering the fact that in the next 10 years the
markets are expected to grow and India is expected to be the center of
growth, SCI would like to be a market leader and would like to expand
the existing services and also enter in the new markets both India
Centric and Non India Centric, which so far we have not ventured into.
SCI proposes to upgrade all the existing services and following is
what is being proposed for upgrading the services:
ISE Service which is today being operated in a consortium with 2 x
4400 teu vessels and 1 x 3500 teu vessel is to be upgraded into 2 strings
as follows:
India (East Coast / UKC) 3 X 3500 teu vessels
India (West Coast / UKC) 3 X 6500 teu vessels
Mediterranean Service which is today being operated in a
consortium with 2 X 2500 teu vessels to be upgraded to 3 X 3500 teu
vessels
INDFEX -1 Service which is currently being operated in a consortium
with 1X 3500 teu vessel to be upgraded to 2 x 4400 teu vessels
INDFEX-2 Service which is currently being operated in a consortium with
a 1 x 2850 teu vessel to be upgraded with 1 x 4400 teu vessel.
SMILE Service is today being operated solely by SCI with 3 X 1870 teu
vessels. These vessels will complete their economic life in 2018
(completing 25 years) after which we will need to replace these vessels
with 3 x 2500 teu capacity vessels.
In addition to upgrading the existing services, SCI sees a huge
potential in the following sectors on the India Centric Trade Lanes:
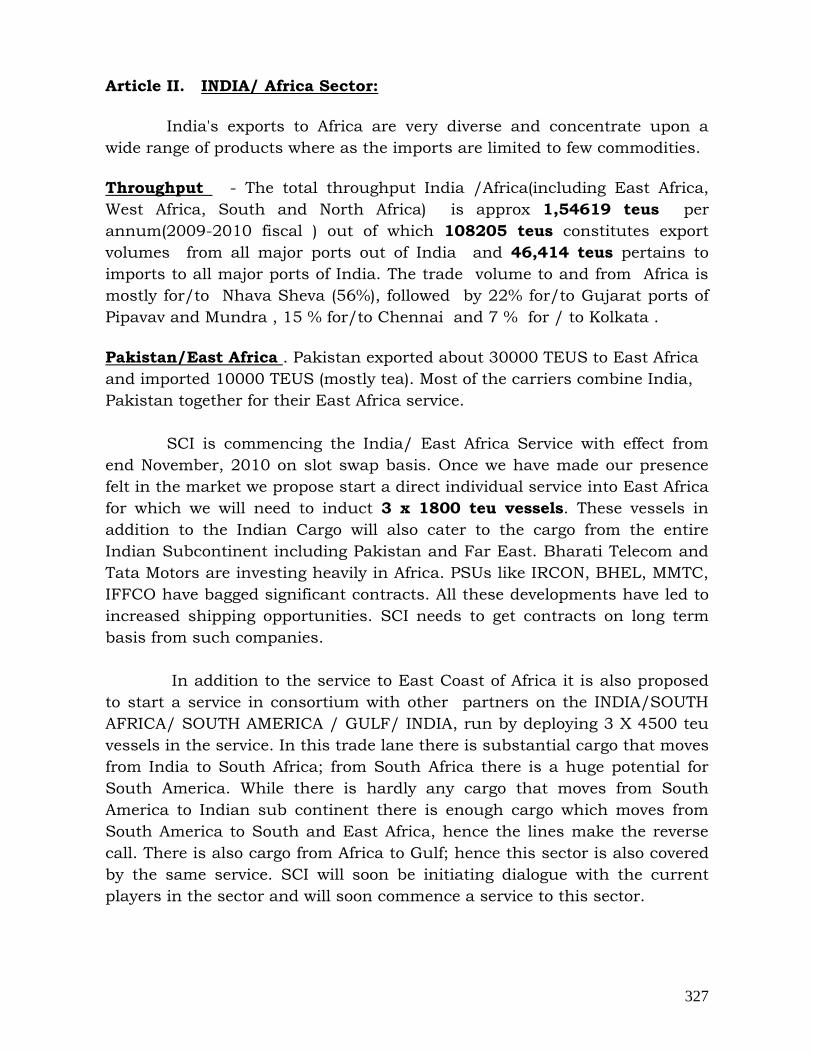
327
Article II. INDIA/ Africa Sector:
India's exports to Africa are very diverse and concentrate upon a
wide range of products where as the imports are limited to few commodities.
Throughput - The total throughput India /Africa(including East Africa,
West Africa, South and North Africa) is approx 1,54619 teus per
annum(2009-2010 fiscal ) out of which 108205 teus constitutes export
volumes from all major ports out of India and 46,414 teus pertains to
imports to all major ports of India. The trade volume to and from Africa is
mostly for/to Nhava Sheva (56%), followed by 22% for/to Gujarat ports of
Pipavav and Mundra , 15 % for/to Chennai and 7 % for / to Kolkata .
Pakistan/East Africa . Pakistan exported about 30000 TEUS to East Africa
and imported 10000 TEUS (mostly tea). Most of the carriers combine India,
Pakistan together for their East Africa service.
SCI is commencing the India/ East Africa Service with effect from
end November, 2010 on slot swap basis. Once we have made our presence
felt in the market we propose start a direct individual service into East Africa
for which we will need to induct 3 x 1800 teu vessels. These vessels in
addition to the Indian Cargo will also cater to the cargo from the entire
Indian Subcontinent including Pakistan and Far East. Bharati Telecom and
Tata Motors are investing heavily in Africa. PSUs like IRCON, BHEL, MMTC,
IFFCO have bagged significant contracts. All these developments have led to
increased shipping opportunities. SCI needs to get contracts on long term
basis from such companies.
In addition to the service to East Coast of Africa it is also proposed
to start a service in consortium with other partners on the INDIA/SOUTH
AFRICA/ SOUTH AMERICA / GULF/ INDIA, run by deploying 3 X 4500 teu
vessels in the service. In this trade lane there is substantial cargo that moves
from India to South Africa; from South Africa there is a huge potential for
South America. While there is hardly any cargo that moves from South
America to Indian sub continent there is enough cargo which moves from
South America to South and East Africa, hence the lines make the reverse
call. There is also cargo from Africa to Gulf; hence this sector is also covered
by the same service. SCI will soon be initiating dialogue with the current
players in the sector and will soon commence a service to this sector.
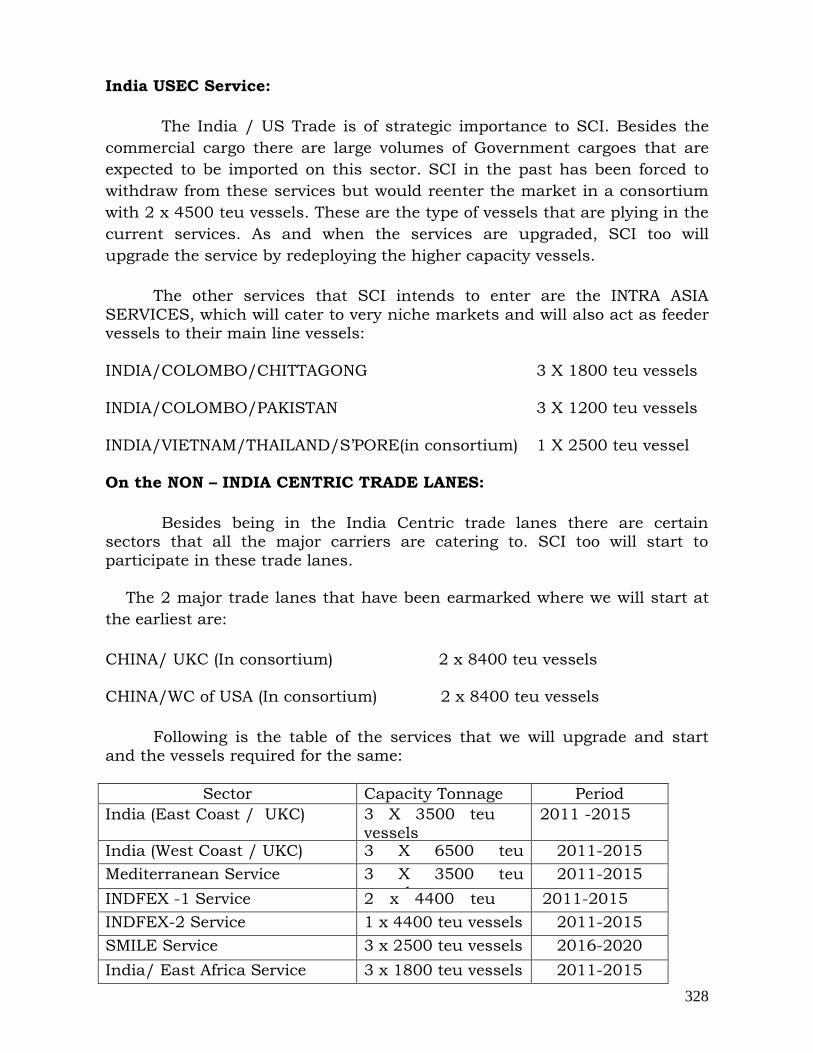
328
India USEC Service:
The India / US Trade is of strategic importance to SCI. Besides the
commercial cargo there are large volumes of Government cargoes that are
expected to be imported on this sector. SCI in the past has been forced to
withdraw from these services but would reenter the market in a consortium
with 2 x 4500 teu vessels. These are the type of vessels that are plying in the
current services. As and when the services are upgraded, SCI too will
upgrade the service by redeploying the higher capacity vessels.
The other services that SCI intends to enter are the INTRA ASIA
SERVICES, which will cater to very niche markets and will also act as feeder vessels to their main line vessels:
INDIA/COLOMBO/CHITTAGONG 3 X 1800 teu vessels
INDIA/COLOMBO/PAKISTAN 3 X 1200 teu vessels
INDIA/VIETNAM/THAILAND/S‟PORE(in consortium) 1 X 2500 teu vessel
On the NON – INDIA CENTRIC TRADE LANES:
Besides being in the India Centric trade lanes there are certain sectors that all the major carriers are catering to. SCI too will start to
participate in these trade lanes.
The 2 major trade lanes that have been earmarked where we will start at
the earliest are:
CHINA/ UKC (In consortium) 2 x 8400 teu vessels
CHINA/WC of USA (In consortium) 2 x 8400 teu vessels
Following is the table of the services that we will upgrade and start and the vessels required for the same:
Sector Capacity Tonnage Period
India (East Coast / UKC) 3 X 3500 teu vessels
2011 -2015
India (West Coast / UKC) 3 X 6500 teu vessels
2011-2015
Mediterranean Service 3 X 3500 teu
vessels
2011-2015
INDFEX -1 Service 2 x 4400 teu vessels
2011-2015
INDFEX-2 Service 1 x 4400 teu vessels 2011-2015
SMILE Service 3 x 2500 teu vessels 2016-2020
India/ East Africa Service 3 x 1800 teu vessels 2011-2015
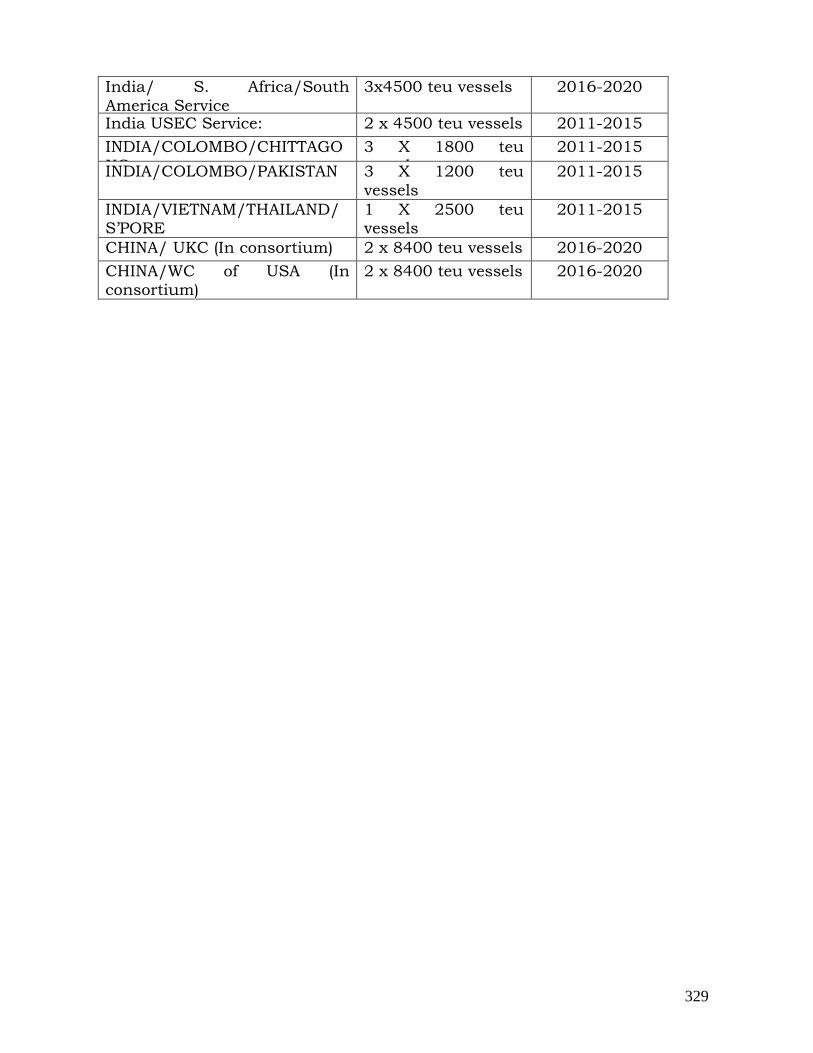
329
India/ S. Africa/South
America Service
3x4500 teu vessels 2016-2020
India USEC Service: 2 x 4500 teu vessels 2011-2015
INDIA/COLOMBO/CHITTAGONG
3 X 1800 teu vessels
2011-2015
INDIA/COLOMBO/PAKISTAN 3 X 1200 teu
vessels
2011-2015
INDIA/VIETNAM/THAILAND/S‟PORE
1 X 2500 teu vessels
2011-2015
CHINA/ UKC (In consortium) 2 x 8400 teu vessels 2016-2020
CHINA/WC of USA (In consortium)
2 x 8400 teu vessels 2016-2020
330
CHAPTER-15
HUMAN RESOURCES DEVELOPMENT
15.1. Introduction
When India is set to increase its share in the world trade and also to
increase its share of manpower supply to the global demand, there is an urgent and absolute need to go beyond the training of the seafarers and to
offer programmes which are to enhance the capacity not only of the seafarers but also to provide the requisite skill enhancement through various courses for the personnel working in the industry.
15.2. Vision
Develop and sustain a high quality human resource management
catering to the needs of the global including national maritime industry for competent seafarer.
15.3. Issues
India is well-poised to take a major part in growth in shipping
worldwide given the tradition of seafaring, long coastline with large potential for coastal shipping, growing EXIM trade, established public and private maritime institutes. Given the millions of English speakers, a large talent
pool, and growing shipping businesses onshore, India can aim to supply more seafarers to the global maritime industry. Personnel in the Indian
maritime sector could be vertically divided into two groups – (i) the seafaring personnel; and (ii) other personnel who are responsible for the movement of the ships and handling of cargo.
The McKinsey report projects global cargo growth at 5 - 7 % on 3% global GDP based on current World economic outlook for 2010-2020. Container traffic is estimated to grow from 114 million to 200 million (TEU)
through CAGR 7%. Both wet bulk and dry bulk are expected to grow at a slightly slower rate of 5 %(2009: 2.7 billion- 2.8 bn :: 2020: 4 bn- 4.5 bn)
Growth in ship types up to 2020 is expected to be as follows:
Containerships: The industry expects to add 1,600 ships (3.6 per cent
CAGR), driven by resurgent demand and high orders currently, which makes containerships one of the fastest growing ship segments along with tankers.
Tankers: The highest vessel growth is expected in tankers with addition of 2,500 vessels (4.1 % CAGR), although slower than the historical growth (6.9 % CAGR 2005:2009). Bulk carriers: Lower growth is expected in bulk
carriers with 1,500 vessels (3.3 % CAGR compared to historical trends (4.3 % CAGR 2005: 2009> historical CAGR 3.1 %). General cargo and support boats: Around 2,000 general cargo and support ships are likely to be added,
as their growth is highly dependent on that of tankers, containers and bulk carrier ships, and increased offshore activity.

331
Global demand for seafarers is expected to increase from 1.15 million
currently to 1.6 million by 2020, driven by growth in cargo and a corresponding increase in fleet size. The current demand is 550,000 Officers
(270,000 nautical, 280,000) and about 600,000 Ratings. By 2020, the global demand for each is expected to increase by 20 per cent: 660,000 Officers and 720,000 Ratings, an additional 110,000 Officers and 120,000 Ratings. In
alternative GDP scenarios, growth in the number of seafarers could vary between 12 per cent and 26 per cent through 2020.
India can aspire to strong growth in Officers and Ratings by 2020.The share of high-quality Officers can increase from 6.3 in 2009 to 9.0 per cent
in 2020, whereas Ratings could see a moderate growth from 7.5 per cent in 2009 to 9 per cent in 2020 by significantly improving their quality. This implies an additional 65,000 Officers and 45,000 Ratings taking in to
consideration annual attrition, which will require expanding annual training capacity from 5,600 to 15,000 Officers and from 4,600 Ratings to 9,000
Ratings. Demand for Indian Ratings was estimated to be 45,000 in 2009,
leading to an oversupply of 10,000 within the country. In addition, Indian Ratings are perceived to be of lower quality. Therefore, India can set itself an aspiration to grow moderately in the number of Ratings and attain a market
share of 9 per cent from the current 7.5 per cent. This implies doubling capacity in the next 10 years and significant improvement in attitude,
communication, work ethics, and technical skills. India would have to supply an additional 45,000 Ratings, which may vary depending on the attrition rate. High crude activity is likely to drive manning demand for
Ratings for Offshore Supply Vessels (OSV). In addition, developed economies having high Near Coastal Voyage (NCV) traffic should be targeted as these countries have a shortage of domestic seafarers.
The ramping up of capacities in Pre Sea and Post Sea training should
not present any major difficulties as the entry of the private sector since the late nineties has lead to strong and continuing growth. The real challenge is in providing adequate sea training berths which are in short supply thereby
choking the entire supply chain (relatively less tonnage under Indian flag 1.5%: sea farers 6%) . Currently sea training berths on Indian ships are not
mapped and it is not possible to either accurately estimate the total existing or potential training accommodation available or verify the claims of the training institutes for adequate tie ups of training berths for prospective
students. The institutes run by shipping companies or where a tie up exists for a certain no of seats sponsored by Indian or foreign owners or manning companies to meet their own requirements understandably attract the best
candidates as chances of success are much higher both for obtaining training slots as well as employments prospects. It is the standalone
institute that presents the major difficulty. The true cost of training is neither reflected in the course fees as “cost” of the training slot is not
332
factored in nor is sufficient information in the public domain available on performance in the entry level COC examinations or made available during
“counseling” sessions which could perhaps provide a useful guide and indication to starry eyed aspirants in quest for a quality institution
correlated and assured sea career.
This situation had lead to development of a grey market for sea
training berths throwing open possibilities of opportunistic rent seeking and mushrooming of low quality training institutions which promise sea training slots not backed by adequate underlying capacity. The uncertainty leads to
exploitation and deters good quality sea faring aspirants particularly at the ratings level.
15.4. STRATEGIES
Following strategies are suggested:-
1) An efficient and more transparent market mechanism has to be created for Shipping Companies (Indian and foreign) and training institutes to trade (i.e. buy /sell) in training slots and cost of sea training berths
should be factored in the course fees itself to enable candidates to organize funding through normal banking channels. The initial steps could be taken by utilizing funds (generated by Maritime Training Trust
under the Tonnage tax obligations, levies on overage offshore vessels and penalties arising out of obligation created by mandating compulsory
training slots on chartered vessels) to buy bulk sea training slots in the Indian and foreign markets and offer them to the standalone institutes unable to make their own arrangements.
2) Weightage to training on Coastal, River Sea and IWT ships while
determining Sea training requirements.
3) Seamless inter-modal mobility.
4) Opening up the offshore sector to nautical officers of Indian Navy giving
due consideration to individual sea experience and custom designed skill gap bridge in service courses or resettlement as part of resettlement programs without insisting on written and oral examinations thereby
tapping into a large pool of disciplined and qualified manpower. The artificers and petty officers are important targets for upgrade to MCV
officers through the NCV, RSV IWT route as sea training requirements can be rationalized after factoring in sea service and relevant experience.
5) Additional capacity
a) Creation of additional capacity by exploiting the opportunity offered by seasonal nature of passenger traffic on vessels plying from the main
land to the island territories as well as in the inter-island traffic (Lakshadweep and Andaman and Nicobar).

333
b) Encourage additional cabins for trainees in ship to be ordered under
order/construction or through temporary arrangements such as accommodation modules, portable accommodation containers etc
c) Adding berths in existing crew cabins.
d) Aligning manning requirements with international safe manning/rest hour norm releasing existing accommodation for training berths.
e) Mandating training slots/berths in chartered vessels while granting licenses or penalty to be paid in lieu.
f) Additional levy on chartering of overage foreign vessels to be set off against provision of training berths over and above mandated while granting license.
6) The training requirement of seafarers to be aligned to STCW provisions. Existing duration of sea training for nautical cadets and presea training for engineering officers exceeds STCW provisions.
7) E-examination: -
The examinations conducted by the Directorate for various grades of
Engineering and nautical competency certificates are proposed to be conducted online as per the following schedule:-
Engineer’s examination grade Year
Class - IV - 2011
Class - II - 2012
Class - I - 2013
Nautical’s examination grade Year
2nd Mate - 2011 - 2012
1st Mate - 2013
Master - 2014
Various courses to meet the sectoral demands of the various industries within the maritime sector have to be designed. The target group planned under this are as follows:
(i) Maritime administrators;
(ii) Engineers and Technologists engaged in marine engineering and
allied industries; (iii) Personnel engaged in ports, cargo-handling and other allied
industries;
334
(iv) Personnel engaged in harbour engineering, dredging, offshore engineering, etc.;
(v) Personnel engaged in shipbuilding, ship repair and naval architecture;
(vi) Personnel engaged in legal matters;
(vii) Personnel engaged in marine science and allied subjects.
All the programmes have to be designed with a curriculum to meet both the knowledge content as well as the practical requirement.
To increase knowledge base and HR capacity in the maritime sector it is important that each sub sector is manned by personnel adequately trained
through courses. The road map for the Government and other training institutions in the private sector in the Perspective Plan is at Annexure 1.
15.5. FOREIGN COLLOBORATION
An MSc Shipping and Port Management is being started in collaboration with World Maritime University at Maritime Training Institute (MTI) of Shipping Corporation of India. For faculty resources, MTI would take
recourse to a large of pool of experts already trained by WMU as also visiting faculty from outside. It is contemplated that the course would have duration
of 12 months to 14 months depending on the credit requirements of the affiliating University. The course will also have an input of visit/field studies at Shipping companies, Shipyards, and other maritime players to give an
overall exposure to the participants. The course will be open to the seafarers holding certification of competency as also others with specified experience at managerial/supervisory levels holding a bachelors degree.
The intake is contemplated at 50 participants. The course will be
entirely residential and suitable residential accommodation in the form of an studio apartment is contemplated to be provided.
International Maritime Law Institute, (IMLI) Malta runs a PG course in Maritime Law. No Indian University offers masters in Maritime law, the common perception being that Maritime law is the preserve of a select few
and may not provide a rewarding career to aspiring law graduates. The possibility of introducing electives in Maritime Law in undergraduate courses
at a few premier law institutes located in and around Mumbai, Chennai and Kolkata campuses as part of a seeding program is worth exploring. The Government will provide the required faculty support to these institutes for
two to three years. The faculty required for developing and delivering law modules for relevant specializations can also be tasked with developing the
seeding and subsequently a PG program, creating expertise in maritime law education. Visiting faculty from IMLI will also be arranged.
335
15.6. PROPOSED PROJECTS BY DG (SHIPPING)
15.6.1 Increasing the share of Indian officers in the world
shipping
The no. of merchant navy officers globally is currently estimated to be 5,50,000, which will increase to 6,60,000 by 2015 assuming major supplying nations continue to train officers at historical rates.
Shortage in officers is expected to become acute by 2013 as a result of higher growth in fleet size. India is the 5th largest supplier of officers with a global share of 6.3%. India can aspire to substantially increase
the no. of its officers and achieve a market share of 9%. For this, India would have to supply 65,000 additional officers in the next 5 years,
which would requires that the training capacity almost triples in the next 5 years while the quality does not go down. This will require sustained promotional campaign, including mass media advertising
campaign, direct marketing campaign, school and college contact programme, ground activation programme, interactive campaign and
PR campaign. All these campaigns have to be carried out through a consultancy firm. The estimated expenses for such campaign are Rs. 4 crores per annum and the same has to be carried out over the five year
period. The expected cost of the project is Rs.20 crores.
15.6.2 Dedicated training ships for giving on board training.
Currently there are approximately 4000 training slots available
for those coming out of various pre-sea training institutes in India. However this has to be substantially increased if we have to aspire to achieve a market share of 9% in the next five years. The total training
berths for achieving this market share is estimated to be 16000. In order to create the additional training berths it is proposed that
Government through SCI may acquire dedicated training ships. Such a vessel, which can carry 400 trainees, is estimated to cost approximately Rs. 125 crores. It is proposed to acquire 4 such ships
by 2015. The approximate total cost of the project is estimated to be Rs.500 crores.
15.6.3 Project for Welfare of Seafarers.
At present, the employers of seamen i.e. Indian Shipping Companies and Foreign Shipping Companies are remitting
Pension/Annuity Contribution and Additional Voluntary Contributions in terms of NMB Agreement and Collective Bargaining Agreement executed with them by the Recognized Union of Seafarers in India.
The accumulations are presently paid in lump sum to seamen. SPFO intends to launch Contributory Annuity Scheme for seamen subject to
Government‟s approval under which these accumulations would be handed over to select Life Insurance Company for the purpose of
336
making deferred payment to seamen as Annuity throughout their life time.
Pension/Annuity Contributions, Additional Voluntary Contributions and Ex-Gratia have been considered as the corpus for
introducing Contributory Annuity Scheme for the seamen. The Annual accretion under the Pension/Annuity Contributions and Additional Voluntary Contributions in respect of 34000 seamen is
around Rs.45 crores. If Government contributes 50% of the Annual accretion from the year 2010-2011, the financial implication would be around Rs.25 crores p.a.
Around 12,700 seamen who are having Provident Fund Accounts would be deprived of any benefit on account of Annuity due
to zero balance in their account under the head Pension/Annuity Contributions and Additional Voluntary Contributions. Government may bring these seamen under the cover of Contributory Annuity
Scheme by way of a grant of Rs.10,000 p.a. in individual account. The financial out-go for this project is expected to be Rs.13 crores. Thus
the outgo of the two projects together will be about Rs. 38.00 crores p.a. But it will create considerable goodwill among the seafaring community.
Considering an average increase of 6000 seamen per year, the estimated financial outgo for this project would be approximately 400 crores for the period, 2010 to 2020.
15.6.4 Restructuring & Up gradation of Directorate General of Shipping and MMD offices.
Expansion of MMDs and opening new MMDs at Kandla, New
Mangalore, Paradip, Haldia and Noida were carried out in 10th plan.
The work of setting up of infrastructure for these MMDs has been taken up in the 11th Plan especially for building of infrastructures and providing equipments. With the increase in the Indian shipping
tonnage and the shipping traffic, to and from, the Indian ports, it is necessary that the MMD offices are to be set up at all major and minor
ports, which has a traffic of more than 100 ships in a year for effective implementation of a regulatory regime as per the requirements of IMO. The budgetary estimate for constructing the buildings at 10 locations
is estimated to be Rs. 50 crores.
The manpower at the existing MMDs and the newly proposed MMDs has to be also strengthened/created. It is proposed to create the new offices with at least three surveyors and six
administrative/supporting staff. The expenditure for the above will work out to Rs. 10 crores/year, totaling to Rs. 100 crores during the period from 2010 to 2020.
The infrastructure of DG Shipping at Mumbai is more than fifty
years old. The Indian Maritime Administration has diversified its
337
activities pursuance to the adoption of various IMO and ILO Conventions. With the increasing activities the space constraints of
the Directorate is explicitly felt. Therefore, the need for establishing a new office for the Directorate in a vaster area, probably at Navi
Mumbai, is proposed to be mooted and implemented before 2020. The Proposal envisages acquiring at least one hectare of land in Navi Mumbai from the special government beneficiary scheme from CIDCO
either on lease or on outright purchase. It is proposed to construct a multi- storeyed building to house the office of the Directorate.
Expenditure for this project can be divided into two phases namely acquisition of land and construction of the building. The
expenditure for acquiring the land is estimated to be Rupees 50 crores. The construction of the building may cost approximately 100 crores. The whole project is estimated to be completed by 2020.
15.6.5 Seamen Welfare - Establishing more infrastructure for
seamen’s hostels.
As per section 218 of MS Act the National Welfare Board of
Seafarers is responsible for the creation of infrastructure for seamen welfare activities. The NWBS in its meeting on 06.05.2010 had made concerns on this issue and directed the committee constituted for this
purpose to give its recommendation on the infrastructure to be created at different ports for seamen welfare.
It is proposed to improve the infrastructure at the major ports
and create new facilities in areas where it is not available by 2015.
The projected expenditure for this phase-I will be approximately Rs. 40 crores.
In the 2nd phase of the project it is proposed to create new infrastructure for seamen‟s hostel/club in minor ports by 2020 with
an estimated expenditure of approx. Rs. 60 crores.
15.6.6 All India Maritime Services.
Indian shipping sector is emerging as a promising area of
investment and the activities in this sector is always on a steady increase. With the adoption of various conventions of IMO, the
regulatory regime is also becoming stronger, whereby more technical expertise is required for implementing them. The shipping activities are an amalgamation of practical and administrative experiences.
Moreover, legal and financial expertise are also required for the smooth sailing of various activities in this sector. Due to the high
remuneration prevailing in this field, this sector is always short of expert manpower. At present, the regulatory authorities like the Directorate and the implementing authorities like ports etc are
functioning with substantial hired manpower. Such a scenario is not
338
a healthy one especially for the regulatory and the implementing authorities. Therefore there is an urgent need to create a pool of
Maritime experts drawn from general administration, technical, legal and finance, suitably train them so that there is a continuous
availability of marine experts to the Directorate General of Shipping without any break. Thus, creating an Indian Maritime Service in line with other civil services of the nation is an urgent need at this stage.
It is therefore proposed to set up the Indian maritime services by 2020. The initial expenditure for this project may be approximately 5 crores.
Development of Information Technology. i) e-Examination
Modernization of examination pattern and conduct of various
examinations have commenced in DG Shipping and allied offices since
April, 2010. In this module, applying for examination, checking of certificates, writing of examination etc are proposed to be brought under electronic mode. The initial work has already been started in
this regard. It is proposed that by 2020 all the grades of all the examinations are to be conducted online. The estimate for the above
project works out to be Rs. 50 crores.
ii) Integration of e-modules
The directorate had developed various e modules on subjects like COC, CDC, RPS, INDOS, SPFO. The various details of seafarers
are available in these modules and being updated by the concerned agencies. At present these modules are stand alone, which makes it difficult for accessing the data by any one for checking and other
purposes. It is proposed to integrate these modules so that accessing all data by any person will be easier. This will make the work of MMDs and DG Shipping simpler and the lead time of replying to
seafarer‟s queries and issuance of services to them can be streamlined and expedited. The project is already in the infant stage of
implementation and proposed to be implemented before 2015. The monitory requirement for this project is worked out to Rs. 50 crores.

339
15.7. Comparison of financial aspects with periodicity of requirement.
The comparison of budgetary provisions given in the proposal with periodicity of requirement is tabulated below :
No. Details Fund requirement (Rs in crores)
2010-2012 2012-2017 2018-2020
1 Increasing the share of Indian officers in the world
shipping
02 15 3
2 Dedicated training ships for giving on board training
- 500 -
3 Project for Welfare of Seafarers
120 200 80
4 Restructuring and Up gradation of DG Shipping and MMD offices
70 150 80
5 Seamen‟s Welfare –
Establishing more infrastructure for Seamen‟s Hostel
10 60 30
6 All India maritime services
00 03 02
7 Development of Information Technology
50 50 00
Total: 252 978 195
Total: Rs. 1425 C
15.8. INDIAN MARITIME UNIVERSITY
15.8.1 INTRODUCTION
The Indian Maritime University (IMU) is established as a Central affiliating University by the Ministry of Shipping, Government of India and
came into existence on 14th November 2008. The objective of IMU is to facilitate and promote maritime studies and research in all areas of maritime field. The key areas which the IMU to concentrate is in providing
educational courses, undertaking research work, providing training in specialized areas and to provide support to promote the growth of maritime
sector by way of supply of quality human resources.

340
The IMU was established with the amalgamation of the then existing seven government-run institutions, viz., National Maritime Academy,
Chennai, Marine Engineering & Research Institute (MERI), Mumbai, Lal Bahadur Shastri College of Advanced Maritime Studies and Research,
Mumbai, Training Ship Chanakya, Navi Mumbai, National Ship Design & Research Centre, Visakhapatnam, Indian Institute of Port Management, Kolkata and MERI, Kolkata. Accordingly, the headquarters at Chennai and
the four regional campuses at Chennai, Mumbai, Kolkata and Visakhapatnam formed the structure of the University. During the academic year 2009-10, an additional campus at Cochin was established to meet the
demand from that region. Each of the five campuses has been focussing its academic activities
on certain areas, though there could be overlap in offering certain academic programmes. The Perspective Plan is prepared taking into the account the plan projection made to the EFC and considering the expertise and
specialisation developed by the individual campus during the past.
15.8.2. VISION The vision for the IMU is as follows:
“To achieve top ranking position among the Maritime Universities of the world in providing quality education, research and training
and to develop top class quality human resource needed for the maritime sector.”
15.8.3. MISSION:
(i) To provide higher end educational courses needed for the entire maritime sector with a view to transform the Indian maritime industry to achieve excellence; and
(ii) To develop top class marine personnel to man the ships and
marine crafts; and (iii) To undertake research in all disciplines to promote institution-
industry interface and to provide the Government in matters of maritime policy and technology.
15.8.4. PRESENT STATUS
IMU Headquarters
(i) IMU Headquarters is located at Chennai and presently functions
from the erstwhile National Maritime Academy premises. MBA Programmes in Port and Shipping Management and
International Transportation and Logistics Management are being offered by IMU Headquarters.
341
(ii) The Government has acquired 300 acres of land for establishment of the IMU Headquarters and the National
Maritime Complex. Out of this, 106 acres of land have been initially allotted for development of the IMU Headquarters.
(iii) Development of infrastructure and construction of the required
facilities are in progress.
IMU Mumbai Campus:
(i) IMU Mumbai campus is one of the oldest campuses of the University comprising the Training Ship Chankya, LBS CAMSAR
& MERI-Mumbai. (ii) T.S. Chanakya presently has more than 700 cadets. It is the
first institute in the country to have started degree programme course curriculum for those aspiring to become nautical officers
on-board ship. Ex-cadets of this institute have done very well both professionally and otherwise and are seen to be at the helm of affairs in the various segments of the industry.
(iii) Lal Bahadur Shastri College of Advanced Maritime Studies and
Research [LBSCAMSAR], which is rich in infrastructure including modern simulators, was started in 1949 and is dedicated to post-sea maritime education in India. More than
6,500 students pass out from this institute every year. (iv) Marine Engineering and Research Institute (MERI) Mumbai,
which is more than 50 years old, was inaugurated by the first Prime Minister of India and has produced finest of Marine
Engineers. Presently all around the globe ex-cadets of MERI are seen at the forefront in the marine and non-marine industry, having diverted their career in various fields including extreme
fields like space science, nuclear power, nano technology, etc. (v) The following programmes are offered at this Campus:
(a) T.S. Chanakya – DNS Programme and B.Sc. Nautical
Science; (b) LBS CAMSAR – Post-Sea Modular Courses; and (c) MERI-Mumbai – B.Sc. Maritime Studies and GME
1-year programme.
IMU Kolkata Campus:
(i) The erstwhile Indian Institute of Port Management and MERI-
Kolkata have been merged with the University to form the IMU Kolkata Campus. It is located in 33-acre land with the required

342
infrastructure such as academic blocks, laboratories, simulators, a small Training Vessel TS Bhopal, workshops, etc.
(ii) B.E. in Marine Engineering, Diploma in Nautical Science (DNS)
leading to award of B.Sc. degree in Nautical Science, Post-Graduate Diploma courses on Export-Import Management, Port & Shipping Management, Logistics & Supply Chain
Management, Pre-Sea and Post-Sea Courses, and short-term management development programmes are being offered currently at IMU Kolkata Campus.
IMU Visakhapatnam Campus:
(i) IMU Visakhapatnam Campus (erstwhile National Ship Design
and Research Centre) is located in a 5-acre land with
infrastructure facilities such as class rooms, library, computing facility and drawing hall and also student accommodation. IMU
Visakhapatnam Campus has also been allotted 102 acres of land by the Government of Andhra Pradesh in the Sabbavaram Mandal which is about 35 km from the present location. The
site allotted is a part of an identified academic complex earmarked for a Central University, a Law university, etc.
(ii) IMU Visakhapatnam Campus, is presently having two Schools – School of Naval Architecture and Ocean Engineering and School
of Maritime Design and Research. The School of Naval Architecture and Ocean Engineering offers a B.Tech programme and an M.Tech programme in Naval Architecture and Ocean
Engineering in Visakhapatnam Campus. IMU Chennai Campus:
(i) The erstwhile National Maritime Academy forms the Chennai
Campus of the IMU, which is located in 20 acres of land with custom-built facilities for conducting educational and training courses. It is a self-contained campus with required
infrastructure for providing academic and training programmes, and support facilities such as playground, swimming pool,
residential quarters for faculties and students. (ii) The IMU Chennai Campus offers the following programmes:
(a) Diploma in Nautical Science (DNS) leading to award of
B.Sc. degree in Nautical Science;
(b) B.Tech., in Marine Engineering; (c) Modular Courses for seafaring personnel;
(d) Competency courses for seafaring personnel; and (e) Short term training courses for port personnel.
343
IMU Cochin Campus:
This is a campus newly started from the academic year 2009- 10. It is at present functioning from the premises given by the
Cochin Port Trust. Construction of academic facilities and renovation of the Cochin Port Trust building for hostel is under progress. The Campus is currently offering the following courses :
(a) Diploma in Nautical Science (DNS) leading to award of B.Sc degree
(b) B.Sc in Shipbuilding and Repair (c) MBA in Port & Shipping Managmeent (d) PG Diploma in Marine Engineering
15.8.5. APPROACH While the campuses of the IMU at places other than Cochin are
the erstwhile maritime institutes/academies functioning earlier, the Cochin campus is newly formed during 2009-10. Hence, the four
Campuses other than Cochin were already conducting various courses both short term and long term in various maritime disciplines. Through the delivery of these courses, a good degree of
expertise had already been developed on specific areas chosen by these institutions during the past period. Hence, it is prudent to take advantage of it and build further on.
A review of programmes conducted and activities carried out
by these Campuses indicate that the specialisation could be on the following areas shown against each of the campuses.
Mumbai - Nautical Science, Business School; Kolkata - Marine Engineering, Inland Water Transport;
Visakhapatnam - Naval Architecture, Ship Design, Ocean Engineering and Technology; and
Chennai - Nautical Science, Marine Engineering, Port &
Shipping Management (Business School). The Cochin Campus was started with the introduction of
Diploma in Nautical Science leading to B.Sc., Nautical Science course. During the academic year 2010-11, B.Sc., in Ship Building
and Repairs, MBA in Port and Shipping Management and Post Graduate Diploma in Marine Engineering had been commenced.
The Headquarters started with two MBA programmes in Port and Shipping and International Transportation and Logistics.
Based on this status, the approach to draw up the future plan for IMU will be on the following lines.
344
(i) The Campuses will vertically integrate courses in the areas where they are strong (as indicated above)
(ii) The Campuses will continue to run lower end courses.
(iii) The headquarters will offer mostly higher end courses (Master
Degree) and research in all disciplines progressively.
(iv) Higher end courses in Campuses will also be replicated based on need and specialisation of the particular campus.
(v) Training in specialised areas and consultancy work can be promoted in Headquarters and all Campuses.
(vi) The infrastructure required will be created for conduct of the programmes and research to achieve quality and to move towards the vision.
(vii) Conforming to challenging standards expected by contemporary technology-driven organisations.
(viii) Undertake research in all disciplines to promote industry-institution interface.
(ix) Establish additional campuses or centres in maritime states of
India or overseas based on the need
(x) Have joint academic programmes with institutions of excellence in India and abroad.
15.8.6. PROPOSED PROJECTS AND FINANCIAL PROJECTIONS
IMU headquarters
As a policy, it is proposed to conduct only the Masters‟ Degree programmes at the Headquarters and also to undertake research
activities in various disciplines. The following programmes had been slated under the Headquarters as per the projection made to the EFC:
(i) M.Sc., in Maritime Affairs; (ii) M.Tech. in Marine Technology;
(iii) M.B.A. in Port & Shipping Management; and (iv) M.B.A. in International Transportation & Logistics
Management.
As per the projection indicated, the Headquarters will offer more number of Masters‟ Degree programme in Marine Engineering,
Port & Shipping, Maritime Law, Business School, and Marine Science. Accordingly, the following programmes are planned for the
Perspective Plan period.

345
(i) M.Tech. in Marine Technology;
(ii) M.Tech. in Dredging & Offshore Engineering; (iii) M.Tech. in Marine Environment;
(iv) M.Tech. in Harbour Engineering; (v) M.Sc. in Maritime Safety and Environment
Administration;
(vi) M.Sc. in Maritime Policy; (vii) M.L. in Maritime Law; (viii) M.Sc. in Marine Biology;
(ix) M.Sc. in Marine Biotechnology; (x) M.Sc. in Oceanography;
(xi) M.B.A. in Shipping Finance; and (xii) M.B.A. in Shipping Operation.
The additional requirements towards infrastructure for conducting these additional programmes have been projected and
given in para 8.7. IMU Mumbai Campus
The Mumbai Campus has planned the following additional programmes to be offered during the Perspective Plan period:
(i) E-M.B.A. programme;
(ii) M.Tech. in Marine Engineering; and (iii) M.Sc. in Nautical Science;
The requirement of infrastructure for organising these new programmes and also for replacement of the existing simulators, training equipment, etc., and the capital cost requirement have been
estimated. In addition, the cost of replacement of furniture, office equipment, etc., are also included in the requirement. Details of this
requirement are given in para 8.7 below. IMU Kolkata Campus
In addition to the programmes being currently offered in the
Kolkata Campus, the following new programmes have been planned during the Perspective Plan period:
(i) M.Tech. in Marine Engineering;
(ii) M.B.A. in Port & Shipping Management; (iii) M.B.A. in International Transportation & Logistics
Management;
(iv) B.Sc. Dredging; (v) Marine Engineering for Graduate Engineers;
(vi) Marine Engineering for Diploma Engineers; and (vii) M.Tech. in Marine Communication.
346
The additional requirements towards infrastructure for conducting
these additional programmes have been projected and given in para 8.7 below.
IMU Visakhapatnam Campus
In addition to the programmes being currently offered in the Visakhapatnam Campus, the following new programmes have been planned during the Perspective Plan period:
(i) M.B.A. in Shipping Operation; (ii) M.Sc. in Maritime Safety and Environment;
(iii) M.L. in Maritime Law; (iv) M.Tech. in Naval Architecture & Shipbuilding; (v) B.Tech. in Ship Production & Technology; and
(vi) B.Sc. in Inland Waterways.
The additional requirements towards infrastructure for conducting these additional programmes have been projected and given in para 8.7 below.
IMU Chennai Campus
In addition to the programmes being currently offered in the Chennai Campus, the following new programmes have been planned during the
Perspective Plan period: (i) B.Tech. in Dredging & Offshore Engineering; (ii) B.Tech. in Marine Environment;
(iii) B.Tech. in Harbour Engineering; (iv) B.Sc. in Marine Science; and (v) B.Sc. in Nautical Science.
The additional requirements towards infrastructure for
conducting these additional programmes have been projected and given in para 8.7 below.
IMU Cochin Campus
The Cochin Campus will provide courses in shipping, maritime law, naval architecture and inland waterways, in addition to the courses currently offered. The following programmes are planned:
(i) M.B.A. in Shipping Operation; (ii) M.Sc. in Maritime Safety and Environment; (iii) M.L. in Maritime Law;
(iv) M.Tech. in Naval Architecture and Shipbuilding; (v) B.Tech. in Ship Production Technology; and
(vi) B.Sc. in Inland Waterways.
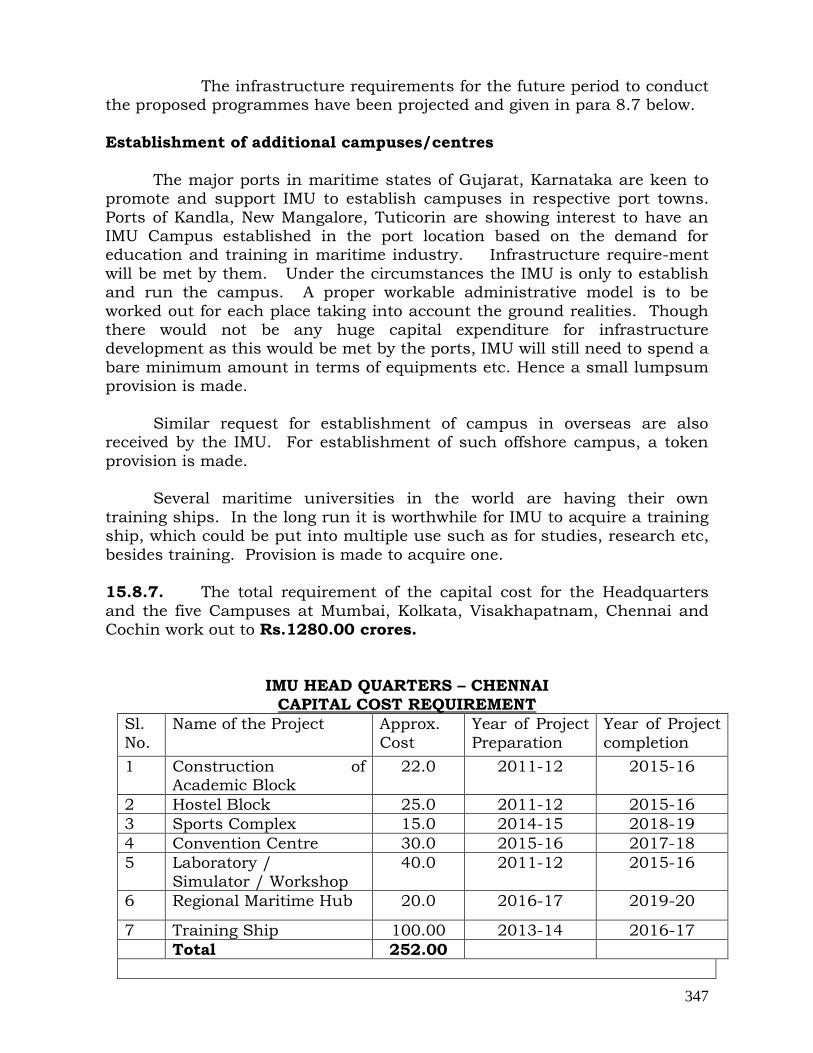
347
The infrastructure requirements for the future period to conduct the proposed programmes have been projected and given in para 8.7 below.
Establishment of additional campuses/centres
The major ports in maritime states of Gujarat, Karnataka are keen to promote and support IMU to establish campuses in respective port towns.
Ports of Kandla, New Mangalore, Tuticorin are showing interest to have an IMU Campus established in the port location based on the demand for education and training in maritime industry. Infrastructure require-ment
will be met by them. Under the circumstances the IMU is only to establish and run the campus. A proper workable administrative model is to be
worked out for each place taking into account the ground realities. Though there would not be any huge capital expenditure for infrastructure development as this would be met by the ports, IMU will still need to spend a
bare minimum amount in terms of equipments etc. Hence a small lumpsum provision is made.
Similar request for establishment of campus in overseas are also received by the IMU. For establishment of such offshore campus, a token
provision is made. Several maritime universities in the world are having their own
training ships. In the long run it is worthwhile for IMU to acquire a training ship, which could be put into multiple use such as for studies, research etc,
besides training. Provision is made to acquire one. 15.8.7. The total requirement of the capital cost for the Headquarters
and the five Campuses at Mumbai, Kolkata, Visakhapatnam, Chennai and Cochin work out to Rs.1280.00 crores.
IMU HEAD QUARTERS – CHENNAI
CAPITAL COST REQUIREMENT
Sl.
No.
Name of the Project Approx.
Cost
Year of Project
Preparation
Year of Project
completion
1 Construction of Academic Block
22.0 2011-12 2015-16
2 Hostel Block 25.0 2011-12 2015-16
3 Sports Complex 15.0 2014-15 2018-19
4 Convention Centre 30.0 2015-16 2017-18
5 Laboratory /
Simulator / Workshop
40.0 2011-12 2015-16
6 Regional Maritime Hub 20.0 2016-17 2019-20
7 Training Ship 100.00 2013-14 2016-17
Total 252.00

348
IMU KOLKATA CAMPUS
1 Construction of Academic Block
30 2011-12 2015-16
2 Construction of Hostel Block
25 2011-12 2015-16
3 Simulators 10 2011-12 2015-16
4 Laboratories 10 2013-14 2015-16
5 Towing Tank 20 2016-17 2019-20
6 Renovation,
replacement
30 2016-17 2019-20
7 Provision for acquiring
additional land of 50 acres
200 2013-14 2015-16
Total 325
IMU MUMBAI CAMPUS
Sl. No.
Name of the Project Approx. Cost
Year of Project Preparation
Year of Project completion
1 Replacement of
Simulators
20.0 2011-12 2013-14
2 Auditorium 10.0 2011-12 2013-14
3 Seaside Wall and jetty 3.0 2016-17 2016-17
4 Office cum Training
Equipment
10.0 2013-14 2017-18
5 Towing Tank, Model
Test Basin Caviation Tunnel, Fatigue Testing Flume Tank
20.0 2017-18 2019-20
6 New Hostel – TSC New Hostel – LBS
20 20
2015-16 2914-15
2016-17 2015-17
7 Residential Quarters 15.0 2018-19 2019-20
8 Furniture 10.0 2013-14 2019-20
9 Working diesel engine,
Alternator, Training Ship, Sailing
Boat/Yacht
8.0 2014-15 2017-18
10 Renovation & Replacements
30.0 2013-14 2019-20
11. Additional land and development
50.0 2012-13 2014-15
Total 216

349
IMU VISAKHAPATNAM CAMPUS
Sl.
No.
Name of the Project Approx.
Cost
Year of Project
Preparation
Year of
Project completion
1 Towing Tank with shallow water facility and Wavemaker
15.0 2011-12 2014-15
2 Circulating Water Channel with motor
and impeller and visual chamber
5.0 2011-12 2014-15
3 Ship Structural Laboratory
5.0 2011-12 2014-15
4 Dredging Simulator 12.0 2014-15 2017-18
5 Ship Machinery
Laboratory
6.0 2014-15 2017-18
6 Construction of Academic Blocks
Construction of Hostel Blocks
30.0 30.0
2015-16 2019-20
7 Renovation of Existing Buildings
2.0 2017-18 2019-20
8 Library Facilities 1.0 2013-14 2015-16
9 Additional land and
development
17 2012-13 1014-15
Total 123
IMU CHENNAI CAMPUS
1 Construction of Academic Block
28.0 2011-12 2015-16
2 Construction of Hostel Block
32.0 2011-12 2015-16
3 Towing Tank 20.0 2015-16 2017-18
4 Workshop 10.0 2016-17 2018-19
5 Laboratories 10.0 2011-12 2015-16
6 Simulators 10.0 2017-18 2019-20
Total 110.0

350
IMU COCHIN CAMPUS
Sl. No.
Name of the Project Approx. Cost
Year of Project Preparation
Year of Project
completion
1 Construction of Administrative &
Academic Blocks
20.0 2011-12 2014-15
2 Construction of
Marine Workshop
5.0 2011-12 2013-14
3 Setting up of full mission Engine
Simulator
5.0 2011-12 2013-14
4 Construction of
Swimming pool
5.0 2014-15 2014-15
5 Construction of Gents
Hostel and Guest House
10.0 2014-15 2014-15
6 Development of Simulator Centre for various simulators
10.0 2015-16 2015-16
7 Construction of Ladies Hostel
10.0 2015-16 2015-16
8 Development of Laboratories for all
Branches of Studies
10.0 2015-16 2015-16
9 Construction of
Auditorium
10.0 2016-17 2016-17
10 Construction of
Towing Tank for model testing
20.0 2017-18 2017-18
11 Setting up of full
mission Ship Handling Simulator
5.0 2018-19 2018-19
12 Construction of Additional Academic
& Administrative Building/Hostel
30.0 2018-19 2019-20
13 Construction of
Boundary Wall
15.0 2018-19 2019-20
14 Library facilities & IT
facilities
10.0 2012-13 2015-16
15 Campus development
and improvement
10.0 2012-13 2019-20
16. Additional Land &
Development
100.00 2012-13 2014-15
Total 204.00

351
ESTABLISHMENT OF ADDITIONAL CAMPUSES
Sl. No.
Name of the Project Approx. Cost
Year of Project Preparation
Year of Project
completion
I WITHIN INDIA
1.
2.
3.
4.
5. 6.
Establishment of
campus at Kandla Establishment of campus at New
Mangalore Establishment of campus at Tuticorin
Establishment of Campus at Goa
Establishment of Campus at Paradip Establishment of
Campus at Andaman
5.0
5.0
5.0
5.0
5.0
5.0
2010-11
2011-12
2011-12
2011-12
2011-12
2011-12
2011-12
2012-13
2012-13
2012-13
2012-13
2011-12
II OVERSEAS
1. 2.
Establishment of campus at Malaysia Establishment of
Campus at African/Arab region
10.0
10.0
2010-11
2012-13
2011-12
2014-15
TOTAL 45
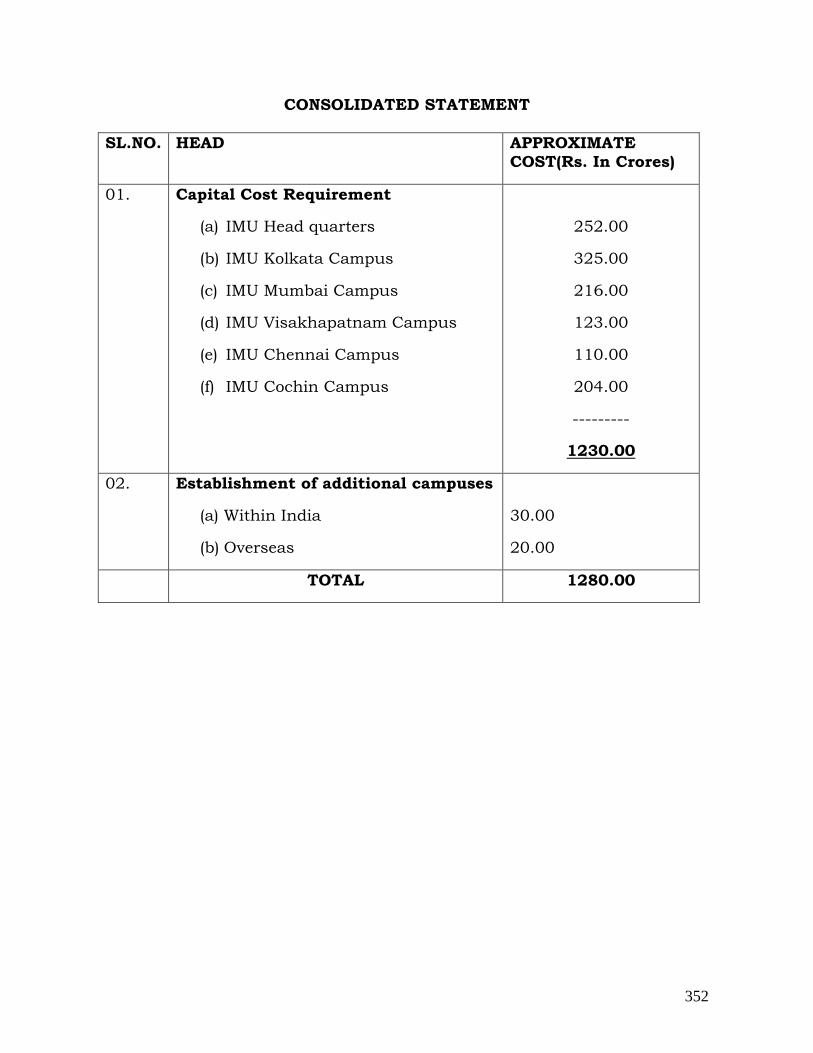
352
CONSOLIDATED STATEMENT
SL.NO. HEAD APPROXIMATE
COST(Rs. In Crores)
01. Capital Cost Requirement
(a) IMU Head quarters
(b) IMU Kolkata Campus
(c) IMU Mumbai Campus
(d) IMU Visakhapatnam Campus
(e) IMU Chennai Campus
(f) IMU Cochin Campus
252.00
325.00
216.00
123.00
110.00
204.00
---------
1230.00
02. Establishment of additional campuses
(a) Within India
(b) Overseas
30.00
20.00
TOTAL 1280.00
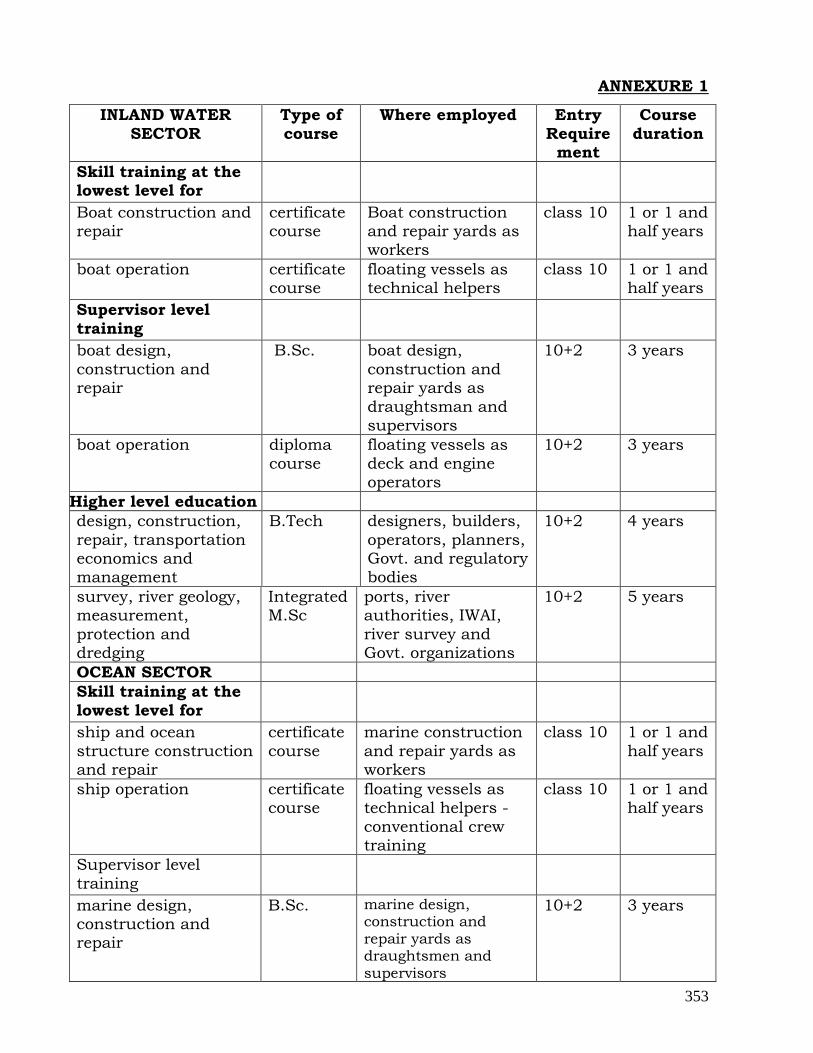
353
ANNEXURE 1
INLAND WATER
SECTOR
Type of
course
Where employed Entry
Requirement
Course
duration
Skill training at the lowest level for
Boat construction and repair
certificate course
Boat construction and repair yards as workers
class 10 1 or 1 and half years
boat operation certificate course
floating vessels as technical helpers
class 10 1 or 1 and half years
Supervisor level
training
boat design,
construction and repair
B.Sc. boat design,
construction and repair yards as
draughtsman and supervisors
10+2 3 years
boat operation diploma
course
floating vessels as
deck and engine operators
10+2 3 years
Higher level education
design, construction,
repair, transportation economics and management
B.Tech designers, builders,
operators, planners, Govt. and regulatory bodies
10+2 4 years
survey, river geology, measurement,
protection and dredging
Integrated M.Sc
ports, river authorities, IWAI,
river survey and Govt. organizations
10+2 5 years
OCEAN SECTOR
Skill training at the
lowest level for
ship and ocean
structure construction and repair
certificate
course
marine construction
and repair yards as workers
class 10 1 or 1 and
half years
ship operation certificate course
floating vessels as technical helpers -
conventional crew training
class 10 1 or 1 and half years
Supervisor level
training
marine design, construction and repair
B.Sc. marine design, construction and repair yards as draughtsmen and supervisors
10+2 3 years

354
ship operation diploma
course or DNS
floating vessels as
deck side trainees
10+2 1 or 1 and
half years
ship operation diploma
course in Marine engineeri
ng
floating vessels as
marine trainees
10 3 years
Higher level
education
Naval architecture and ocean engineering
B.Tech designers, builders, operators, planners, Govt. and regulatory
bodies
10+2 4 years
Marine engineering B.Tech operating engineers
in ships and offshore installations
10+2 4 years
Nautical Technology B.Tech (modified polyvalent
program) emphasis on offshore
operation
10+2 4 years
Nautical Science B.Sc. operating nautical
officers in ships and offshore installations
10+2 3 years
Marine technology
(marine engines and systems design and construction)
B.Tech designers, builders,
operators, planners, Govt. and regulatory bodies
10+2 4 years
Naval architecture for Indian Navy
B.Sc. Indian Navy (sponsored program)
10+2 3 years
Naval architecture for
Indian Navy
B.Tech Indian Navy
(sponsored program)
10+2 4 years
Ocean Electrical and electronics and communications
B.Tech ancillary industries, consultants, Indian navy, govt. bodies
10+2 4 years
Other 3 and 4 year degree programs such
as marine environmental engineering, marine
quality control etc. could be taken up
based on demand requirement.

355
POST GRADUATE
EDUCATION
Shipping Management Masters
in Ship management
shipping and related
companies and govt.
B.Sc/
M.Sc/ B.Tech
2 years
Transportation logistics
Masters in
transportation
logistics
shipping and related companies,
transportation planners and govt.
B.Sc/ M.Sc/
B.Tech
2 years
Maritime law Masters in
Maritime law
shipping and related companies,
transportation planners and govt.
and private practice
LLB 2 years
Naval architecture
and ocean engineering
M.Tech designers, builders,
operators, planners, Govt. and regulatory bodies, Research
institutes
B.Tech 2 years
Marine technology M.Tech designers, builders,
operators, planners, Govt. and regulatory bodies, Research
institutes
B.Tech 2 years
Naval architecture for
Indian Navy
M.Tech Indian Navy and
naval shipbuilding and repair yards
B.Tech 2 years
Ocean Electrical and electronics and communications
M.Tech ancillary industries, consultants, Indian navy, govt. bodies
B.Tech 2 years
Shipbuilding Management
M.Tech designers, builders, operators, planners,
Govt. and regulatory bodies, Research
institutes
B.Tech 2 years
Dredging and harbour engineering
M.Tech coastal ZM organization,
consultants, ports, govt, and regulators
B.Tech 2 years
Ports and Infrastructure
development and management
M.Tech coastal ZM organization,
consultants, ports, govt, and regulators
B.Tech 2 years
SubSea Technology M.Tech Indian navy, R&D organizations, Offshore organizations
B.Tech 3 years
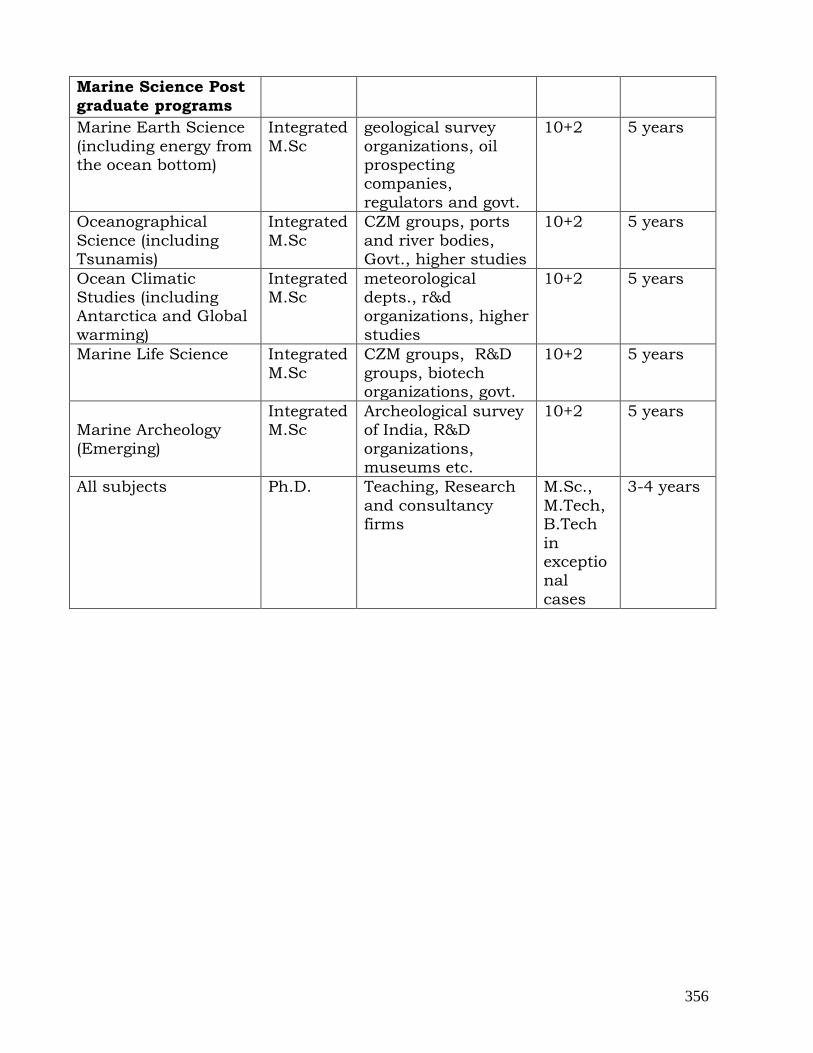
356
Marine Science Post
graduate programs
Marine Earth Science
(including energy from the ocean bottom)
Integrated
M.Sc
geological survey
organizations, oil prospecting companies,
regulators and govt.
10+2 5 years
Oceanographical
Science (including Tsunamis)
Integrated
M.Sc
CZM groups, ports
and river bodies, Govt., higher studies
10+2 5 years
Ocean Climatic Studies (including Antarctica and Global
warming)
Integrated M.Sc
meteorological depts., r&d organizations, higher
studies
10+2 5 years
Marine Life Science Integrated
M.Sc
CZM groups, R&D
groups, biotech organizations, govt.
10+2 5 years
Marine Archeology
(Emerging)
Integrated M.Sc
Archeological survey of India, R&D
organizations, museums etc.
10+2 5 years
All subjects Ph.D. Teaching, Research
and consultancy firms
M.Sc.,
M.Tech, B.Tech
in exceptional
cases
3-4 years
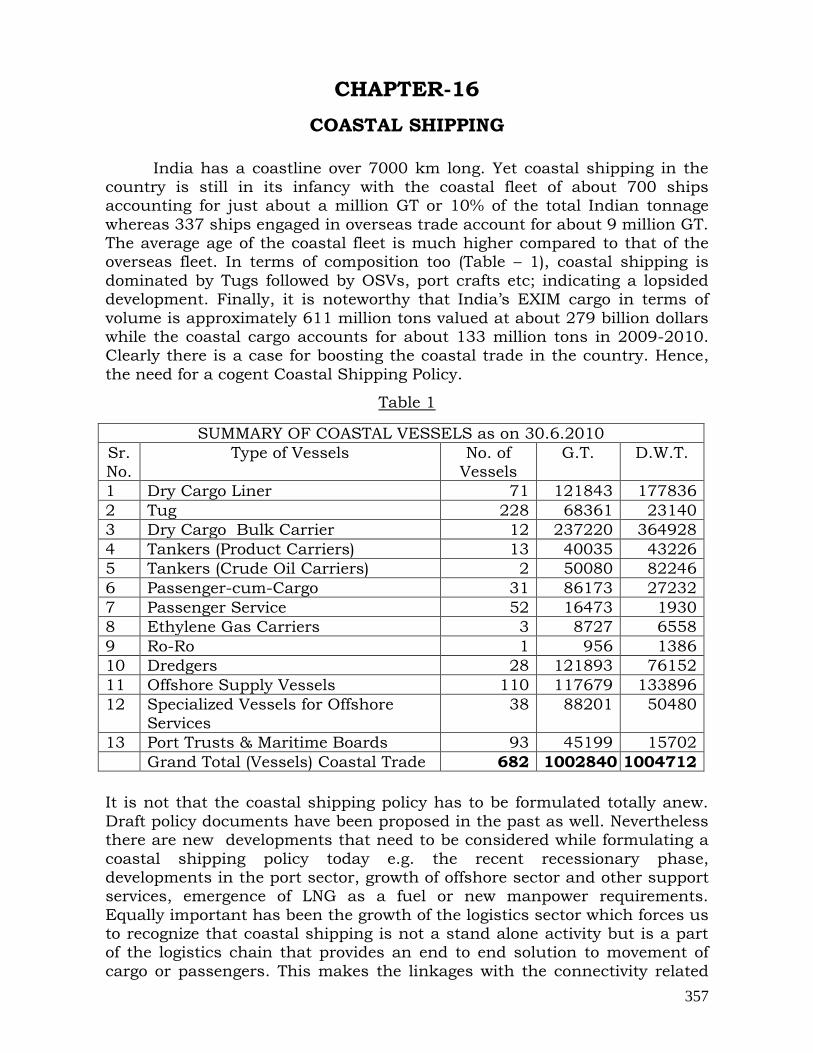
357
CHAPTER-16
COASTAL SHIPPING
India has a coastline over 7000 km long. Yet coastal shipping in the country is still in its infancy with the coastal fleet of about 700 ships accounting for just about a million GT or 10% of the total Indian tonnage
whereas 337 ships engaged in overseas trade account for about 9 million GT. The average age of the coastal fleet is much higher compared to that of the overseas fleet. In terms of composition too (Table – 1), coastal shipping is
dominated by Tugs followed by OSVs, port crafts etc; indicating a lopsided development. Finally, it is noteworthy that India‟s EXIM cargo in terms of
volume is approximately 611 million tons valued at about 279 billion dollars while the coastal cargo accounts for about 133 million tons in 2009-2010. Clearly there is a case for boosting the coastal trade in the country. Hence,
the need for a cogent Coastal Shipping Policy.
Table 1
SUMMARY OF COASTAL VESSELS as on 30.6.2010
Sr.
No.
Type of Vessels No. of
Vessels
G.T. D.W.T.
1 Dry Cargo Liner 71 121843 177836
2 Tug 228 68361 23140
3 Dry Cargo Bulk Carrier 12 237220 364928
4 Tankers (Product Carriers) 13 40035 43226
5 Tankers (Crude Oil Carriers) 2 50080 82246
6 Passenger-cum-Cargo 31 86173 27232
7 Passenger Service 52 16473 1930
8 Ethylene Gas Carriers 3 8727 6558
9 Ro-Ro 1 956 1386
10 Dredgers 28 121893 76152
11 Offshore Supply Vessels 110 117679 133896
12 Specialized Vessels for Offshore
Services
38 88201 50480
13 Port Trusts & Maritime Boards 93 45199 15702
Grand Total (Vessels) Coastal Trade 682 1002840 1004712
It is not that the coastal shipping policy has to be formulated totally anew.
Draft policy documents have been proposed in the past as well. Nevertheless there are new developments that need to be considered while formulating a
coastal shipping policy today e.g. the recent recessionary phase, developments in the port sector, growth of offshore sector and other support services, emergence of LNG as a fuel or new manpower requirements.
Equally important has been the growth of the logistics sector which forces us to recognize that coastal shipping is not a stand alone activity but is a part of the logistics chain that provides an end to end solution to movement of
cargo or passengers. This makes the linkages with the connectivity related
358
infrastructure, including the inland water transport, the road connectivity and the rail-head availability, critical for development of coastal shipping. It
can no longer be viewed in isolation.
16.2. Another difficulty faced with many a policy recommendation is their distance from the actionable aspects. While a policy is not expected to look at micro details, it is important to set up certain goals and the time frame in
which these need to be achieved. This makes the policy statement effective in the long run. It is in this context that the following framework of 3X3 table or nine sub heads is proposed to categorize different components of the policy.
a. Ideas that can be implemented by a) the Directorate b) the Ministry
of Shipping and c) Ministries or other bodies outside the M/o Shipping.
b. Among these, ideas that can be implemented a) within current financial year, b) current 5 year plan and c) the 12th plan or after.
16.3 At a different level, the draft policy should also aim to boost i) the coastal cargo, ii) coastal trade, iii) various support services as well as iv) the carriers. While suggesting various measures for this purpose, specific
attention is required to be paid to each of the four components of the coastal shipping i.e. IV (inland vessels), the RSV or the river-sea-vessels, the MS (Coastal-ships) as well as MS (Cross trade compatible). Otherwise promotion
of just one component, say, bulk cargo moved across the coast by large MS ships may mask other smaller components if disaggregated data are not
looked at. It will be necessary therefore that the policy should also suggest a set of Key Performance Indicators which should measure the growth of coastal shipping in each of its segment as well as for its overall growth.
16.4 Within the overall framework indicated above the policy measures can be formulated under following heads;
i. Promoting River-sea vessels
ii. Manning relaxation without compromising on the safety
iii. Financial incentives
iv. Infrastructural facilities
v. Modal shift in cargo from rail and road
vi. Legal issues
vii. Declaration of IV limits in different states
viii. Data-base and communication infrastructure
ix. Cabotage policy support

359
Policy measures suggested under these heads are listed below indicating clearly the level at which the task is to be carried out i.e. DGS,
MoS and MoF / Others and the time frame i.e. FY 2010-11, 11th FYP and 12th FYP or beyond
16.5 Promoting River Sea Vessels:
i. Finalising the RSV notification for type 1 to type 4 vessels (DGS, FY 2010-11)
ii. Facilitate smooth switching over between IV and RSV category on one hand and RSV and MS category on the other, as per the need of the
trade. (DGS, FY 2010-11)
iii. Create easy facility for e-notification of change of command, category of vessel and crew. (DGS, FY 2010-11)
iv. Consider extending the limit of 3000 GT / 3000KW further for RSVs, after examining the legal provisions in respect of NCV segment and
after re- assessment of the safety requirements for such category of MS coastal vessels. (DGS, 11th Plan)
v. Consider extending the scope of RSVs to other types of vessels such as oil tankers and other specialized vessels (DGS, 11th Plan).
16.6 Infrastructure:
a. Set up more minor ports along the coast, at least one port at a distance of every 100 kms. (MoS 11th & 12th Plan)
b. Setting up dedicated berths for coastal ships (MoS 11th & 12th Plan)
c. Promotion of Ro-Ro jetties (MoS 11th & 12th Plan)
d. Promoting repairing jetties (MoS 11th & 12th Plan)
e. LNG supply facilities (MoS 11th Plan)
f. Setup dedicated warehouses for coastal cargoes (MoS 11th Plan)
g. Setup rail and road connectivity at the ports to the nearest rail heads (MoS 11th & 12th Plan).
h. Set up adequate ship repair facility and dry-docks along the Indian coast for catering to the growth of coastal shipping (MoS 11th & 12th
Plan)
i. Deepening of sea channels at minor ports (MoS 11th & 12th Plan)
16.7 Financial incentives including subsidies:
a. Remove the lower limit of 80 M on ship – building subsidy in the new scheme proposed (MoS FY 2010-11).
b. Implement an aggressive ship-building subsidy policy with special
focus on coastal vessels, tugs, OSVs, etc (MoS FY 2010-11)

360
c. Include subsidy for LNG use facility both on retrofitting basis for existing ships and for new ships (MoS 11th & 12th Plan).
d. SRU status to individual ships (MoS FY 2011-12)
e. Subsidy for Ro-Ro jetties, repair jetties and a higher level of subsidy for a pair of jetties dedicated to coastal shipping (MoS 11th & 12th
Plan)
f. Tariff for coastal ships to be cheaper than those vessels which are on foreign run (MoS 11th Plan).
g. Delink port tariff for coastal vessels from FG vessels and reduce it further by 30% (MoS 11th Plan).
h. Waive service tax on costal/inland sea-freight as well as charter-hire of coastal/inland vessels (MoFin 11th Plan).
i. Establish a Coastal Development Fund for coastal ships. This fund
may be used for an interest subsidy scheme for acquisition of coastal ships (MoS 11th & 12th Plan).
j. All Indian ships should be granted the status of SRU thereby reducing
the cost of maintenance for coastal vessels (MoS 11th Plan).
k. Duty free bunkers to coastal vessels (MoFin 11th Plan).
l. Exemption of Customs Duty on import of certain categories of vessels (e.g. Tugs, Pusher Crafts, Dredgers and Floating Docks/Cranes/ Production Platforms etc) (MoFin 11th Plan).
m. Reduction/waiver of wharfage for coastal cargo (MoS 11th Plan)
n. Coastal vessels should be treated as movable infrastructure and
therefore granted such status for the purpose of ensuring competitive funding and fiscal benefits (MoFin 11th Plan).
o. Introduce fiscal incentives for building & operating small ports (upto 5 m draft) dedicated for coastal vessels (MoS under NMDP).
p. Confer “Declared Goods” status to bunkers being consumed by coastal/inland vessels (MoFin 11th Plan).
q. Introduce fiscal incentives, duty waivers and low-interest finance schemes for adopting “green technology – LNG powered vessels,
etc(MoS 11th Plan).
r. Exemption on tax for ship construction (MoFin 11th Plan)
16.8 Manpower issues including manning scales:
a. Upgrading of IV crew to RSV crew through bridge courses (DGS 11th Plan)

361
b. Permitting CoC (FG) holders of MS vessels to jump one level up in manning RSVs (DGS 11th Plan)
c. Permitting foreign CoC holders working on Indian coastal ships for a
specified period before permitting them to appear for Indian CoC examinations (DGS 11th Plan)
d. Establish a RSV cadre for officers-Master (RSV), Mate (RSV), 2nd Mate (RSV), MEO CI III (RSV-Ch. Engg), MEO CI IV (RSV) (DGS 11th Plan)
e. The courses & examinations for RSV cadre in order to source candidates
from I.V. CoC holders (DGS 11th Plan).
f. Candidates with certificates from ITI‟s should be allowed to work on coastal vessels with certain bridge courses (DGS 11th Plan).
16.9 Cabotage Policy Support
a. Absolute cabotage for coastal trade other than transhipped EXIM containers, including empty containers. (MoS FY 2010-11).
b. Restore the right to issue NOC to foreign flag vessels on coastal run to ICC instead of INSA. (DGS FY 2010-11).
c. Increase the Right-of-First-Refusal price band to 25% above the lowest foreign-bid (up from current 10%).(DGS FY 2010-11).
d. Promote RoR for BBCD vessels and India built vessels (Implemented).
16.10 Declaration of IV limits for different states
a. Declaration of smooth and partially smooth water limits (DGS FY 2011-12).
b. All maritime states to notify model IV rules for construction and survey
of IV vessels for operating in smooth and partially smooth waters (DGS FY 2011-12).
16.11 Promoting modal shift from road and rail to coastal shipping
a. Improve competitive ability of coastal ships and facilitate shifting of
cargo from road and rail to sea (MoS FY 2011-12).
b. A carbon credit scheme to be introduced with support from MoEF
(DGS FY 2011-12 and MoS).
16.12 Data base and communication infrastructure
a. Establish & maintain a robust system/database for collection of
accurate voyage specific data on coastal shipping (MoS, DGS &INSA FY 2010-11)
b. Coastal Association to publish annual report on coastal tonnage and coastal cargo and work towards a coastal index (INSA FY 2010-11)
362
c. Data on the quantum of coastal cargo at various ports (MoS, DGS & INSA FY 2010-11).
It is expected that these measures will provide a significant boost to coastal shipping in the country within a foreseeable future and the effects
can be measured using the key performance indicators suggested above. Readers are requested to suggest any further measures or elaborate the ones suggested here. A review of these measures every year is both necessary and
feasible and that will show us the progress made. If the policy document appears short on rhetoric and long on action the choice is deliberate and it is
expected to deliver in terms of concrete outcomes. Test of pudding is, as the saying goes, in its eating. We feel confident the draft policy will succeed on this score.

363
CHAPTER-17
AIDS TO NAVIGATION
17.1.1. GENESIS
From time immemorial, shipping has been one of the main arteries of International Commerce and Lighthouses have throughout been playing
their part as „Lamp posts of the Ocean‟.
The hymns of Rigveda and Satapatha Brahmana mention navigation in purva (east) and paschima (west) samundra. The Rig Veda describes sea voyages by Varuna and Vashistha. The rescue of „Manu’, the Indian Noah,
from a flood with a resurrection also reflects their knowledge of sea and navigation. Excavations relating to the Indus Valley civilization in 3000 B.C. revealed a period of maximum trade between India and Mesopotamia (Iraq)
from the period of Sargon of Akkad.
The dockyard excavated at Lothal on the sea plains of Saurashtra, SE of Mohenjo Daro, was a great brick basin of 220 m by 37 m with extant brick walls 4.6 m high. At one end was a spillway with a locking device. Here was
a dock where ships could be brought in from the nearby estuary via an artificial channel kept clear of silt by the controlled flow of water from the
spillway. Harappan cities in Sindh and the peninsula of Saurashtra were vital, thriving trade centres in ancient times, with the trade of beads, gems and valuable ornaments reaching the far corners of West Asia and Africa.
Pillars found along the coast of Gujarat during archeological excavations might be the marks of earliest aids to navigational structures.
In days bygone, when barges and country boats were the only craft
in vogue, the mariners were guided by burning heaps of wood or coal on the high pinnacles of rocks or mountains flanking the coastline. With the progressive adoption of improved sailing craft, the earlier lighthouses, viz.
the bonfires, were gradually replaced by large wick-burners and oil lamps and subsequently with state of the art high efficacy electrical lamps. False Point lighthouse located on the mouth of river Mahanadi near Paradeep,
Cuttack is one of the oldest operational lighthouses in India constructed and commissioned in 1838 during British period.
17.1.2 Pre-independence
(i) Prior to 1927 there was no uniform system of management of Lighthouse services in British India which included Myanmar,
Pakistan, Bangladesh and also various Princely States. As a first step to centralize the Administration of Lighthouses, the government decided to administer about 32 Lighthouses in the six Lighthouse
Districts viz. Aden, Karachi, Bombay, Madras, Calcutta and Rangoon.
364
The Lighthouse act was passed in 1927 and came into force in April 1929. However, after passing of the Act, the administration of
Lighthouses in Aden District was transferred to Her Majesty‟s Government in the U.K. The Government of India continued to
administer the Lighthouses in Persian Gulf financed from the Persian Gulf Lighting Services Fund.
(ii) As a result of reforms introduced, Burma (Myanmar) was separated out from rest of India. But Government of India continued to administer the General Lighthouses in Burma under the terms of an
introductory agreement between two Governments.
(iii) During the World War II, the activities of the Directorate were very limited as several Lighthouses had to be doused in order to prevent the enemies from making use of them.
(iv) At the time of Independence, administration of only 17 general
lighthouses was vested with the Government of India. Administration of another 50 lighthouses was taken over from the Princely/Maritime sates as a part of federal financial implication. (Annexure-1).
17.1.3 Post-independence
(i) After independence, the Karachi district and Lighthouses presently in Bangladesh were separated out. Thus the Directorate was left with
three Districts with their Headquarters at Calcutta (Kolkata), Madras (Chennai) & Bombay (Mumbai). About 51 Lighthouses, which were earlier under the jurisdictions of Maritime Princely States, became
direct responsibility of the Central Government since 1950, resulting in creation of Saurastra & Kachchh (now Jamnagar Lighthouse Distt). In sixties, two new Lighthouse districts at Port Blair (1960-61) and
Cochin (1969-70) were established. One more Lighthouse district at Visakhapatnam has been set up in the year 2001 for better
management and administration of the Aids to Navigation along the coast of Andhra Pradesh.
(ii) In order to cope with developmental activities, post independence, the Lighthouse Department which was under the Ministry of Commerce
and later part of Directorate General of Shipping, was re-constituted into a separate Department as the Department of Lighthouses & Lightships under the Ministry of Transport. It was again renamed in
the year 2002 as Directorate General of Lighthouses and Lightships under the Ministry of Surface Transport - now Ministry of Shipping.
(iii) The present inventory of the Directorate has 289 Aids to Navigation Set up covering visual and radio aids along the entire Indian Coastline
including the Andaman & Nicobar & Lakshadweep Islands. (Annexure-1).

365
17.2 ROLE OF DGLL
17.2.1 IMO Resolution A 860(20) defines navigation as “the process of
planning, recording and controlling the movement of a craft from one place to another”. National authority of each signatory country is required to assist in this task for safe navigation. Directorate General
of Lighthouses and Lightships (DGLL), being the national authority have been endeavoring in this task by providing mix of aids to marine navigation, be it visual or radio, in and around the coastal waters of
India stretching over 7517 km. The Directorate is headed by the Director General for the purpose of administration and management of
Lighthouses. This ATON service is established and delivered to the recognized standards set by the International Association of Marine Aids to Navigation and Lighthouse Authorities so as to meet the
responsibilities of the Government of India under the International Maritime Organization (IMO) Safety of Life at Sea Convention (SOLAS)
1974, as amended. 17.2.2 The term “Lighthouse” represents all Aids to Marine Navigation
including Light Vessels, used for the guidance and safe passage of ship. There are two categories of Aids to Marine Navigation namely “General” and “Local” as defined in the Lighthouse Act, 1927. The
„General‟ Lighthouses are those, which the Central Government may by notification in the Official Gazette, declare to be General Lighthouse
and it generally caters to the needs of navigation outside ports limit. The superintendence and management of “General” Aids to Navigation is vested in the Directorate General of Lighthouses and Lightships.
“Local” lighthouses are those, which are established at the entrance of Ports/Harbours by local authorities like State Govt/Port Trusts to
enable smooth passage to the vessels entering/leaving ports. The management of Local Lighthouses is the responsibility of the State Maritime Board, Port Trusts, etc.
17.2.3. A statutory body of Advisory Nature has been provided under the Lighthouse Act called the Central Advisory Committee for Lighthouses
(CACL). Representatives of Shipping, Sailing Vessels Association, Chambers of Commerce, etc are nominated to this committee. It has 15 members with Secretary, Ministry of Shipping as its ex-officio
Chairman and the Director General of Lighthouses & Lightships as its member secretary. The committee advises the Government on matters
relating to the establishment, maintenance, removal and various activities pertaining to lighthouses and meets at least once in a year. The Committee is constituted after every two years.

366
17.3 MARITIME AGENDA - AIDS TO NAVIGATION AND COASTAL SECURITY - DGLL’S ROLE
17.3.1 Of late, with the changing security perspective, particularly post
26/11, the role of DGLL has gone sea change where lighthouses due to its even geographical spread and availability of technical
manpower have been identified for establishment of Radar, AIS, Optical Sensors to thwart any future eventuality from sea. Accordingly projects related with the issue are included in the
perspective plan.
17.3.2 Further the hitherto role of DGLL in providing passive aid has also undergone change with introduction of interactive aids to navigation
like Vessel Traffic Service.
17.3.3 DGLL has taken up the improvement of local aids to navigation to
bring them at par with international standard where in DGLL has been continuously interacting with the maritime states. The proposed implementation of National AIS Network along the Indian
Coast Line and establishment of static sensors by the MOD (Coast Guard) utilizing the existing infrastructure of the DGLL and
operational staff has also resulted in major changes in the operational and advisory role of the DGLL.
17.3.4 The role of the DGLL in effective auditing and making ensuring fail
free operation of all aids to marine navigation facilities under the state authorities is an important requirement for which necessary
mechanism has to be introduced. Similar to the functioning of the Apart from the role of DGLL envisaged in NSPC in case of upcoming minor ports, a larger regulatory role of DGLL as per the provisions of
the Lighthouse Act in effective monitoring of aids to navigation facilities in minor ports / non-major ports is required to be outlined.
17.3.5 DGLL is providing general aids to marine navigation catering to the navigational safety of ships entering and transiting in general
waters, whereas the jurisdiction of maritime boards are to cater to the navigational need within port limits. However in the adjoining waters there is duality of jurisdiction resulting in confusion, erosion
of federal authority and increased cost on trade. With the development of coastal VTS and chain of AIS base stations which
will enhance the safety aspects manifold being established by DGLL, there is a necessity to clearly define the jurisdiction/area of operation of the maritime boards to avoid confusion.
17.3.6 Real-Time Kinematic (RTK) system - a technology which is most suitable for measuring tidal and current variations in real time can be technically and economically exploited in berth to berth
navigation and carrying of extra cargo. DGLL proposes to establish
367
the system in the Gulf of Khambhat and the Gulf of Kachchh where tidal and current variations are quite appreciable.
17.3.7 Aids to Marine Navigation are established at the locations which facilitates easy detection by the mariners and thereby these
locations generally are isolated and far flung where utilization of fossil fuels like diesel are maximum. The Directorate has embarked into a policy of utilization of solar and wind energy so that
consumption of diesel are almost zero. Efforts will also be made to explore the possibility of wave/tidal energy at some critical applications like buoy.
17.3.8 Aids to navigation stations are located at far flung areas generally not approachable easily, especially in remote islands. All radio aids
are operational round the clock. To know the functional status of the ATON station the Directorate has incorporated SCADA (Supervisory Control and Data Acquisition) system to monitor its
functioning, which will be fully operational by 2012. The DGLL will be in a position to directly monitor the status of each and every Aids
to navigation stations instantly and take corrective measures. In past 60 years the number of lighthouses have increased from 67 to 179 in addition to 22 numbers deep sea channel marking buoys
and establishment of number of Radio aids viz DGPS, AIS & VTS. For trouble shooting and to maintain the operational efficiency to the highest standard, it is necessary to improve the quality &
quantity of human resources, improve mobility and upgraded infrastructure.
17.3.8.1 Human resource: For increasing the quality manpower and management capabilities there is a great need for restructuring the cadre to an organized service and upgrading the post of Director
General. With the introduction of high end technology like Coast Guard Static Sensor, AIS and other ancillary equipment like wind
generators, etc at Lighthouses, the quality and quantity of manpower need to be appropriately addressed. Conducting periodical workshops on operations and developments of Aids to
Navigation based on IALA guidelines, to train personnel from state maritime boards as well as from various ports is envisaged.
17.3.8.2 Mobility: Apart from improving road mobility for timely attention to aids to navigation, better mobility by sea is envisaged by acquiring modern lighthouse tender vessels/launches. Heli-deck
in such vessels will further help in timely approach to remote islands for operational need as well as for disaster management and welfare of staff.
17.3.8.3 Infrastructure: Modernizing the head quarter office at Noida and all the regional offices by providing latest facilities like e-

368
governance, video conferencing, etc in order to establish national data center / control centers.
17.4 BEAUTIFICATION OF LIGHTHOUSES The cultural heritage of lighthouses extends beyond the
architectural value of the buildings, to the whole area of maritime traditions and history, including shipping trading patterns, navigational safety and wrecks. This needs to be preserved and
evidence documented for the benefit of future generations. The many Lighthouse Authorities World over like UK, Spain, Sweden,
South Africa have identified number of heritage lighthouses and are managing them. Identifying heritage Lighthouses in the country and to preserving them for posterity is proposed to be done shortly.
Lighthouses have also great tourism potential. Developing tourism in select lighthouses is envisaged.
17.5 DGLL ROLE WITH INTERNATIONAL ASSOCIATION
17.5.1 DGLL role in the International Association of Marine Aids to Navigation and Light house Authorities IALA has appreciably
increased due to DGLL involvement in number of high end projects in India like VTS, AIS, Navtex, etc.
17.5.2 The International Association of Marine Aids to Navigation and
Lighthouse Authorities (IALA) is a non Governmental Association bringing together services and organisations concerned with the
provision or maintenance of marine aids to navigation systems and allied activities, at sea and on inland waterways. The aim of IALA is to foster the safe, economic and expeditious movement of vessels,
through improvement and harmonisation of aids to navigation world wide and other appropriate means, for the benefit of the maritime
community and the protection of the environment. In the process, IALA has been continuoously interacting with IMO where it has observer status and has been major contributors in developing
number of state of the art techniques for meeting the IMO performance standard India has been a member of the IALA since its inception and remain a major contributor to the field of
Lighthouse Engineering. India has remained in the Council if IALA – a policy making body since 1980.
17.6. VISION
To deliver reliable, accurate, efficient, internationally compatible &
cost effective aids to marine navigation service so that our waters continue to be amongst the safest & secured to navigate in the
world.
369
17.7. MISSION
To deliver reliable, accurate, efficient & internationally compatible
mix of aids to Marine Navigation Service, for all the mariners plying in the Coastal Waters specially ensuring better than 5m seamless accuracy in position fixing.
17.8. STRATEGY
To continue to provide an appropriate mix of A to N based on
relevant technology for general and local aids to navigation
To work with key stake holders, nationally and internationally,
to promote the safety of marine navigation based on harmonized international standards, recommendations and guidelines;
To maintain reliability, efficiency and cost-effectiveness while ensuring the safety & security of navigation;
To continuously endeavor to improve the quality of human resources by regular training and induction of quality
manpower. 17.9. NATIONAL MARITIME DEVELOPMENT PROGRAMME (NMDP)
17.9.1 Schemes valued at Rs 685 crore with budgetary support of Rs 500 crore are presently under the ambit of the NMDP. An expenditure of about Rs 140 crore is incurred till 30.06.2010. Out of these, two
schemes namely Establishment of Vessel traffic Service in the Gulf of Khambhat and Establishment of Static Sensors at strategic
locations is being carried out by Gujarat Maritime Board and Coast Guard respectively. Following schemes have been completed:
(i) Establishment of Racons
(ii) Long Range Identification & Tracking
17.9.2 Following three schemes are likely to be completed by March 2012.
(i) Vessel Traffic Service for the Gulf of Kachchh (ii) Automation of Lighthouses (iii) Establishment of Shore Based AIS
17.9.3 Following schemes under NMDP fall under continuous schemes and therefore in our perspective plan they will be treated afresh:
(i) Improvement of Aids to navigation (ii) Establishment of New Lighthouses (iii) Procurement of Lighthouse Tender Vessels
17.10. RESOURCE GENERATION
17.10.1 The Directorate functions as a self-financing organization. Its
income is being derived from light dues levied on ships entering and

370
leaving Indian ports. The light dues are levied on the basis of Net Registered Tonnage (NRT) of the vessels. Presently the Directorate is
charging light dues on foreign going vessels only at the rate of Rs.8.00 per tonne.
17.10.2 After meeting the revenue expenditure of the Directorate out of the total receipts, the balance is transferred to General Reserve Fund. An amount of Rs 616.05 crore (provisional) is available in the
General Reserve Fund as on 31.3.2010. Capital Expenditure on the plan schemes of the Directorate is met out of its own resources to the extent the amount is available in the GRF and the uncovered
balance is met out of general revenues of the Govt. as a loan to be repaid subsequently.
17.10.3 The total internal resources from Light dues are expected to be of
the order of Rs 733 crore during the Eleventh Plan Period. There has
been an annual growth about 10% on light dues collection during the 11th Plan so far. Considering the same growth during the period
from 2012 to 2020, a revenue collection of Rs 3800 crore is envisaged at the present rate of light dues.
17.10.4 Considering that 50% of light dues collection is spent on revenue
expenditure, an estimated sum of Rs 1900 crore is anticipated to be available for capital expenditure. Further during the remaining two years of the current plan, another 150 crore is anticipated to be
added in the GRF. Thus GRF as on 31.03.2012 is anticipated to be Rs 766.05 crore. If the existing GRF is added to the anticipated
collection, a sum of Rs 2666.05 crore is anticipated to be available for our perspective plan (2011-2020).
17.11. PROPOSED PROJECTS (01.01.2011 – 31.12.2020)
There are about 18 projects costing about 1594 cr in the perspective
plan. The detailed brief on the proposed projects are placed at annexure – II.
The projects at a glance are given below:-

371
(Rs in crore)
Article III. S
l No
Name of Project Approx. Cost
Year of Project
preparation/
Commencement
(a) Expected date
for Completion
of projec
t
1 2 3 7 8
1 Visual Aids 50.00 2011 2020
2 Recapitalization of DGPS 25.00 2012 2013
3 Establishment of Racons 05.00 2011 2020
4 Vessel Traffic Service
150.00 300.00
2011 2012
2020 2015
5 Establishment of National AIS Network
90.00 2011 2013
6 Establishment of Navtex Chain 20.00 2011 2013
7 Establishment of e-Loran Chain
350.00 2014 2018
8 Measurement of Tides and
Currents in Gulf of Kachchh &
Gulf of Khambhat
100.00 2014 2016
9 e-Navigation 25.00 2015 2017
10 e-Governance 25.00 2011 2015
11 Automation of Cochin/Chennai/Vishakhapatnam
/Kolkata Lighthouses
30.00 2011 2014
12 Replacement/Acquisition of Vessels
350.00 2011 2020
13 Improvement of Local Aids to Navigation (i) Improvement of Local
Lighthouses (ii) Vessel Traffic Service for
Minor Ports
10.00
300.00
2011
2012
2017
2015
14 Provision of Green Energy at Lighthouses
20.00 2011 2015
15 Construction of Deep Bhawan & Staff Quarters at Visakhapatnam
12.00 2011 2014
16 Beautification of Lighthouses 20.00 2011 2020
17 Human Resource Development 10.00 2011 2020
18 ISO Certification for the DGLL 02.00 2015 2016
Total 1594.00

372
Annexure-1
Inventory of Aids to Marine Navigation
1. At the time of Independence, only 17 general lighthouses were transferred to the Govt of India. They are -
(i) False Point, Calcutta Presidency
(ii) Santopilli
(iii) Sacremento Shoal (iv) Armagon
(v) Pulicat (vi) Seven Pagoda (Mahabalipuram) (vii) Calimere (Pt Calimere) Madras Presidency
(viii) Manapad Point (ix) Cotta Point (Kadalur Point) (x) Caph, (Kaup)
(xi) Oyster Rock (xii) Vengrula Rock
(xiii) Viziadurg (Rajapur Bay) (xiv) Jaigarh, Bombay Presidency
(xv) Arnala (xvi) Piram
(xvii) Kennery (Kanhoji Angre)
2. 51 local lighthouses were taken from the Part B States
(i) Saurashtra - 33 (ii) Kutch -5
(iii) Travancore – Cochin - 13
3. Aids to Marine Navigation (Present Inventory)
The Directorate of Lighthouses and Lightships is at present
maintaining a number of Aids to Marine Navigation, details of which are as given below:
(i) Lighthouses : 178 No (ii) Lightships : 01 No
(iii) Differential Global Positioning System : 23 No (iv) Racons : 64 No (v) Deep Sea Lighted Buoys : 21 No
(vi) Wreck Marking Buoys : 02 No

373
Annexure-II
DIRECTORATE GENERAL OF LIGHTHOUSES & LIGHTSHIPS
1.1 The Directorate is headed by the Director General for the purpose of administration and management of Lighthouses. Four Deputy Director
Generals and ten Directors in the Engineering discipline of Civil, Electronics and Mechanical assist him. The coast line is divided into 7 lighthouse districts with headquarters at Jamnagar, Mumbai, Cochin,
Chennai, Vishakhapatnam, Kolkata and Port Blair. Each district is headed by a Director (Regional), who has under him officers belonging
to various engineering disciplines. 1.2 The increased availability of established Aids is indispensable for a
National Authority. In order to minimize the accident, which in turn results in economic, environmental and social losses for the country,
the Aids to Navigation of International standards are required to be established and maintained along the Indian coast. The objective of the Directorate is to provide such Aids to Navigation, in the coastal
waters of the nation, which ensure safety of mariners and minimizes environmental pollution. The Directorate‟s perspective for coming years (up to 2020) at an estimated provision of Rs.1594 crore is
described in subsequent paragraphs.
1.3 This plan reflects the level of service the Directorate targets to provide to all users, taking advantage of evolving technological and operational improvements. However, there are other developments in the external
environment that could affect the proposed plan and result in inclusion/omission of new/proposed schemes in the Directorates
perspective plan. 2. Visual Aids (Rs 50 crore)
Lighthouse by itself is visual aid to marine navigation used by
mariners for position fixing. Till the end of the twentieth century,
lighthouses in literal term were considered the major means of aids to navigation. But with the advent of GNSS, particularly GPS in the early
nineties, the bridge of the large vessels are equipped with navigational equipment which derive lat and long directly thus diminishing the importance of lighthouses. Nevertheless, the importance of lighthouses
in general for all categories of vessel has not diminished inspite of shrill made by the industry. Rather its importance for confirmation of position, spatial awareness and primary means of navigation for
fishermen in our waters who do not have latest technological wherewithal is very much there. In this context, the following lines
from the GLA (General Lighthouse Authorities) Radio Navigation Plan is worth quoting:
374
“It is clear from in-depth consultation with users, both in the commercial and leisure sectors, that lighthouses, buoys and beacons will continue to play a vital role in the balanced A to N mix. Additionally, the role of A to Ns is often understated when considering the protection of the marine environment, marine coastal industries and the general public.”
The visual aids consists of (i) Lighthouses (ii) Floating Buoys which can be further categorized into Channel Marking and Wreck Marking.
The Directorate envisages improvement of the existing visual aids and establishment of new Lighthouses in the remaining coastline and on islands, which are not uniformly covered. The ultimate objective shall
be to provide a lighthouse at an interval of 30 Nautical Miles all along the coastline and islands by 2017 AD so that a seamless visual coverage of the entire Indian Coast line is available. The other works
like marking of wrecks, channel and improvement are continuous work and hence the work will continue to be spread over the entire
perspective plan period. The Directorate is in the process of establishing an off shore
lighthouse about 20 NM from Okha which will facilitate in cutting voyage of VLCCs/ULCCs coming from the Gulf by about 30 NM. The
Directorate is contemplating to establish a new deep channel North West of existing Salaya Channel in the Gulf of Kachchh which will meet the present Channel near Kachchh buoy.
3. Recapitalization Differential Global Positioning System (DGPS) (Rs
25 crore)
DGPS enhances GPS through the use of differential corrections to the
basic satellite measurements. DGPS is based upon accurate knowledge of the geographic location of one or more reference stations, which is used to compute pseudorange corrections based on its
measurements. These differential corrections are then transmitted to GPS users, who apply the corrections to their received GPS signals or computed position. The Directorate DGPS Chain, which seamlessly
covers the Indian water and provide better than 5m accuracy up to 100 NM from the coast, remains the internationally accepted means of
providing DGPS corrections and integrity information to maritime users. These systems are now at fag end of their useful lives and are due for up gradation not only for revival but to make them compatible
with other GNSS Systems like GLONASS, Galileo, etc. The work is likely to commence from 01.01.2012 and will be completed by
30.06.2013.

375
4. Radar Beacon (Racon) ( Rs 5 crore)
Mariners place a high importance on Racons (Radar Beacons) as an integral part of the A to N mix particularly at night, in reduced
visibility and adverse weather conditions. IMO has recognized the value of new radar technology to improve the detection of small craft under poor conditions and, from 2008 onwards, has removed the
obligation for S-band radars to trigger racons. Nevertheless, the system is likely to be operational beyond 2020. The Directorate plans to further increase the number of Racons as per the demand and also
upgrade / replace Racons as per technological advances and requirements. This will be a continuous scheme and therefore prevail
over entire perspective plan period.
5. Vessel Traffic Service (VTS) (Rs 150 crore)
IALA defines VTS as the functional framework of harmonized measures
and services to enhance the safety, security and efficiency of shipping and the protection of the marine environment in all navigable waters. For this purpose number of sensors like Radars, AIS, Direction
Finders, Mateo, Hydrological sensors are integrated an overall scenario of the subject waters and vessels are developed on a display from where an appropriate advise can be given to the master of the vessel.
The Directorate establishes the VTS in common waterways from where the requirement of number of ports is met. The Directorate is also
contemplating to establish Vessel Traffic Service for TSS wherever implemented/being implemented. The Directorate is presently implementing the Vessel Traffic Service for the Gulf of Kachchh which
will need upgrade by 2020. Further there is likely hood of establishment of VTS for Port Blair and under such waters. The project will run through currency of the perspective plan.
6. Establishment of National AIS Network (Rs 90 crore)
The Automatic Identifications System (AIS) transmits ships related information to adjoining ships or on shore for effective identification of
vessels and other management information. Further a shore based AIS can provide information to ships about the type, position and
functioning of a particular aids to navigation. DGLL is in the process of establishing a National AIS Network which will significantly enhance and complement existing Aids to Navigation. The work for first phase
is presently in progress and the approval of the competent authority for award of contract is awaited. The contract could be signed by 30 Sep 2010 and the first phase of the work will be completed by 31st
March 2012. The second phase of this network which will encompass islands of Andaman‟s & Nicobar and Lakshadweep will take shape in
the starting of the 12th Plan period and is likely to be completed by 31.03.2013. Further since the existing network envisages provision of
376
a third frequency which will enable tracking of small vessels with a compatible transponder, appreciable expenditure on this account too
likely to incur by the Directorate.
7. Establishment of Navtex Network (Rs 20 crore)
Navtex is an international automated direct-printing service for
promulgation of navigational and meteorological warnings and urgent information to ships. The Directorate is in the process of establishing a Navtex Network of 7 transmitters. The administrative approval of the
scheme is awaited. The work is likely to commence from 01 April 2011 and is likely to be completed by 31st December, 2013.
8. Establishment of eLoran (Enhanced LOng-RAnge Navigation)
chain (Rs 350 crore)
Enhanced Loran is an internationally-standardized positioning,
navigation, and timing (PNT) service for use by many modes of transport and in other applications. It is the latest in the longstanding and proven series of low-frequency, Loran systems, one that takes full
advantage of 21st century technology. eLoran meets the accuracy, availability, integrity, and continuity performance requirements for
aviation non-precision instrument approaches, maritime harbor entrance and approach maneuvers, land-mobile vehicle navigation, and location-based services, and is a precise source of time and
frequency for applications such as telecommunications. eLoran is an independent, dissimilar, complement to Global Navigation
Satellite Systems (GNSS). It allows GNSS users to retain the safety, security, and economic benefits of GNSS, even when their satellite
services are disrupted. Enhanced Loran (eLoran) is rapidly emerging as the primary GNSS
backup for the new, global, maritime e-Navigation concept. Europe was ready to turn off all the Loran transmitters at the end of 2005.
However, an increased understanding of GNSS vulnerability and a growing appreciation of eLoran's role within e-Navigation, a new
interest has arisen in the UK and France who are experimenting with the system. The USA too is contemplating to use its existing Loran resources for the purpose of eLoran. Saudi Arabia has already floated
the bid for induction of eLoran. The existing Loran operating countries like South Korea, Japan and Russia too are actively contemplating for
the change to eLoran.
India too had Loran systems which was discontinued during 2007- 08. The Directorate contemplates to utilize the existing resources at these stations apart from adding more stations in Southern Peninsula to
provide an independent PNT service for vessels plying up to our EEZ.
377
The project is likely to be commence from 2014 and will be completed by 2018.
9. Measurement of Tides and Currents in Gulf of Kachchh & Gulf of
Khambhat (Rs 100 crore)
The advent of GPS Real-Time kinematic (RTK) in recent years has realized a significant advancement of GPS to provide three dimensional
navigation at the centimeter level of accuracy. One of the fastest emerging trends in hydrographic surveying is the use of the vertical component of RTK GPS to determine real-time water level corrections.
The system becomes most suitable for the Gulf Khambhat and the Gulf of Kachchh where tidal and current variations are appreciable
and real time corrections of these parameters can indeed help in berth to berth navigation and also enable vessels in carrying extra cargo thus having a long term economic implications. It is proposed that the
system is established by the Directorate whereas post processing of data can be carried out by the NHO and relayed to the vessels in real
time. The project is likely to start in the year 2015 and will be completed by 2017.
10. e-Navigation (Rs 25 crore)
If current technological advances occur without proper coordination, there is a risk that marine navigation systems of the future could be
hampered by a lack of standardization (ashore and shipborne), incompatibility between vessels, and an unnecessary level of
complexity. Hence harmonization of such aids by way e-Navigation is needed which is a holistic concept of enhanced navigation through electronic systems, based on user needs and derived user
requirements. In particular, the e-Navigation concept simultaneously targets:
the harmonization of shipborne and shore-based functionality;
the harmonization of shore-based operational and technical
functionalities and services of different shore-based stake- holders;
multi-dimensional quality improvements of shore-based operational and technical services;
demonstration of service levels achieved, using appropriate management and engineering methods.
Clearly, there is a need to equip both ship borne and shore-based
users responsible for safety of shipping with modern proven tools that are optimized for decision-making. The overall goal is to reduce errors by making maritime navigation and communications become more
reliable and user-friendly.
378
While the full scope of e-Navigation is not fully known, it is expected that it will be far-reaching and impact the entire maritime navigation
domain on a national and international level. IMO too has recognized the potential of e-navigation and is advising member countries in this
direction. The Directorate being custodian of marine aids to navigation plans to venture into harmonization activities as and when it evolves. The project is likely to commence in the year 2015 and shall be
completed by 2017. 11. e-Governance (Rs 25 crore)
The Directorate is having seven Regional Offices spread along the
coastline at Jamnagar, Mumbai, Kochi, Chennai, Vishakhapatnam, Kolkata and Port Blair. All these lighthouses regions are being networked with their Regional Offices under Automation/AIS Network.
Thus, all the Regional offices will have updated information on functioning of lighthouses and other aids. It is planned to network all
this regional offices to the headquarters at Noida through a Wide Area Network having dedicated hub for ease in flow of information grazing and gathering. In addition, the networking will facilitate flow of
administrative and technical information. In other words, it is planned to link all the lighthouse installations, regional offices and headquarters in real time through a Wide Area Network. The scheme
will be taken up in the year 2011 and will be completed by 2015.
12. Automation of Cochin/Chennai/Vishakhapatnam /Kolkata Lighthouses (Rs 30 crore) Article IV.
The aids to navigation established by the DGLL are at locations, which are conspicuous to the mariners from the seaward side. These locations are generally difficult to approach and maintain. The staff
posted at these locations faces numerous logistic problems. In order to improve upon the reliability and availability of aids to navigation and
also to alleviate the difficulties faces by the staff; DGLL has planned to automate the lighthouses.
There are seven regions namely Jamnagar, Mumbai, Cochin, Chennai, Kakinada, Kolkata and Port Blair under the Directorate. The scheme is
being implemented in phased manner. In the first & second phase, the Directorate has already carried out automation of lighthouses under Jamnagar & Mumbai Region. Work for Port Blair in progress. In the
last phase, automation of Cochin, Chennai, Vishakhapatnam & Kolkata is proposed. The project will commence from 01.01.2011 and will be completed by 31.03.2014.
379
13. Replacement/Acquisition of Vessels (Rs 350 crore)
Presently the Directorate has two ocean going vessels for tending to requirements of island lighthouses and buoy maintenance. Apart from
tending, these vessels are required to continuously monitor of ATONs. One of the vessels, MV Pradeep which is in service since 1984, needs immediate replacement. With increase in activities of the Directorate,
number of offshore ATON will become part of the Directorate. In view of this, the Directorate proposes to acquire one more ocean going vessel which will help the Directorate in improvement of delivery of
service. Directorate also plans to induct new launches in place of ML Jamvijay and ML Piram which were earlier written off and the
necessity is now felt due to sensitiveness of the region. Since the project envisages replacement /acquisition of vessels, the work may continue during the entire perspective plan period.
14. Improvement of Local Aids to Navigation
14.1 Improvement of Local Light Houses (Rs 10 crore)
Local Aids to Navigation being maintained by the local maritime bodies/states are generally not in pink of health. Lighthouse Act provides for arrangement under which these aids can be looked after
by the Directorate. A subcommittee of the CACL has also gone into details and has recommended for taking over of 21 local lights and
improvement of 45 local lights at an estimated cost of Rs 25.22 crore. Out of these, 6 lights have since been taken over and modernized. Process of taking over and modernization of 3 more lighthouses are in
progress. The remaining lighthouses will be improved during the 12th Plan period.
14.2 Vessel Traffic Service for Minor Ports (Rs 300 crore)
The prevailing security environment necessitates maintaining an effective vigil in the Indian Ocean to monitor mercantile traffic transiting through our areas of interest or approaching the Indian
Coast. The high density of merchant traffic has made identification as one of the biggest problems in maritime reconnaissance. It is therefore
imperative for all stakeholders in the maritime domain to have enhanced awareness of the traffic entering the Indian Ocean and its extended choke points, to be able to effectively detect, identify and act
against seaborne threats. This can be achieved through implementation of a Maritime Domain Awareness (MDA) mechanism. Indian Navy, in this context, has come out with this proposal where
intelligence from every possible sensors/organization will be integrated & the data collected and collated by them. In the process, they have
suggested for establishment of VTS at 37 non major ports/minor ports. Since these ports are not in a position to fund such activity,

380
Indian Navy has suggested implementing this project by the Ministry of Shipping under central funding. Since VTS is an aids to navigation
and DGLL being the domain expert of the VTS and also the central agency under Ministry of Shipping for aids to navigation can take up
such implementation under its charter. Accordingly it is proposed to implement the scheme of VTS at Minor Ports as a part of improvement of local aids to navigation at an estimated cost for Rs 300 crore. The
scheme on approval can be taken up from the year 2011 and can be completed by 2015.
15. Provision of Green Energy at Lighthouses (Rs 20 crore)
Marine Aids to Navigation are established at the location which facilitates ease in navigation. These locations generally are isolated and far-flung where utilization of fossil fuels like diesel is the
maximum. The Directorate has embarked upon a policy of utilization of solar and wind energy so that consumption of diesel is almost zero.
In the process, about 25 KW of solar energy is being generated to power 63 lighted beacons and 13 island lighthouses. Recently the Directorate has established 5 KW solar- wind hybrid energy at False
Point. Work for another two locations at East Island (28.2 KW) and Kanho JI Angre (5 KW) are in progress. The Directorate plans to introduce hybrid energy at all the lighthouses by the end of 2015.
Efforts will also be made to explore the possibility of wave/tidal energy at some critical applications like buoy.
16. Construction of Deep Bhawan & Staff Quarters at Visakhapatnam
(Rs 12 crore)
The Directorate is having its own administrative building and staff quarters at all the regional centres where central pool accommodation
are not available except at Vishakhapatnam where the Directorate is presently functioning from the Port premises. The premises provided
by the Port is in Dock Labour Board building where regular transportation of coal takes place resulting in working inconvenience to the staff. Further the accommodation provided is not sufficient for
day to day working. The staff has to stay in rented accommodation making the living conditions quite prohibitive. Also, the Directorate
needs additional space for accommodating additional staff for the upcoming projects and for better facilities. Keeping in view the above, it is proposed to construct an office building complex and staff
quarters at Vishakhapatnam. Directorate had approached Visakhapatnam Port Trust for allotment of
land who has agreed to help. Total estimated cost of the project is amounting to Rs.12.00 crore including upfront fees of land to be paid
to VPT.

381
The project is proposed to commence in the Year 2010-11 and will be completed by 2013-14.
17. Beautification of Lighthouses (Rs 20 crore)
Lighthouses are show case of the engineering prowess and architecture beauty of the past. Its location too make them attractive
for tourists as these are not considered scenic but a unique part of the national heritage, to be treated differently from other assets, as they are a strong symbol of the World maritime heritage and hold great
significance to local and national communities.
The cultural heritage of lighthouses extends beyond the architectural value of the buildings, to the whole area of maritime traditions and
history, including shipping trading patterns, navigational safety and wrecks. This is required to be preserved and evidence documented for
the benefit of future generations. Recording present traditions and changes is also important, as they will become part of the cultural heritage for future generations.
In this context, some of the Lighthouses like Villinjam, Dolphin's Nose, Minicoy, Little Andaman, etc are at important tourist location where it would be most beneficial to extend the facility to the visitors who
intend to explore lighthouses and its adjoining beauty. Therefore, if the landscape of some of these locations is developed to make it more beautiful and also some of the quarters of Light keeper‟s which are
vacant can be developed into a full-fledged Tourist Hut, significant number of tourist can be attracted to such locations. The directorate
during the subject perspective plan proposes to develop number such lighthouses for the purpose.
18. Human Resource Development (Rs 10 crore)
Human Resource Development is a vital activity for a vibrant
organization. The activity interalia includes continuous improvement of quality of manpower by rigorous knowledge based training and
induction of quality manpower.
Effective training ensures that an organization‟s human resources use the tools and test equipment, documentation, and spare parts efficiently to provide the required system operational reliability,
through the proper installation, operation and maintenance of the prime mission equipment (IALA).
The Directorate is presently maintaining a training centre at Kolkata
which needs to be developed in training institute of repute for in house training of the Lighthouse Staff. The major limitation of the existing
training centre is non availability of dedicated faculty with domain expertise. It is proposed to develop the existing training facilities by

382
way of inducting dedicated faculty, state of the art equipment and ever evolving training curricula.
The close and effective interaction with Indian Navy, Coast Guard, IMD
and State Maritime Organisations on a day to day basis for improving the coastal security scenario in the country necessitates induction of more number of officers and elevating their status to match with the
hierarchy of other organsiations for effective and meaningful interaction.
19. ISO Certification for the DGLL (Rs 2 crore)
DGLL is a service provider for Aids to Marine Navigation in India. Of late, these Aids to Marine Navigation, as a part of Coastal States
infrastructure, are subjected to IMO Audit. In order that DGLL provides the Aids to Marine Navigation which complies with IMO performance standard and is as per SOLAS Regulations, the
Directorate plans to evolve a comprehensive quality manual which will lead to ISO certification.

383
CHAPTER 18
SHIP BUILDING AND SHIP REPAIR
18.1. INTRODUCTION
18.1.1 There are 27 well known Shipyards in the country, 8 in the Public Sector and the remaining 19 in the Private Sector. The list of
shipyards in Public Sector is at Annexure-I The maximum size of vessel, which can be built in India in the public sector, is 1,10,000
DWT at Cochin Shipyard Ltd. and 80,000 DWT at Hindustan Shipyard Ltd. These sizes of vessels are relatively small compared to the current trend of building large size vessels worldwide. The current capacity of
all the yards is 5, 00,000 DWT approximately. The Indian Shipbuilding Industry, which had only about 0.1% share of the world shipbuilding in 2002, expanded over tenfold to claim 1% share by
2007/2008 riding on the global boom and supported by a subsidy scheme.
18.1.2 Shipbuilding turnover for Private and Public Sector Shipyards excluding Defence Shipyards has grown about 14 fold in the last nine
years from about Rs.440 crores in 2001-2002 to an estimated Rs.6200 crores in 2010-2011. A table showing improvements in turnover,
employment generation, investments, order book and deliveries of Indian Shipyards from 2002 to 2007 is annexed and marked as Annexure II
18.1.3 Cargo handled at Indian Ports more than quadrupled from 180 million tonnes in 1993-94 to 850 million tonnes in 2009-2010 as
compared to the 8 billion tonnes global sea borne cargo transported in 2008. India‟s EXIM trade has been increasingly serviced by foreign
flagged vessels whose share has shot up from 60% in 1980s to about 92% by 2009-2010 as growth in Indian tonnage has been slow compared to burgeoning merchandise trade volumes. As much as
40%, of Indian ships, will need to be replaced over the next 5 years owing to age (above 20 years) and mandatory IMO Regulations for phasing out single hull tankers, which, in the absence of sufficient
acquisition, may result in further erosion. At present domestic shipping companies rely heavily on foreign yards for acquisition or
repairs. Policies encouraging greater participation from Indian shipping and incentivizing acquisition from local yards would facilitate in retaining a higher share of the expanding seaborne trade within the
domestic economy.
18.1.4 Government of India extended the Shipbuilding Subsidy Scheme, for both export and domestic orders also to private sector Indian shipyards with the approval of Cabinet Committee on Economic
Affairs on 25.10.2002. Earlier, the Scheme was open only to the Public Sector Shipyards. The share of Indian Shipbuilding industry
in the global order book expanded rapidly from less than 0.1% share
384
in 2002, to 1.3% by 2007/08. The above Subsidy Scheme was applicable for contracts signed upto 14th August 2007.
18.1.5 In the face of global recession and in the absence of Government
support in the form of a subsidy scheme post August, 2007, Indian shipyards have been languishing for want of new orders. Indian Yards could book very few orders either for export or domestic shipping lines
as foreign yards; especially the Chinese Yards have been outbidding them fairly consistently. The momentum created by a combination of boom conditions and subsidy support has been arrested by the
discontinuation of the subsidy scheme and recession post 2007. Lapsing of the subsidy scheme has also resulted in a progressive
attrition in the share of Indian yards in global order book. While during 2002 and 2007, orderbook increased fourfold from 0.3 million DWT to nearly 1.3 million DWT accompanied by an impressive
increase in global market share , after 2007, the share in the new orders has progressively declined from 0.67% in 2007 to 0.02% in
2009 and 0.13% in 2010 [Source-Clarksons].. This clearly suggests that the momentum built up during the subsidy scheme is being lost. It is important to note that this decline in share is not evident for
yards in other countries like China and Korea as they continued to receive support, both direct and indirect even during the recession. A
Table depicting cost profile of the industries in China and Korea and supporting evidences for the key items impacting the cost differential is annexed as Annexure III. A chart depicting the change in global
market share of Indian Yards in the context of post and pre subsidy and recession is placed at Annexure IV.
18.1.6 The National Manufacturing Competitive Council (NMCC) has
been emphasizing the need for a shipbuilding policy to enable Indian Yards to compete effectively in both the domestic and export markets
to help build a strong shipbuilding sector in the country, given its potential for employment generation as well as its strategic
importance. In a meeting held on 7th January, 2010 NMCC recommended that the Shipbuilding Industry in India needs to be granted Infrastructure status and be also declared as a Strategic
Sector. A copy of the extracts of NMCC‟s recommendations is annexed and marked as Annexure V.
18.1.7 Ship Repair activity in India is largely concentrated around 18 small sized commercial dry docks, equally divided between the public
and private sectors. This is supplemented by „wet berths‟ in major ports and captive repair facilities of the Navy.
The ship repair business worldwide is estimated to be around 12 billion $ (appox Rs 55,000 crs). India as a whole gets a revenue of not
more than 100 million $ per annum (Rs 463 crs) which is less than 1% of world ship repair share. It is estimated that the total potential of the
ship repair market available in the Indian region is of the order of Rs

385
2440 to Rs 2790 crs per annum as shown below. As the repair industry is labour intensive it is easy to translate turnover to jobs
which is estimated to be around 20,000 additional jobs in the skilled and semi-skilled category.
Type of Ships Repair Potential Per Year
(Rs Crs)
Foreign Ships on overseas trade visiting
Indian Ports
1150-1400
Domestic ships on overseas trade 200
Coastal/Service Vessels 190
Offshore Rig Repairs 300-400
Navy and Coast Guard Vessels 100
Other Merchant Vessels in Region 500
Total 2440 - 2790
18.1.8 The ship repair activities in India are regulated through
designated Ship Repair Units (SRUs) registered and licensed by the DG
Shipping. The SRUs are a mixed lot where except few shipyards (CSL and HSL) that have comprehensive facilities for major repairs and Dry
Docking most other are small to medium size firms that can carry out limited repairs to machinery and equipment only. Only designated SRUs are allowed to avail of the custom duty and excise concessions.
There are a total of 30 SRUs registered with DG Shipping in the entire country and only 4-5 shipyards out of a total of 27 in the country
carry out any significant repair jobs. Even those shipyards that were earlier undertaking repair activities are reducing this activity in favour of shipbuilding seen to be more attractive. There is a recent
suggestion from the industry that every vessel be declared as SRU to facilitate repair of ships
18.2. VISION
18.2.1 With respect to Indian Shipbuilding and Ship Repair Industry, following is envisaged :
“To have a well developed shipbuilding and ship repair industry of international standard in India which will be self sufficient in building and repairing commercial vessels required by the country by 2020 and
generate huge investment and employment opportunities. 18.2.2 Following targets can be set for the Indian Shipbuilding
industry: (a) To achieve a global market share of 5% by 2020.
(b) To develop a strong ancillary base in the country by 2020.
386
(c) To generate additional employment for 2.5 million persons (0.5
million direct and 2.00 million indirect) by 2020 in the core
shipbuilding as well as the ancillary and supporting industry
sector.
(d) To develop strong R&D facilities and design capabilities for the
commercial shipbuilding.
(e) To be self-sufficient in ship repair requirements of the country
and to emerge as a dominant ship repair centre replacing
Colombo, Dubai, Singapore and Bahrain.
(f) To achieve a share of 10% by 2020 in global ship repair
industry.
18.3. PROBLEMS FACED BY SHIPBUILDING INDUSTRY AND MEASURES REQUIRED TO ADDRESS THEM
Broadly 4 gaps viz. manufacturing gap, technology gap, resources gap and skill development gap have been identified in the promotion of shipbuilding/ship repair sector.
18.3.1 Manufacturing Gap:
18.3.1.1 Shipbuilding Subsidy Scheme: This scheme was operational for contracts signed during 2002-2007 i.e. the date till the scheme was operational. Recently, CCEA approval has been obtained for
discharging committed liabilities for contracts signed before 14th August, 2007. This will help the shipbuilding sector to grow.
Simultaneously a new shipbuilding subsidy scheme needs to be formulated to promote Indian shipbuilding keeping in mind various
taxes and duties imposed on shipbuilding industry and global shipbuilding scenario. The projections for shipbuilding subsidy upto
the year 2017-2018 are annexed hereto and marked as Annexure-VI Long-term survival of the industry will depend on continued flow of orders from both the export and the domestic market. For this to
happen, a level playing field for the industry is a necessity vis-à-vis competitors abroad, especially with respect to taxes and duties. Further, in this regard, a need has been felt to incentivize purchase of
ships by Indian ship-owners from domestic shipyards. Further, the restriction for minimum size of vessel eligible for shipbuilding subsidy
needs to be removed. A need has also been felt to incentivize dredging and costal shipping by Indian flagged vessels though this Scheme.
18.3.1.2 Setting Up of Ship Repair Units/Maintenance Hubs : Ship repair units/maintenance hubs need to be set up in all major ports and at least big non-major ports. This may be taken up with all the
major ports and various State Governments. Further, declaring of ship as SRU will be examined.

387
18.3.1.3 Infrastructure Status: A proposal has been forwarded to Department of Economic Affairs and Planning Commission to consider
granting infrastructure status to shipbuilding industry.
18.3.1.4 Strategic Sector: A proposal has been forwarded to National
Security Council Secretariat for declaration of Shipbuilding as Strategic Sector.
18.3.1.5 Incentivising Domestic Shipyards:
(a) There is a need for a shipbuilding policy to enable Indian Yards to compete effectively in both the domestic and export markets to help
build a strong shipbuilding sector in the country, given its potential for employment generation as well as its strategic importance.
(b) The present eligibility requirements for acquisition by Central Government organizations including PSUs emphasize past experience
of building similar vessels, often effectively prevent participation by Indian yards which are still developing. These requirements have evolved from experience of earlier orders when the capacities of Indian
shipyards were limited and the Indian industry was in a moribund state with delays and defaults being endemic. With the recent
expansion/ modernization and creation of new capacities rivaling global standards, eligibility requirements need to focus on requisite infrastructure rather than experience (based on deliveries of similar
vessels) with checks and balances in the form of stringent penalties for non-performance. This would also be in line with similar practices being followed in other developing countries like Brazil where ships are
being ordered on local yards even without infrastructure being in place as part of their oil exploration policy.
(c) There has been a demand to consider introducing purchase preference to Indian shipyards by matching the lowest price for ship
acquisition including dredgers by Government organizations/Public Sector Undertakings in global tenders to address predatory pricing
particularly by foreign yards where the element of Government support is not very transparent. This would enable competitive prices and at the same time encourage Indian yards to compete for local orders.
This policy could be applicable to vessel acquisitions by all public entities i.e. all organizations or bodies of the Central Government
including PSUs. This policy could also cover Defence acquisitions when global competitive bids are being invited.
18.3.2 Technology Gap: 18.3.2.1 Transfer of technology: Transfer of technology for shipbuilding
particularly in high end segment needs to be considered by way of purchase or tie up with foreign firms. A scheme of capital subsidy to incentivise technology upgradation and using LNG as alternate fuel
will be examined.
388
18.3.2.2 Modernization of shipyards: Shipyards need to go in for
modernization by installing cranes of higher capacity and improving other infrastructure facilities available within the shipyards. The
higher capacity of cranes will ensure that construction period in dock is reduced thereby increasing capacity of the shipyard.
18.3.2.3 Promotion of Design Capabilities: Many of the shipyards have set up their small design centers and some independent design centers have also been established but broadly the country is purchasing
conceptual design from foreign firms and doing detailed designing within the country. To address lack of capability at the conceptual
design stage we need higher number of graduates in design capabilities and larger input in R&D projects. Incentivisation of domestic design needs to be considered. Further, foreign design
companies need to be encouraged to set up shop in India.
18.3.2.4 Ancillarisation: India presently does not have expertise and capability in had production of engines, manufacturing of gears, etc. Around 20-25 foreign companies have set up or are in process of
setting up of ancillarisation units in India. Setting up of clusters for ancillarisation needs to be promoted and a policy may be formulated for this. An offset policy for ship acquisition will be examined to
promote ancillarisation in India.
18.3.3 Resources Gap : 18.3.3.1 Special Quality Steel: It is felt that India is not able to produce
special quality steel which goes into shipbuilding. Further, it has been pointed out that the import of steel for shipbuilding is without any tariff whereas 8% Excise duty and 4% VAT is payable on steel
produced domestically by Indian Steel companies. A need has been felt that steel supply to shipbuilding units may be considered as
deemed exports or concessions on excise duty and VAT may be provided to steel companies for steel provided to shipyards.
18.3.3.2 Funding: Shipbuilding sector may be considered as a priority sector for funding requirements of shipbuilding industry both for
setting up new plants and for working capital requirements.
18.3.4 Skill Development Gap : 18.3.4.1 Shortage of Naval Architects and Qualified Engineers: New
courses have been introduced in IMU, Chennai and Vizag Campus. More courses needs to be introduced in these institutions and private
sector to improve the number of maritime architects and qualified engineers graduates every year.
389
18.3.4.2 Shipbuilding Education and Training: To cater to the
requirement of skilled personnel, various shipyards including both private and public sector shipyards need to adopt ITIs as per the new
scheme of the Government. Further, to promote Shipyard related trades in ITIs, a scheme to provide equipment etc. to them to start such trades can be formulated.
18.4. PRESENT STATUS
18.4.1 NMDP Projects
(a) Cochin Shipyard Limited has been making profits since 1994-
1995 and has been conferred the Category I Miniratna status in July, 2008. Net worth of Cochin Shipyard Limited as on 31st March, 2010 is Rs.680 crores. Cochin Shipyard Limited has
secured shipbuilding orders worth more than Rs.2600 crores and Rs.500 crores for export and indigenous respectively, in the last five years. In addition, order for first indigenous Aircraft
Carrier for Indian Navy has been secured worth conversion cost of Rs.1160 crore (Phase I) plus provisional Rs.3000 crore (Phase
II). (b) Small Ship Division – The Small Ship Division Project of CSL
envisages simultaneous construction of smaller vessels in the Building Dry Dock alongwith the Aircraft Carrier. The project
was approved by Government on February, 2008 at an estimated cost of Rs.98.63 crores. It is financed by CSL‟s internal resources. The project was completed in March, 2010.
(c) Hindustan Shipyard Limited, a Public Sector Shipyard which
was earlier under the administrative control of Ministry of
Shipping, has since been transferred to Ministry of Defence for strategic purposes.
(d) Hooghly Dock and Port Engineers Limited (HDPE) is presently
constructing one Hydraulic Surface Dredger, one Self Loading
Cargo Vessel, six Work Boats and four Fuel Barges. A proposal for restructuring of HDPE is under consideration.
(e) National Ship Design and Research Centre (NSDRC), primarily
set up for carrying out ship design and research activities, was
proposed to be strengthened under National Maritime Development Programme. NSDRC has been merged into Indian Maritime University in November, 2008. Strengthening of
NSDRC is an ongoing process and grants in aid for carrying out R&D activities and Conducting Studies in Shipbuilding are
proposed to be provided to IMU, Vizag Campus (NSDRC).

390
(f) National Maritime Development Programme had envisaged
setting up of two international size shipyards, one on East Cost and the other on the West Coast of India. Recently it has been
decided by the Ministry that since the private sector has come up with setting up of two International Size Shipyards one on the east coast by L&T and another on the west coast by Pipavav
Shipyards Ltd. the Government may not pursue the matter regarding setting up of two International Size Shipyards and may act only at facilitator.
18.5. PROPOSED PROJECTS
18.5.1 Cochin Shipyard Limited
18.5.1.1 IPO of CSL
(a) Cochin Shipyard has posted impressive performance in the last few years with the turnover growing by almost five times since 2004-
05 ( Rs 276 crores to Rs 1249 crores in 2009-10) and the net profit growing by almost 19 times during the period i.e. from Rs 12 crores to Rs 223 crores. The yard witnessed continuous enquiries and orders
based on the reputation gained in the first few international shipbuilding orders. It was quite obvious that given the situation, the yard would easily saturate in one or two years time when the growth
will come to a standstill at the present level of capacity. CSL therefore conceived a proposal for creation of third dry dock. It was perceived
that CSL should go for an IPO to finance its drydock project. (b) The DRYDOCK project envisages creating a new high definition
dock in the northern part of the CSL estate. The dock would be capable of taking in vessels upto 200000 DWT. The dock would be
covered and would be capable of handling shiprepair, upgradation and conversion. The dock is conceived to help CSL to diversify into niche high tech products, which would help the company to sustain its
growth in future.
(c) The Internal Resources to part finance the 3rd Dry Dock will be
generated through the proceeds of the IPO. Initially it was perceived that Indian Navy will part finance the project. CSL has to now review
its financing pattern and seek other business partners. Another aspect is that although the Dry Dock will be set up in CSL premises, additional water front and land belonging to FSI and NIFPHTT will be
required for parking and repairing/refitting of the vessels
(d) CSL is aiming to hit the IPO in 2011- 12 alongwith the launching of Indigenous Aircraft Carrier which would give the company tremendous publicity and ensure good valuation. In the
interim the company should complete other ancillary activities like

391
acquiring land adjacent to CSL estate for the quay and thorough market analysis on the new products.
18.5.1.2 Proposed Projects
(a) Quay 3 extension to Southern side:
Out of the total available quay length of about 960m, Q3 of 460m is utilized for outfitting of vessels built in CSL. Once the Indigenous Air
Craft carrier under construction in CSL is undocked in 2011 the quay length required for its outfit shall be 312m. In addition to above, other vessels under construction in CSL require around 315m of quay
length. Considering total requirement of around 630m, it is required to extend the Q3 by another 170m. All facilities including crane tracks shall be extended to cater to total quay length of 630m.
(b) Implementation of Integrated Project Management system of International standards (ERP)
(i) Ship Building and Ship Repair activities in CSL have increased
multi-fold and CSL now builds and repairs multiple and varied projects for different owners both Indian and Foreign. The complexity of operations has increased many folds and a state of
the art integrated ERP system is the need for improving the operational efficiency and Productivity.
(ii) The integrated-process framework by ERP enables
standardization, visibility, traceability, and controllability over the business. An ERP system as business software system allows an organization to
Automate and integrate the major part of its business processes
Share common data, procedures and practices across the entire
enterprise
Produce, share and access information in a real-time
environment
Provide the ability to analyze data real-time and carry out what-
if analysis and support business planning and reporting.
(iii) CSL plans to implement an Integrated ERP connecting all its Business Process. A strong program management is also planned for the ERP Implementation to ensure completion of the
project without time and cost overruns.
392
(c) Augmenting facilities for increasing intake of Marine engineering trainees and develop training for highly skilled manpower
CSL has facilities for training 140 marine engineers every year.
Considering long term requirement in shipping industry, demand for qualified marine engineers shall be on an increase and can sustain for
more than 15 years. It is proposed to increase the intake of 200 trainees every year to its Marine Training Institute. Infrastructure facilities have to be augmented and updated to meet future demands.
CSL is contemplating introduction of new training schemes for developing skilled manpower necessary for shipyards and shipping industry as a whole. A few areas for which no facility is presently
available are:
1) Aluminium and Stainless steel welding
2) Rigging 3) Safety
(d) Implementation of siltation control at quay sides
Maintaining water depth of about 8m throughout the year in CSL
quays has been a perennial problem due to heavy siltation in Cochin backwaters. This leads to limitation on capacity foe shipbuilding and ship repairs in yard. CSL has been spending exorbitant amount
towards maintenance dredging every year. Many a times dredging is critically affected due to shortage of dredgers. It is found necessary to undertake studies on the siltation pattern in the quays of yard to
evolve suitable remedial methods for controlling siltation to reasonable limits.
(e) Automation in fabrication / welding facilities
Shipbuilding/Ship Repair industry is highly labour oriented. Labour
expenses are steadily on the increase leading to high conversion costs. Further productivity and quality levels in the industry in India are found deficient to compete in international market. The alternative is
to resort to automation in areas like preparation, subassembly, assembly including handling, welding etc. Yard contemplates
introduction of systems of latest international standards.
(f) Environment friendly blasting techniques
Blasting of hull units in CSL are undertaken in marine coating shops
under controlled conditions. However, open blasting is resorted on ships in dry docks for building and repairs. Presently granulated copper slag is used for open blasting where pollution is found less
than in case of sand, quartz, copper slag etc which were earlier employed in the yard. Matching with latest technique in this field, yard is examining possibility of deploying environmental friendly

393
blasting techniques like slurry, µ-jet, hydro- blasting, etc. This will reduce pollution to very low levels.
(g) Dry dock 280m x 75m x 13m, for large ships inside yard premises
Or
Ship Lift & transfer system (3000t lightweight ships)
+ Quay 1 extension to northern side.
(i) DRY DOCK + QUAY 1 EXTENSION to northern side
About 35 acres of land on the northern part of the yard set apart for
future expansion is ideal for constructing a dry dock of 280m x 75m x 13m size. Docks No.1 and 2 in the yard were designed for merchant ships and the loading capacity of their floors are considered
insufficient to take concentrated loads of some of the Aircraft Carriers. Indian Navy had expressed their willingness to have a dry dock on joint venture in the premises of Cochin Shipyard. A project report and
a draft MOU in this regard were given to the Navy in March and July 2009 respectively. The proposal is to design and construct the dock
with 50% financial participation from the Navy. Naval ships can be dry docked here with priority based on their annual dry docking schedules. In case there is time slot available other merchant ships
will be taken in this dock for repairs. For the viability of the venture it is also mentioned that at least 50% of the annual dock occupancy by
defence ships is to be ensured by the Navy. The proposal also includes extension of the quay for about 200m into the property of adjacent Fisheries institutions of the Central Government for which inter-
ministerial cooperation is needed. Official comments from the Navy are still awaited on yard‟s proposals.
(ii) SHIP LIFT & TRANSFER SYSTEM + QUAY 1 EXTENSION to
northern side
On the proposal for the joint venture dry dock project Indian Navy
has not come up with any remarks or comments for the last one year. For expansion on the ship repair front, northern end of the yard is the only area available in Cochin Shipyard. Alternatively, it is proposed to
install a suitable ship lift in this area for repair of small ships. This can also be used for erection and launching small ships like
PSV/AHTS built in the yard without depending on availability of dry docks. Dry docks can be dedicated to building and repair of large ships as per their designed sizes. With the limitation in draft at the quayside
and due to the heavy silting in the Ernakulum channel, a ship lift for docking draft up to 4.0m and light weight up to 3000t is under active consideration. This investment is being delayed for a final decision on
the JV proposal with Navy for dry dock. This proposal also includes extension of quay 1 as above.

394
(h) Green Field Shipyard for larger Vessels
Cochin Shipyard has capacity to build up to 1,10,000dwt ships and repair ships up to 1,25,000dwt. So far this is the largest in India.
Present trend in the world is much larger ships for international voyages. Based on the Government guidelines to have new shipyards on the east and west coasts, a green field shipyard for building and
repairing larger ships can be set up at a suitable location in Kerala / West coast. Experience built up by the officers and workmen of this yard will be an added advantage for the success of such a new
venture. Educated manpower available here in plenty can be trained and kept ready by this yard in case there is a concrete proposal for the
same. Free hold land to the extent of 150 to 200 acres with developments like rail-road connectivity, breakwaters (if required), nearby sources for electricity, fresh-water, etc. are to be ensured by
the respective Government for constructing a green field shipyard.
(i) Technology development/ Modernization of infrastructure for specialized and latest technology ships
Presently CSL is equipped to build ships like bulk carriers,
crude oil tankers, cargo ships, passenger ships, dredgers, all types of small ships, naval ships etc. Considering future demand for ships like
LNG/LPG/chemical carriers, high tech off shore vessels, specialized dredgers and conversion jobs of FSO and FPSO etc it is necessary to equip CSL with latest technology in building/ conversion jobs.
Existing facilities are required to be augmented and updating of design and construction techniques are contemplated. Few facilities to be introduced are: slope reception/ disposal facility, vacuum blasting,
robotic blasting, tank coating systems, etc.
18.5.2 Restructuring of Hoogly Dock & Port Engineers Limited (HDPE)
18.5.2.1 M/s IL&FS IDC was appointed as Consultant for conducting
initial techno-commercial feasibility for formation of joint venture and to assist HDPE in a big process management for selection of prospective joint partner. The Consultant has recommended that
HDPE should form JV with a private partner. In the JV, HDPE is to hold 49% or 26% stake while majority of stake (51% or 74%) to remain
with PSP. HDPE to give both its work units on long term lease to the JV Company or opt to give Nazigunge work unit only. The private player is to be selected through an open competitive bidding process
engaged in similar kind of activities having experience in the field of production, planning, production management, design development,
training, marketing, R&D etc. along with financial capabilities. The existence of HDPE will be retained. Further, HDPEL will be restructured before inviting private sector participation. The
expenditure on the proposed restructuring will be approximately

395
Rs.700 crore. Further, an amount of Rs.100 crore is expected to be invested by the private partner for modernization of the facilities/
infrastructure.
18.5.3 Setting up of international Standard Shipyard
18.5.3.1 The Cabinet in its meeting held on 22nd December, 2009 considered the proposal of Ministry of Shipping for transfer of
Hindustan Shipyard Limited (HSL), Visakhapatnam to Ministry of Defence and gave „in principle‟ approval for setting up of a new shipyard of international standard on PPP mode as a joint venture
under MOS. The project report shall be prepared by MOS for a new shipyard, with an appropriate financial structure as a PPP project for
which investment decisions would be taken with the approval of the competent authority in Government of India after due appraisal. Shipping Corporation of India (SCI) has expressed its interest in
participating in shipbuilding venture on PPP basis. SCI is in the process of appointing a Consultant for detailed feasibility study. A joint venture is likely to be set up under PPP mode by the year 2014 at
a cost of approximately Rs.3500 crore.
18.5.4 Grants in Aid for R&D Projects and Conducting Studies in
Shipbuilding
18.5.4.1 Grants in aid to Research and Educational Institutions are provided by the Ministry from time to time for carrying R&D Projects and Conducting Studies in Shipbuilding. The following thrust areas
have been identified:
(a) Developing Basic design and test facilities (b) Expansion of capacities for detailed design (c) Standardisation of Design to encourage series production for
tugs dredgers off shore vessels (b) Energy Conservation & Emission Control and green shipping
and ports (c) Improvement in Communication System (d) Ancillarisation
It is proposed to provide approximately Rs.1000 crores during the
period 2011-2020 for carrying out R&D and Studies in design testing Shipbuilding and ship repair Projects.
18.6. Financing of Projects
18.6.1 Cochin Shipyard Limited
An amount of Rs.5485 crore is expected to be spent on various projects out of Rs. 2035 crore from IEBR and Rs. 3450 crore from private sources/others. A list of projects proposed by for Cochin
Shipyard Limited aimed at capacity extension augmentation improved
396
productivity automation modernization environment and green expansion is annexed.
18.6.2 Hooghly Dock and Port Engineers Limited
Restructuring of HDPEL with GBS of Rs. 700 crores to clean up the balance sheet and joint venture with private partner investing about
Rs.100 crore is envisaged.
18.6.3 Setting up of International Standard Shipyard in lieu of
Hindustan Shipyard Limited
International standard shipyard in lieu of Hindustan Shipyard Limited
through PPP (Rs.3500 crores: Equity component of Rs.1000 crore. Part of the Public equity funded through GBS)
18.6.4 Grants in Aid for R&D Projects and Conducting Studies in Shipbuilding
through GBS support of Rs.500 crores for R&D & Studies in Shipbuilding and Repair with equal contribution from Public and
Private Sector.
A list of the above mentioned projects is at Annexure VII.
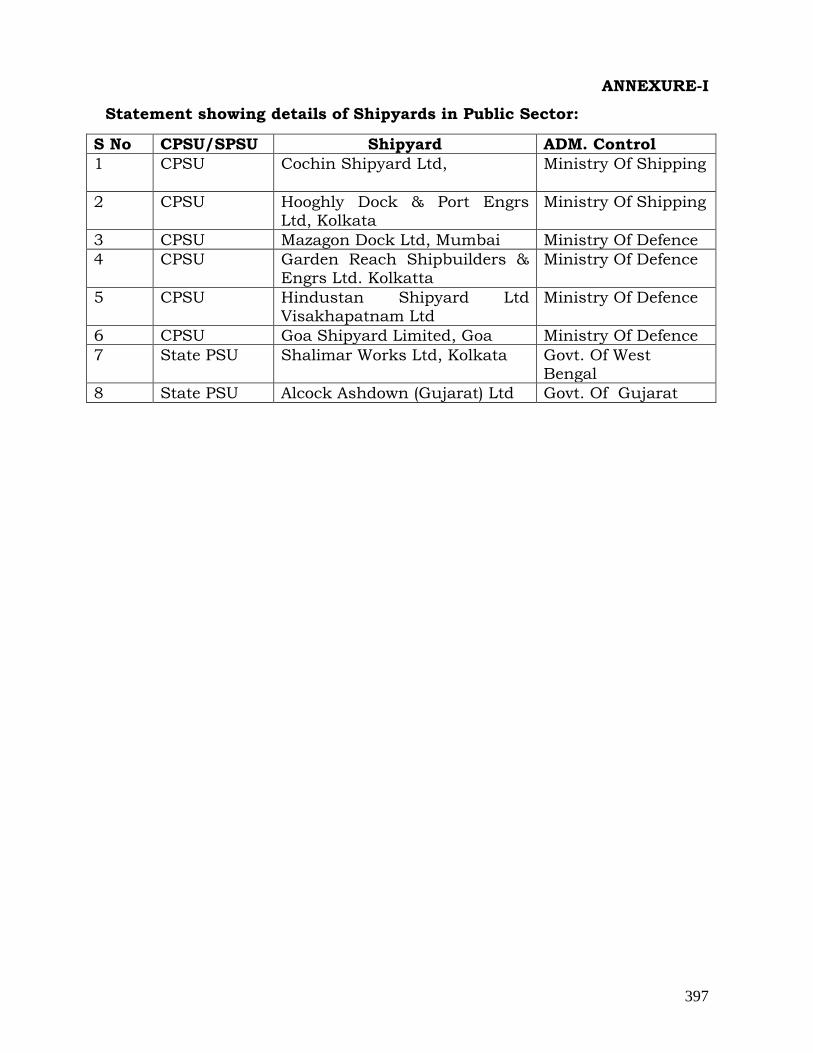
397
ANNEXURE-I
Statement showing details of Shipyards in Public Sector:
S No CPSU/SPSU Shipyard ADM. Control
1 CPSU Cochin Shipyard Ltd,
Ministry Of Shipping
2 CPSU Hooghly Dock & Port Engrs Ltd, Kolkata
Ministry Of Shipping
3 CPSU Mazagon Dock Ltd, Mumbai Ministry Of Defence
4 CPSU Garden Reach Shipbuilders & Engrs Ltd. Kolkatta
Ministry Of Defence
5 CPSU Hindustan Shipyard Ltd Visakhapatnam Ltd
Ministry Of Defence
6 CPSU Goa Shipyard Limited, Goa Ministry Of Defence
7 State PSU Shalimar Works Ltd, Kolkata Govt. Of West Bengal
8 State PSU Alcock Ashdown (Gujarat) Ltd Govt. Of Gujarat
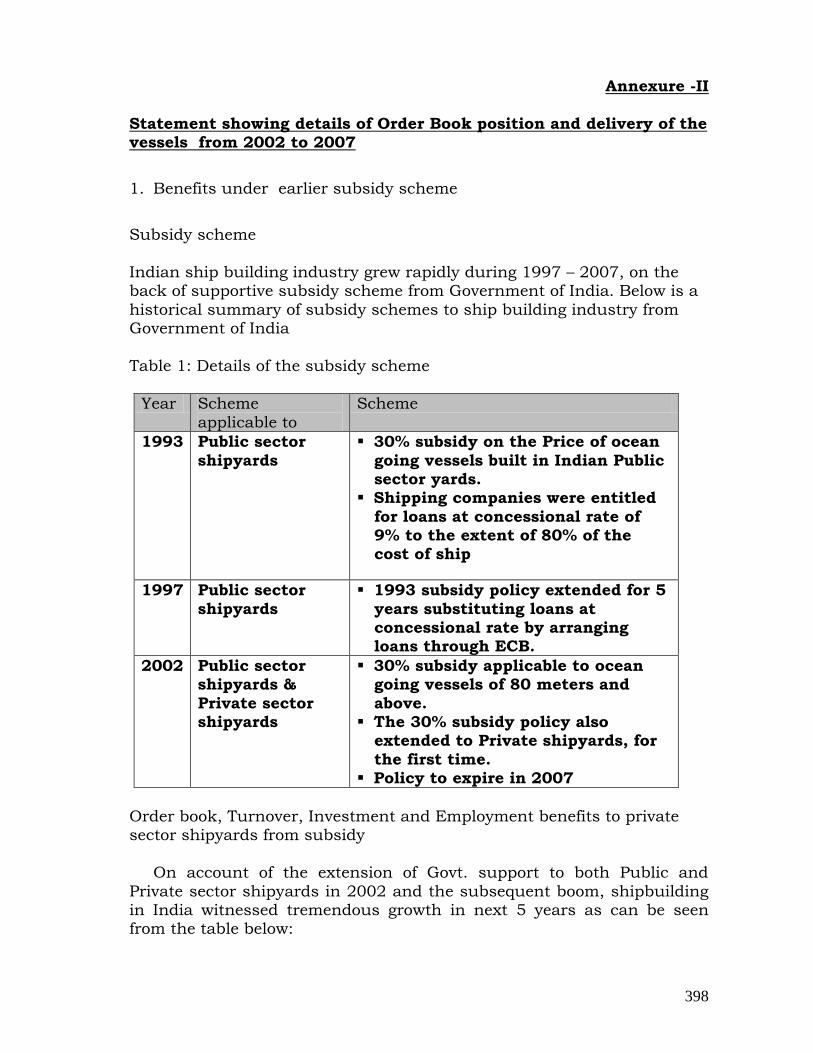
398
Annexure -II
Statement showing details of Order Book position and delivery of the vessels from 2002 to 2007
1. Benefits under earlier subsidy scheme
Subsidy scheme
Indian ship building industry grew rapidly during 1997 – 2007, on the back of supportive subsidy scheme from Government of India. Below is a
historical summary of subsidy schemes to ship building industry from Government of India
Table 1: Details of the subsidy scheme
Year Scheme
applicable to
Scheme
1993 Public sector
shipyards
30% subsidy on the Price of ocean
going vessels built in Indian Public sector yards.
Shipping companies were entitled
for loans at concessional rate of 9% to the extent of 80% of the cost of ship
1997 Public sector
shipyards
1993 subsidy policy extended for 5
years substituting loans at concessional rate by arranging loans through ECB.
2002 Public sector shipyards &
Private sector shipyards
30% subsidy applicable to ocean going vessels of 80 meters and
above. The 30% subsidy policy also
extended to Private shipyards, for
the first time. Policy to expire in 2007
Order book, Turnover, Investment and Employment benefits to private sector shipyards from subsidy
On account of the extension of Govt. support to both Public and
Private sector shipyards in 2002 and the subsequent boom, shipbuilding in India witnessed tremendous growth in next 5 years as can be seen from the table below:

399
Table 2: Benefits to select private sector shipyards from subsidy scheme during 2002-2007
Increase in Order book
from 2002 to 2007 (INR cr)
Increase in
Turnover from 2002 to
2007 (INR cr)
Increase in Investments
from 2002 to 2007 (INR cr)
Increase in Direct
Employment from 2002 to 207 (Nos.)
Amount 17145 2772 3968 6546
Table 3: Benefits to select private sector shipyards from subsidy scheme during 2002-2007
Shipyard Increase in Order book from 2002
to 2007 (INR cr)
Increase in Turnover
from 2002 to
2007 (INR cr)
Increase in Investments from 2002
to 2007 (INR cr)
Increase in Direct Employment
from 2002 to 207 (Nos.)
ABG 8,017 1390 508 1,300
Bharati 4,800 651 264 2,600
Chowgule 660 124 75 585
Tebma 1,450 138 47 572
Pipavav 3540 - 3,000 4906*
CSL 2218 469 74 1491
Total** 20680 2772 3948 11454
Source-SAI and Cochin Shipyard Limited
*Pipavav Shipyard was commissioned after 2007 and the figures indicates the
employment level in 2009 **Figures for L&T are being collected and will be added at the stage of the final Note.
Changing profile of vessels built by India
Till 2002 Indian shipyards used to build simple vessels like Tugs, Asphalt/Bitumen Tankers, General Cargo vessels, Passenger ships etc.
However, after support from government, Indian shipyards expanded their portfolio to include sophisticated vessels like Multi utility craft, Bulk Carriers, and Products Tanker. Additionally Indian shipyards got order
for building Panamax Bulk Carriers1 also.
1 Currently Pipavav shipyard alone has orders for 21 Panamax Bulk Carrier. Source: Pipavav
shipyard
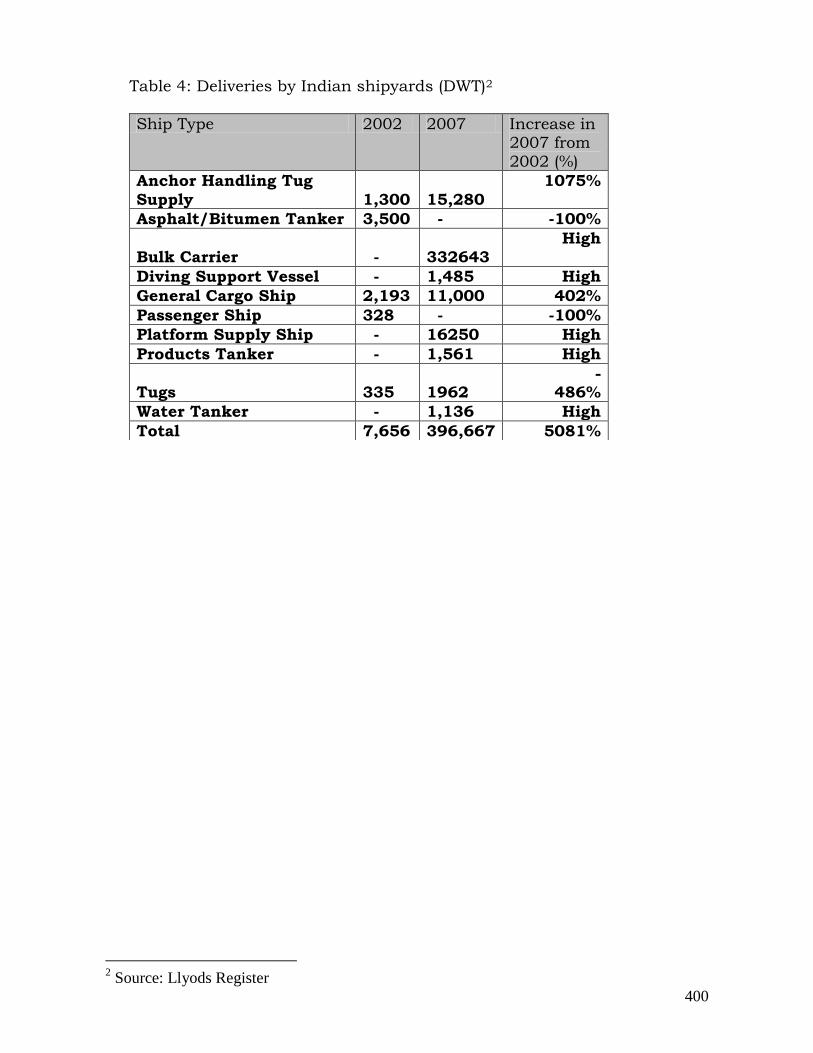
400
Table 4: Deliveries by Indian shipyards (DWT)2
2 Source: Llyods Register
Ship Type 2002 2007 Increase in 2007 from
2002 (%)
Anchor Handling Tug
Supply 1,300 15,280
1075%
Asphalt/Bitumen Tanker 3,500 - -100%
Bulk Carrier - 332643
High
Diving Support Vessel - 1,485 High
General Cargo Ship 2,193 11,000 402%
Passenger Ship 328 - -100%
Platform Supply Ship - 16250 High
Products Tanker - 1,561 High
Tugs 335 1962 -
486%
Water Tanker - 1,136 High
Total 7,656 396,667 5081%
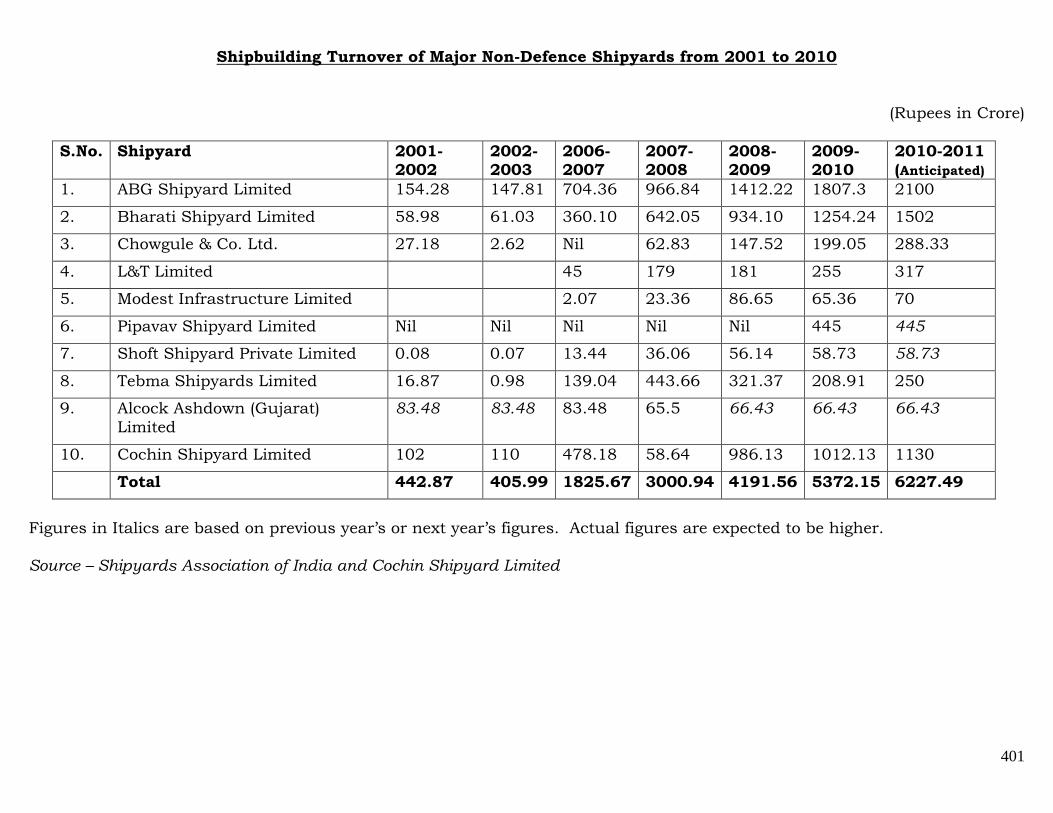
401
Shipbuilding Turnover of Major Non-Defence Shipyards from 2001 to 2010
(Rupees in Crore)
S.No. Shipyard 2001-2002
2002- 2003
2006- 2007
2007- 2008
2008- 2009
2009- 2010
2010-2011 (Anticipated)
1. ABG Shipyard Limited 154.28 147.81 704.36 966.84 1412.22 1807.3 2100
2. Bharati Shipyard Limited 58.98 61.03 360.10 642.05 934.10 1254.24 1502
3. Chowgule & Co. Ltd. 27.18 2.62 Nil 62.83 147.52 199.05 288.33
4. L&T Limited 45 179 181 255 317
5. Modest Infrastructure Limited 2.07 23.36 86.65 65.36 70
6. Pipavav Shipyard Limited Nil Nil Nil Nil Nil 445 445
7. Shoft Shipyard Private Limited 0.08 0.07 13.44 36.06 56.14 58.73 58.73
8. Tebma Shipyards Limited 16.87 0.98 139.04 443.66 321.37 208.91 250
9. Alcock Ashdown (Gujarat)
Limited
83.48 83.48 83.48 65.5 66.43 66.43 66.43
10. Cochin Shipyard Limited 102 110 478.18 58.64 986.13 1012.13 1130
Total 442.87 405.99 1825.67 3000.94 4191.56 5372.15 6227.49
Figures in Italics are based on previous year‟s or next year‟s figures. Actual figures are expected to be higher.
Source – Shipyards Association of India and Cochin Shipyard Limited

402
Annexure III
Table based on cost profile of the industries in China and Korea and the corresponding key items impacting the cost differential
Cost Disadvantages Versus Foreign Yards (%)
Sector Domestic Sale
Export Sale
China Korea China Korea
Differential Impact of Statutory Levies
CD, ED, VAT and Octroi 8.30% 8.30% 2.91% 2.91%
Service Tax 1.48% 1.48% 1.48% 1.48%
Corporate Tax 1.40% - 1.40% -
Cost Differential on account of Financial Charges
Charges towards Bank Guarantees
0.86% 0.86% 0.86% 0.86%
Interest on Working Capital
2.60% 1.60% 2.60% 1.60%
Inerest on Capital Expenditure
0.74% 0.74% 0.74% 0.74%
Insurance Charges 0.40% 0.40% 0.40% 0.40%
Cost Differential on account of Import Dependence
Sea Freight Differentials 3.90% 4.32% 3.90% 4.32%
Clearing and Fowarding 0.30% 0.66% 0.30% 0.66%
Other Costs due to Exernal Factors
Bulk purchase discounts
on purchase on inputs
3.25%-6.50% 3.25%-
6.50%
3.25%-
6.50%
3.25%-
6.50%
Forex Rate Disadvantages
23.33% - 23.33% -
Total Cost Disadvantage
47%-50% 22%-25% 41%-44%
16%-19%
Price Disadvantage due to Discount
5%-10% 15%-20% 5%-10%
15%-20%
Total Disadvantage 52%-60% 37%-45%
46%-54%
31%-39%
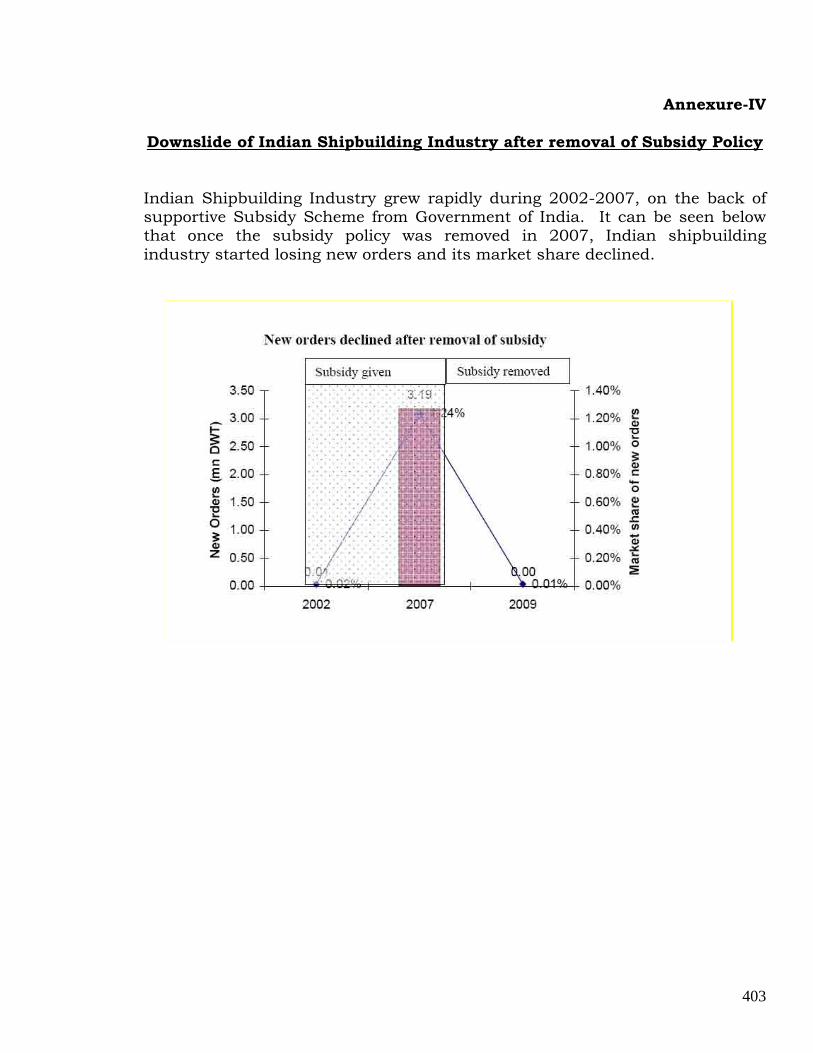
403
Annexure-IV
Downslide of Indian Shipbuilding Industry after removal of Subsidy Policy
Indian Shipbuilding Industry grew rapidly during 2002-2007, on the back of supportive Subsidy Scheme from Government of India. It can be seen below that once the subsidy policy was removed in 2007, Indian shipbuilding
industry started losing new orders and its market share declined.
404
Annexure V
Extracts from the Prime Minister’s Group on “Measures for ensuring
sustained growth of the Indian manufacturing sector”, National Manufacturing Competitiveness Council (NMCC)
A.4 NMCC’s recommendation for developing Indian ship building Industry
India has a vast coastline as well as a huge external trade requiring large fleet of ships both for civilian and military purposes. With increasing
incomes demand for cruise vessels is also increasing. The existing facilities for shipbuilding are inadequate even for the limited demand at
present let alone the demand that would be generated by high growth. India‟s emergence as a major economic power would mean greater integration in terms of trade with the rest of the world requiring huge
shipping tonnage. Also, the need for strengthening the naval forces would place an extra urgency on ship building activities. Therefore, a
comprehensive plan to enhance domestic ship building needs to be drawn up.
Prepare on an urgent basis a comprehensive plan to enhance domestic ship building capabilities and building large new shipyards.
Adopt a Mission mode approach for the purpose. In this context, the
examples of both Korea and China be studied; and
A continuing mechanism be evolved to synergize the efforts of the naval
authorities under Ministry of Defence and the Ministry of Shipping for meeting long term requirements of the country”
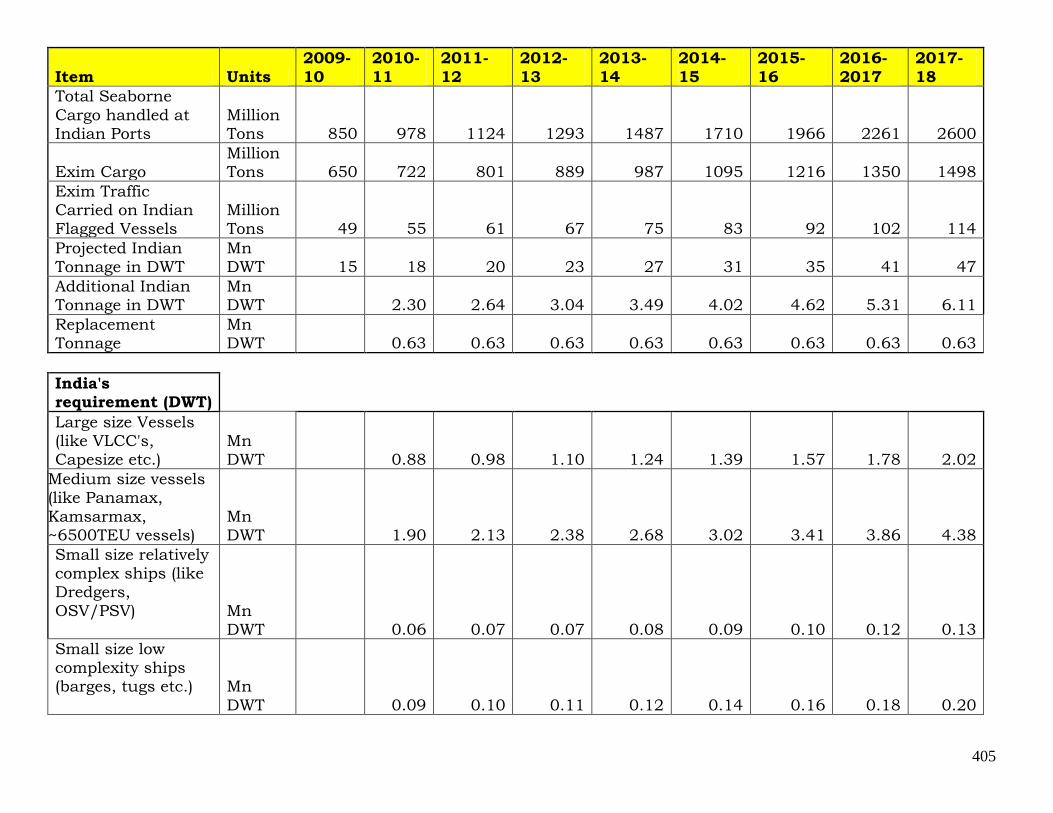
405
Item Units
2009-
10
2010-
11
2011-
12
2012-
13
2013-
14
2014-
15
2015-
16
2016-
2017
2017-
18
Total Seaborne
Cargo handled at Indian Ports
Million Tons 850 978 1124 1293 1487 1710 1966 2261 2600
Exim Cargo Million Tons 650 722 801 889 987 1095 1216 1350 1498
Exim Traffic Carried on Indian Flagged Vessels
Million Tons
49 55 61 67 75 83 92 102 114
Projected Indian Tonnage in DWT
Mn DWT
15 18 20 23 27 31 35 41 47
Additional Indian Tonnage in DWT
Mn DWT
2.30
2.64
3.04
3.49
4.02
4.62
5.31
6.11
Replacement Tonnage
Mn DWT
0.63
0.63
0.63
0.63
0.63
0.63
0.63
0.63
India's requirement (DWT)
Large size Vessels (like VLCC's, Capesize etc.)
Mn DWT 0.88 0.98 1.10 1.24 1.39 1.57 1.78 2.02
Medium size vessels (like Panamax,
Kamsarmax, ~6500TEU vessels)
Mn DWT 1.90 2.13 2.38 2.68 3.02 3.41 3.86 4.38
Small size relatively complex ships (like Dredgers,
OSV/PSV)
Mn DWT 0.06 0.07 0.07 0.08 0.09 0.10 0.12 0.13
Small size low complexity ships (barges, tugs etc.)
Mn
DWT 0.09 0.10 0.11 0.12 0.14 0.16 0.18 0.20

406
India's
requirement (DWT) for New Vessels
Large size Vessels
(like VLCC's, Capesize etc.)
Mn DWT 0.53 0.59 0.66 0.74 0.84 0.94 1.07 1.21
Medium size vessels (like Panamax,
Kamsarmax, ~6500TEU vessels)
Mn DWT 1.14 1.28 1.43 1.61 1.81 2.05 2.32 2.63
Small size relatively
complex ships (like Dredgers,
OSV/PSV)
Mn
DWT 0.04 0.04 0.04 0.05 0.06 0.06 0.07 0.08
Small size low
complexity ships (barges, tugs etc.)
Mn DWT 0.05 0.06 0.07 0.07 0.08 0.09 0.11 0.12
Deliveried planned as per the current Orderbook (Mn
DWT)
Large size Vessels
(like VLCC's, Capesize etc.)
Mn DWT 0.00 0.00 0.00 0.51 0.51 0.00 0.00 0.00
Medium size vessels (like Panamax, Kamsarmax,
~6500TEU vessels)
Mn
DWT 0.35 1.39 0.90 0.00 0.00 0.00 0.00 0.00
Small size relatively
complex ships (like Dredgers,
OSV/PSV)
Mn
DWT 0.02 0.01 0.00 0.00 0.00 0.00 0.00 0.00
Small size low complexity ships
(barges, tugs etc.)
Mn
DWT 0.00 0.00 0.00 0.00 0.00 0.00 0.00 0.00
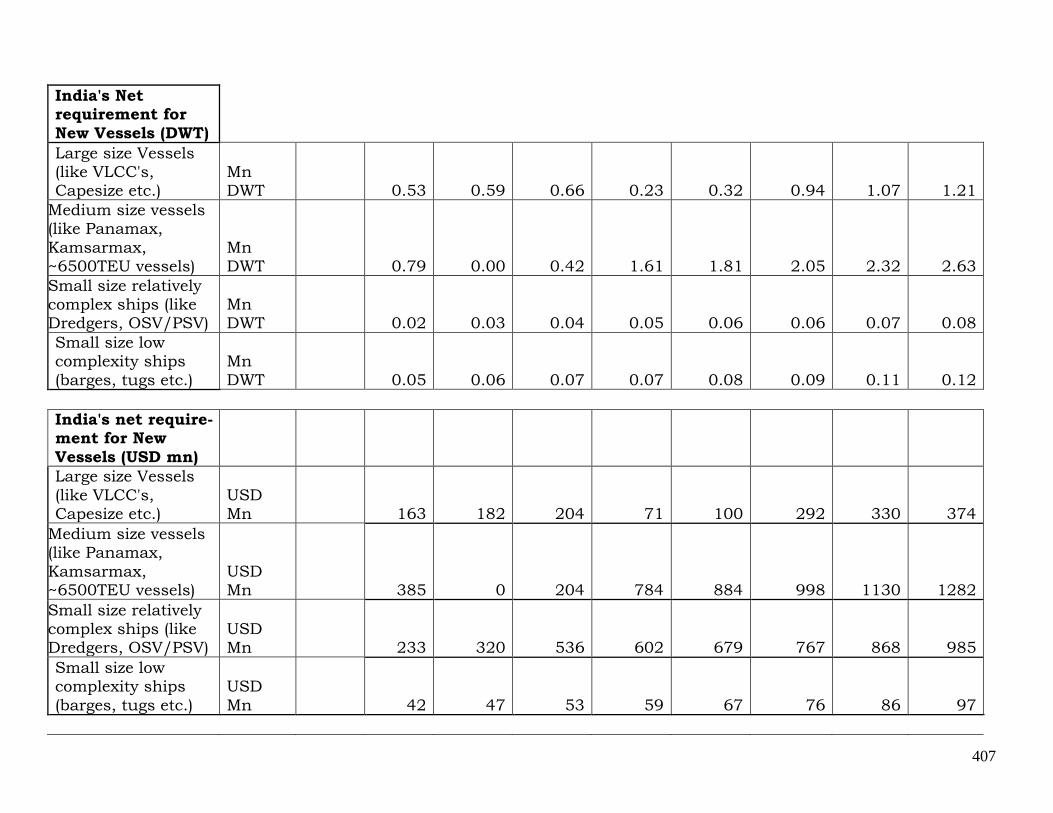
407
India's Net requirement for
New Vessels (DWT)
Large size Vessels (like VLCC's, Capesize etc.)
Mn DWT 0.53 0.59 0.66 0.23 0.32 0.94 1.07 1.21
Medium size vessels (like Panamax,
Kamsarmax, ~6500TEU vessels)
Mn DWT 0.79 0.00 0.42 1.61 1.81 2.05 2.32 2.63
Small size relatively complex ships (like Dredgers, OSV/PSV)
Mn DWT 0.02 0.03 0.04 0.05 0.06 0.06 0.07 0.08
Small size low complexity ships
(barges, tugs etc.)
Mn
DWT 0.05 0.06 0.07 0.07 0.08 0.09 0.11 0.12
India's net require- ment for New
Vessels (USD mn)
Large size Vessels
(like VLCC's, Capesize etc.)
USD Mn 163 182 204 71 100 292 330 374
Medium size vessels (like Panamax,
Kamsarmax, ~6500TEU vessels)
USD Mn 385 0 204 784 884 998 1130 1282
Small size relatively complex ships (like Dredgers, OSV/PSV)
USD Mn 233 320 536 602 679 767 868 985
Small size low complexity ships
(barges, tugs etc.)
USD
Mn 42 47 53 59 67 76 86 97
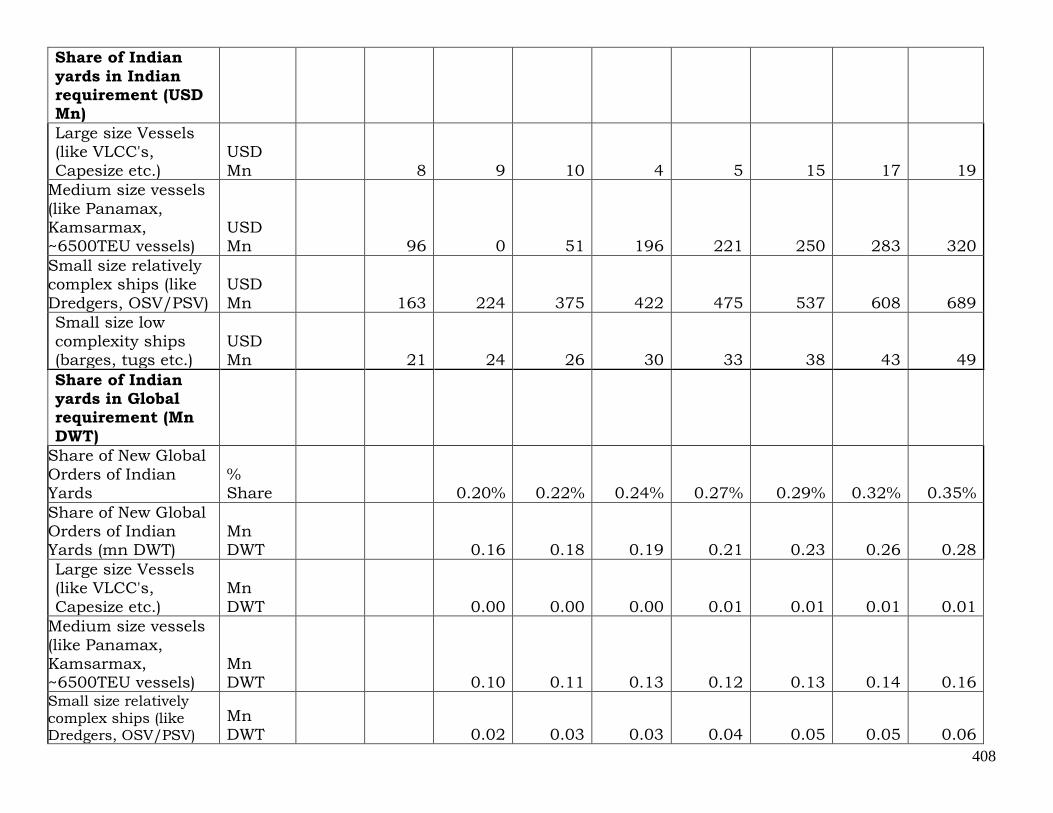
408
Share of Indian
yards in Indian requirement (USD Mn)
Large size Vessels (like VLCC's,
Capesize etc.)
USD
Mn 8 9 10 4 5 15 17 19
Medium size vessels
(like Panamax, Kamsarmax, ~6500TEU vessels)
USD Mn 96 0 51 196 221 250 283 320
Small size relatively complex ships (like
Dredgers, OSV/PSV)
USD
Mn 163 224 375 422 475 537 608 689
Small size low
complexity ships (barges, tugs etc.)
USD Mn 21 24 26 30 33 38 43 49
Share of Indian yards in Global requirement (Mn
DWT)
Share of New Global
Orders of Indian Yards
% Share 0.20% 0.22% 0.24% 0.27% 0.29% 0.32% 0.35%
Share of New Global Orders of Indian Yards (mn DWT)
Mn DWT 0.16 0.18 0.19 0.21 0.23 0.26 0.28
Large size Vessels (like VLCC's,
Capesize etc.)
Mn
DWT 0.00 0.00 0.00 0.01 0.01 0.01 0.01
Medium size vessels
(like Panamax, Kamsarmax, ~6500TEU vessels)
Mn DWT 0.10 0.11 0.13 0.12 0.13 0.14 0.16
Small size relatively complex ships (like Dredgers, OSV/PSV)
Mn DWT 0.02 0.03 0.03 0.04 0.05 0.05 0.06
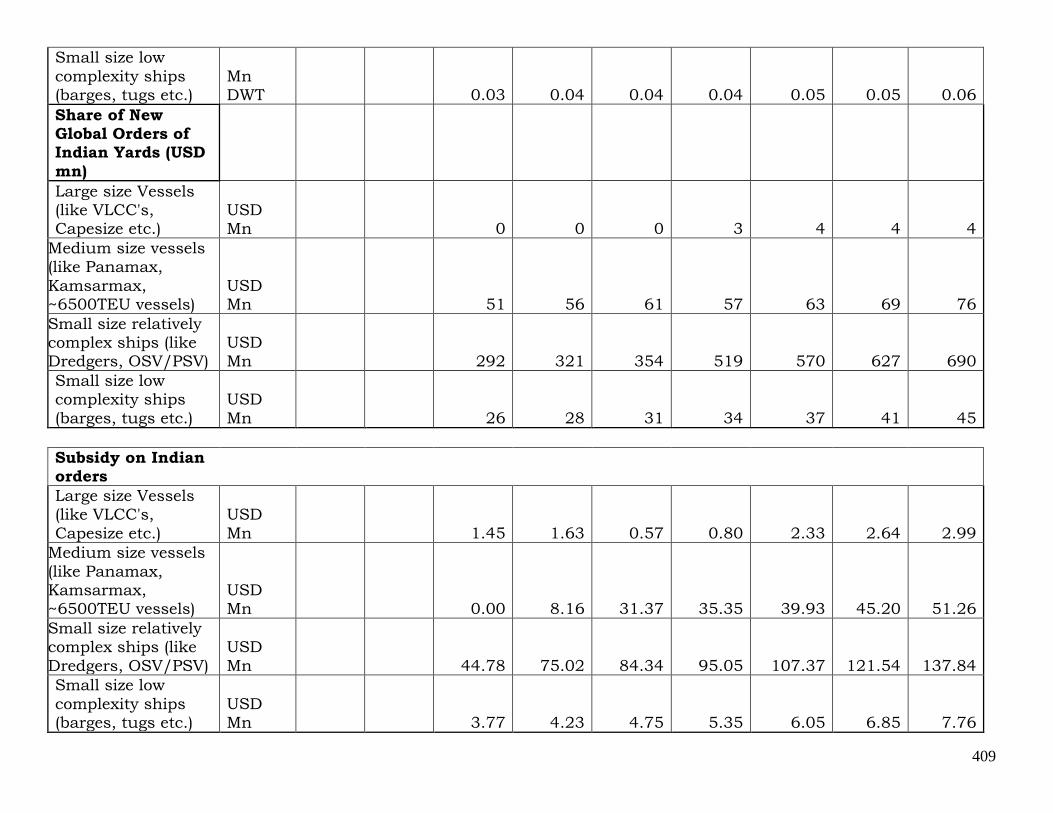
409
Small size low
complexity ships (barges, tugs etc.)
Mn DWT 0.03 0.04 0.04 0.04 0.05 0.05 0.06
Share of New Global Orders of Indian Yards (USD
mn)
Large size Vessels (like VLCC's, Capesize etc.)
USD Mn 0 0 0 3 4 4 4
Medium size vessels (like Panamax,
Kamsarmax, ~6500TEU vessels)
USD Mn 51 56 61 57 63 69 76
Small size relatively complex ships (like Dredgers, OSV/PSV)
USD Mn 292 321 354 519 570 627 690
Small size low complexity ships
(barges, tugs etc.)
USD
Mn 26 28 31 34 37 41 45
Subsidy on Indian orders
Large size Vessels (like VLCC's,
Capesize etc.)
USD
Mn 1.45 1.63 0.57 0.80 2.33 2.64 2.99
Medium size vessels
(like Panamax, Kamsarmax, ~6500TEU vessels)
USD Mn 0.00 8.16 31.37 35.35 39.93 45.20 51.26
Small size relatively complex ships (like
Dredgers, OSV/PSV)
USD
Mn 44.78 75.02 84.34 95.05 107.37 121.54 137.84
Small size low
complexity ships (barges, tugs etc.)
USD Mn 3.77 4.23 4.75 5.35 6.05 6.85 7.76
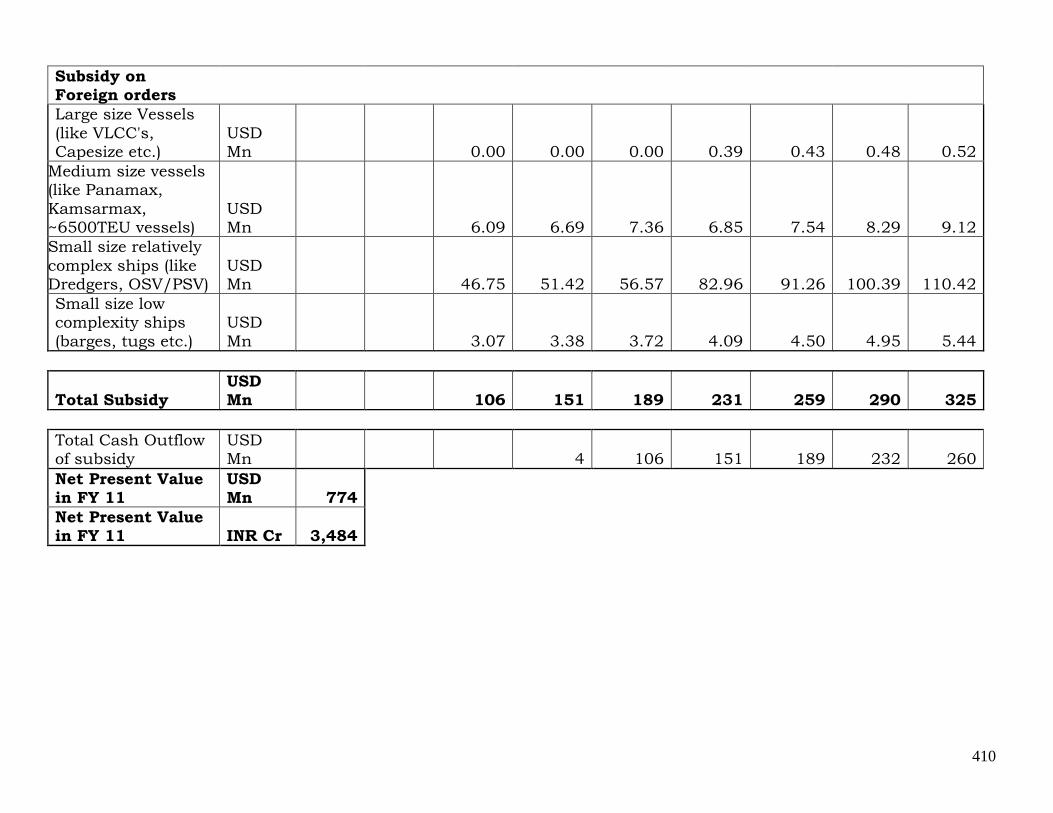
410
Subsidy on Foreign orders
Large size Vessels
(like VLCC's, Capesize etc.)
USD Mn 0.00 0.00 0.00 0.39 0.43 0.48 0.52
Medium size vessels (like Panamax,
Kamsarmax, ~6500TEU vessels)
USD Mn 6.09 6.69 7.36 6.85 7.54 8.29 9.12
Small size relatively
complex ships (like Dredgers, OSV/PSV)
USD Mn 46.75 51.42 56.57 82.96 91.26 100.39 110.42
Small size low complexity ships
(barges, tugs etc.)
USD
Mn 3.07 3.38 3.72 4.09 4.50 4.95 5.44
Total Subsidy USD Mn 106 151 189 231 259 290 325
Total Cash Outflow of subsidy
USD Mn 4 106 151 189 232 260
Net Present Value in FY 11
USD Mn 774
Net Present Value in FY 11 INR Cr 3,484

411
Annexure VII Shipbuilding and Repair Sector
Projects Identified for the period April 2010 to March 2020
S. No.
Name of Project Agency Est. cost
Funding Pattern Project Start
Expected completion GBS IEBR Private/
Other
Capacity Extension and Greenfield Expansion
1. Greenfield Shipyard for large ships (VLCC) CSL 3500 500 3000 2012 2017
2 Dry Dock 280Mx75Mx13M for Aircraft Carrier and larger ships OR Ship Lift and Transfer System (3000T lightweight ships) + North Side Ext. Quay 1
CSL 1500 1050 450 2012 2016
3 Southern Side extension to Quay 3 CSL 55 55 2010 2013
4 International Standard Shipyard under PPP MoS/SCI 3500 250 250 3000 2011 2014
Automation & improved productivity
5 Implementation of World Class Project Management System (ERP) CSL 50 50 2011 2014
6. Siltation control at quay sides CSL 100 100 2012 2016
7 Automation of fabrication/welding facilities 50 50 2012 2015
8 Technology development/ Modernisation of Infrastructure for specialized and latest technology ships
CSL 150 150 2015 2020
Research & Development
9 Environment friendly blasting techniques CSL 50 50 2012 2014
10 R&D Projects and Studies in Shipbuilding MoS/IMU 1000 500 500 2011 2020
Human Resources Development
11 Augmenting facilities for increasing intake of Marine Engineering Trainees and develop training for highly skilled manpower
CSL 30 30 2011 2014
Restructuring & Rehabilitation
12 Restructuring of Hooghly Dock and Port Engineers Limited HDPEL /MoS 700 700 2011 2012
13 Restructuring of Hooghly Dock and Port Engineers Limited through Formation of JV
HDPEL 100.00 100 2011 2014
TOTAL 10785 1450 2285 7050
412
CHAPTER-19
INLAND WATERWAYS
19.1. INTRODUCTION:
An efficient transport sector, particularly for transportation of bulk goods, is vital for development of economy of any country. Railways, roadways, inland waterways, pipelines and coastal shipping are the important modes of
transportation of bulk goods. In the liberalised economy, in which the private and public sectors is expected to contribute large share in the GDP, it is necessary that Government takes adequate measures to develop all these transport modes
so that the industries are able to provide least cost of production to the consumers by utilising optimum mix of transport network using strengths of each of these
modes on case to case basis.
In India, the Rail and Road (which are the main modes of transportation of bulk
cargo) are overburdened and saturated and their large scale capacity enhancement is very difficult. Inland Water Transport (IWT) is a fuel efficient, environment friendly and cost effective mode of transport (especially for bulk
goods, hazardous goods and over dimensional cargo) having potential to supplement the over burdened rail and congested roads. India has many rivers,
canals, creeks etc. which can be developed as commercially viable waterways providing port- hinterland connectivity. It is therefore necessary that IWT mode is developed to a level at which it becomes competitive in a multi-modal transport
network.
Development of IWT offers several distinct advantages. IWT routes are developed
along existing rivers/ canals and do not require extensive land acquisition; the per km cost of development of waterways is about 5 to 10% of the cost of developing an equivalent four lane expressway or railway. Maintenance cost of inland
waterways is of the order of 20% of that of road. IWT, in most situations is the most economical, least energy consuming and least hazardous mode of
transportation, as may be seen from Annexure-1. However, the development of this mode has been grossly neglected for a long time and consequently, the share of IWT today is just 0.4 % (in terms of tonne-km). Till1986, there was even no
Institutional body to oversee its development which resulted in practically insignificant investment for its development compared to Rail and Road
infrastructure.
For inland waterways to become a commercially viable mode of transport, it is
necessary that three basic infrastructural facilities are developed and maintained. These are: (i) depth and width required for movement of inland vessels for round
the year operation; (ii) terminals for loading and un-loading of cargo; and (iii) navigation aids for safe navigation during day and night. Once these basic

413
infrastructure are provided/ maintained with adequate reliability only then one can expect that the forth critical element, „the inland vessels for carriage of cargo‟
shall be developed mainly with private sector‟s investment.
But investment made for creation of these infrastructure had been negligible
compared to road and rail sectors due to which except in some regions e.g. Goa, West Bengal, Assam, Kerala and Mumbai (where IWT has natural advantages) and
NW-1, 2 & 3 (which are being developed by IWAI), these infrastructure are still inadequate to make this mode a commercially viable proposition for private sector to invest in acquisition and operation of IWT vessels. Therefore major thrust
has to be given on creation of this infrastructure and at the same time steps have also to be taken for augmentation of IWT fleet primarily by private sector.
The Inland Waterways Authority of India (IWAI) was set up in 1986 for development and regulation of inland waterways. For executing projects for
development of NWs, IWAI receives grant from Ministry of Shipping (MoS). There also is a new Central Sector Scheme for development of IWT in North Eastern
states under which funds are released to States by MoS but assistance in sanctioning and implementing the projects by the State Govts is provided by IWAI to MoS.
IWAI‟s primary responsibility is development and regulation of National Waterways (NW). In this process, the Authority carries out surveys, bandalling and dredging
for improving/maintaining depth in navigational channel and provides other infrastructural facilities namely, terminals and navigational aids on national
waterways. It also undertakes techno economic feasibility studies and detailed project reports to assess development potential of other waterways. The Authority also advises Central Government on matters related to IWT.
In the initial years of IWAI, the funds allocated to it were meager therefore, in the initial 11 years from 1986-87 to 1996-97 it could invest only Rs 71 crore in
development/ maintenance of this IWT infrastructure on NW 1, 2 & 3. The level of investment increased to some extent from 9th Plan (1996-97 to 2001-02) when it
spent Rs 151 crores and thereafter to 385 crore in 10th Plan and Rs 360 crores in first three and half years of 11th Plan. Still since 1986-87, the total investment made by IWAI on IWT infrastructure is less than Rs 1,000 crore; which is insignificant compared to investments made in Rail and Road sectors. Hence, it is also necessary that quantum jump in public investment is made to develop IWT sector if the wish to utilize the potential of this fuel efficient,
cost effective and environment friendly mode of transport, since by not using it to its potential the country is paying price in terms of lost
opportunity cost.
414
19.2. Vision:
The vision/objective of development of inland waterways of the country is their increased utilization for transportation of cargo to about 20 billion tonne km by 2020 (from present level of about 4.0 billion tonne km).
19.3. Mission:
19.3.1 To develop all potential inland waterways with adequate IWT infrastructure both through public and private funding to make them a commercially viable mode for transportation of goods to act as supplementary mode of transport with
respect to rail and road modes.
19.4 Strategy:
Since this sector remained totally neglected over many decades while
conceptualizing its development strategy it is necessary to take a holistic picture of the sector and aim for its development in an integrated manner touching upon all relevant aspects simultaneously. This would call for a Paradigm shift in
approach to development of IWT during the decade (2010-2020). Such a Paradigm shift was also considered/ analyzed in depth by the Working Group on Shipping
and IWT for preparation of the 11th Plan [which was headed by Secretary (Shipping)]. Since this suggested Paradigm shift could not be acted upon due to inadequate funding provided to the sector during the 11th Plan and also since
IWAI could not be strengthened as an organization to absorb higher level of funds, it still holds good for perspective planning of development of IWT sector for the
decade 2010-2020. Based on the development perspective suggested by the Working Group for 11th Plan, „the Perspective Plan 2010-20‟ is proposed to include (a) development of IWT infrastructure namely; reliable fairway with assured least
available depth for round the year and round the clock navigation, terminals for berthing of vessels and interface with rail and road modes on all National Waterways as well as other waterways to make them fully functional for
commercially viable operations, (b) Quantum jump in public funding for development of IWT sector, (c) identification and implementation of projects for
specific cargo transportation with PPP funding, (d) Connecting remote areas by adopting fish bone model and development of State waterways, (e) Up-gradation of Indo – Bangladesh IWT & T Protocol routes, (f) Development of IWT training
institutes in States and their integration with NINI, (g) Promoting river tourism/ cruises, (h) Taking steps for IWT fleet augmentation by private sector, (i)
Encouraging modal shift to IWT mode through incentives, (j) providing incentives for modernization/up-gradation of country boats, (k) integration of Inland waterways and coastal shipping modes; and (l) Institutional capacity building of
IWAI and State level IWT set ups.

415
19.5. Present status:
There are five NWs namely (i) the Ganga from Haldia to Allahabad (NW-1, 1620 km), (ii) the Brahmaputra from Dhubri to Sadiya (NW-2, 891 km), (iii) the West
Coast Canal from Kottapuram to Kollam along with Udyogmandal and Champakara canals (NW-3, 205 km), (iv) the Kakinada-Puducherry stretch of
Canals with Godavari and Krishna rivers (NW-4, 1078 km) and (v) the East Coast Canal with Brahmani river and Mahanadi delta (NW-5, 588 km). These waterways were declared as NWs in 1986, 1988, 1993, 2008 and 2008
respectively. In addition, declaration of Barak river from Lakhipur to Bhanga (121 km) as sixth NW is under consideration of the Ministry.
After formation of IWAI in October 1986, systematic and sustained efforts to develop IWT mode started. But during initial years (i.e upto 8th Plan) IWAI could not be provided with significant funding. From 9th Plan onwards, funding pattern
of IWAI somewhat improved. In the entire 8th plan the investment for IWT infrastructure was only of the order of Rs. 35cr. This rose to Rs.151cr during the
9th plan, and further to Rs 385 cr in 10th Plan. In first 3years of 11th Plan IWAI has utilized Rs 310 cr. However, the total investment made for its development since independence is still insignificant when compared to Road and Rail.
On NW-1, 2 & 3, IWAI is developing IWT infrastructure. For NW-4 & 5 efforts are being made to develop more commercially viable stretches in initial phase through PPP mode. There is a Central Sector Scheme for development of waterways of
North Eastern States under which one project of Govt of Mizoram has been sanctioned.
IWAI is implementing projects for making National Waterways 1,2 & 3 fully functional by March 2012 . This envisages fairway with 3 m/2m/1.5 m depth, a
judicious mix of fixed and floating terminals and facilities for 24 hrs navigation alongwith DGPS connectivity. Some important projects have already been implemented/ advanced significantly under this process as explained below:
IWAI has 11 dredgers on NW-1, 2 and 3 (of these 3 are added in 2010) and 6 more
are being added in next one year. With this, IWAI shall be trying to provide higher LAD in NW-1 and 2, [ 3 m in Haldia-Farakka (against 2.5 m at present), 2.5 m in Farakka- Patna (against 2.0 m at present), 2 m between Patna and Varanasi for
330 days (against 270 days at present) in NW-1 and 2.5 m between Dhubri and Neamati (against 2.0 m at present)]. With these depths, viability of IWT operations
on NW-1 and 2 shall increase.
Low level jetties of permanent river terminals at Patna and Pandu have been
constructed and high level Jetties at these places are under construction. Two more permanent terminals are being constructed at Varanasi and Kolkata. On NW-3, nine permanent terminals have been constructed and one more is under
416
construction. In addition, floating pontoon jetties have been set up at 16 places on NW-1 and 7 places on NW 2.
National Inland Navigation Institute (NINI) was set up by IWAI to train IWT personnel, particularly the crew for inland vessels and has been imparting
training since February 2004. Training programmes are also being conducted for personnel of paramilitary forces.
IWAI is also working on some projects for specific movement of bulk cargo by IWT mode. One of the important projects in this respect was movement of coal from
Haldia to Farakka and Kahalgaon for the power plants of NTPC. Another interesting potential is the possibility of movement of project cargo to several hydro-power projects coming up in Arunachal Pradesh on various tributaries of
Brahmaputra.
There had been many successful movements of Over Dimensional Cargo (ODC) on
NW-1, 2, and 3 in last two years. Considering that IWAI has upgraded IWT infrastructure on NW-1, 2 and 3 and based on interaction. IWAI had with various
project promoters and logistics operators, it is expected that ODC movement on NWs, is going increase substantially in coming years. Therefore from 1st January 2010 IWAI has started levying user charges @ Rs.1.50 per tonne per km for
movement of ODC on NW-1, 2 and 3.
Cargo movement by IWT sector has been showing increasing trend over the years. However, the increase is mainly in Goa and Mumbai Waterways. It has increased from 45.6 million tones in 2004-5 to 69.7 million tones in 2009-10. Fly ash
export through IWT from Kolkata/Haldia to Bangladesh has also increased from 4.78 lakh tonnes in 2005-06 to over 13 lakh tonnes in 2009-10. Operation of inland cruise vessels has also increased substantially on NW-1, 2 &3 in last five
years or so.
Detailed Project Reports for NW-4 & 5 have been prepared and as advised by the
Planning Commission, efforts are being made to explore the possibility of developing these NWs in a phased (prioritized) manner in PPP mode. Declaration of one more waterway i.e Barak river as National Waterway is also under
consideration.
IWAI was appointed by Ministry of External Affairs (MEA) as Project Development
Consultant (PDC) for implementation of Kaladan Multimodal Transit Transport Project in Myanmar. The project is piloted and funded by MEA. It provides
alternative connectivity (through road, IWT & merchant shipping) of Mizoram with Kolkata through Myanmar. IWAI modified the DPR prepared by RITES and selected successful bidder to be the main contractor for the project. MEA
accordingly has signed the agreement with the main contractor i.e. M/s. Essar Projects.

417
19.6. Proposed projects:
With the foregoing strategy, following projects are proposed under this perspective plan:
A) On going projects
Making National Waterway - 1 fully functional: As mentioned earlier, IWAI is implementing Action Plan for making NW 1 fully functional by March 2012. This
Action Plan envisaged investment of Rs 445 cr from 2007 – 08 to 2011-12. Out of this, Rs 133 cr have been spent up to March 2010. Therefore, balance
requirement up to 2012 is Rs 312 cr. Under this Action Plan targeted basic IWT infrastructure namely navigational channel, terminals and navigation aids will be provided after which it is expected that the private sector shall start investing on
operation of inland vessels since these shall become commercially viable. The entire funding for this project shall be through public funds.
Making National Waterway 2 fully functional: Like NW 1, Action Plan for making NW 2 fully functional is also under implementation. Out of the total requirement
of Rs 187 cr for the period 2007-12, Rs 110 cr have been spent during 2007-10. Hence, there is balance requirement of Rs 77 cr which is proposed to be funded through budgetary sources.
Making NW-3 fully functional: Action Plan for making NW 3 fully functional is
also under implementation. Due to problems being encountered in completing capital dredging between Allapuzha-Kollam, this project is likely to be completed only by March 2013. Out of total requirement of Rs 143 cr for the period from
2007-13, Rs 53 cr have been spent during 2007-10 and the balance requirement of 2010-13 is Rs 90 cr which also is proposed to be funded through budgetary
sources.
NINI and setting up of SCTCs: It is proposed that the National Inland
Navigation Institute functioning at Patna since 2004 shall be upgraded. Moreover, State Crew Training Centres (SCTC) should be set up in some of the riverine
States and these should be networked with NINI. A provision of Rs 100 cr for this purpose as budgetary support to IWAI/respective State Govts is proposed for this project.
Joint Venture (PPP projects) : The three JV Companies already formed by IWAI for acquisition and operation of cargo vessels on NW-1 & 2 require equity of
Rs 11 cr by IWAI. As per Act, IWAI can enter into JV for IWT activities. There are good possibilities for forming JVs for construction of terminals, operation of vessels etc for which some spade work has been made. A provision of Rs 400 cr is
proposed to meet IWAI‟s contribution in these projects (@ 3:2 debt equity ratio) The corresponding EBR component shall be Rs 2100 cr. Thus the total outlay
proposed is Rs 411 cr (BS) and Rs 2511 cr under EBR.
418
IWT promotion activities: At the present stage of development of IWT, it is necessary that IWT promotion activities namely demonstrative cargo
transportation voyages by IWAI, seminars, conferences and other promotional measures for IWT sector are carried out. For this purpose, a provision of Rs 50 cr
@ Rs 10 cr per year for the period 2010-20 is proposed entirely through budgetary sources.
IT related activities: At the rate of Rs 1 cr per annum, a provision of Rs 10 cr is proposed for up gradation/ procurement of computers and software for head office and field offices of IWAI their networking, MIS etc during 2010-20.
Technical studies: Some technical studies in progress are: techno-economic feasibility of Narmada river and Mumbai waterways, environmental study for NW-
4 and 5, hydrographic surveys of river Gumti in Tripura, DPR for terminal at Allahabad etc. Some new techno-economic feasibility studies. These include Goa waterways, feeder routes of existing and new National Waterways, waterways of
other States etc. It is also proposed to take up DPR for proposed NW-6, extension of NW-3 in north and south sides, DVC Canal. Study on integration of Coastal
Shipping and IWT etc. For all these studies, and more, the total outlay proposed during 2010-20 is Rs 25 cr.
Inland vessel building subsidy scheme: An Inland Vessel Building Subsidy Scheme was introduced during 10th Plan period. However this was discontinued during 11th Plan. Its continuation is considered critical for achieving goal of 20
btkm by 2020. Planning Commission has said that MoS may take up proposal for continuation of the scheme during 12th Plan. It is expected that entrepreneurs/
IWT operators will come up for availing the IVBSS and procure vessels for operation in National Waterways and Indo-Bangladesh Protocol route. For 20 btkm by IWT, entrepreneurs will have to procure about 1500 vessels by availing
this facility during 2012-20. At Rs 6 cr per vessel (average cost), the cost of the vessels shall be Rs 9000 cr and 30% subsidy under IVBSS works out to be Rs 2700 cr. The corresponding EBR shall be Rs 6300 cr. Hence the same is proposed
during 2012-20. Indo Bangladesh Protocol routes: Since Protocol routes in Bangladesh are critical for providing connectivity of NER with Kolkata & Haldia ports, the status of these waterways in Bangladesh determines overall efficacy of IWT operation
between NER and Kolkata/Haldia ports. While infrastructure on NW 1, 2 and Indian portion of the Protocol routes shall be upgraded by India, the portion in Bangladesh should be developed by them. But it is not likely. Govt of India
therefore has to step forward to develop waterways of Bangladesh also, atleast for those routes which are critical for NER connectivity. Govt of India has already
agreed for a line of credit of $ 1 billion to Bangladesh for various projects including development of IWT. With this background, a project for development of IWT of certain stretches of waterways in Bangladesh at a lump-sum provision of
Rs 200 cr is proposed under this perspective plan of 2010-20.
419
Central Plan Scheme for development of waterways in NER: Fish one model
ought to be adopted for development of important tributaries of Brahmaputra with a view to operate vessels of smaller capacity ranging from 50- 150 tonnes. Besides, some other rivers in NER have potential for development. Already a
Central Plan Scheme for development of waterways of NER exists providing for 100% financial assistance. An outlay of Rs. 200 cr is proposed for this scheme.
B. New projects
Development of NW-4 After declaration of this waterway as NW-4 in November 2008, Detailed Project Report has been prepared. The total cost of the project is
Rs 1515 cr. However Planning Commission by letter dated 13.05.2010, have informed the Ministry that it may not be possible to increase the outlay of IWT in 11th Plan. The Planning Commission has suggested that the Ministry may
therefore identify projects for development of waterways that can be funded and implemented by the private sector and in order to make these projects
remunerative for the private sector, they may provide the Viability Gap Funding (VGF). Therefore, based on the potential of cargo movement on different independent stretches of the waterway and estimated cost of development thereof,
the Ministry/ IWAI has prioritized a phased development of the waterway as; Phase I – Godavari & Krishna rivers, Kakinada & Eluru canals, and Phase II – Commamur canal, Buckingham canal and Kaluvelly tank. Hence efforts shall be
made to explore the possibility of developing this NW in a phased (prioritised) manner in PPP mode. It is proposed that 40% funding (Rs 600 cr) as VGF may
come from Central Govt and remaining 60% (Rs 915 cr) from private sector.
Development of NW-5 Similarly, declaration of NW-5 was also made in November
2008 and its DPR has been prepared. The total cost of the project is Rs 4210 cr. In its case also, the Planning Commission have expressed their inability to provide outlay in the 11th Plan and suggested the Ministry to get it implemented by the
private sector with VGF by the Govt. Therefore, based on the potential of cargo movement on different independent stretches of the waterway and estimated cost
of development thereof a prioritized, phased development is proposed for this waterway as well: Phase I – Brahmani river and delta portion from Charbatia to Dhamra and further to Paradip and Phase II – East Coast Canal from Geonkhali to
Charbatia.
Considering that there is enormous potential of movement of coal from Talcher to Dhamra and Paradip (up to 25 million tonnes per year) the efforts are being made to ascertain possibility of private sector participation in the Phase-I stretch
followed by Phase II. It is proposed that 40% funding (Rs 1700 cr) may come from Central Govt as VGF and remaining 60% (Rs 2510 cr) from private sector for development of entire NW-5 during 2010-20.

420
Development of proposed NW 6: Through Indo-Bangladesh protocol routes, river Barak is also connected with Kolkata and Haldia ports, thus providing
connectivity with West Bengal not only for Assam but also for Tripura, Mizoram, Manipur and Nagaland. Inland vessels already ply between Kolkata/ Haldia and
Karimganj (on Barak river) from time to time, particularly in monsoon season. Declaration of river Barak from Lakhipur to Bhanga (121 km) as sixth NW is under active consideration of the Govt. Its estimated cost is Rs 90 cr. Being in
remote area of NER and considering its strategic importance, it is proposed that the entire funding for its development may come through Budgetary Support.
Other New Waterways:
Some more new waterways may be considered for declaration as National Waterways during 2010-2020 or atleast their funding for development may be by
Govt as VGF. For Example, Goa Waterways, Extension of NW-3 (Kollam to Kovalam in the south and Kottapuram to Kasaragod in the north), Mumbai waterways, Sunderbans, DVC Canal, Narmada river etc. A provision of Rs 6,800
cr is estimated for undertaking development works in these waterways as per following estimates (In these cases also, 40% VGF from Govt funding and balance
60% by private sector is assumed. (Rs in Cr)
Waterway Total cost VGF(40%) Pvt funding(60%)
Goa Waterways Rs 600 cr
Extension of NW 3 Rs 2000 cr Mumbai waterways Rs 2100 cr
Sunderbans waterways Rs. 100 cr DVC canal Rs 1000 cr Other waterways Rs 1000 cr
Total
600
2000 2100
100 1000 1000
6800
240
800 840
40 400 400
2720
360
1200 1260
60 600 600
4080
Incentives for IWT Operators
It is proposed to introduce incentives to the IWT entrepreneurs @20 paisa/ tonne-km for movement of cargo through the national waterways for non-availability of sufficient infrastructural facilities. Payment of this incentive is proposed till IWAI
makes the existing national waterways fully operational with provision of mechanical loading/ unloading+ facilities at all the terminals. A provision of Rs
320 cr (@ 20 paise per tone-km for 16 btkm incremental movement) is proposed to meet this requirement.

421
New Scheme for Unorganized Sector
The Inland Vessel Building Subsidy Scheme was not applicable to country crafts. It has been observed that in NER and in other parts of the country, a lot of transportation activity (both passengers and cargo) takes place through small
country crafts of upto 40-50 ton capacity. Mechanization of these small vessels and fitting appropriate safety devices/ appliances on board will improve the
productivity of these vessels, bring down transportation cost, improve overall transportation efficiency and make IWT operations safer. Hence, there is a need to introduce a new scheme for upgrading the country crafts. This will also facilitate
poverty alleviation through employment generation and enable remote area connectivity. The funding pattern suggested is 50% by Govt. and 50% by the owner of country craft. The Govt‟s share be met fully by the Central Govt. Further
details and modalities of implementation of the Scheme will be worked out in consultation with the state Govts. BS proposed is Rs. 100 cr. Corresponding EBR
share will be Rs 100 cr.
Vessel leasing Special Purpose Vehicle (SPV)
IWT operators are by and large averse to the financial risk of owning IWT vessels. At this stage, they would rather feel comfortable, if vessels are available in
the market on lease basis. To facilitate this, a SPV is proposed to be formed with IWAI partnering with reputed financial Institutions. IWAI‟s contribution may be pegged at Rs. 100 cr equivalent to 40% equity contribution in the JV that would
manage vessel leasing operation. Accordingly, an outlay (Budgetary Support) of Rs. 100 cr is proposed on this account. Corresponding Extra Budgetary Resources
(EBR) provision shall be Rs 525 cr @ Debt Equity Ratio (DER) of 3:2.
Dedicated IWT Development Fund (for JV of acquisition of vessels)
IWAI Act provides for equity contribution for various types of JV projects and the IWT policy stipulates upper limit of 40% on IWAI‟s participation in such JV‟s.
In order to affect modal shift in favor of IWT it is proposed to promote vessel acquisitions through JV route. Thus, it will be desirable to have a dedicated IWT corpus fund built up through budgetary support and through contribution made
by FIs, one of whom could be Fund Manager as well. This corpus could be used for funding JV projects for acquisition of vessels @ 3:2 DER. An outlay of Rs. 500
cr (Budgetary support) is proposed on this account. Corresponding EBR is Rs 2625 cr @ DER of 3:2.
Funding for composite Transportation projects
Ministry of Finance has issued guidelines for viability gap funding for
infrastructure development under public- private partnership projects. It is proposed to introduce a new scheme for funding of composite transportation
projects in the IWT sector. The funding would be limited to a maximum of 40% of project cost. The composite projects would comprise infrastructure facilities

422
(terminals with mechanical loading/ unloading facilities), vessel acquisition and operation between identified origin and destination pairs. An outlay of Rs 500 cr
(Budgetary support) is proposed for meeting the viability gap funding for composite transportation projects. The corresponding EBR component shall be Rs 750 cr.
6. Financing of projects:
IWAI is not expected to have substantial Internal Resources even the 2020. Hence the funding for all the above mentioned projects is considered through Budgetary
sources (BS) and private funding (EBR). The Summery of Ongoing Schemes in respect of BS & EBR and New schemes is given below:
(Rs in Cr)
Budgetary Support
(BS)
Internal Resources
(IR)
Private Funding
(EBR)
Total
Ongoing
projects
4175 -
-
8400 12575
New
projects
6630 -
-
11505 18135
Total 10805 --
19905 30710
Therefore total financial implication of the proposed Perspective Plan for 2010-2020 is Rs 30,710 cr [BS- Rs 10,805 cr and EBR (i.e. private funding) - Rs 19,905cr]. Details for each scheme are given in Annexure.
*****

423
ANNEXURE
INLAND WATERWAYS AUTHORITY OF INDIA (Rs.in Cr)
S.no Name of Project Approx cost
Funding pattern Year of project preparation/ commencement
Expected date for completion of project
Budgetary Support
IBER Private/ other
1 2 3 4 5 6 7 8
A) On going projects
1 Making National Waterway 1 fully functional
312.00 312.00 2010 2013
2 Making National Waterway 2 fully functional
77.00 77.00 2010 2013
3 Making National Waterway 3 fully functional
90.00 90.00 2010 2013
4 NINI and setting up of STCTC 100.00 100.00 2010 2020
5 Joint Venture (PPP projects) 2511.00 411.00 2100.00 2012 2020
6 IWT promotion activities 50.00 50.00 2010 2020
7 IT related activities 10.00 10.00 2010 2020
8 Technical studies 25.00 25.00 2010 2020
9 Inland vessel building subsidy scheme
9000.00 2700.00 6300.00 2012 2020
10 Indo Bangladesh Protocol routes 200.00 200.00 2012 2020
11 Central Plan Scheme for development of waterways in NER
200.00 200.00 2010 2020
Sub-total ongoing projects 12575.00 4175.00 8400.00
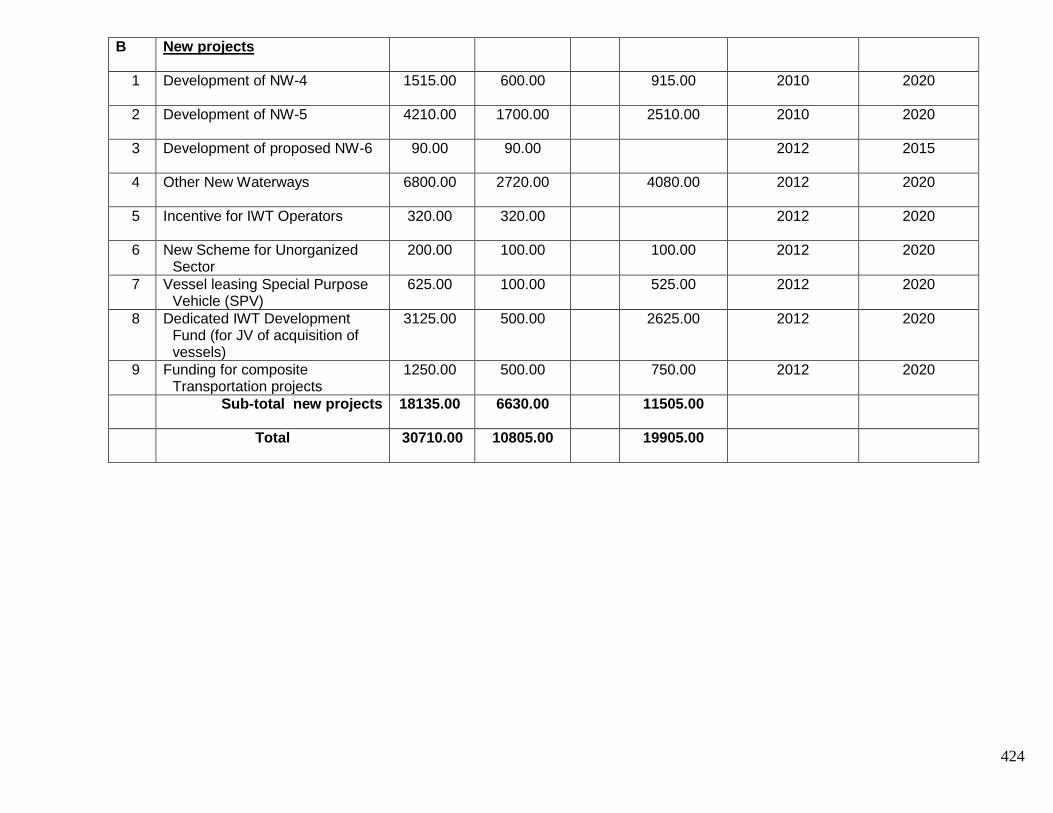
424
B New projects
1 Development of NW-4 1515.00 600.00 915.00 2010 2020
2 Development of NW-5 4210.00 1700.00 2510.00 2010 2020
3 Development of proposed NW-6 90.00 90.00 2012 2015
4 Other New Waterways 6800.00 2720.00 4080.00 2012 2020
5 Incentive for IWT Operators 320.00 320.00 2012 2020
6 New Scheme for Unorganized Sector
200.00 100.00 100.00 2012 2020
7 Vessel leasing Special Purpose Vehicle (SPV)
625.00 100.00 525.00 2012 2020
8 Dedicated IWT Development Fund (for JV of acquisition of vessels)
3125.00 500.00 2625.00 2012 2020
9 Funding for composite Transportation projects
1250.00 500.00 750.00 2012 2020
Sub-total new projects 18135.00 6630.00 11505.00
Total 30710.00 10805.00 19905.00

425
CHAPTER-20
Proposed Policy Measures Initiatives & Expected Outcomes
20.1. SHIPPING SECTOR
The following issues have a bearing on the growth of Indian shipping industry.
i) Increasing Indian tonnage :
A clear policy to support the growth of an indigenous fleet needs to be formulated. It
is proposed that the cabotage should be continued and the fiscal/tax regime be rationalized so as to attract fresh tonnage in to Indian registry. This is to be
supported by a policy that would sustain existing tonnage, make investment in shipping attractive to new investors and provide special incentives aimed at energy security needs. To make the national register attractive, the effective tax rate
should be brought down to a level that will enable shipping companies to compete globally.
ii) Legislative updation :
With the rapid changes in the International Maritime Regulatory measures and as a result of adoption of various maritime IMO/ILO Conventions, it becomes imperative
to constantly update our national legislation, in order to keep pace with the International regulatory measures. A greater emphasis is required to bring in all new IMO instruments into the national law, for an effective implementation. It is
envisioned that the period between the adoption of International convention and National legislation be reduced to 3 years by 2015 and to 1 year by 2020.
iii) Marine disaster and Pollution Response arrangements
It has been observed that the Marine disaster and Oil Pollution Response arrangements set up in sea ports, oil terminals, offshore structures with the coast
guard is inadequate to deal with major oil spill. Being party to OPRC Convention it is the obligation of Government of India to establish adequacy in Oil Pollution Combating Equipment stockpiles along the coast line including the offshore area.
For marine disaster response arrangements, minimally, this would require the availability of at least two 100 T bollard pull tugs on each coast; the basic equipment for tow and de-canting of bunker oil from tanks of ships in distress; and
a team of salvagers who will be available at short notice.
426
iv) Coastal Shipping :
Coastal shipping policies have to be formulated especially in areas such as Promoting River-sea vessels. Manning relaxation without compromising on the
safety, Financial incentives, Infrastructural facilities, Modal shift in cargo from rail and road, Legal issues, Declaration of IV limits in different states, Data-base and
communication infrastructure, Cabotage policy support, custom processes and procedures for the development of seamless movement of cargo and growth in Coastal shipping.
v) Human Resource Development
India can aspire to strong growth in Officers and Ratings by 2020.The share of high-quality Officers can increase from 6.3 in 2009 to 9.0 per cent in 2020, whereas Ratings could see a moderate growth from 7.5 per cent in 2009 to 9 per cent in
2020 by significantly improving their quality. This implies an additional 65,000 Officers and 45,000 Ratings taking in to consideration annual attrition, which will require expanding annual training capacity from 5,600 to 15,000 Officers and from
4,600 Ratings to 9,000 Ratings. The ramping up of capacities in Pre Sea and Post Sea training should not present any major difficulties as the entry of the private
sector since the late nineties has lead to strong and continuing growth. The real challenge is in providing adequate sea training berths which are in short supply thereby choking the entire supply chain
vi) Administrative issues :
Restructuring and upgradation of DG Shipping / MMD Offices for better regulatory/monitoring of shipping activities in India needs immediate attention. Further, all major IMO conventions mandate Port State Control and Flag State
Inspection of vessels to be meticulously carried out by all member States. India had already implemented this requirement. However, a complete implementation
could not be practiced due the varied reasons, particularly, shortage of manpower and at present we are only able to carry out inspection of about 4% foreign ships calling at Indian Ports under PSC and 40% of Indian ships under FSI.
20.2. SHIPBUILDING SECTOR
i) Introduction of new Shipbuilding Subsidy scheme: In order to provide a
level playing field to the indigenous shipbuilding industry which needs a continuous flow of orders a new shipbuilding subsidy scheme is under consideration for neutralization of various taxes and duties imposed on
shipbuilding industry. It s proposed to achieve 5% share in the new order book position in the global market by 2020.

427
ii) Grant of Infrastructure Status: A proposal for grant of infrastructure status to shipbuilding industry has been forwarded to Ministry of Finance. It is expected
that with the grant of infrastructure status the indigenous shipbuilding industry would be able to utilize the tax benefits and availability of easy credit for
improvement in the technological development, infrastructural facilities and modernization.
iii) Provision of Capital Subsidy: There is need to promote technological up gradation and development of green technologies in shipbuilding industry and a scheme for capital subsidy encouraging adoptions of world class technologies by
indigenous shipbuilding industry in these fields is proposed as a follow up of shipbuilding subsidy scheme. The scheme will help in transfer of technology and modernization of Indian shipyards.
iv) Purchase Preference for Indian Shipyards: Foreign shipyards enjoy various policy and fiscal incentives which are not transparent and some of these yards
adopt predatory pricing policies which affect Indian shipyards. It is therefore proposed to consider introducing purchase preference for Indian shipyards by
matching the lowest price for ship acquisition including dredgers by Government in global tenders. The aim is to build up volumes and capacities of Indian shipyards.
v) Offset Scheme for Government procurement: The development of indigenous shipbuilding industry is at a nascent stage. It is proposed to examine an offset scheme for ship acquisition so that the indigenous ship ancillary industry
gets a boost in their development and growth.
vi) Formulation of a policy to promote/facilitate Maritime clusters: It is considered that there is a need to promote/facilitate formation of maritime clusters including shipbuilding & ship repair hubs and ship ancillary units for an integrated
development of these sectors. The multiplier effects of these industries on the Indian economy in the form of employment generation, self reliance and
multifaceted skill building capability are huge and worth promoting.
vii) Centers in Shipbuilding education & training: There is a need to promote
the skills in shipbuilding for workers, supervisors, managers the Government may facilitate/ incentivize setting up of such institutes and centers. Budgetary provision
for such scheme may be considered.
viii) Encourage the major ports to set up ship repair and maintenance hubs:
The major ports and big non major ports need to be encouraged to set up ship repair and maintenance hubs so that there is optimum utilization of their resources
and indigenous ship repair industry gets the requisite support for development/growth.
428
ix) Liberalization of scheme for registration of ship repair unit: The existing scheme for registration of ship repair units is very cumbersome and time
consuming and needs to be liberalized so that the ship repair industry can grow unfettered. There is a proposal to consider registering individual ships as ship
repair unit which will incentivize ship repair within the country.
20.3. IWT SECTOR
Development of IWT infrastructure:
(i) One of the major policy measures is development of IWT infrastructure
namely reliable fairway with assured least available depth for round the year and round the clock navigation, terminals for berthing of vessels and interface with road
and rail modes on all National Waterways to make them fully functional for commercial viable operations.
Public Investment:
(ii) Public investment in IWT sector is negligible vis-a-vis road, rail and aviation sector. It is felt that for reaching threshold level of IWT development to make the
waterways commercially viable, there ought to be quantum jump in public funding in IWT sector. There would be around 10,000/- cr. by 2020 in terms of budgetary
support.
Private Participation:
(iii) To promote Inland Water Transport, there is a need for private participation in IWT infrastructure. Development of stretches of national waterways those are commercially viable and have potential for private participation are to be considered for development through PPP mode initially. It is proposed to raise 60% of cost of
these IWT projects through private participation which would be around Rs. 20,000/- cr.
Feeder Routes to National Waterways:
(iv) All riverine states to develop feeder routes to National Waterways or major
waterways of that state specifically North-East states adopting fish bone model wherever feasible through their annual plans. Development of inland waterways by connecting different rivers in North East would be provided to NE states through
100% assistance under Central Plan Scheme.
429
Indo-Bangladesh Protocol of IWT & T:
(v) Indo-Bangladesh Protocol on IWT&T is required to be renewed for a longer period. The proposed NW-6 (Lakhipur to Bhanga stretch of Barak River) would
extend the protocol route upto Lakhipur. Stretches of Gumti and Howrah river of Tripura could be connected with Meghna and Titas rivers of Bangladesh for their
inclusion in Protocol route. There is possibility of movement of containerized cargo to and fro Narayanganj/Ashuganj in Bangladesh in future.
Man-power requirement:
(vi) To meet the requirements of trained manpower of IWT sector, it is necessary that all riverine and coastal states set up state level Crew Training Centres. They may also be in close interaction with NINI, Patna.
River Cruise:
(vii) There is a vast potential for river cruise in India. Many commercially viable
operations of cruise vessels by private operators already take place on NW-1, 2 & 3. There is need for its expansion with govt. and private investment in developing tourism related infrastructure in the waterfront in coordination with Ministry of
Tourism, GOI and other State Tourism departments.
Increasing the number of Inland Vessels:
(viii) There is an acute shortage of inland vessels. There is a need to re-introduce Inland Vessels Subsidy Scheme (30% subsidy for construction/acquisition of inland
vessels for national waterways and Protocol route) in 12th Plan and beyond to provide necessary boost for increasing the availability of inland vessels.
Modal Shift:
(ix) Modal share of movement of cargo through IWT in the country is 0.28% i.e is
about 4 BTKM. Rail and road transport mode is saturated. It is envisaged to increase the modal share of IWT along with coastal Shipping to 10% by 2020.
Modernization of country boats:
(x) Modernization and improvement of country boats in North East and other areas of the country will improve the productivity of IWT vessels and improve
connectivity in remote areas besides generating employment.
430
Integrate of IWT & Coastal Shipping:
(xi) India with over 7000 km long coastline, coastal shipping is still in its infancy accounting for just about 1 million GT. It is necessary to integrate IWT and coastal
shipping to achieve optimum potential of these two water borne modes. Inland Vessels Act, 1917 has been amended and definition of inland waters has been
enlarged. River-sea vessels for use in Coastal as well as IWT are being designed for seamless transportation of cargo from one inland waterway to another through coastal shipping. Policy measures are required to further strengthen the integrate
of IWT & coastal shipping.
4. Aid to Navigation Sector:
(i) Establishment of VTS in Gulf of Kuchchh(GOK) at a sanctioned cost of
Rs.165 crore consists of 9 Radar sites 3 Repeater stations and 6 Port Monitor Stations. This project has been planned to facilitate safe movement of vessels in the GoK, the safety of marine life and protection of environment. The project
involves civil engineering works including installation of Radar and microwave equipment at 9 Radar sites viz. Kandla, Navinal, Chhachi, Jakhau, Koteshwar, Mandvi which are on the Kachch side and Okha, Chudeswar and Balachadi on the
Saurashtra side. About 80% of the civil engineering work is complete and radars at 4 sites have been installed including the Port Monitor at Kandla and part system is
on trial run. Commissioning of VTS in GoK is expected by 31st January,2011. DGLL also intends to implement the Scheme of VTS at minor ports at an estimated cost of Rs.300 crore.
(ii) Establishment of National AIS Network: The Automatic Identification System (AIS) is a device to facilitate the Coastal ship reporting system. VTS & Ports
will be benefited on exchange of real time ship data. DGLL is in the process of establishing a shore-based National AIS Network which will significantly enhance and complement existing aids to navigation. The project was approved at RCE
stage for Rs.75.20 crore The work order has been signed on 18.11.2010. This project is expected to be completed in 2012.
A second phase of this project will encompass islands of A&N and Lakshadweep and is proposed to be taken up by DGLL in the 12th Plan period.
(iii) Automation of Lighthouses in Cochin/Chennai/ Vishakhapatnam /Kolkata Light Houses Districts at an estimated cost of approx
Rs.30.00 crores has been approved. This will facilitate real time monitoring of Aids
to Navigation from a convenient location for appropriate and fast corrective
measures.

431
(iv) Establishing the GPS-RTK (Real time Kinematic System)
In addition to the above, DGLL proposes to (a) establish the GPS-RTK(Real Time Kinematic) system to determine real time water level corrections at an
estimated cost of Rs.100 crores. This system becomes most suitable for the GoK and Gulf of Khambhat where tidal and current variations are appreciable and real time corrections of these parameters can help in berth to berth navigation and also
enable vessels in carrying extra cargo thus having long term economic implications; (v) Green Energy:
One of the policy outcome is to promote a policy of utilization of solar and
wind energy to bring down the consumption of diesel.
PART – IV
MARITIME AGENDA

432
CHAPTER 21
AGENDA FOR THE DECADE
21.1 The Indian maritime sector needs simultaneous multiple interventions to
achieve certain goals which are concomitant with the economic growth of the
country. Some of the goals to be targeted for achievement by the end of the
decade (2020) are
Create Port capacity of 3200 M.T. for handling about 2500 M.T. of cargo
(This would necessitate an investment of about Rs 3 lakhs crores)
Improve Port performance on par with the best in the world
Increase tonnage under the Indian flag as well as under Indian control (This
would need an investment of about 1.20 lakh crores)
Increase Coastal shipping and facilitate hassle-free multimodal transport
Increase India’s share in global ship building to 5%
Promote use of the inland waterways for cargo movement
Increase the strength of Indian seafarers to 9% of the global strength by
2015 and sustain above this level
21.2 This would involve several policy measures as well as programmes and
projects. This document has identified the major ones for consideration and
decision/action by all concerned. The important items in the agenda are listed
below:
I. PORT CAPACITY
1. Implementation of the Port development projects identified in this
document
2. Major ports to provide draft of not less than 14 metres and hub ports
17 metres
3. Full mechanisation of cargo handling and movement in the Major
Ports
4. Development of adequate storage areas in the Major Ports
5. A new policy on dredging

433
6. Strengthening DCI through new acquisition of dredgers
7. Identification and implementation of projects for rail, road and inland
waterway connectivity to the Ports
8. Development of two hub ports on each of the West and the East
coasts – Mumbai (JNPT), Kochi, Chennai and Visakhapatnam
9. Development of two new Major ports
10. Encouraging the major ports to set up ship repair and maintenance
hubs
11. Facilitation for cruise shipping at selected ports
12. Action on the Sethusamudram Canal Project based on Supreme Court
orders.
II PORT POLICY MEASURES
1. Corporatisation of Major Ports
2. Major ports to be landlord ports
3. Periodic review of the processes and documents for Public Private
Partnerships
4. A new land policy for the Major ports
5. A policy on monopoly in the Major Ports
6. A new policy for captive berths in the Major Ports
7. Establishing a Port Regulator for all the ports for setting, monitoring
and regulating the service levels and the technical & performance
standards.
8. Review and simplification of the tariff fixation mechanism for the
Major Ports
9. Proposing simplification of the environment clearance process for
the port projects
10. Shifting of transhipment of Indian containers from foreign ports to
Indian ports
11. Defining Corporate Social Responsibility of the Major Ports
12. Policy on societal integration of the ports

434
13. A framework for cooperation between Indian ports and those in
other countries
14. A policy on cooperation and competition among Indian ports
15. Establishment of ‘Indian Ports Global’ for overseas investments by
Indian Ports
16. Ports to work towards being ‘green ports’
17. Review the systems for the handling of dirty and dangerous cargoes
in ports
III TECHNOLOGY FOR EFFICIENCY, SAFETY AND SECURITY
1. Ports to use information technology for quality performance
2. Port Community system to be fully integrated with all stakeholders
3. Non-major ports also to have PCS
4. Introduction of modern security systems in the ports
5. Security of SPMs
6. Review of safety systems in the ports
7. VTMS for all ports handling EXIM cargo
8. Integration of e-modules on COC, CDC, RPS, INDOS, SPFO etc for the
benefit of seafarers
9. Establishment of AIS network along the coast
10. Completion and operationalisation of the VTS in the Gulf of Kutch
11. Establishment of Real Time Kinematic (RTK) system in the Gulf of Kutch and the Gulf of Khambat
IV ENVIRONMENT
1. Ports to work towards being ‘green ports’(II.16)
2. Designation of an Emission Control Area (ECA) for specific portions of Indian coastal waters
3. Designation of Particularly Sensitive Sea Areas.
4. Ballast Water Management.

435
Port biological baseline survey and risk assessment of nine major ports.
Setting up of the facility of Ballast Water treatment Technology verification and certification
5. Marine disaster and oil pollution response mechanism
At least two 100 T bollard pull tugs on each coast;
The basic equipment for tow and de-canting of bunker oil from
tanks of ships in distress;
A team of salvagers who will be available at short notice
6. Use of non conventional sources of energy for the Lighthouses and the aids to navigation
7. Promotion of the building of ‘green ships’ 8. Proposing simplification of the environment clearance process for
the port projects (II.9)
V HUMAN RESOURCES
1. Human Resources Development in shipping
The share of Officers to increase from 6.3 in 2009 to 9.0 per cent in 2020
Ratings to see a growth from 7.5 per cent in 2009 to 9 per cent in
2020 by significantly improving their quality.
Expanding annual training capacity from 5,600 to 15,000 Officers
and from 4,600 Ratings to 9,000 Ratings.
Providing adequate sea training berths
2. Online examinations for seafarers
3. Align training requirements with STCW provisions
4. Review of manning scales in line with international norms
5. Additional campuses for the Indian Maritime University in major coastal
cities
6. New courses in specialised areas in Engineering, Management, Law etc in
IMU campuses.

436
7. Collaboration of IMU with top global academic institutions in the maritime
sector
8. Contributory Annuity Scheme for seamen
9. Creation of additional facilities and improvement of seamen’s hostels
10. Capacity building for Port personnel
11. Pilots’ training
12. Improving port based facilities for seafarers
13. Centres in Shipbuilding education & training to promote the skills in
shipbuilding
14. Enhance capabilities for ship design
15. State level Inland Waterways Crew Training Centres in close interaction with NINI, Patna.
16. Promotion of Research in various areas in the maritime sector
VI SHIPPING POLICY
1. Increase Indian tonnage through necessary policy interventions
2. Declaration of a new Coastal shipping policy
Promoting River-sea vessels.
Manning relaxation without compromising on the safety,
Financial incentives,
Infrastructural facilities,
Modal shift in cargo from rail and road,
Legal issues,
Declaration of IV limits in different states,
Data-base and communication infrastructure,
Cabotage policy support,
Customs processes and procedures
3. Policy on cargo support 4. Policy on liner cooperatives 5. Establishment of a ‘Freight Exchange’ 6. Creation of Ombudsman / Tribunals for Shipping matters

437
7. Formation of an independent Marine Casualty Investigation Cell
8. Establishing a P & I Club in India
9. Opening of a second register 10. Review of TRANSCHART
VII FINANCE
1. A Maritime Finance Corporation
2. Study of Taxation Systems
Tonnage Tax
Income Tax for the ports
Income Tax for seafarers
Service Tax
Customs duties on bunkers and repair materials
VIII SHIPPING PROGRAMMES
1. SCI to have ambitious vessel acquisition plans to lead the growth in Indian tonnage
2. SCI to increase container handling capacity 3. Introduction of passenger ferry services between India and Sri Lanka 4. Introduction of passenger ferry services between India and Maldives 5. Introduction of passager ferry services between India and other
nearby countries 6. Introduction of coastal ferry-cum-passenger services for Chennai to
Kanyakumari, and other suitable places 7. Introduction of faster vessels to Lakshadweep 8. Strengthening the Navigational Safety in Ports Committee (NSPC)
9. Ro-Ro Ferry service in Gulf of Kutch, Gulf of Cambay and other suitable places
10. Strengthening of capacity for Port State Control and Flag State Inspections.
11. 10% PSC inspections of foreign ships calling at Indian Ports by 2015 as mandated by IMU.

438
12. 100% FSI inspections of Indian ships by 2020.
13. Promotion of multi modal transport operations for door to door
delivery
14. Restructuring and upgradation of DG Shipping / MMD Offices for
better regulation/monitoring of shipping activities
15. Promotion of a Salvage Company in India, with Viability Gap Funding if required
IX SHIPBUILDING AND REPAIRS
1. Introduction of new Shipbuilding Subsidy scheme
2. Grant of Infrastructure Status to shipbuilding industry 3. A scheme for capital subsidy for encouraging adoption of world
class technologies by the Indian shipbuilding industry
4. Purchase preference for Indian shipyards in procurement of ships by Government through global tenders.
5. Offset Scheme for Government procurement
6. Expansion of Cochin Shipyard
7. Promotion of the building of ‘green ships’ (IV.7) 8. Formulation of a policy to promote/facilitate maritime clusters
including shipbuilding & ship repair hubs and ship ancillary units
9. Centres in Shipbuilding education & training to promote the skills in shipbuilding (V.13)
10. Enhance capabilities for ship design (V.14)
11. Liberalization of scheme for registration of ship repair units
X TOURISM
1. Development of the tourism potential of the Lighthouses
2. Facilitation for cruise shipping at selected ports (I.11)
3. Promotion of River Cruises
439
XI INLAND WATERWAYS
1. Development of IWT infrastructure:
Reliable fairway with assured least available depth for round the year and round the clock navigation,
Terminals for berthing of vessels and interface with road and rail
2. Quantum jump in public funding in IWT sector 3. Declaration of River Barak as National Waterway no.6 4. Development of national waterways 4 & 5
5. Development of stretches of National Waterways through the PPP mode.
6. Extension of National Waterway No.3 in Kerala
7. States, especially North-East states to develop feeder routes to National Waterways or major waterways
8. Renewal and strengthening of Indo-Bangladesh Protocol of IWT & T
9. State level Crew Training Centres in close interaction with NINI, Patna. (V.15)
10. Promotion of River Cruises (X.3)
11. Increasing the number of Inland Vessels and Re-introduction of Inland Vessels Subsidy Scheme
12. Modernization and improvement of country boats in North East and other areas.
XII INSTITUTIONAL DEVELOPMENT
1. Formation of an Indian Maritime Council to bring together all sectors of maritime activities, both public and private.
2. Creation of a Shipping Sectoral Innovation Council
3. Establishment of a National Maritime Museum
4. Promotion of Research in various areas in the maritime sector (V.16)
5. A Maritime Finance Corporation (VII.1)

440
XIII LEGISLATION
1. Enactment of a new Indian Ports Act replacing Indian Ports Act 1908 and the Major Port Trusts Act 1963
2. Enactment of Admiralty Act
3. Enactment of Shipping Trade Practices Act
4. Review of the law on the Multimodal Transportation of Goods
5. Revision of the law on Lighthouses and Lightships
6. Amendment of MS Act to take care of
Ballast water Convention
Anti fowling Convention
Recycling Convention
HNS Convention
London Dumping Convention
Wreck Removal Convention
Bunker Convention
Maritime Labour Convention
New Conventions that may be ratified
XIV INTERNATIONAL MATTERS
1. Control of piracy through concerted international action
2. Bilateral maritime agreements with selected countries / regions for mutual benefit
3. A framework for cooperation between Indian ports and those in other countries (II.13)
4. Establishment of ‘Indian Ports Global’ for overseas investments by
Indian Ports (II.15)
5. Introduction of passenger ferry services between India and Sri Lanka (VIII.3)
6. Introduction of passenger ferry services between India and Maldives (VIII.4)
7. Introduction of passenger ferry services between India and Other
neighbouring countries (VIII.5)
441
8. Collaboration of IMU with top global academic institutions in the
maritime sector (V.7)
9. Renewal and strengthening of Indo-Bangladesh Protocol on Inland Water transport (XI.8)
XV GENERAL
1. Establishment of State Maritime Boards in all the coastal States
2. Bringing out an annual report card on the decadal maritime agenda
in May every year upto 2020


![€¦ · Web viewWG 1Working Group on goal-based standards (agenda item 6) WG 2Working Group on Maritime Autonomous Surface Ships (agenda item 5) [WG 3]Working Group on safety ...](https://static.documents.pub/doc/80x56/5b6b33027f8b9a8d058d042a/-web-viewwg-1working-group-on-goal-based-standards-agenda-item-6-wg-2working.jpg)


