DNV GL © 2015 19 June 2017 SAFER, SMARTER, GREENERDNV GL © 2015
23 October 2017
George Dimopoulos, PhD
MARITIME
Complex ship energy systems modelling, simulation and optimization
1
Applications experience in various ship types
MOSES 2017 Workshop
Maritime R&D and Advisory, Piraeus
DNV GL © 2015 19 June 2017
Introduction:
Ship Energy systems & Need for Modelling and Simulation
DNV GL © 2015 19 June 2017
Ship Energy Systems: Features
3
• Isolated operation: resource constraints.
• Safe, redundant and uninterrupted operation.
• Time varying mission profiles.
• Environmental performance & compliance.
• Need for fuel economy.
• Commercial pressure.
• Complexity increases.
• Truly integrated systems.
• Objective: Competitive Assets
Build and operate better ships in terms of safety,
efficiency, costs, and environmental footprint.
DNV GL © 2015 19 June 2017
Key driver: Digitalisation in Shipping and Maritime Operations
Need for integration: vendors, service providers, designers, yards, operators
Leverage of (big) data
Systems Engineering: the sum is more than its parts
Holistic approaches
Improved analytics and quantification.
4
DNV GL © 2015 19 June 2017
Ship systems: the way forward
5
Data & Connectivity
Modelling & Simulation
Quantification
Increased Systems and Operation Complexity
Useful insights implemented in practice
Actionable Knowledge!
DNV GL © 2015 19 June 20176
Modelling Simulation and Optimisation of Ship Energy Systems
@ DNV GL:
DNV GL © 2015 19 June 2017
Modelling & simulation of vessels and systems:building Digital Twins & Virtual Engine Rooms
7
DNV GL © 2015 19 June 2017
Building virtual integrated ship machinery systems
88
Library of machinery
component models
GUI and modelling
platform
Steady-state / dynamic
simulations, optimisation…
DNV GL © 2015 19 June 2017
COSSMOS current service examples
COSSMOS New Buildings
Techno-economic comparison of full machinery / propulsion configuration
alternatives
– Engines
– Auxiliaries
– Cargo handling systems
– Waste heat recovery systems solutions
– Economizers
– Shaft generators
– Steam/power turbine systems
– VOC recovery systems optimal sizing
– Scrubbers estimation of additional fuel consumption
– Diesel electric propulsion
– Hybrid battery propulsion systems.
9
DNV GL © 2015 19 June 2017
COSSMOS current service examples
COSSMOS Fleet in Service
– Advanced performance monitoring & optimisation
– Energy audit coupled with advanced thermodynamics.
– Energy efficiency assessment of power management strategies in Diesel-electric
vessels and improvement suggestions.
– Trouble-shooting and root cause analysis.
COSSMOS Retrofit & Conversion
– Techno-economic comparison of solutions and optimisation.
– Gas carriers reliquefaction plants: techno-economic comparison of vendors
options and optimal sizing.
– Waste heat recovery solutions e.g. economizers, etc.
– Scrubbers retrofit techno-economic evaluation
– Battery-hybrid systems.
10
DNV GL © 2015 19 June 2017
Applications inNew Buildings, Retrofits & Concept Designs
DNV GL © 2015 19 June 201712
NB machinery configurations for modern LNGCs
DNV GL © 2015 19 June 2017
New ships and projects
13
What is the best integrated machinery propulsion
configuration for the vessel and project we want to build or
bid?
i.e. what is the configuration that maximises the expected
performance of our investment?
Use COSSMOS to compare in techno-economics alternative
machinery / propulsion configurations to support improved
decision making
General Ship Applicability
DNV GL © 2015 19 June 2017
The LNG carrier integrated marine energy system
Multi-fuel / multi-product energy system
LNG evaporation: natural Boil-Off Gas variable during voyage (natural BOG)
Forced LNG vaporisation when natural is not enough (forced BOG)
Gas combustion of surplus BOG … or
Reliquefaction plant onboard
14
LNG carrier machinery system
Natural BOG
Forced BOG
Pilot fuel
Fuel oil
Propulsion
Electricity
Heat (steam)
Exhaust gases
(engines, boiler & GCU)
Resources Products
Waste
DNV GL © 2015 19 June 2017
The LNG carrier integrated energy system – decomposed
15
Reliquefaction
Plant
Gas compression
trainsGas
management
Separation /
Mixing Unit
Natural
BOG
Forced
BOG
time
LNG to
tanks
Gas Combustion
Unit
Power
Generation
Steam
Generation
Propulsion
System
Fuel Oil & Pilot
time
Electricity
time
Propulsion
time
Heat
BOGFuel OilElectricityPropulsionHeatExhaust
• Tightly integrated system (feedback loops)
• BOG composition and re-liquefaction affect gas quality to engines
• Time varying operational profile
DNV GL © 2015 19 June 2017
Adopt novel design approaches
16
Competitive Asset
Design for trade
Efficiency & Economic viability
Integrated Systems
Engineering
DNV GL © 2015 19 June 2017
Techno-economic comparison of alternative configurations in new buildings and retrofits
17
Specific fuel cost (USD/nm)Build COSSMOS models, the ship’s
Digital Twin to sail virtual
roundtrips
DNV GL © 2015 19 June 2017
Overall fuel consumption per mode of operation
18
Equivalent HFO, tonnes / day
Operating Modes
Trade route
+
Operating Profile
DNV GL © 2015 19 June 2017
Techno-economic appraisal & Payback time calculations Reliquefaction systems in LNGC NB
19
kUSD / year
LNG recovered profit
Payback period
Higher efficiency
But…
More economically
attractive
DNV GL © 2015 19 June 2017
Overall Fuel Consumption and actual Boil-off Rates, entire speed range simulations
20
Forcing startsMinimum BOG speed
DNV GL © 2015 19 June 201721
Concept DesignsLPG carriers: design and operation
DNV GL © 2015 19 June 2017
Integrated system approaches
22
Cargo
tanks
Integrated machinery: propulsion + power generation + cargo handling
Machinery &
energy
recovery
Cargo ops:
Loading,
Pressure
keeping
DNV GL © 2015 19 June 2017
LPGreen concept VLGC: Final concept appraisal
23
Cargo handling:
− Design for faster loading
− Reduced energy demand
− Reduced reliquefacton plant size
− Un-manned cargo room concept
− Adequate redundancy
Hull and propeller
− Optimised for both calm
water and waves
− Multiple speeds and loading
conditions
− Energy saving devices
Tank design
− New IGC code / IMO Tier 3 compliant
− Higher tank design pressure
Machinery configurations:
− Improved overall efficiency
− Conventional and LPG as a fuel
− Energy recovery technologies
− IMO Tier III compliant
LPG as fuel
− Technical feasibility
− SOx CAP compliant
− Reduction of fuel expenses
LPGreen
LPGas fuel,
technically feasible
6-9%Overall Efficiency
Improvement
30%Reduction of
Fuel Expenses
30%Reduction of
Loading time
Up to Up to
DNV GL © 2015 19 June 201724
NB machinery configurations for a small-scale LNGC, 7.5k m3
DNV GL © 2015 19 June 2017
Analysis of different machinery options for various operating profiles
25
Mechanical-electric #1
Mechanical-electric #2
Diesel-electric #1
Diesel-electric #2
DNV GL © 2015 19 June 2017
Assessing the fuel consumption of the various configuration alternatives
26
Fuel consumption per operating mode
and configuration
Annual fuel OPEX under different
scenarios
4 different
configurations
3 operating profiles considered:
Fast evaluation of alternatives:
total project support <5 days !!!
DNV GL © 2015 19 June 201727
Reliquefaction plants: NB and Retrofitting of existing LNGCs
DNV GL © 2015 19 June 2017
28
Reliquefaction systems assessment
COSSMOS techno-economic studies by DNVGLdetermining reliquefactionsystems suitability to Owner and market needs
Applications:• Retrofitting on existing vessels of various technologies• New buildings according to charterers requirements
Systems under consideration (recent projects):• Nitrogen-loop, inverse Brayton cycle• Mixed refrigerants (MR) cycle• Joule Thomson Valve effect cycle
Leverage ship / operational data to increase value of analysis
DNV GL © 2015 19 June 2017
Reliquefaction virtual retrofitting based on real operational data
29
COSSMOS simulation for a year of sailing, historic data
Blue: Vessel as is – without reliquefaction
Red: Vessel with MR reliquefaction 1.5tn/h
Days from 1-Jan-2014
Laden
Anch Laden
UnloadingBallast
Anch ballast
Loading
DNV GL © 2015 19 June 2017
Based on voyage / noon reports:
5700 tons / year, Reliquefied BOG quantity
1.35 mil. USD reliquefied BOG value (@ 5 $/mmBTU)
X% reduction of GCU usage
Y% reduction of annual fuel consumption
3.6 years, simple payback period
30
Benefits:
Increased attractiveness of existing vessels
Lifetime / charter party extensions
Trade route / cargo flexibility
Cost-effectiveness / increased competitiveness
Reliquefaction virtual retrofitting based on real operational data
DNV GL © 2015 19 June 201731
Battery Hybrids NB or Retrofits
DNV GL © 2015 19 June 2017
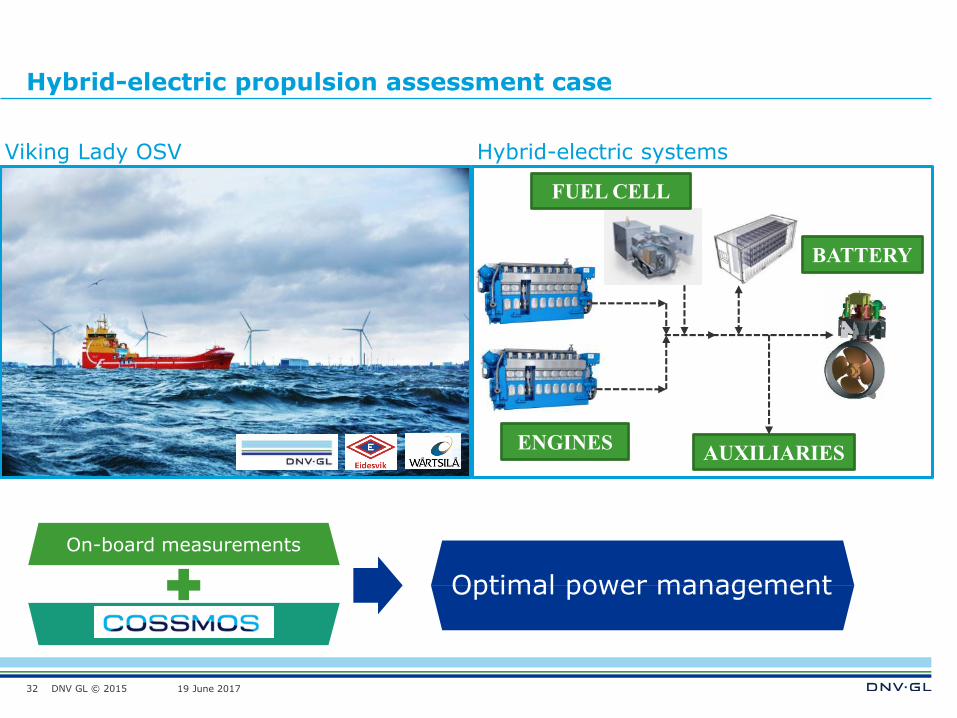
Hybrid-electric propulsion assessment case
32
AUXILIARIES
BATTERY
FUEL CELL
ENGINES
On-board measurements
COSSMOS
Optimal power management
Viking Lady OSV Hybrid-electric systems
DNV GL © 2015 19 June 2017
Comparison of alternatives
Quantification of fuel savings
Modelling
of different
control strategies
ExampleUse of modelling and simulation techniques to derive the best power management strategy
33
Measurements ofoperational profile
Proposed power management
strategies
η
η
DNV GL © 2015 19 June 2017
DP mode : measured profile
34
Thrusters power
Total power
ScenarioDP- mode (average load)
Avg. power:0.8 MW
7 May 201210:00-11:00
Used data from the measurements to set-up simulations
Exact operational
conditions never o
be repeated !!!
DNV GL © 2015 19 June 2017
DP mode : Peak-shaving strategy fuel consumption
35
Instantaneous fuel consumption
Cumulative fuel consumption
DNV GL © 2015 19 June 2017
Viking Lady operational modes energy cost
36
Energy costMJ/kWh
Operationalmode
Baseline Optimal Difference
DP Low 11.84 8.73 -26.26%
DP High 10.21 - -
Transit 12kn 7.99 - -
Transit 9kn* 10.64 7.99 -25%
Transit 6kn 8.89 - -
Harbour 11.89 8.99 -24.40%
Stand-by 11.23 8.79 -21.74%
DNV GL © 2015 19 June 2017
Applications inShips in Operation
DNV GL © 2015 19 June 201738
Optimum Power management Strategies
DNV GL © 2015 19 June 2017
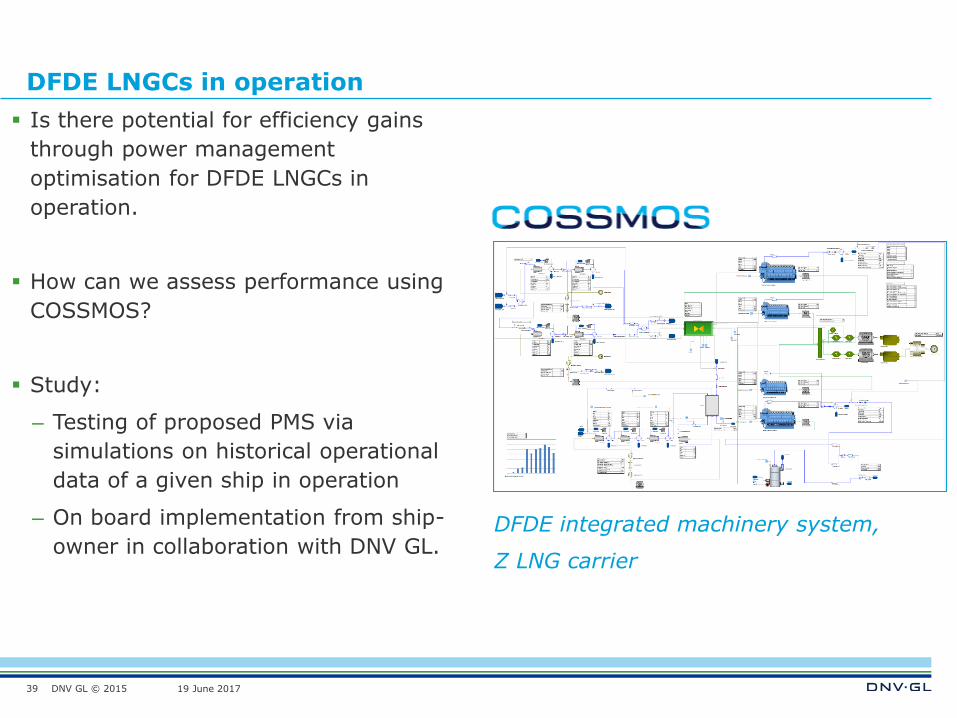
DFDE LNGCs in operation
Is there potential for efficiency gains
through power management
optimisation for DFDE LNGCs in
operation.
How can we assess performance using
COSSMOS?
Study:
– Testing of proposed PMS via
simulations on historical operational
data of a given ship in operation
– On board implementation from ship-
owner in collaboration with DNV GL.
39
DFDE integrated machinery system,
Z LNG carrier
DNV GL © 2015 19 June 2017
Operational data measurements from DFDE LNGC in operation
40
Engine #1 in operation
Engine #4 in operation
Engine #3 in operation
Engine #2 in operation
Vessel speed
DNV GL © 2015 19 June 2017
Simulation-based power management assessmentin Diesel electric vessels
41
Load (-) As recorded from onboard operation
Hours from start of month
Load (-) As selected by COSSMOS optimal Power Management
Hours from start of month
Hours from start of month
Estimated equivalent fuel savings (tons-LNG/day)
# Engines run
# Engines run
DNV GL © 2015 19 June 201742
Integrated system energy flow mapping
DNV GL © 2015 19 June 2017
DATA (design and operational) + computer MODELS
43
Accurate mapping of Energy
flow, Efficiency and Losses
Improved decision making
DNV GL © 2015 19 June 2017
Ambition: Model-based data driven asset management(near) Real time support
44
Build / adapt / expand COSSMOS models
Availability of an extended set of sensor signals
COSSMOS model simulates the conversion of energy across the vessel’s power train and compares with on board data
DNV GL © 2015 19 June 201745
Performance assessment and improvement of tanker cargo
operations
DNV GL © 2015 19 June 2017
Boiler / Steam turbine-driven pumping station onboardCompare operational with simulated performance
46
Ship-specific COSSMOS model
Simulations, analysis and optimisation
Assessment
Understanding
Best practices
Efficiency gains
Data acquisition
Data processing
DNV GL © 2015 19 June 2017
Crude oil tankers cargo operations
47
Complex systems, ship &
terminal operations, crew
functioning, inefficiencies.
How to assess energy
efficiency of the operations
quantitatively & improve
them in practice.
DNV GL © 2015 19 June 2017
COSSMOS performance assessment & improvementFleet in service
48
Crew change Crew changeCrew training and
best practices
adoption
DNV GL © 2015 19 June 201749
Using COSSMOS for cargo / BOG systems assessment,
improvement and troubleshooting
DNV GL © 2015 19 June 2017
Model-based troubleshooting of a BOG/LNG re-liquefaction system
50
Problem: poor performance
and low re-liquefaction
quantities (observed during
whole voyage(s))
Complex process many
potential causes
Complex control & scheduling
strategies.
Start for a design basis model
Assign “Health indexes” to all
major components.
Vary Health indexes to match
observed performance.
Search for large health index
variations.
Cold Box
Secondary JT valve
Main JT valve
Separator
Health index i
DNV GL © 2015 19 June 2017
Health index of “Cold box” heat exchanger
Excessive fouling due to oil contamination of
surfaces after ~2-3 hrs of operation
Purging, Inerting, Gas-freeing and Warming-up
clean the oil deposits when open for inspection!
Modelling was the strongest indicator!
51
DNV GL © 2015 19 June 2017
Summarizing
DNV GL © 2015 19 June 2017
Model-based Approaches for Ships
Advanced model-based methods that manage
complexity in practice: DNV GL COSSMOS
Robust decision making: Asset competitiveness
Improve attractiveness of maritime assets
– New bids and tenders: optimum configurations
– Operations optimisation
– New trades / charter extension
– Retrofitting
– Trouble-shouting
Quantification and allocation of investments
Practical today’s problems Answered via
Modelling, Simulation & Optimsation
53
DNV GL © 2015 19 June 2017
SAFER, SMARTER, GREENER
www.dnvgl.com
DNV∙GL
advantage through innovation
54
George Dimopoulos Ph.D.
Principal Specialist
E-mail [email protected]
Mobile +30 6956 200947 | Phone +30 2104100200