38
Plasma cell dyscrasias Mark Drayson
| Date post: | 06-Apr-2018 |
| Category: |
Documents |
| Upload: | truongcong |
| View: | 218 times |
| Download: | 4 times |
Plasma cell dyscrasiasMark Drayson

Mortality statistics for England and Wales. Deaths attributed to multiple myeloma from 1988-1997 by age cohort as a percentage of
total (21,257) deaths
02468
101214161820
<45
45-4
950
-54
55-5
960
-64
65-6
970
-74
75-7
980
-84
85-8
990
+
Age Cohort (years)
Dea
ths
in a
ge c
ohor
t as
perc
enta
ge
tota
l dea
ths
Age % <45 1.045-54 5.055-64 15.465-74 31.675+ 47.0
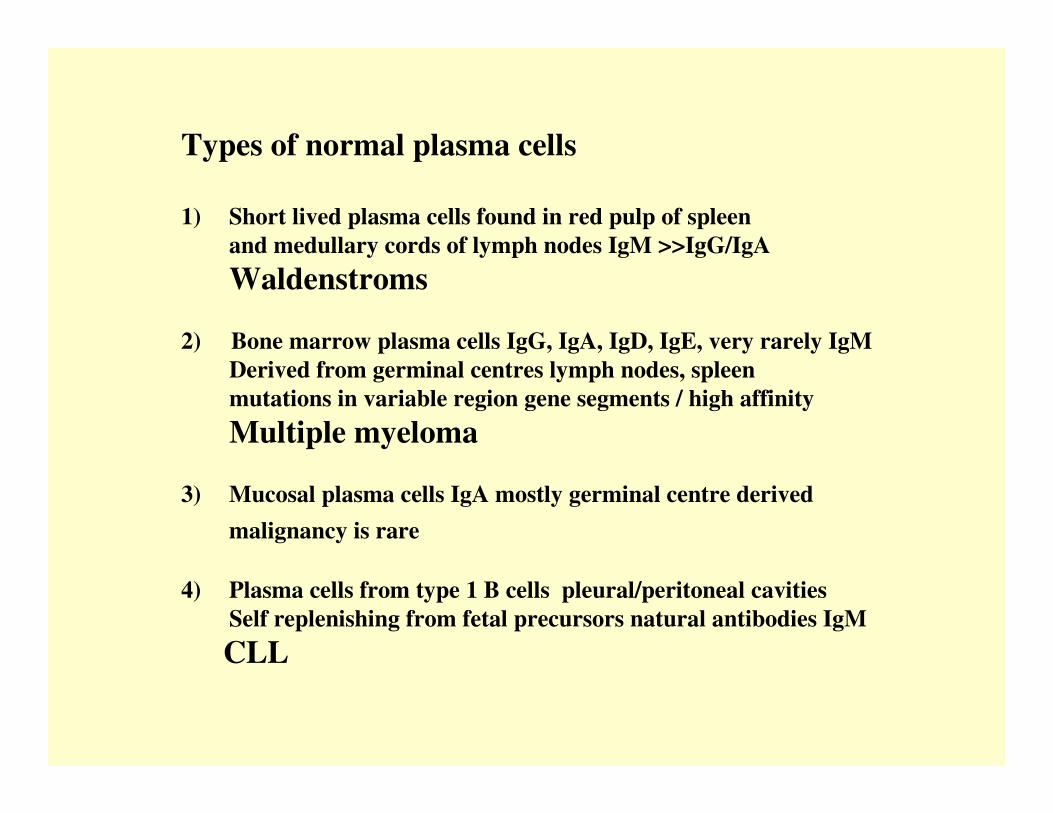
Types of normal plasma cells
1) Short lived plasma cells found in red pulp of spleenand medullary cords of lymph nodes IgM >>IgG/IgAWaldenstroms
2) Bone marrow plasma cells IgG, IgA, IgD, IgE, very rarely IgMDerived from germinal centres lymph nodes, spleenmutations in variable region gene segments / high affinityMultiple myeloma
3) Mucosal plasma cells IgA mostly germinal centre derivedmalignancy is rare
4) Plasma cells from type 1 B cells pleural/peritoneal cavitiesSelf replenishing from fetal precursors natural antibodies IgMCLL
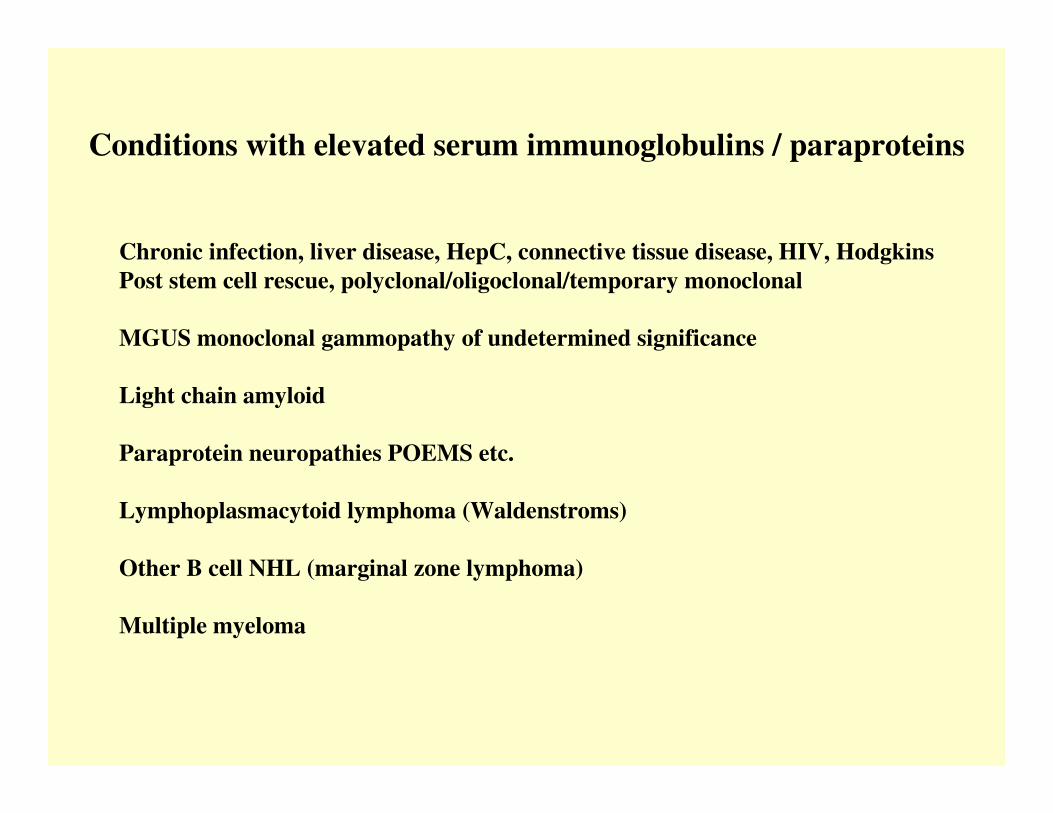
Conditions with elevated serum immunoglobulins / paraproteins
Chronic infection, liver disease, HepC, connective tissue disease, HIV, HodgkinsPost stem cell rescue, polyclonal/oligoclonal/temporary monoclonal
MGUS monoclonal gammopathy of undetermined significance
Light chain amyloid
Paraprotein neuropathies POEMS etc.
Lymphoplasmacytoid lymphoma (Waldenstroms)
Other B cell NHL (marginal zone lymphoma)
Multiple myeloma

PolyclonalImmunoglobulin

Small IgG kappa paraproteinWith no immunoparesis
Large IgG lambda paraproteinWith immunoparesis

Immunoparesis in myeloma
IgM (2695 patients)N.R. 0.5 – 2.0 g/l <0.5g/l 82%
>0.5g/l 18%>1.0g/l 4.0%>2.0g/l 0.8%
IgA and IgM in patients with IgG paraprotein (1498 patients)
N.R. IgM 0.5 – 2.0 g/l IgM > 0.5 and IgA > 0.8 11%IgA 0.8 – 4.0 g/l IgM > 1.0 and IgA > 2.0 1.4%
IgM > 2.0 and IgA > 4.0 0.2%
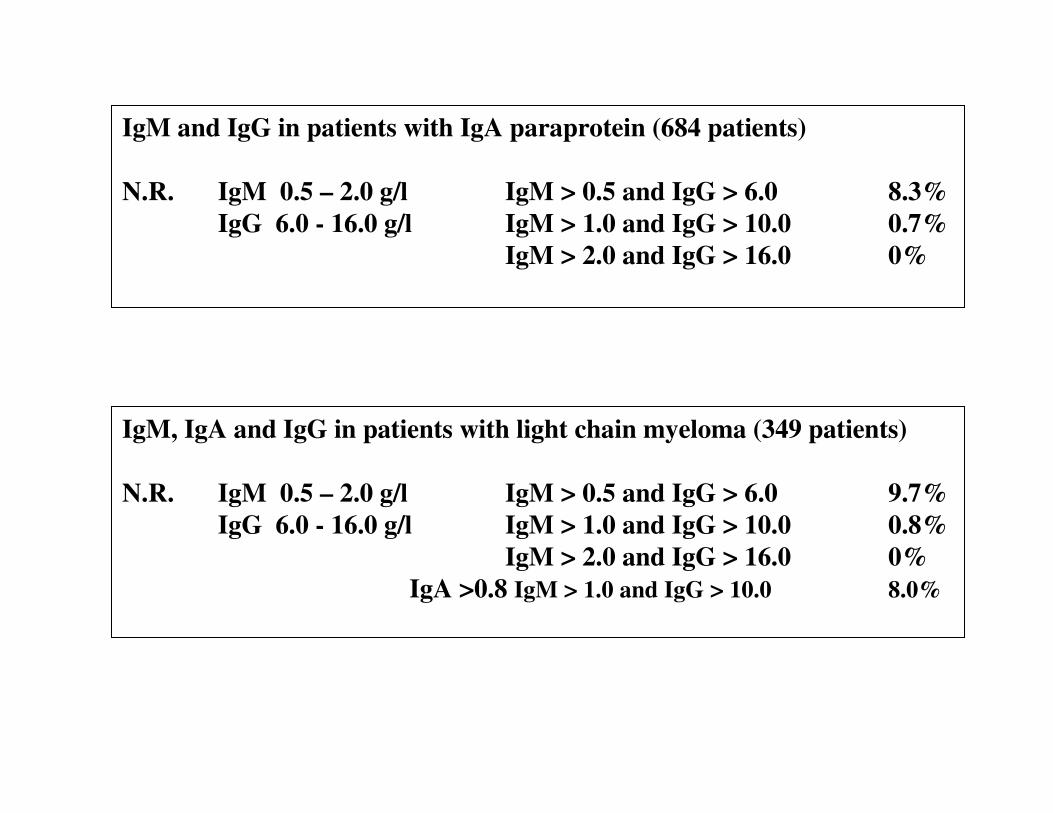
IgM and IgG in patients with IgA paraprotein (684 patients)
N.R. IgM 0.5 – 2.0 g/l IgM > 0.5 and IgG > 6.0 8.3%IgG 6.0 - 16.0 g/l IgM > 1.0 and IgG > 10.0 0.7%
IgM > 2.0 and IgG > 16.0 0%
IgM, IgA and IgG in patients with light chain myeloma (349 patients)
N.R. IgM 0.5 – 2.0 g/l IgM > 0.5 and IgG > 6.0 9.7%IgG 6.0 - 16.0 g/l IgM > 1.0 and IgG > 10.0 0.8%
IgM > 2.0 and IgG > 16.0 0%IgA >0.8 IgM > 1.0 and IgG > 10.0 8.0%

Criteria for the classification of monoclonal gammopathies,multiple myeloma and related disorders
International Myeloma Working Group
B. J Haem 2003, 121 749-757

MGUS•M-protein in serum <30g/l
•Bone marrow plasma cells <10%low level infiltration in trephine biopsy
•No evidence of other B-cell proliferative disorder
•No related organ or tissue impairment
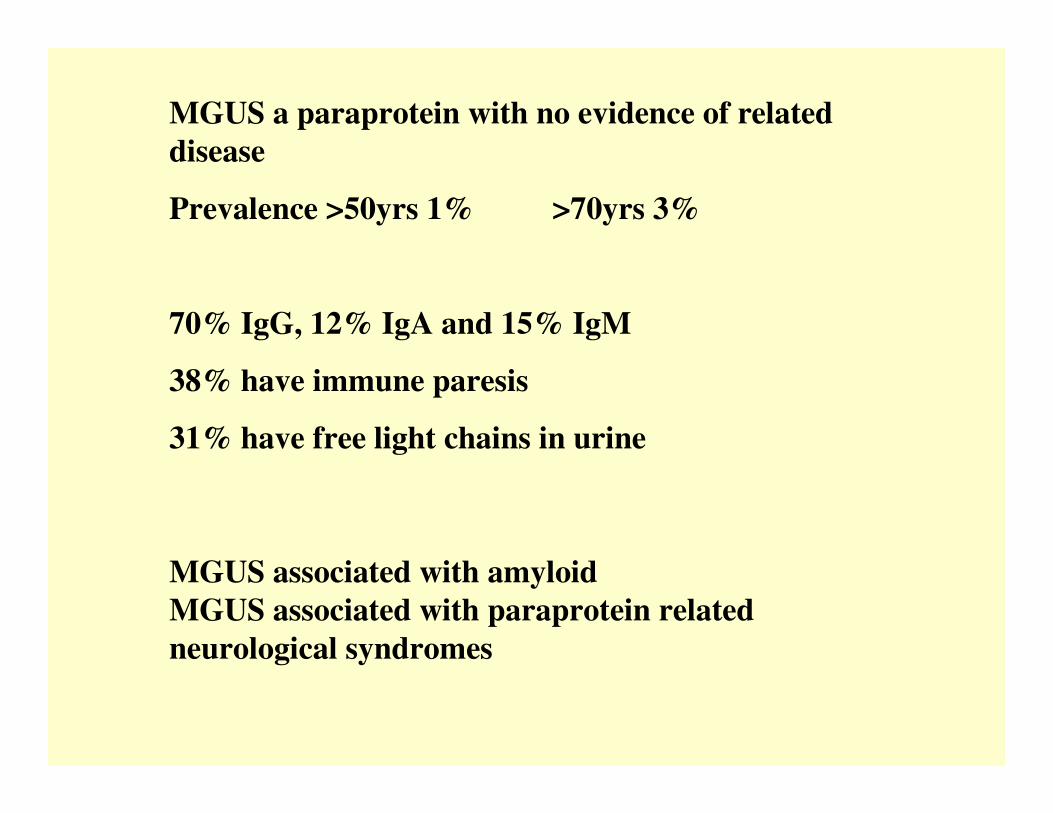
MGUS a paraprotein with no evidence of related disease
Prevalence >50yrs 1% >70yrs 3%
70% IgG, 12% IgA and 15% IgM
38% have immune paresis
31% have free light chains in urine
MGUS associated with amyloidMGUS associated with paraprotein related neurological syndromes
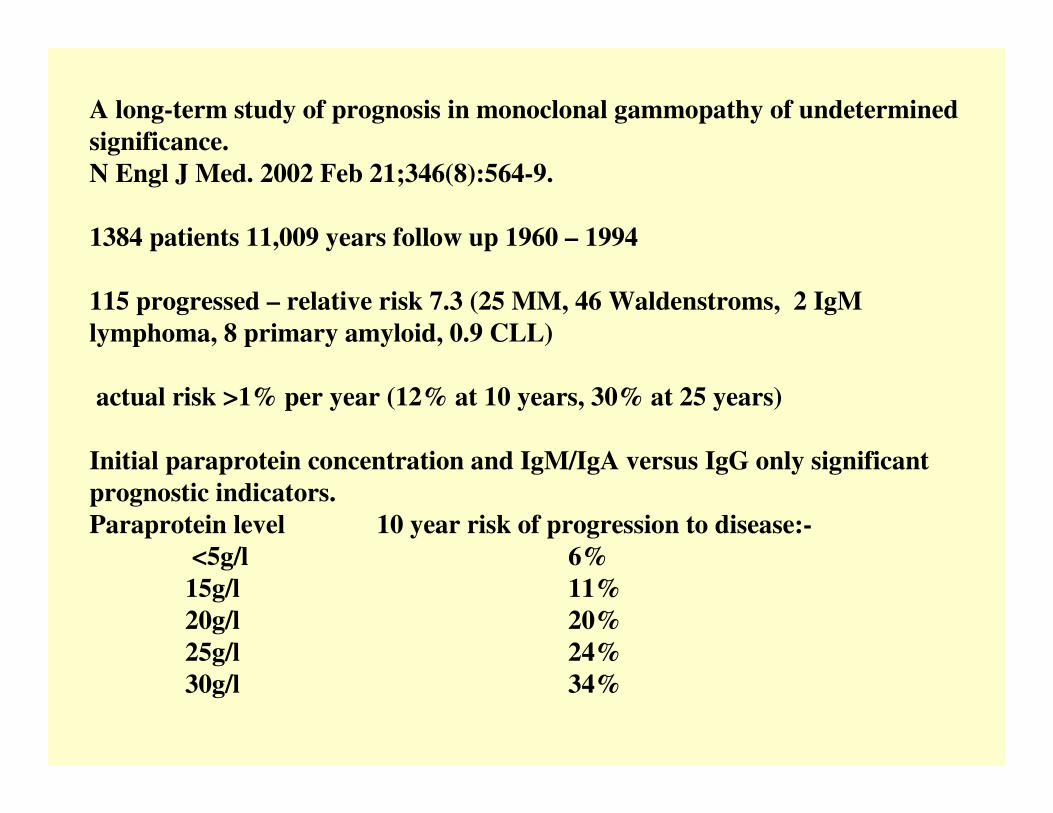
A long-term study of prognosis in monoclonal gammopathy of undetermined significance.N Engl J Med. 2002 Feb 21;346(8):564-9.
1384 patients 11,009 years follow up 1960 – 1994
115 progressed – relative risk 7.3 (25 MM, 46 Waldenstroms, 2 IgMlymphoma, 8 primary amyloid, 0.9 CLL)
actual risk >1% per year (12% at 10 years, 30% at 25 years)
Initial paraprotein concentration and IgM/IgA versus IgG only significant prognostic indicators.Paraprotein level 10 year risk of progression to disease:-
<5g/l 6%15g/l 11%20g/l 20%25g/l 24%30g/l 34%

Symptomatic myelomaMust have evidence of related organ or tissue impairment (ROTI)C calcium >0.25mmol/l above normal / >2.75mmol/lR renal impairment attributable to myelomaA anaemia 2g/dl below normal or <10g/dlB bone lesions lytic or osteoporosis with compression fractueO other symptomatic hyperviscosity, amyloidosis,
recurrent bacterial infectionWith •Bone marrow clonal plasma cells (usually>10%)•M-protein in serum and / or urine (usually)
Asymptomatic myelomaNo evidence of end-organ damage with both:•Bone marrow plasma cells >10%•M-protein in serum and or urine
-

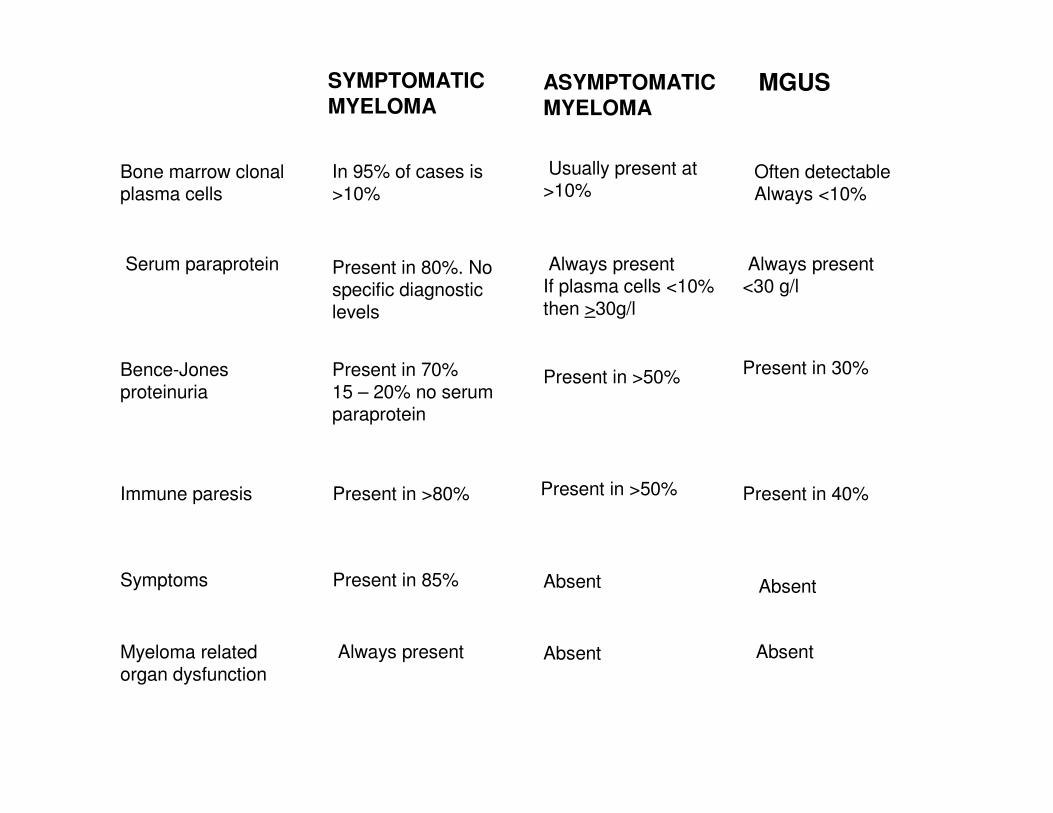
SYMPTOMATIC MYELOMA
ASYMPTOMATIC MYELOMA
MGUS
Bone marrow clonal plasma cells
In 95% of cases is>10%
Usually present at>10%
Often detectableAlways <10%
Serum paraprotein Present in 80%. No specific diagnostic levels
Always presentIf plasma cells <10% then >30g/l
Always present<30 g/l
Bence-Jones proteinuria
Present in 70%15 – 20% no serum paraprotein
Present in >50% Present in 30%
Immune paresis Present in >80% Present in >50% Present in 40%
Symptoms Present in 85% Absent Absent
Myeloma related organ dysfunction
Always present Absent Absent

UK Guidelines on the diagnosis and management of multiple myeloma.Br J Haematol. 2001 Dec;115(3):522-40. BCSH and UK MF
BSH Website
Up-dated with NORDIC groupSummer 2005

Indications for Starting Therapy
1. Chemotherapy is indicated for management of symptomatic myeloma
2. Chemotherapy is not indicated for patients with MGUSor those with asymptomatic myeloma (equivocal/indolent/smouldering).Patients with no symptoms, normal Hb, calcium and renal functionand no bone lesions may remain stable for a long period without treatment.Early intervention has shown no benefit in 2 randomised controlled trials(Hjorth. 1993; Riccardi et al 2000).

Overall survival by age and by plateau status
0
25
50
75
100
0 1 2 3 4 5 6 7 8 9 10Years from entry to trial
% a
live
> 65yrs - 428 patients
< 65yrs - 571 patients
39%
31%

Relapse free interval from start of plateau phase
0
25
50
75
100
0 1 2 3 4 5 6 7 8 9 10
Years from plateau
% r
elap
se fr
ee
< 6565 and over
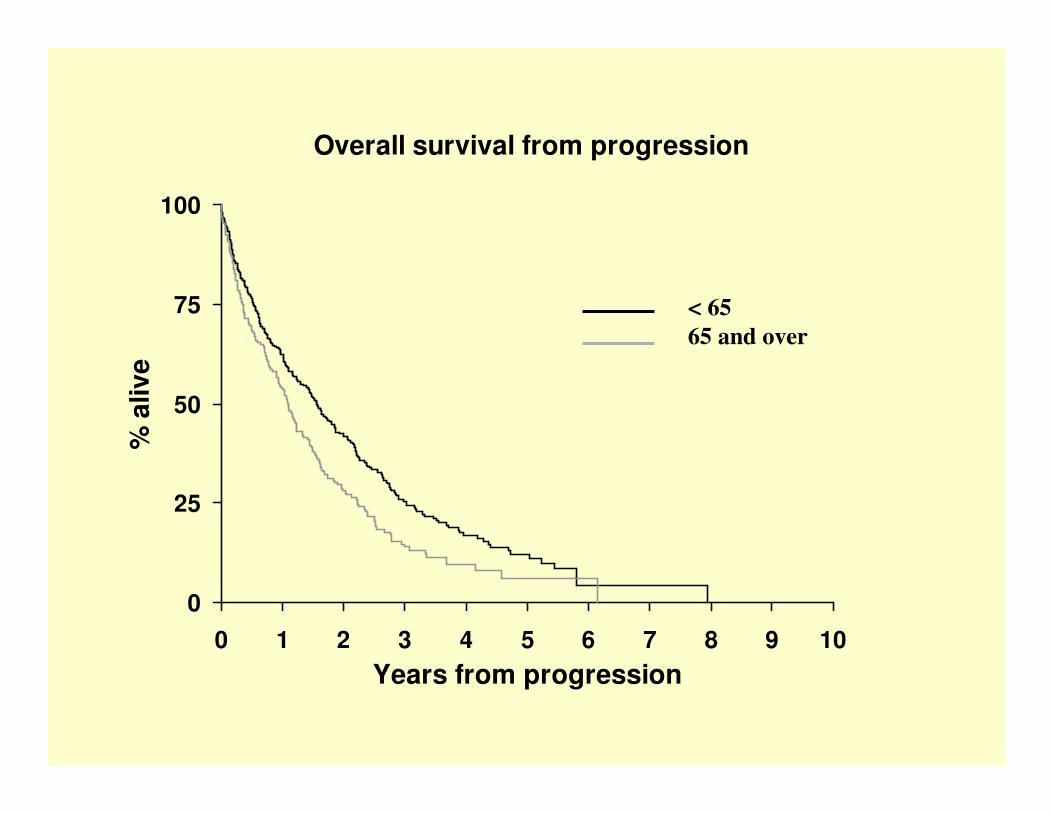
Overall survival from progression
0
25
50
75
100
0 1 2 3 4 5 6 7 8 9 10Years from progression
% a
live
< 6565 and over

Infection in myeloma
Respiratory tract encapsulated pyogenic bacteria
Incidence 14% in year before diagnosis25% in first 3 months10% per patient year in plateau
Innate immunityIL-6, CRP
Specific immunityTI2 antibody responses
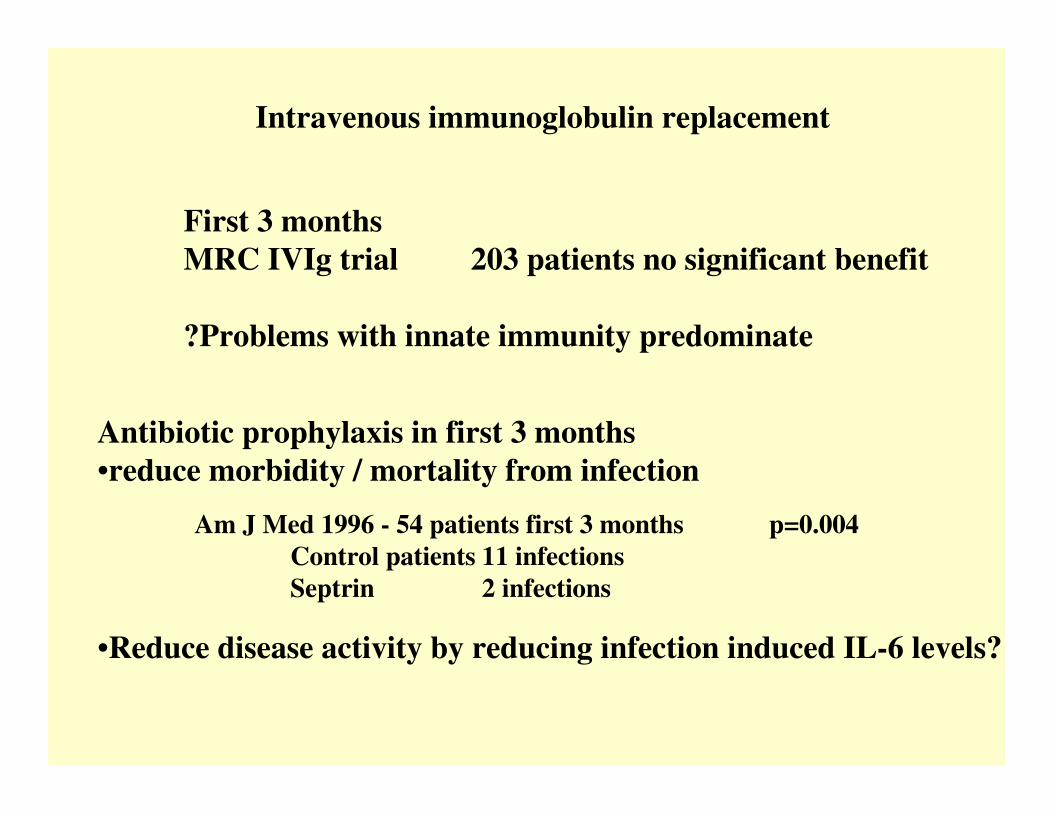
Intravenous immunoglobulin replacement
First 3 monthsMRC IVIg trial 203 patients no significant benefit
?Problems with innate immunity predominate
Antibiotic prophylaxis in first 3 months•reduce morbidity / mortality from infection
Am J Med 1996 - 54 patients first 3 months p=0.004Control patients 11 infectionsSeptrin 2 infections
•Reduce disease activity by reducing infection induced IL-6 levels?
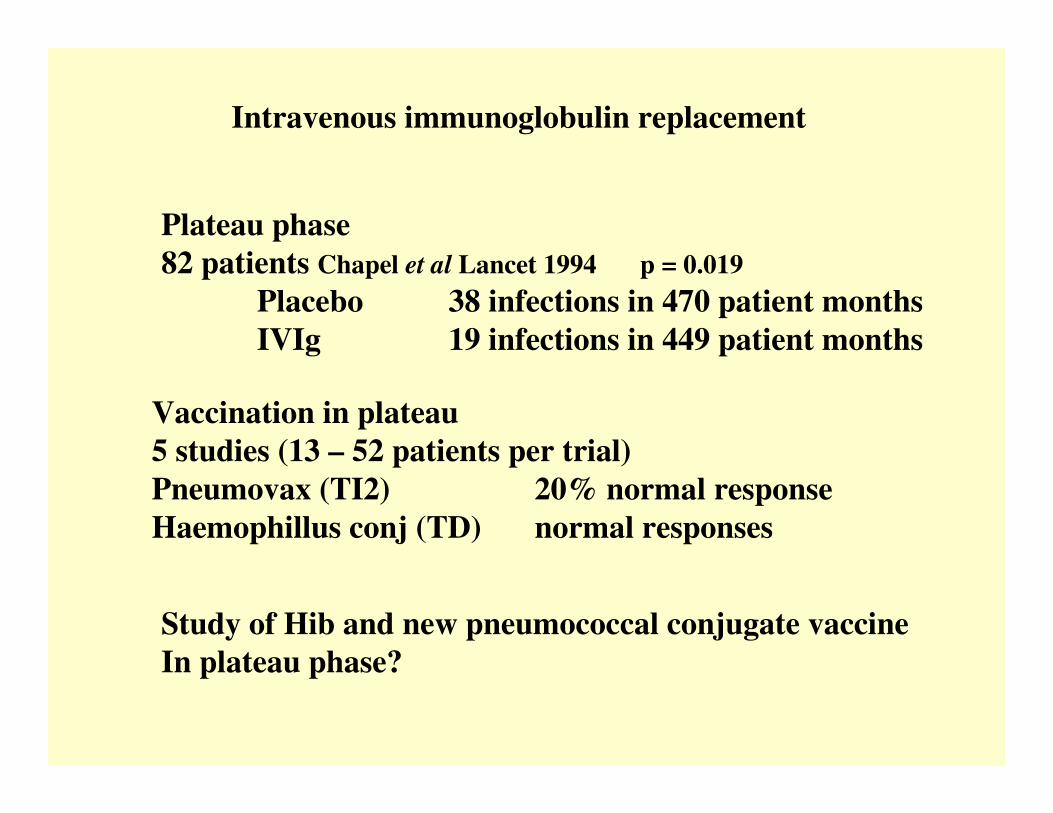
Intravenous immunoglobulin replacement
Plateau phase82 patients Chapel et al Lancet 1994 p = 0.019
Placebo 38 infections in 470 patient monthsIVIg 19 infections in 449 patient months
Vaccination in plateau5 studies (13 – 52 patients per trial)Pneumovax (TI2) 20% normal responseHaemophillus conj (TD) normal responses
Study of Hib and new pneumococcal conjugate vaccineIn plateau phase?

Immunoglobulin2 identical heavy chains (Gene chromosome 14)2 identical light chainsEither Kappa (Gene chromosome 2)Or Lambda (Gene chromosome 22)
Normal plasma cell secretion ofwhole immunoglobulin and free light chains
KappaPlasmacells
LambdaPlasma cells

Production of FLCIncreased malignant FLCDecreased alternate polyclonal FLC
BLOODFLC
NEOPLASTICCLONE
FLC
GLOMERULARFILTRATION
TUBULARREABSORPTION
URINEFLC
FLC
FLC
FLC
Changes in removal of FLCfrom blood by GF do not alterΚ/Λ Κ/Λ Κ/Λ Κ/Λ serum FLC ratio
FLC production and filtrationmust exceed TR for FLC toappear in urine
32% of MM patientshave <40mg/l FLC in urine
Therefore altered serum κ/λκ/λκ/λκ/λ FLC ratio
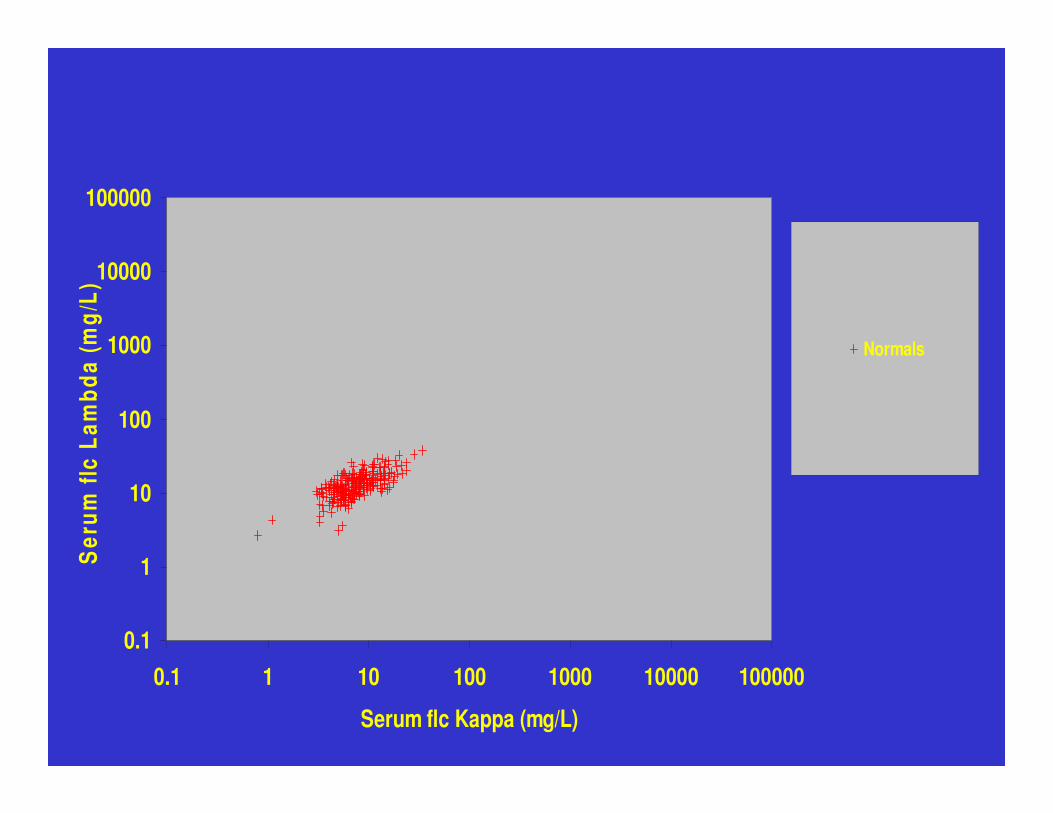
0.1
1
10
100
1000
10000
100000
0.1 1 10 100 1000 10000 100000
Serum flc Kappa (mg/L)
Ser
um fl
c La
mbd
a (m
g/L)
Normals

0.1
1
10
100
1000
10000
100000
0.1 1 10 100 1000 10000 100000
Serum flc Kappa (mg/L)
Ser
um fl
c La
mbd
a (m
g/L)
Normals
Lambda BJ
Kappa BJ
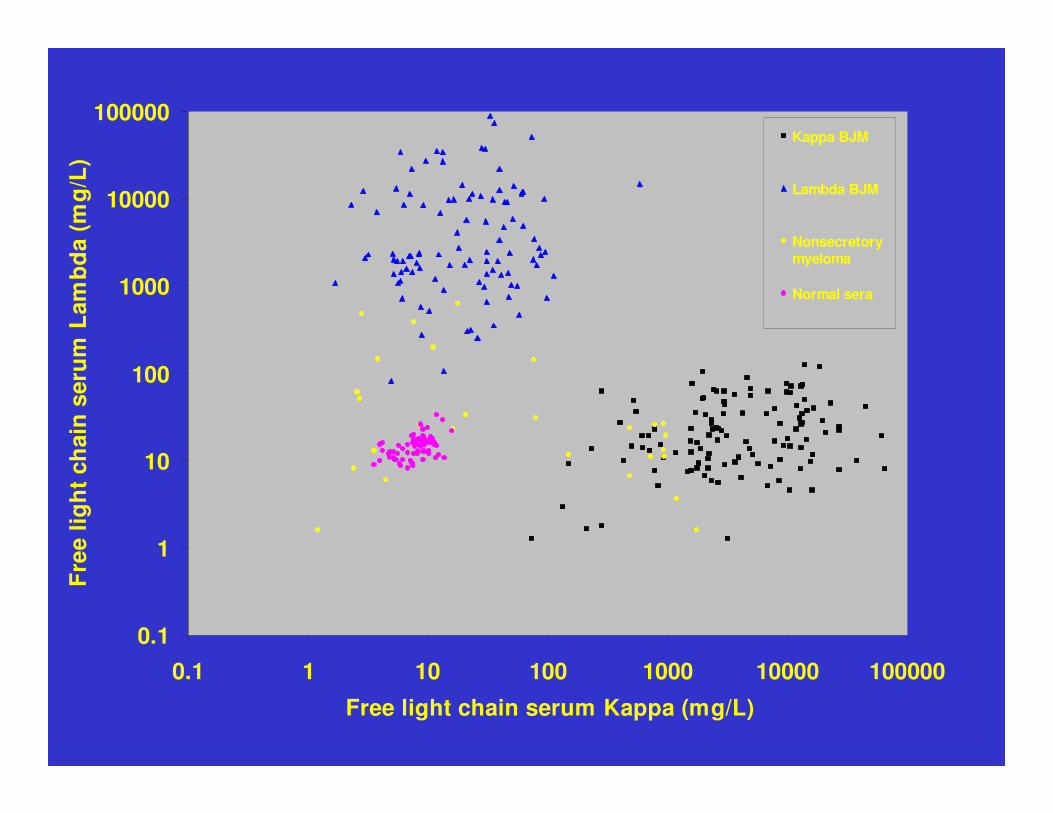
Lancet 2003 361 489-491
0.1
1
10
100
1000
10000
100000
0.1 1 10 100 1000 10000 100000
Free light chain serum Kappa (mg/L)
Fre
e lig
ht
chai
n s
eru
m L
amb
da
(mg
/L)
Kappa BJM
Lambda BJM
Nonsecretorymyeloma
Normal sera
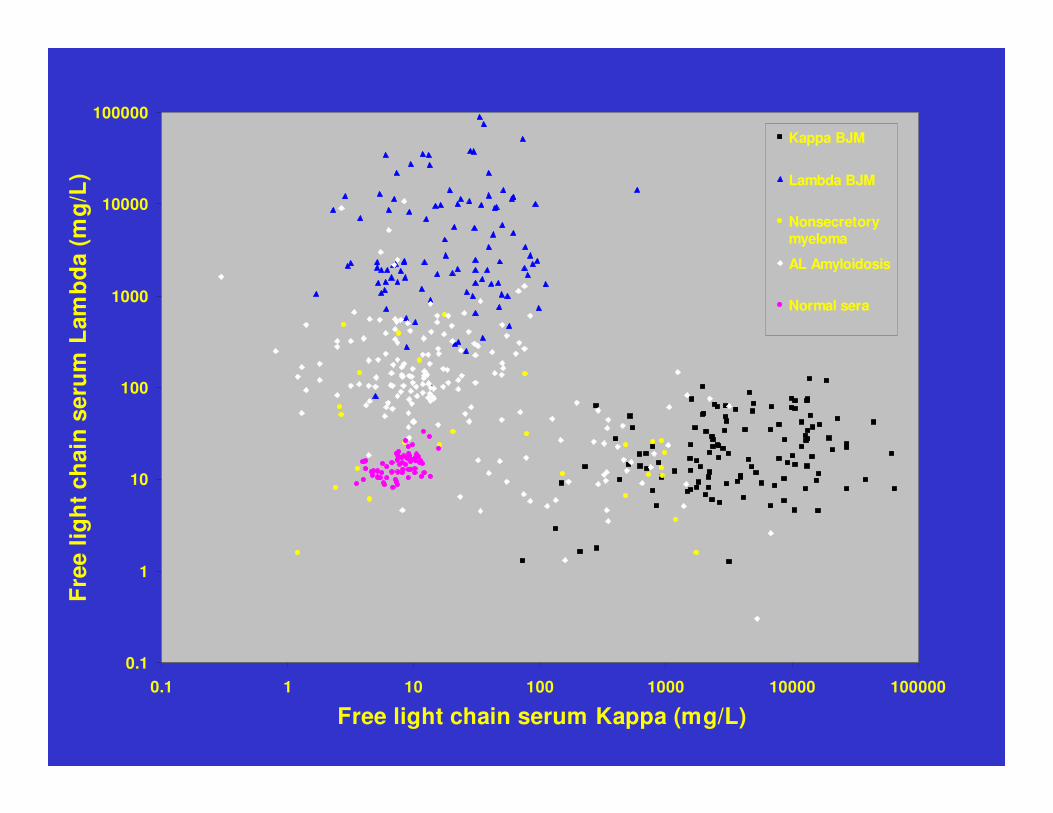
0.1
1
10
100
1000
10000
100000
0.1 1 10 100 1000 10000 100000
Free light chain serum Kappa (mg/L)
Fre
e lig
ht
chai
n s
eru
m L
amb
da
(mg
/L)
Kappa BJM
Lambda BJM
Nonsecretorymyeloma
AL Amyloidosis
Normal sera

Serum free light chain measurements
Diagnosis: More sensitive than immunofixation (10-100x)No problem with renal threshold1/3 patients with no detectable urinary FLCFLC only myeloma, Non-secretory myelomaAmyloidosis
Monitoring: Not confounded by changes in renal function
Rapid response to changes in tumour loadbecause of short half life (hours)
More sensitive (What is a complete response?)
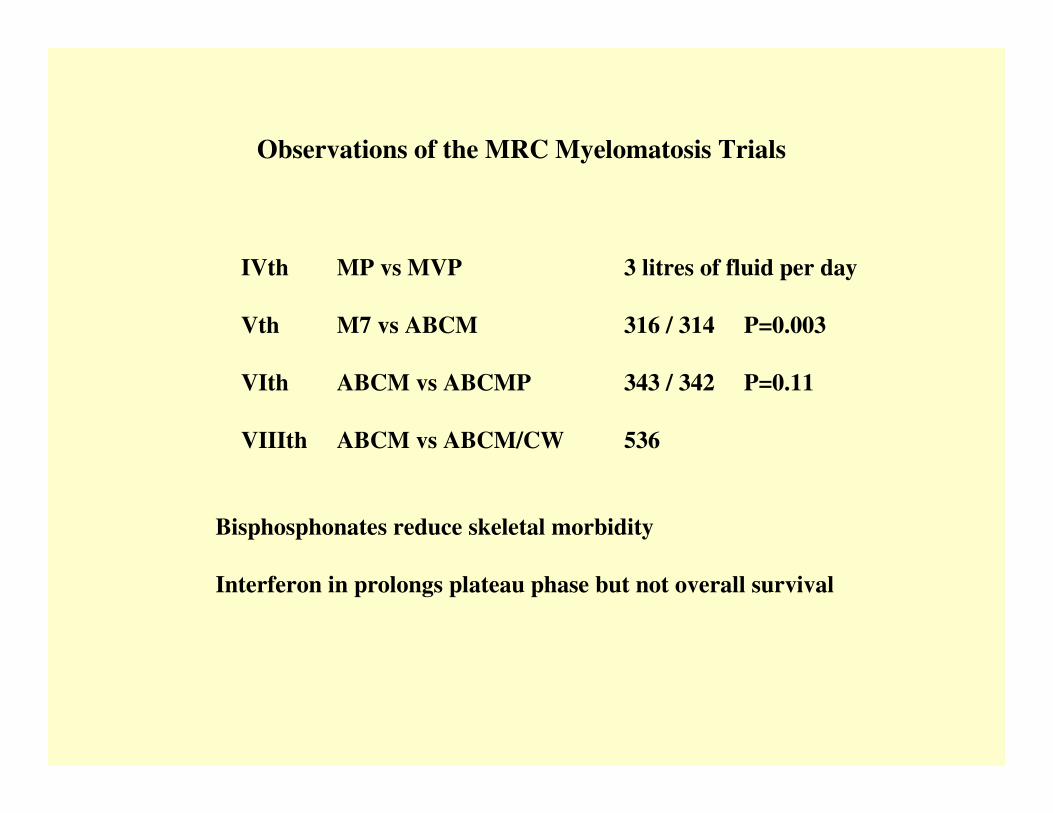
Observations of the MRC Myelomatosis Trials
IVth MP vs MVP 3 litres of fluid per day
Vth M7 vs ABCM 316 / 314 P=0.003
VIth ABCM vs ABCMP 343 / 342 P=0.11
VIIIth ABCM vs ABCM/CW 536
Bisphosphonates reduce skeletal morbidity
Interferon in prolongs plateau phase but not overall survival
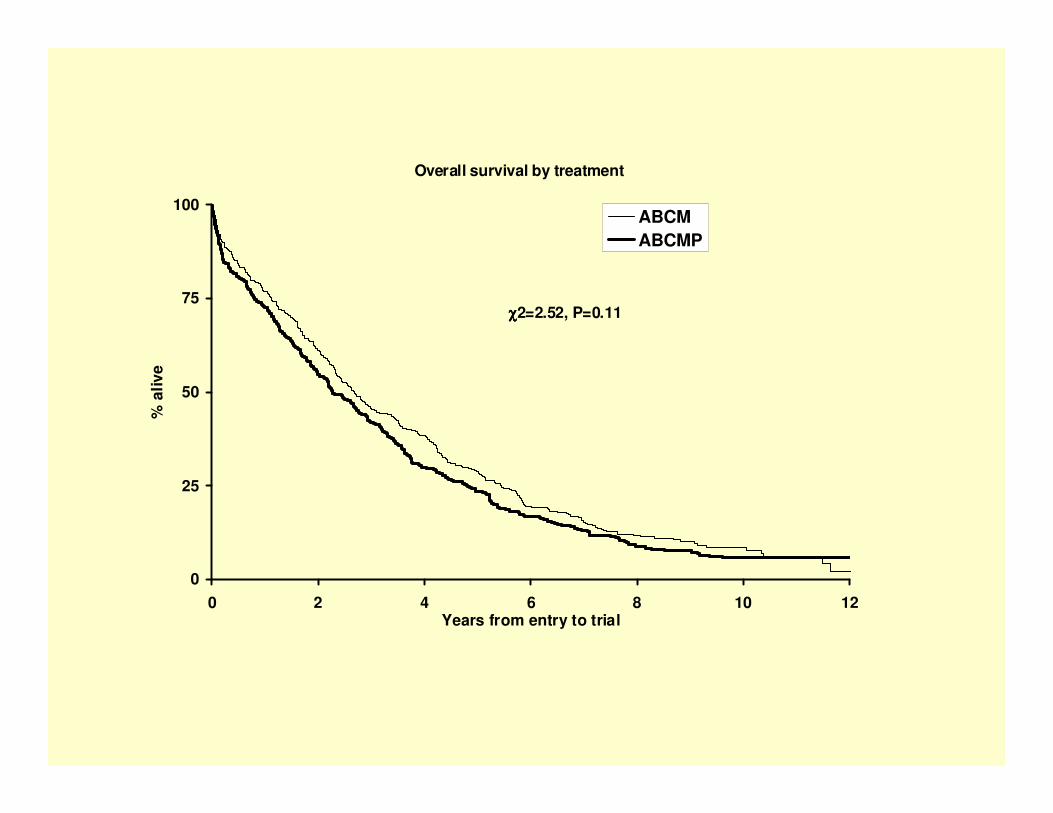
Overall survival by treatment
0
25
50
75
100
0 2 4 6 8 10 12Years from entry to trial
% a
live
ABCMABCMP
χχχχ2=2.52, P=0.11

The clodronate trial showed:•Reduced morbidity from skeletal disease•Patients (155) without overt skeletal disease at presentationappeared to benefit more than patients with fractures at presentation•No overall survival benefit
Overall survival by treatment
0
25
50
75
100
0 2 4 6 8 10 12Years from entry to trial
% a
live
CLODRONATEPLACEBO
χχχχ2=0.94, P=0.33
Overall survival by treatment for those patients presenting with no fractures
0
25
50
75
100
0 2 4 6 8 10 12Years from entry to trial
% a
live
CLODRONATEPLACEBO
χχχχ2=8.24, P=0.004

Non-intensive treatmentMelphalan +/- prednisoloneABCM
Intensive treatmentVAD / CVAMP (avoid stem cell damage)Then high dose melphalan with PBSCT mortality <5%
Allogeneic high mortality 20% - 38%
Interferon in plateau phase - probably not

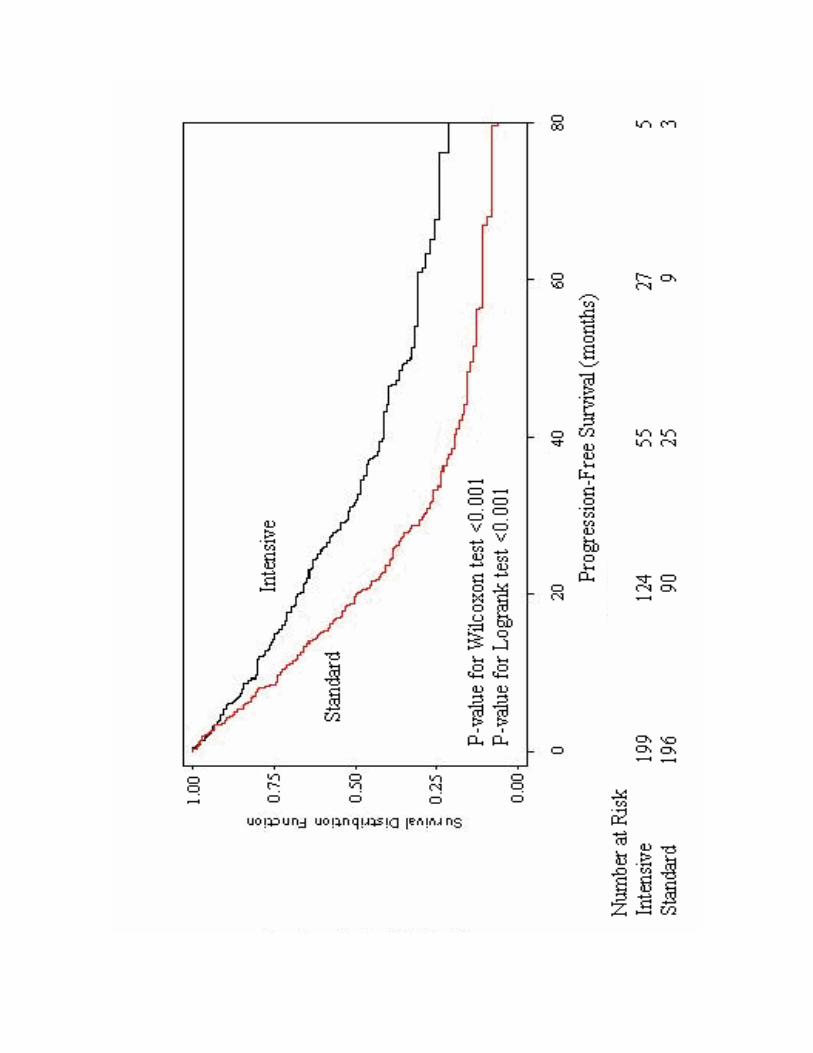
Intensive versus conventional chemotherapy
New England J Med 2003 348 1875 - 83


THALIDOMIDE
MONOCLONALS
MINI-ALLOGRAFTS
PROTEASOME INHIBITORS
MRC 9Clodronate / zoledronateCVAD / CTD or MP / CTDThalidomide maintenance
MERITRandomisation to plasma exchange


