Mark E. Sorrells & Elliot Mark E. Sorrells & Elliot Heffner Heffner Department of Plant Breeding & Department of Plant Breeding & Genetics Genetics Association Breeding Strategies for Crop Improvement
Transcript
Mark E. Sorrells & Elliot HeffnerMark E. Sorrells & Elliot HeffnerDepartment of Plant Breeding & GeneticsDepartment of Plant Breeding & Genetics
Association Breeding Strategies for Crop Improvement
Presentation OverviewPresentation Overview
Molecular Plant Breeding Strategies
• Marker Assisted Selection
• Association Breeding
• Genomic (Genome-Wide) Selection
Methods, examples , applications
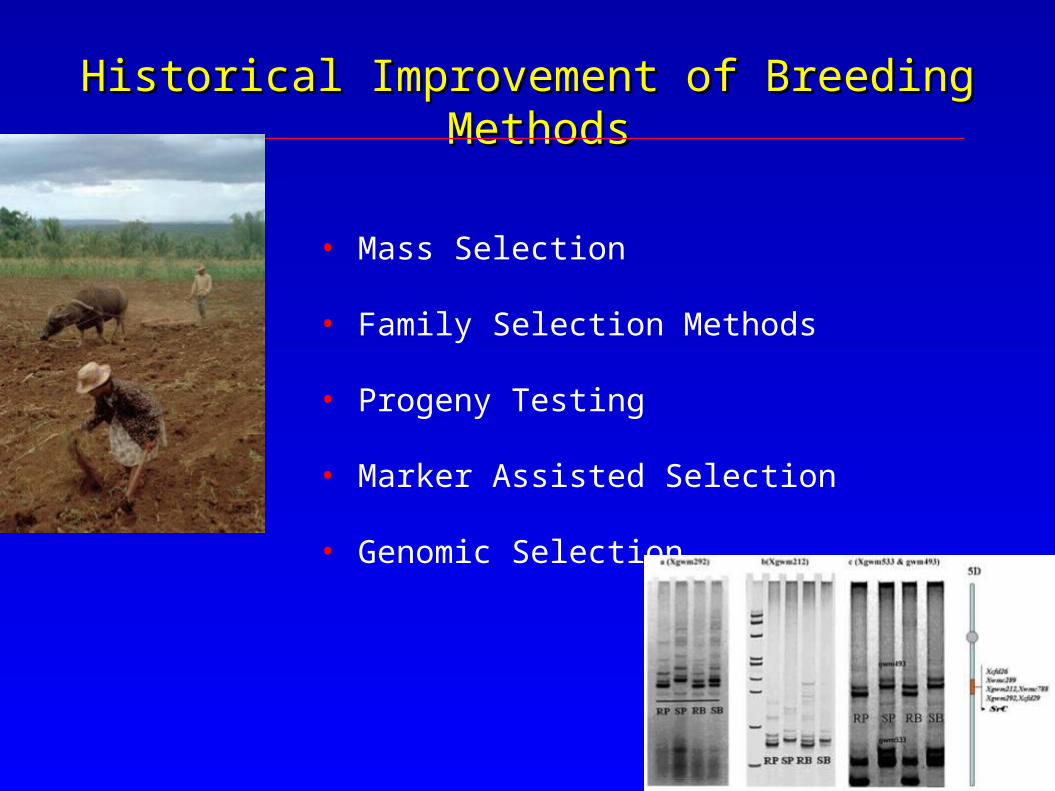
Historical Improvement of Breeding MethodsHistorical Improvement of Breeding Methods
• Mass Selection
• Family Selection Methods
• Progeny Testing
• Marker Assisted Selection
• Genomic Selection
Molecular Breeding GoalsMolecular Breeding Goals
• Allele discovery
• Allele characterization & validation
• Parental & progeny selection for superior
alleles, transgressive segregation
Strategies for Molecular BreedingStrategies for Molecular Breeding
• Genomic Selection (Meuwissen, Hayes & Goddard 2001)
• Requires genome-wide markers that are used to develop a prediction model for estimating a breeding value for each individual
• Marker/QTL effects are estimated for individuals in a breeding population without phenotyping
• Marker Assisted Selection• Only significant markers are used for selection, usually qualitative traits
• Association Breeding (Breseghello & Sorrells 2006)
• Uses conventional hybridization/MAS/Testing for significant markers
• Allows for updating breeding values for new and existing alleles
• Phenotyping and association analysis are used as often as necessary for allele discovery and validation
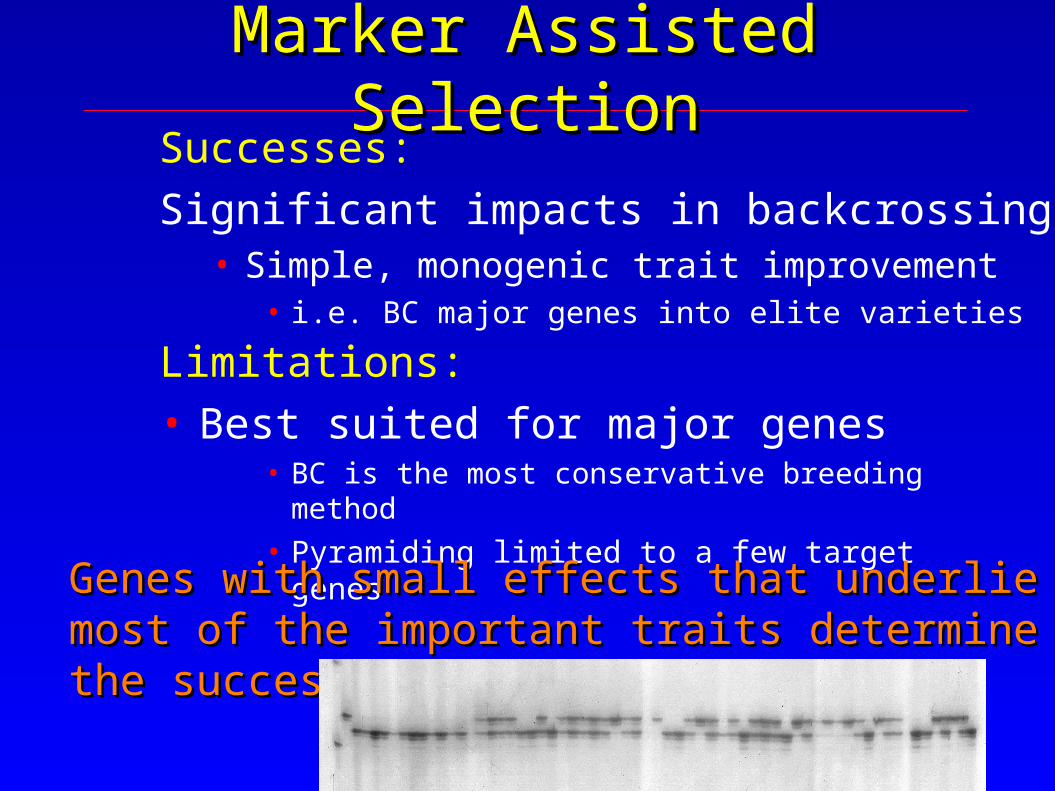
Significant impacts in backcrossing• Simple, monogenic trait improvement
• i.e. BC major genes into elite varieties
Limitations:
• Best suited for major genes• BC is the most conservative breeding method
• Pyramiding limited to a few target genes
Genes with small effects that underlie most of the Genes with small effects that underlie most of the important traits determine the success of new varieties important traits determine the success of new varieties
Association Mapping versus Bi-Parental QTL MappingAssociation Mapping versus Bi-Parental QTL Mapping
Association Mapping can be conducted relevant adapted groups of accessions
• Direct inference to a breeding population is possible
• Relevant genetic background effects are sampled
• Phenotypic variation is observed for most traits of interest
• Marker polymorphism higher than for biparental populations
• Routine variety trial evaluations provide high quality phenotypic data
• Characterize the structure of genetic variation in relevant populations
Novel alleles can be identified and their relative value can be assessed Novel alleles can be identified and their relative value can be assessed
as often as necessaryas often as necessary
Type I error (false positives) can be higher because of:
• Low heritability & small-effect QTL (heterogeneity of genetic background)
• Population structure
• Estimates of population structure or kinship are used in a linear mixed effects model to reduce the frequency of false positive associations
• High sampling variance of rare alleles
• Rare alleles are usually excluded from the analysis
Association Mapping versus QTL MappingAssociation Mapping versus QTL Mapping
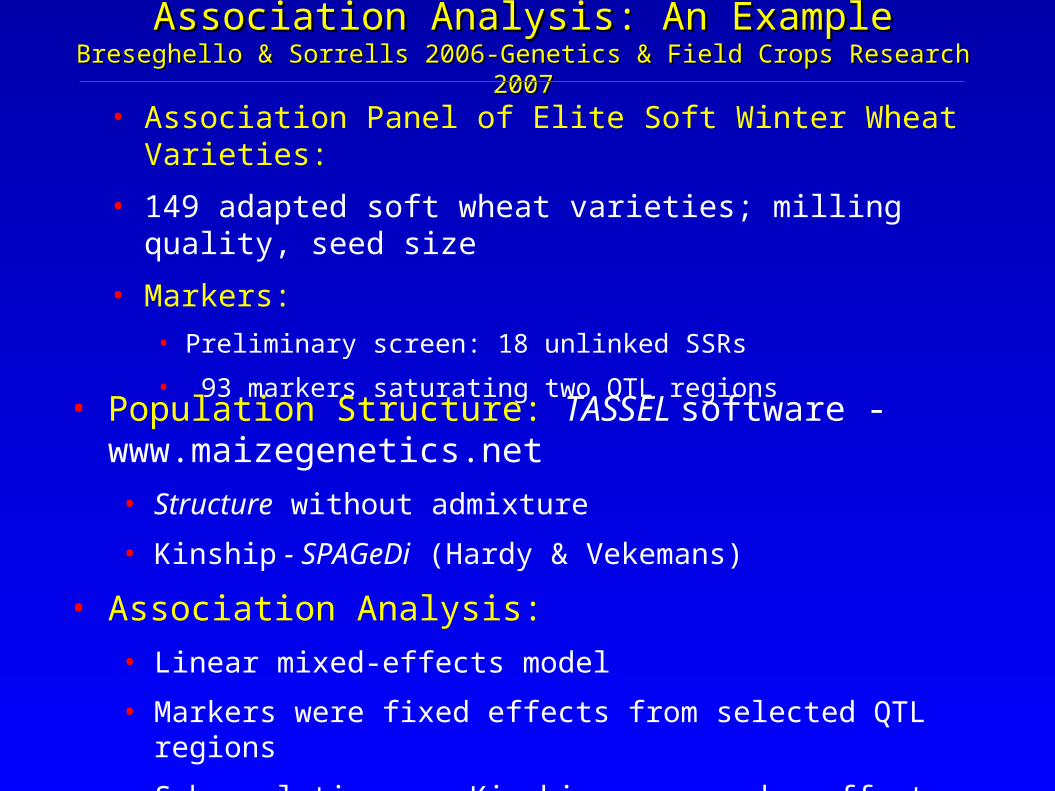
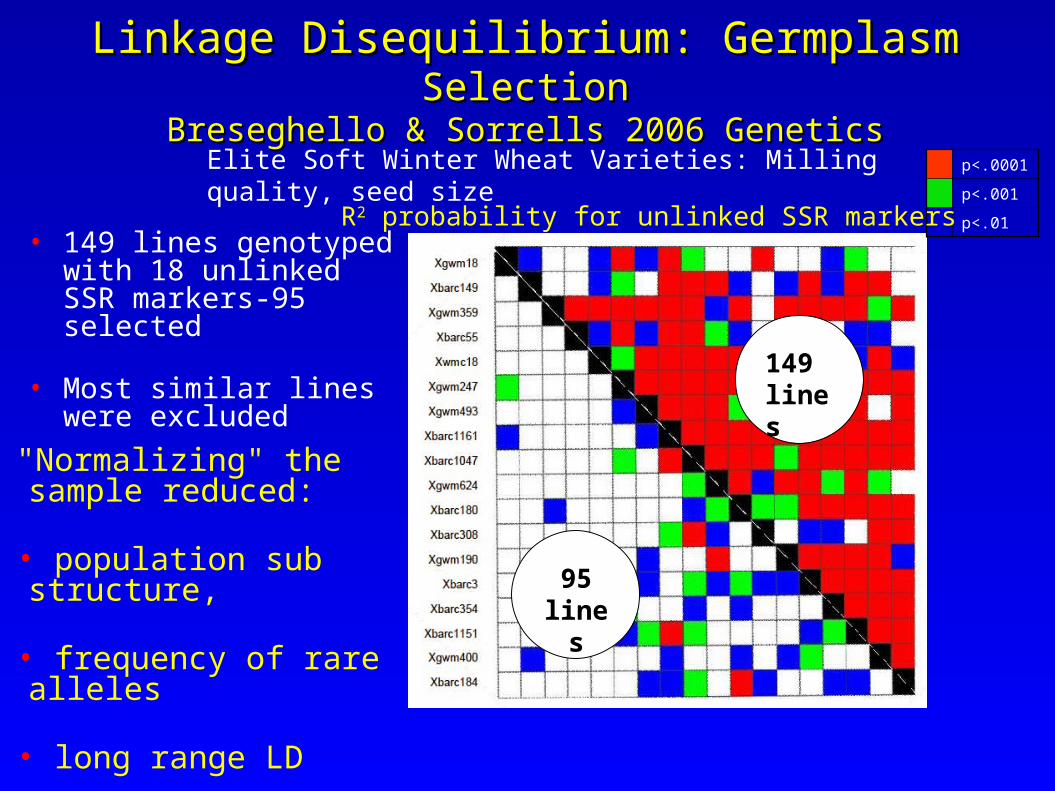
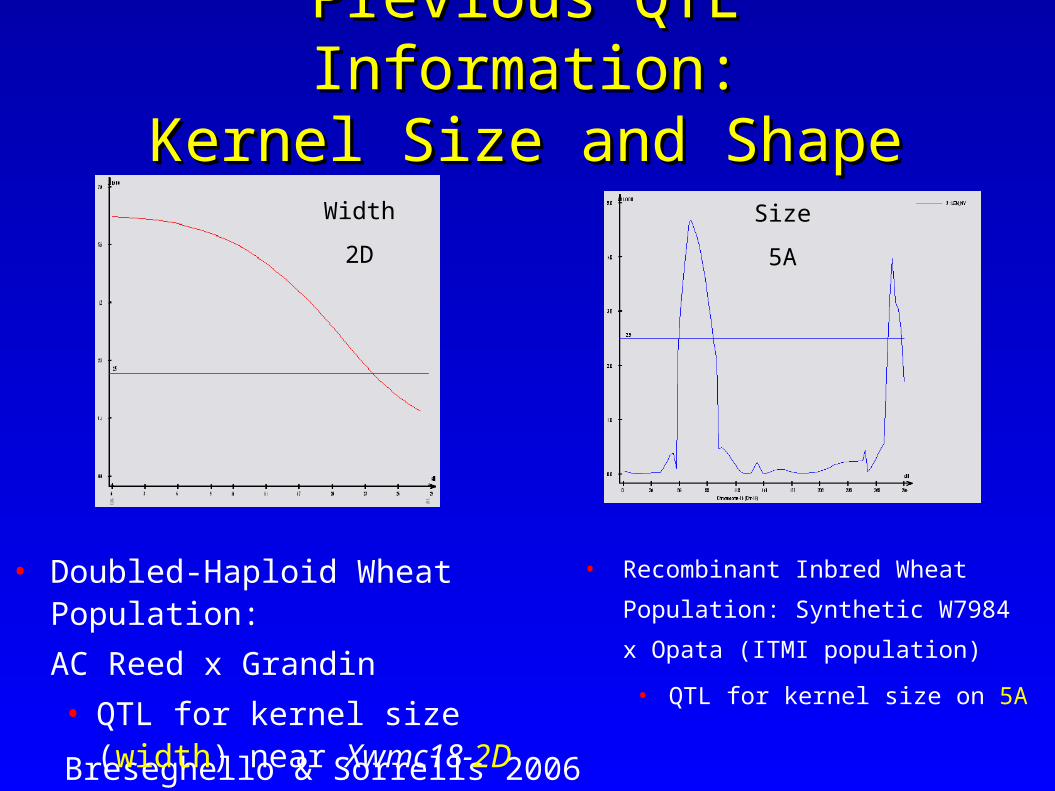
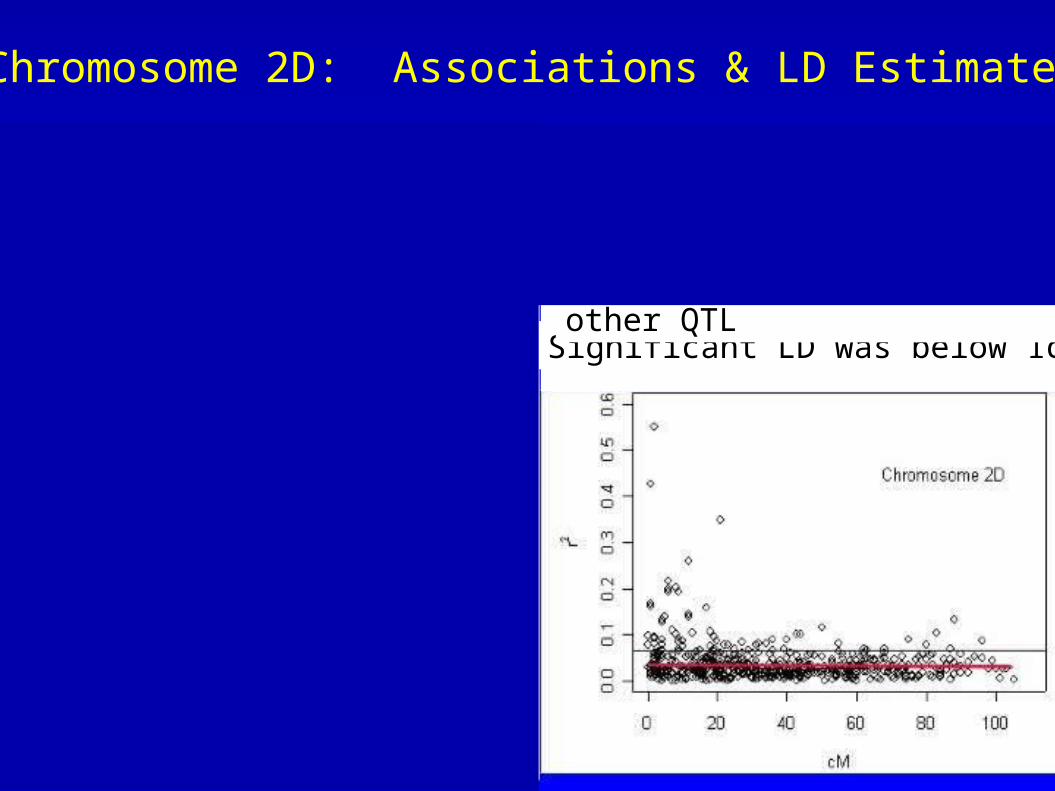
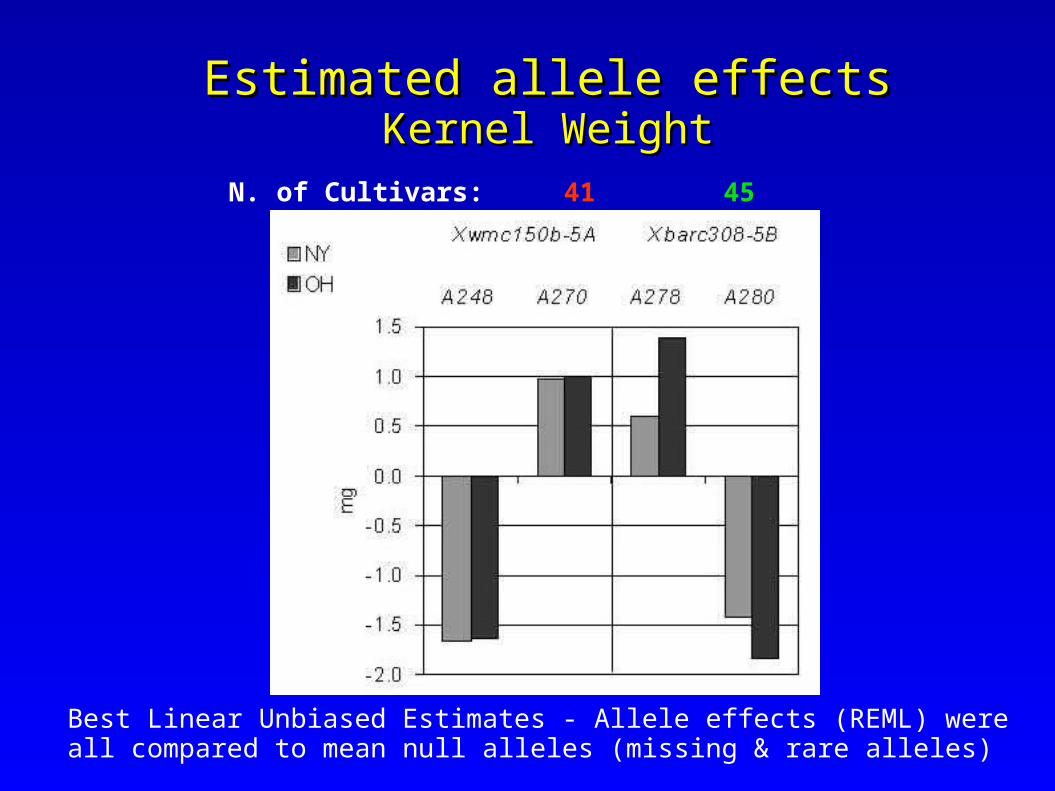
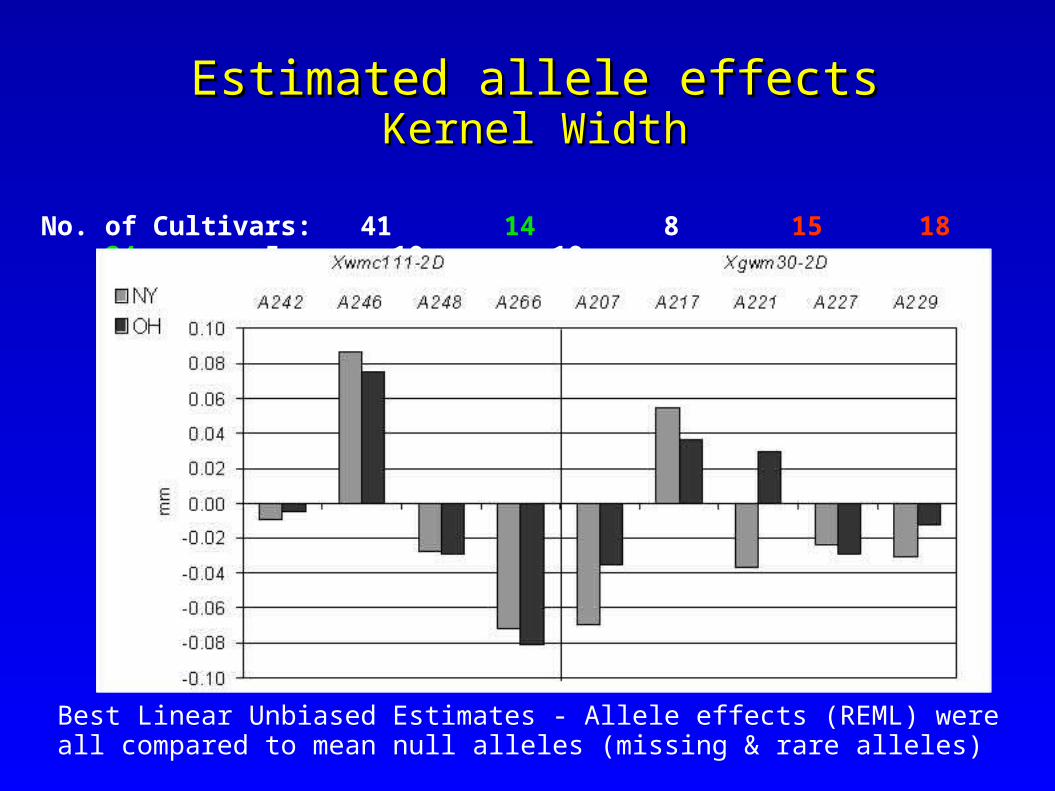
Association Analysis: An ExampleAssociation Analysis: An ExampleBreseghello & Sorrells 2006-Genetics & Field Crops Research 2007Breseghello & Sorrells 2006-Genetics & Field Crops Research 2007
• Association Panel of Elite Soft Winter Wheat Varieties:
Best Linear Unbiased Estimates - Allele effects (REML) were all compared to mean null alleles (missing & rare alleles)
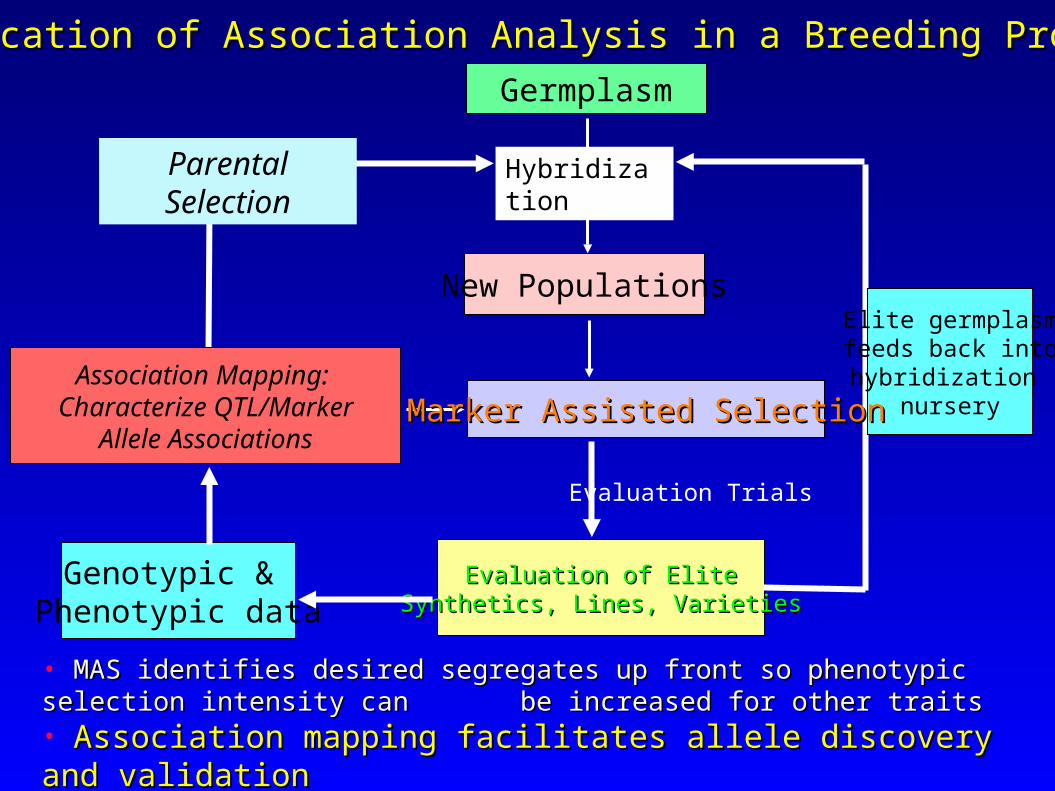
Germplasm
New Populations
Evaluation of EliteEvaluation of EliteSynthetics, Lines, VarietiesSynthetics, Lines, Varieties
Evaluation Trials
Genotypic & Phenotypic data
Association Mapping: Characterize QTL/Marker
Allele Associations
Application of Association Analysis in a Breeding ProgramApplication of Association Analysis in a Breeding Program
Elite germplasmfeeds back intohybridization
nursery
• MAS identifies desired segregates up front so phenotypic selection MAS identifies desired segregates up front so phenotypic selection intensity can intensity can be increased for other traitsbe increased for other traits• Association mapping facilitates allele discovery and Association mapping facilitates allele discovery and validationvalidation
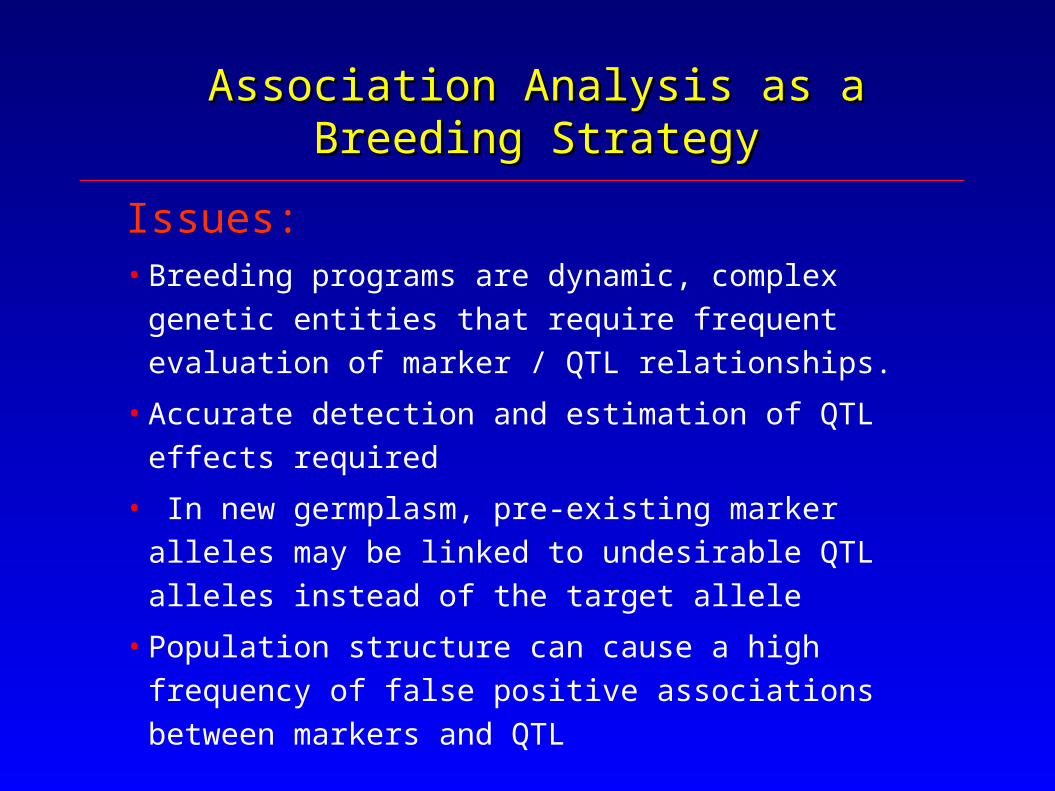
Association Analysis as a Breeding StrategyAssociation Analysis as a Breeding Strategy
Issues:• Breeding programs are dynamic, complex genetic entities that
require frequent evaluation of marker / QTL relationships.
• Accurate detection and estimation of QTL effects required
• In new germplasm, pre-existing marker alleles may be linked
to undesirable QTL alleles instead of the target allele
• Population structure can cause a high frequency of false
positive associations between markers and QTL
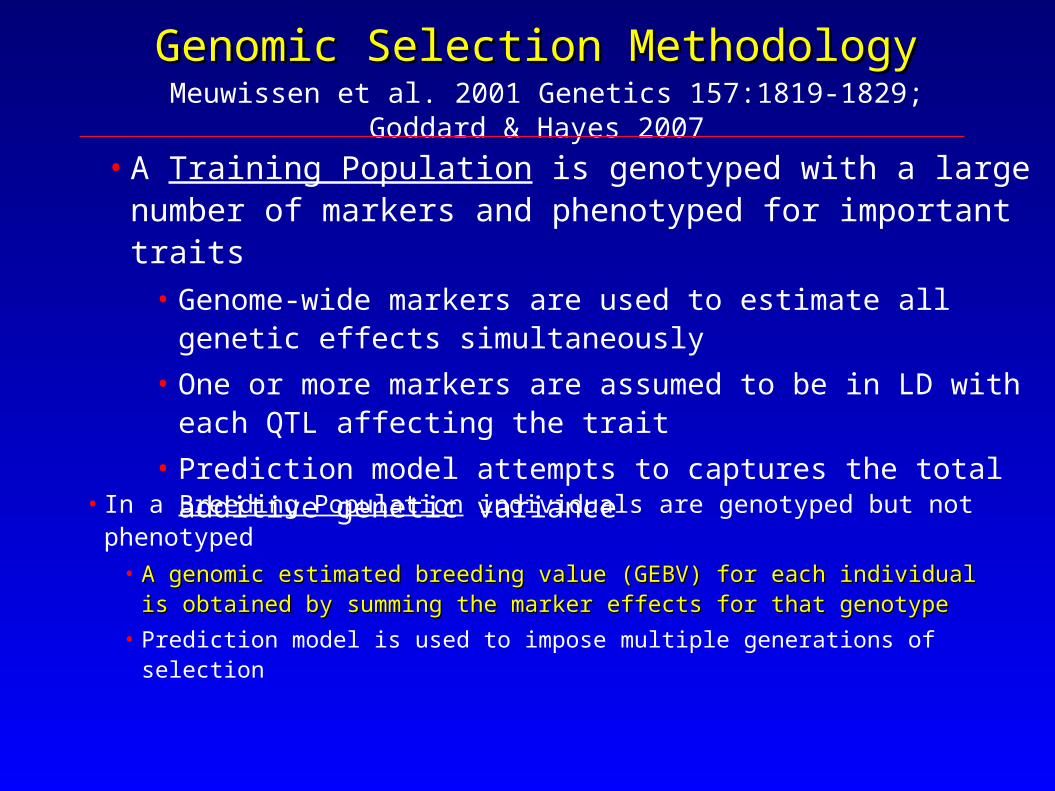
Genomic Selection MethodologyGenomic Selection Methodology Meuwissen et al. 2001 Genetics 157:1819-1829; Goddard & Hayes 2007
• In a Breeding Population individuals are genotyped but not phenotyped
• A genomic estimated breeding value (GEBV) for each individual is A genomic estimated breeding value (GEBV) for each individual is obtained by summing the marker effects for that genotype obtained by summing the marker effects for that genotype
• Prediction model is used to impose multiple generations of selection
• A Training Population is genotyped with a large number of markers and phenotyped for important traits
• Genome-wide markers are used to estimate all genetic effects simultaneously
• One or more markers are assumed to be in LD with each QTL affecting the trait
• Prediction model attempts to captures the total additive genetic variance
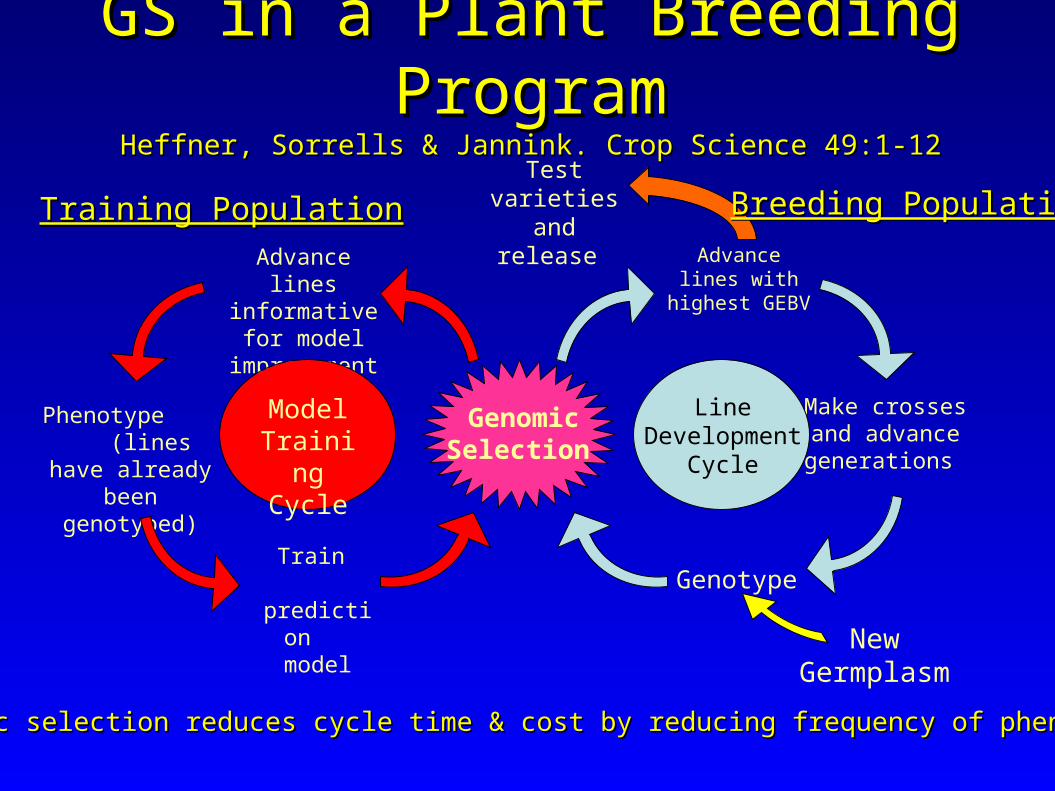
Test varieties and
release
Phenotype (lines have
already been genotyped)
Train prediction
model
Make crossesand advance generations
Genotype
Advance lines informative for
model improvement
New Germplasm
Line Development
Cycle
Genomic Selection
Advance lines with highest
GEBV
Model Training Cycle
GS in a Plant Breeding ProgramGS in a Plant Breeding ProgramHeffner, Sorrells & Jannink. Crop Science 49:1-12Heffner, Sorrells & Jannink. Crop Science 49:1-12
Genomic selection reduces cycle time & cost by reducing frequency of phenotypingGenomic selection reduces cycle time & cost by reducing frequency of phenotyping
Training PopulationTraining Population Breeding PopulationBreeding Population
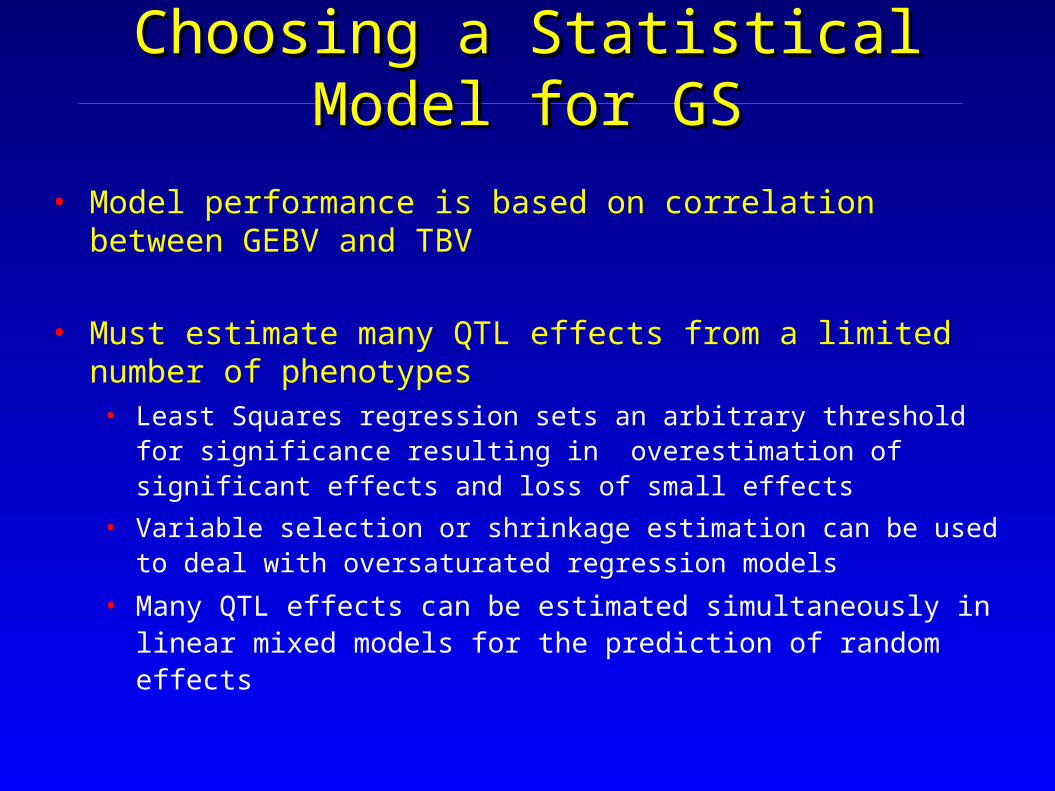
Choosing a Statistical Model for GSChoosing a Statistical Model for GS
• Model performance is based on correlation between GEBV and TBV
• Must estimate many QTL effects from a limited number of phenotypes• Least Squares regression sets an arbitrary threshold for significance resulting in
overestimation of significant effects and loss of small effects
• Variable selection or shrinkage estimation can be used to deal with oversaturated regression models
• Many QTL effects can be estimated simultaneously in linear mixed models for the prediction of random effects
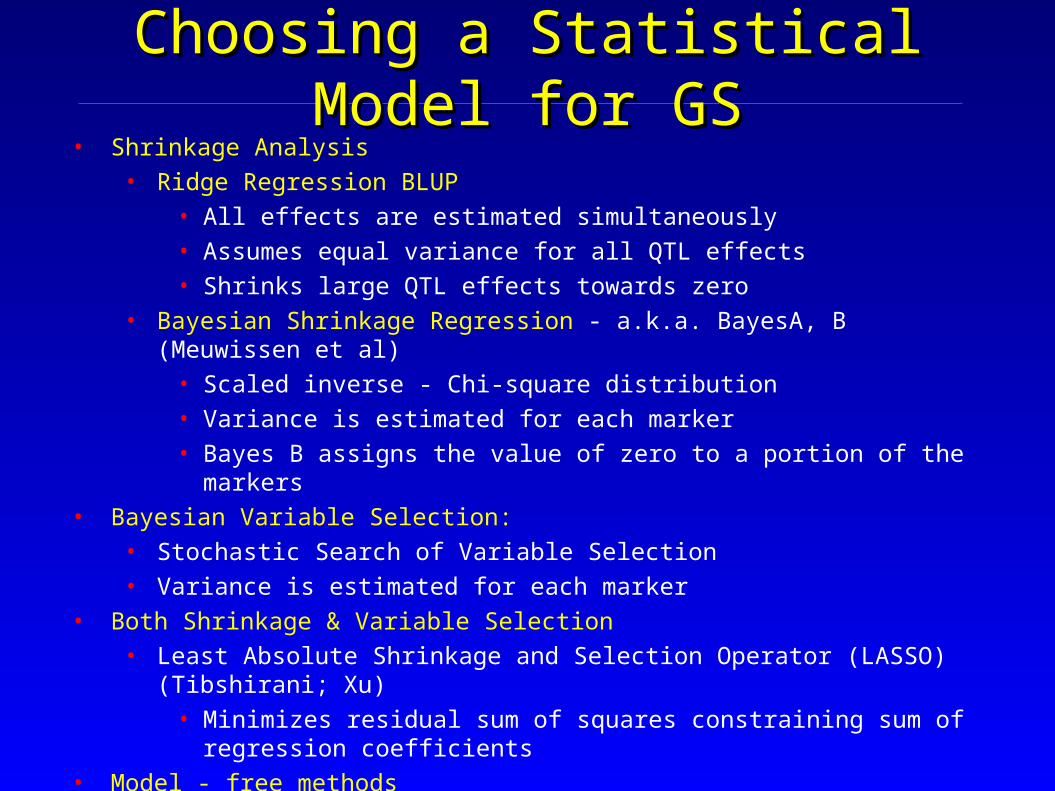
Choosing a Statistical Model for GSChoosing a Statistical Model for GS• Shrinkage Analysis
• Ridge Regression BLUP
• All effects are estimated simultaneously
• Assumes equal variance for all QTL effects
• Shrinks large QTL effects towards zero
• Bayesian Shrinkage Regression - a.k.a. BayesA, B (Meuwissen et al)
• Scaled inverse - Chi-square distribution
• Variance is estimated for each marker
• Bayes B assigns the value of zero to a portion of the markers
• Bayesian Variable Selection:
• Stochastic Search of Variable Selection
• Variance is estimated for each marker
• Both Shrinkage & Variable Selection
• Least Absolute Shrinkage and Selection Operator (LASSO) (Tibshirani; Xu)
• Minimizes residual sum of squares constraining sum of regression coefficients
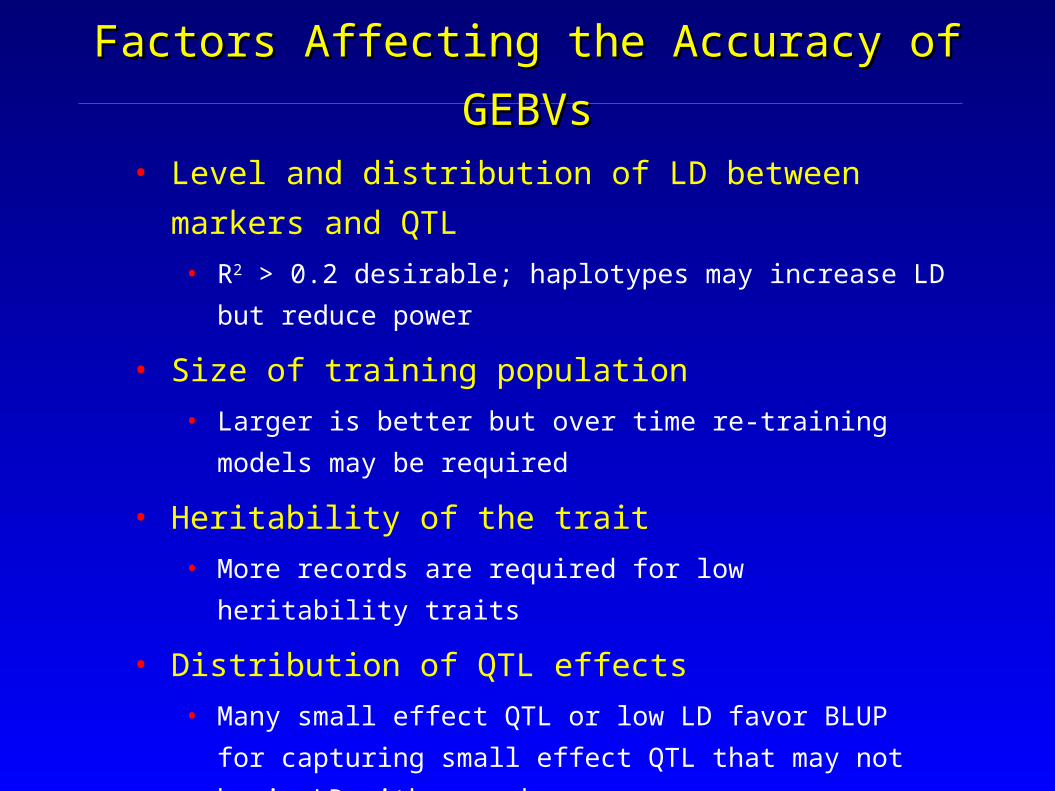
Factors Affecting the Accuracy of GEBVsFactors Affecting the Accuracy of GEBVs
• Level and distribution of LD between markers and QTL
• R2 > 0.2 desirable; haplotypes may increase LD but reduce power
• Size of training population
• Larger is better but over time re-training models may be required
• Heritability of the trait
• More records are required for low heritability traits
• Distribution of QTL effects
• Many small effect QTL or low LD favor BLUP for capturing small
effect QTL that may not be in LD with a marker
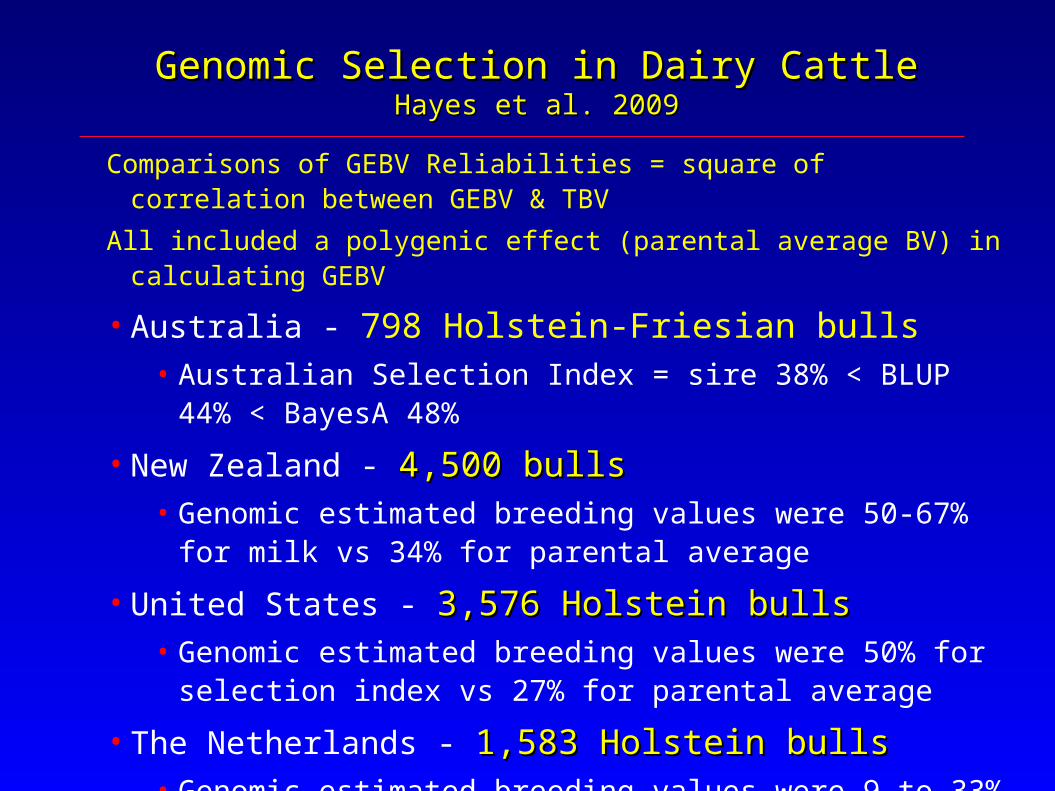
Genomic Selection in Dairy CattleGenomic Selection in Dairy CattleHayes et al. 2009Hayes et al. 2009
Comparisons of GEBV Reliabilities = square of correlation between GEBV & TBV
All included a polygenic effect (parental average BV) in calculating GEBV
• Australia - 798 Holstein-Friesian bulls• Australian Selection Index = sire 38% < BLUP 44% < BayesA 48%
• New Zealand - 4,500 bulls 4,500 bulls • Genomic estimated breeding values were 50-67% for milk vs 34% for
parental average
• United States - 3,576 Holstein bulls 3,576 Holstein bulls • Genomic estimated breeding values were 50% for selection index vs
27% for parental average
• The Netherlands - 1,583 Holstein bulls 1,583 Holstein bulls • Genomic estimated breeding values were 9 to 33% higher than
parental average
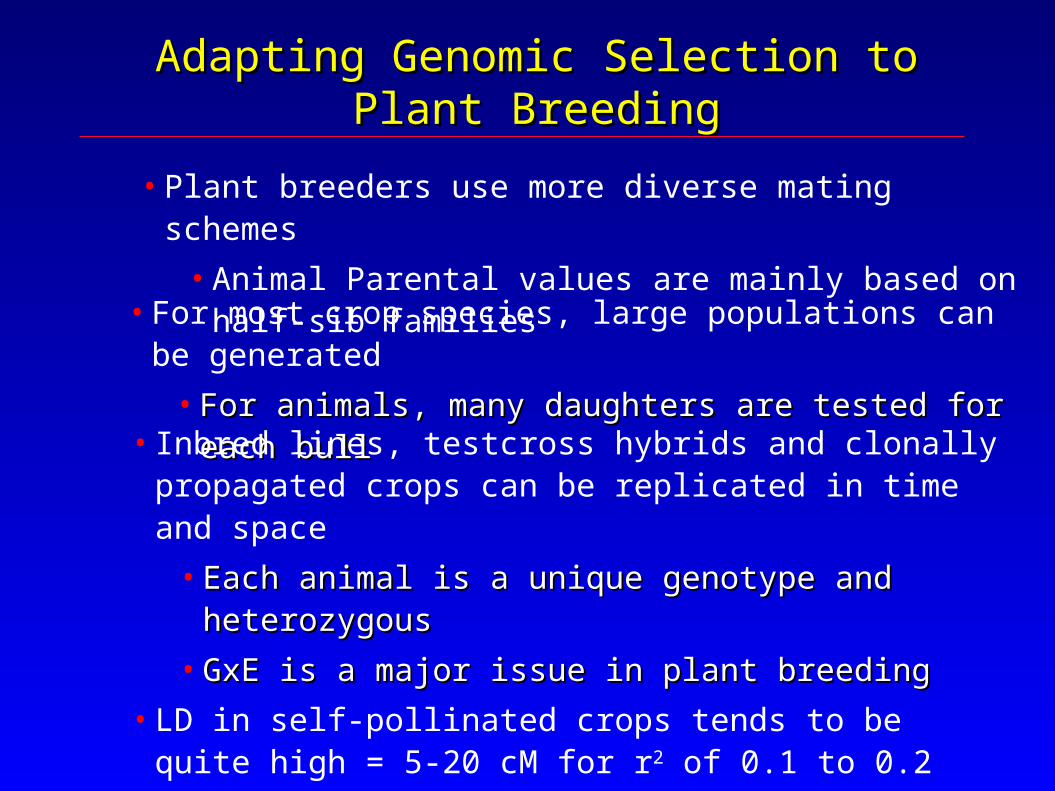
Adapting Genomic Selection to Plant BreedingAdapting Genomic Selection to Plant Breeding
• For most crop species, large populations can be generated
• For animals, many daughters are tested for each bullFor animals, many daughters are tested for each bull
• Plant breeders use more diverse mating schemes
• Animal Parental values are mainly based on half-sib families
• Inbred lines, testcross hybrids and clonally propagated crops can be replicated in time and space
• Each animal is a unique genotype and heterozygousEach animal is a unique genotype and heterozygous
• GxE is a major issue in plant breedingGxE is a major issue in plant breeding
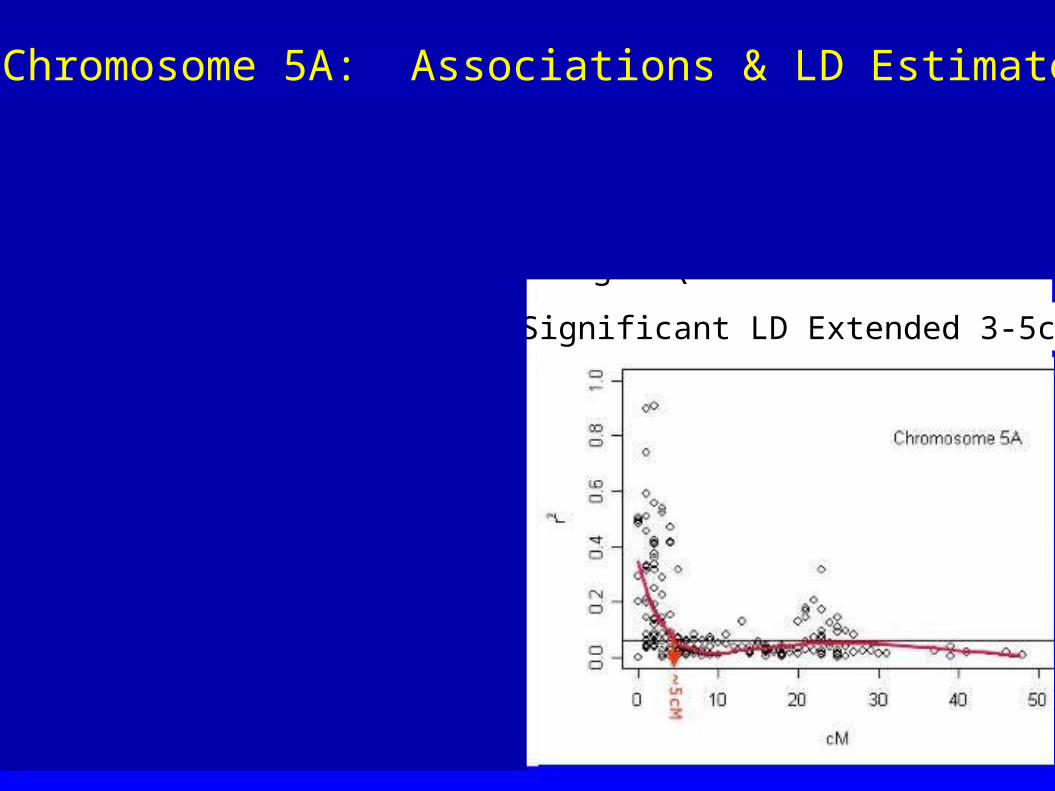
• LD in self-pollinated crops tends to be quite high = 5-20 cM for r2 of 0.1 to 0.2
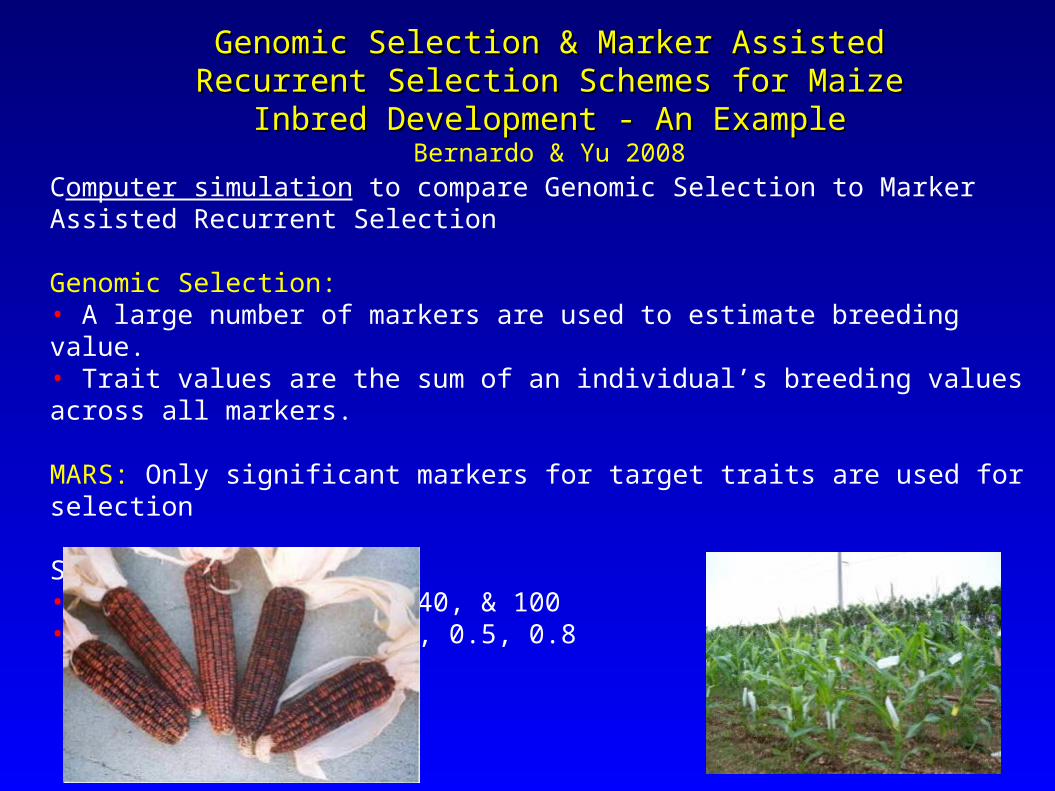
Genomic Selection & Marker Assisted Recurrent Selection Genomic Selection & Marker Assisted Recurrent Selection Schemes for Maize Inbred Development - An ExampleSchemes for Maize Inbred Development - An Example
Bernardo & Yu 2008
Computer simulation to compare Genomic Selection to Marker Assisted Recurrent Selection
Genomic Selection: • A large number of markers are used to estimate breeding value. • Trait values are the sum of an individual’s breeding values across all markers.
MARS: Only significant markers for target traits are used for selection
Simulations:• Number of QTL - 20, 40, & 100• Heritabilities - 0.2, 0.5, 0.8
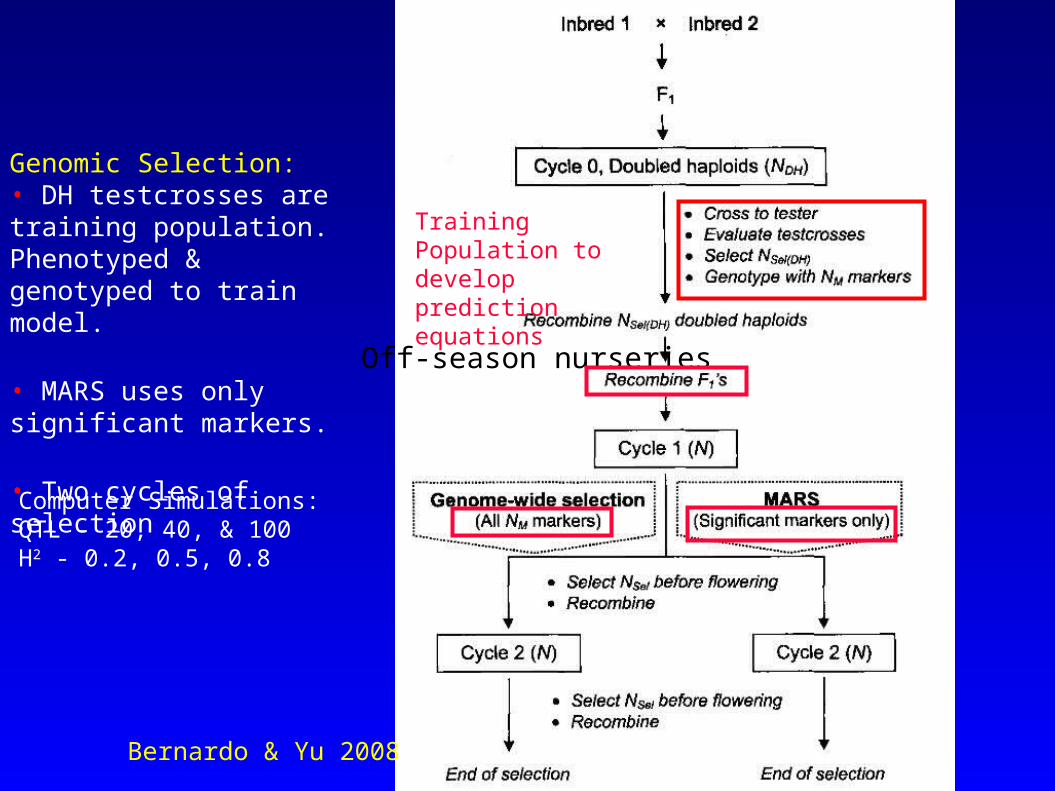
Off-season nurseries
Training Population to develop prediction equations
Genomic Selection: • DH testcrosses are training population. Phenotyped & genotyped to train model.
• MARS uses only significant markers.
• Two cycles of selection
Bernardo & Yu 2008
Genomic Selection & Marker Assisted Recurrent Selection Schemes for Genomic Selection & Marker Assisted Recurrent Selection Schemes for Maize Inbred DevelopmentMaize Inbred Development
Bernardo & Yu 2008
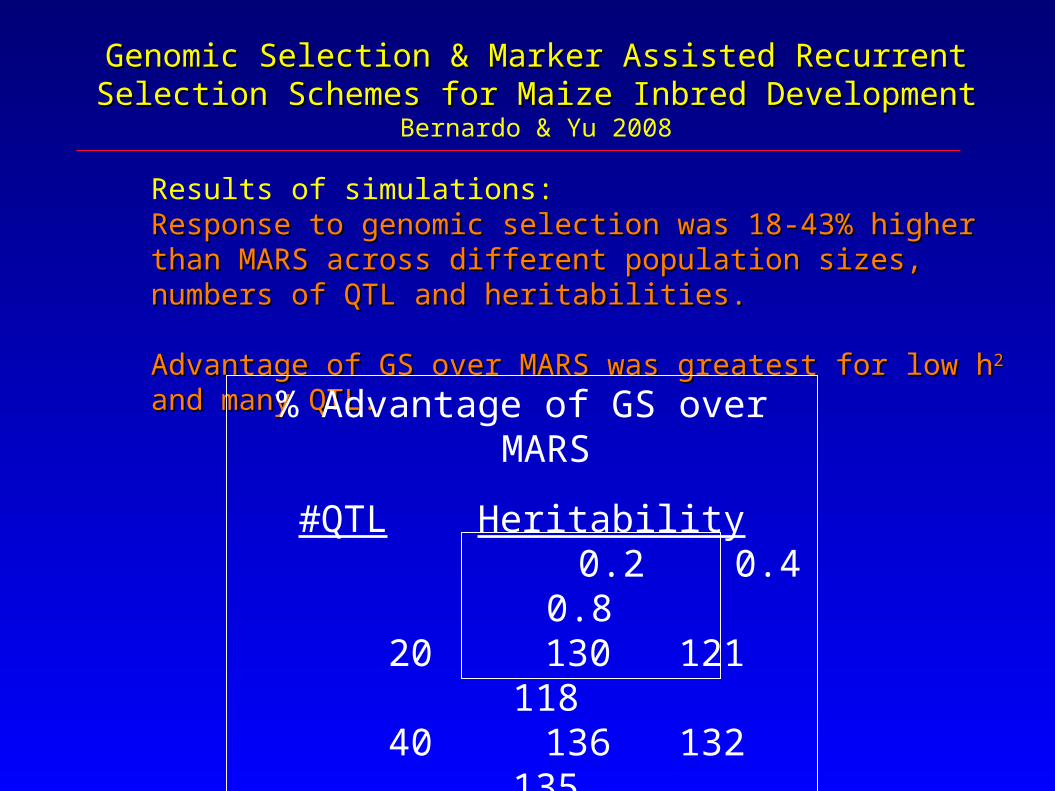
Results of simulations:Response to genomic selection was 18-43% higher than MARS across Response to genomic selection was 18-43% higher than MARS across different population sizes, numbers of QTL and heritabilities.different population sizes, numbers of QTL and heritabilities.
Advantage of GS over MARS was greatest for low hAdvantage of GS over MARS was greatest for low h22 and many QTL. and many QTL.
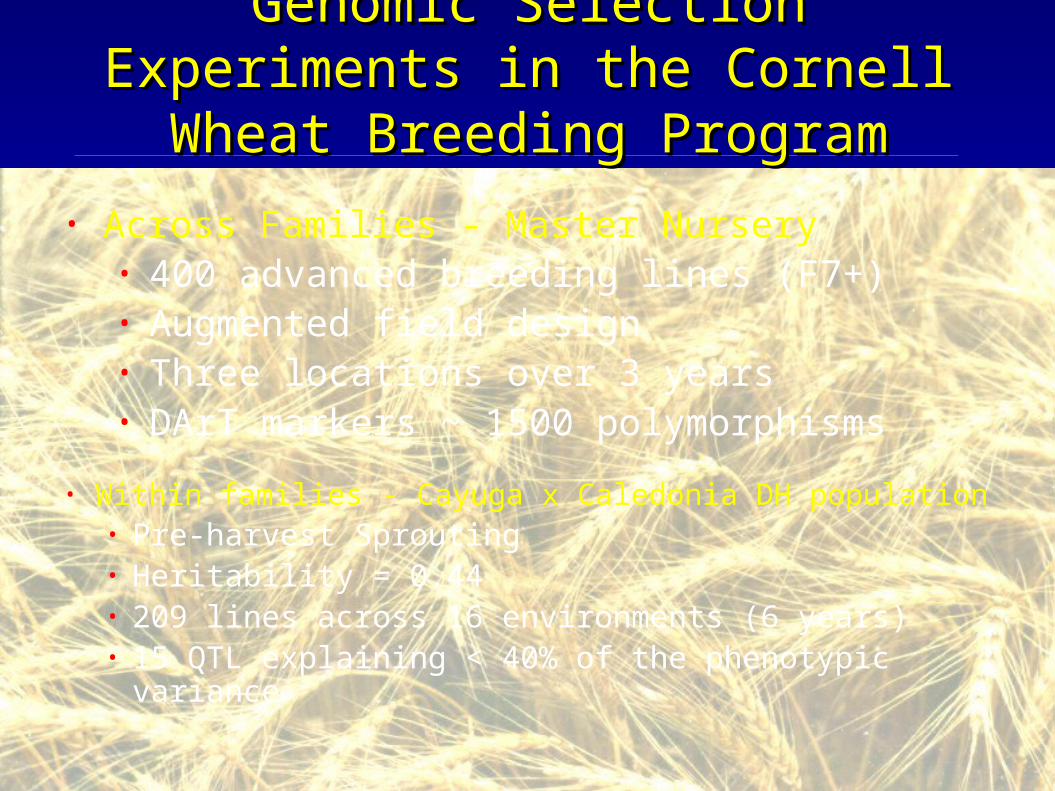
Genomic Selection Experiments in the Genomic Selection Experiments in the Cornell Wheat Breeding ProgramCornell Wheat Breeding Program
• Within families - Cayuga x Caledonia DH population• Pre-harvest Sprouting • Heritability = 0.44 • 209 lines across 16 environments (6 years)• 15 QTL explaining < 40% of the phenotypic variance
• Across Families - Master Nursery• 400 advanced breeding lines (F7+) • Augmented field design • Three locations over 3 years• DArT markers ~ 1500 polymorphisms
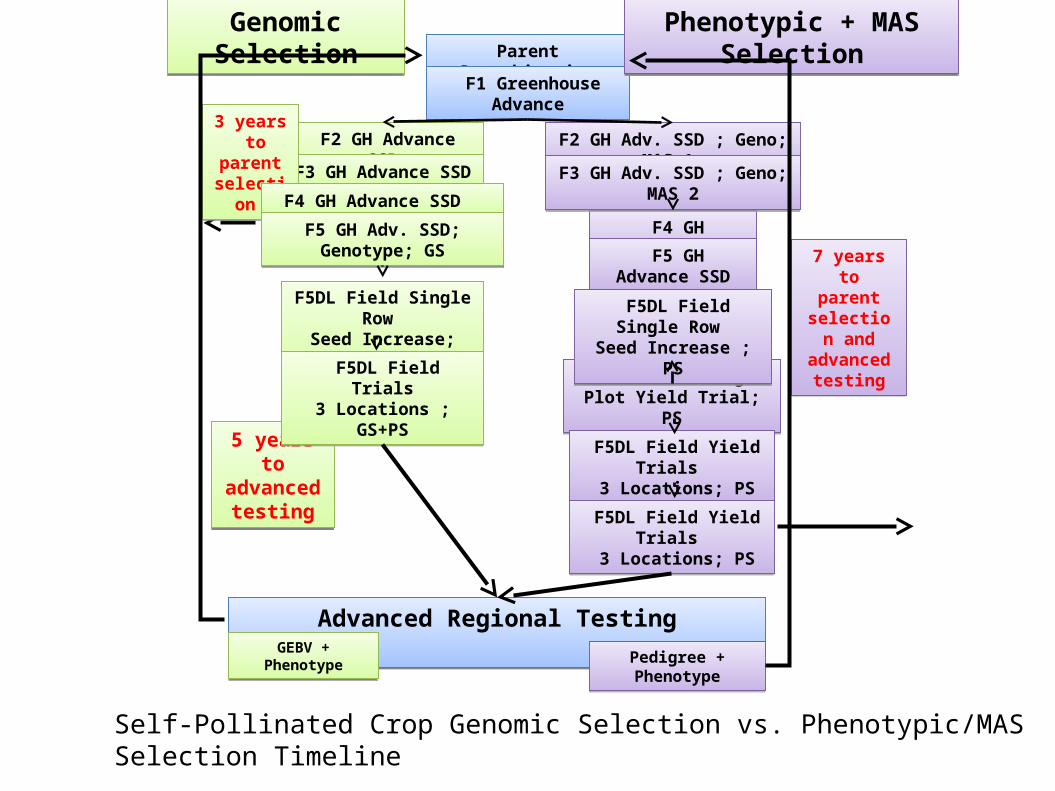
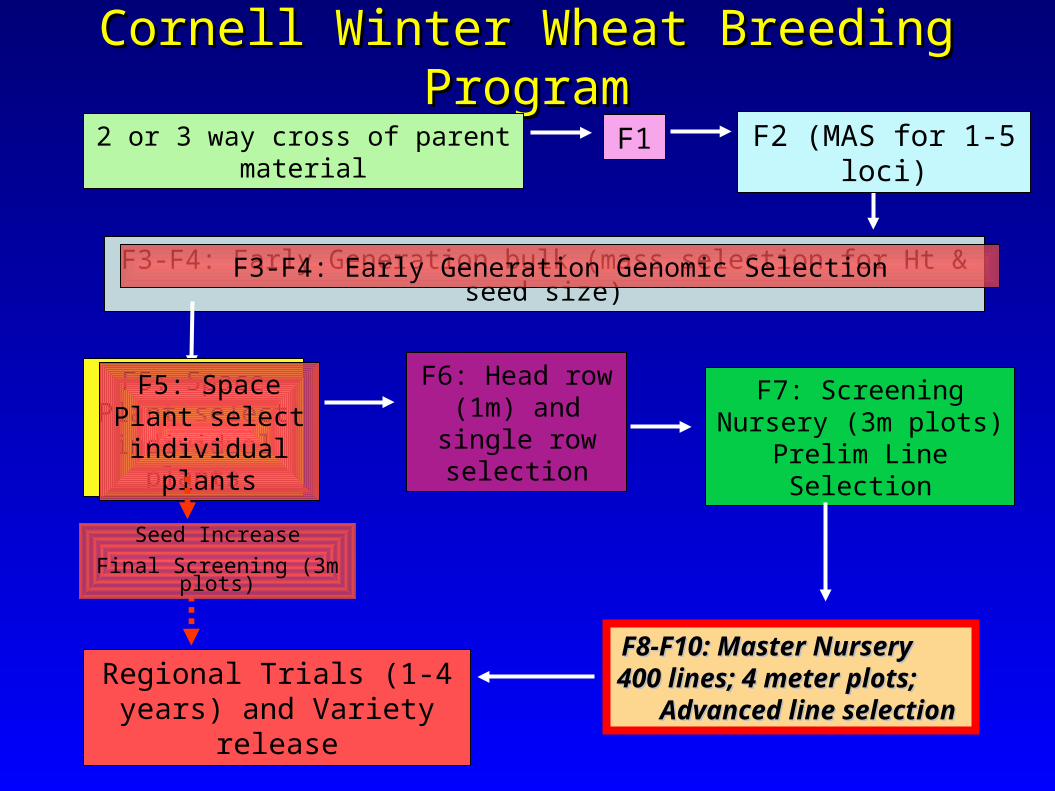
Cornell Winter Wheat Breeding ProgramCornell Winter Wheat Breeding Program
2 or 3 way cross of parent material F1
F3-F4: Early Generation bulk (mass selection for Ht & seed size)
F5: Space Plant select individual
plants
F6: Head row (1m) and single row selection
F7: Screening Nursery (3m plots) Prelim Line
Selection
F8-F10: Master Nursery F8-F10: Master Nursery 400 lines; 4 meter plots; 400 lines; 4 meter plots; Advanced line selection Advanced line selection
Regional Trials (1-4 years) and Variety release
F2 (MAS for 1-5 loci)
Seed Increase
Final Screening (3m plots)
F3-F4: Early Generation Genomic Selection
F5: Space Plant select individual
plants
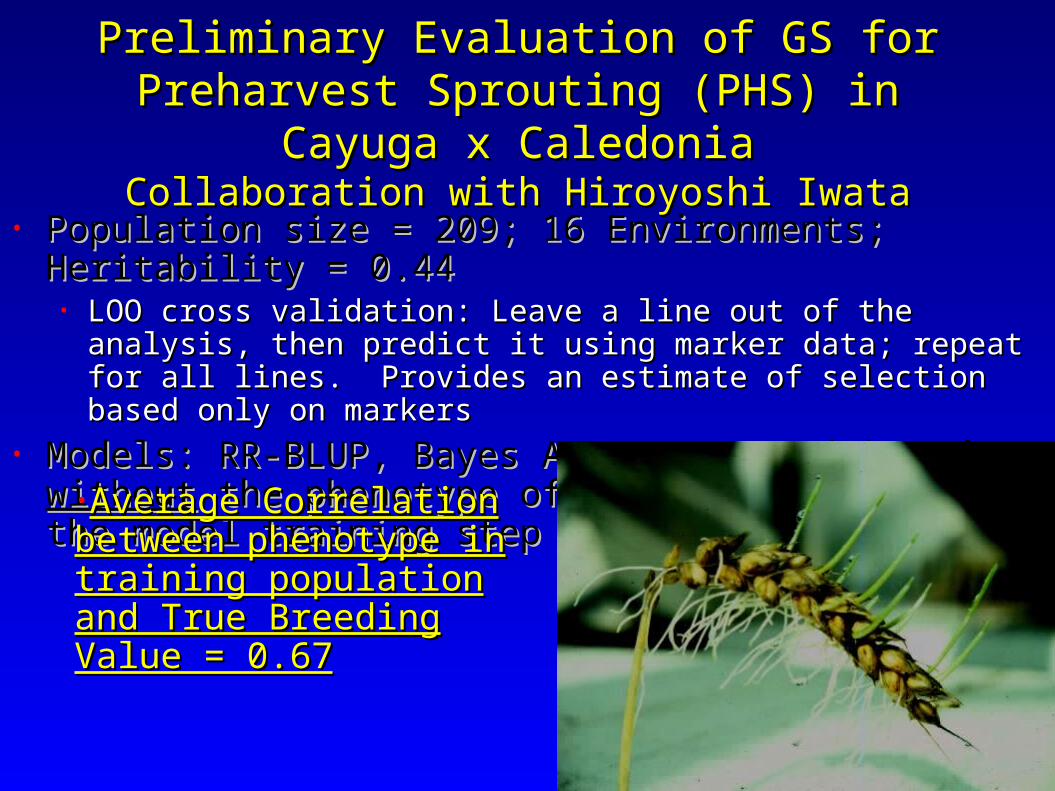
Preliminary Evaluation of GS for Preharvest Preliminary Evaluation of GS for Preharvest Sprouting (PHS) in Cayuga x CaledoniaSprouting (PHS) in Cayuga x Caledonia
Collaboration with Hiroyoshi IwataCollaboration with Hiroyoshi Iwata
• Population size = 209; 16 Environments; Heritability Population size = 209; 16 Environments; Heritability = 0.44= 0.44• LOO cross validation: Leave a line out of the analysis, then LOO cross validation: Leave a line out of the analysis, then
predict it using marker data; repeat for all lines. Provides an predict it using marker data; repeat for all lines. Provides an estimate of selection based only on markersestimate of selection based only on markers
• Models: RR-BLUP, Bayes A & B; GEBV Models: RR-BLUP, Bayes A & B; GEBV with and with and withoutwithout the phenotype of the predicted line in the the phenotype of the predicted line in the model training stepmodel training step•Average Correlation Average Correlation
between phenotype in between phenotype in training population and training population and True Breeding Value = True Breeding Value = 0.670.67
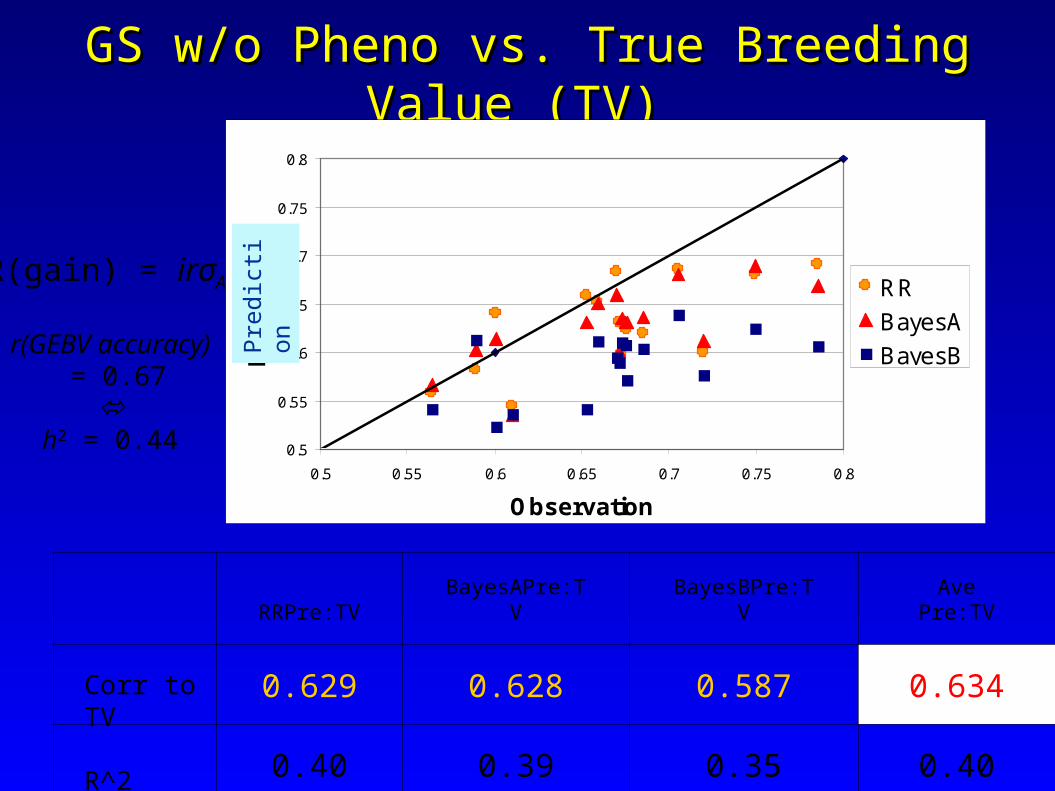
GS w/o Pheno vs. True Breeding Value (TV) GS w/o Pheno vs. True Breeding Value (TV)
0.5
0.55
0.6
0.65
0.7
0.75
0.8
0.5 0.55 0.6 0.65 0.7 0.75 0.8
Observation
Pre
de
cti
on
RR
BayesA
BayesB
RRPre:TV BayesAPre:TV BayesBPre:TV Ave Pre:TV
0.629 0.628 0.587 0.634
0.40 0.39 0.35 0.40
Corr to TV
R^2
Pre
dic
tion
r(GEBV accuracy) = 0.67
h2 = 0.44
R(gain) = irσA
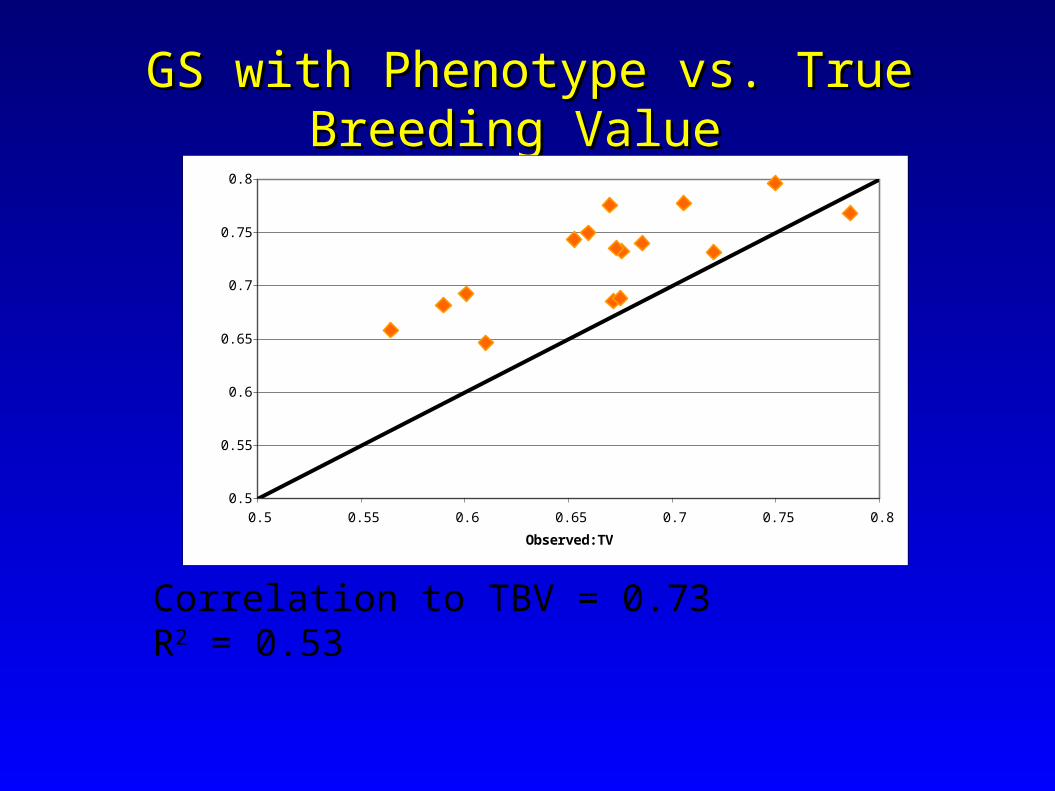
GS with Phenotype vs. True Breeding Value GS with Phenotype vs. True Breeding Value
0.5
0.55
0.6
0.65
0.7
0.75
0.8
0.5 0.55 0.6 0.65 0.7 0.75 0.8
Observed:TV
GS
_A
LL
: T
V
Correlation to TBV = 0.73R2 = 0.53
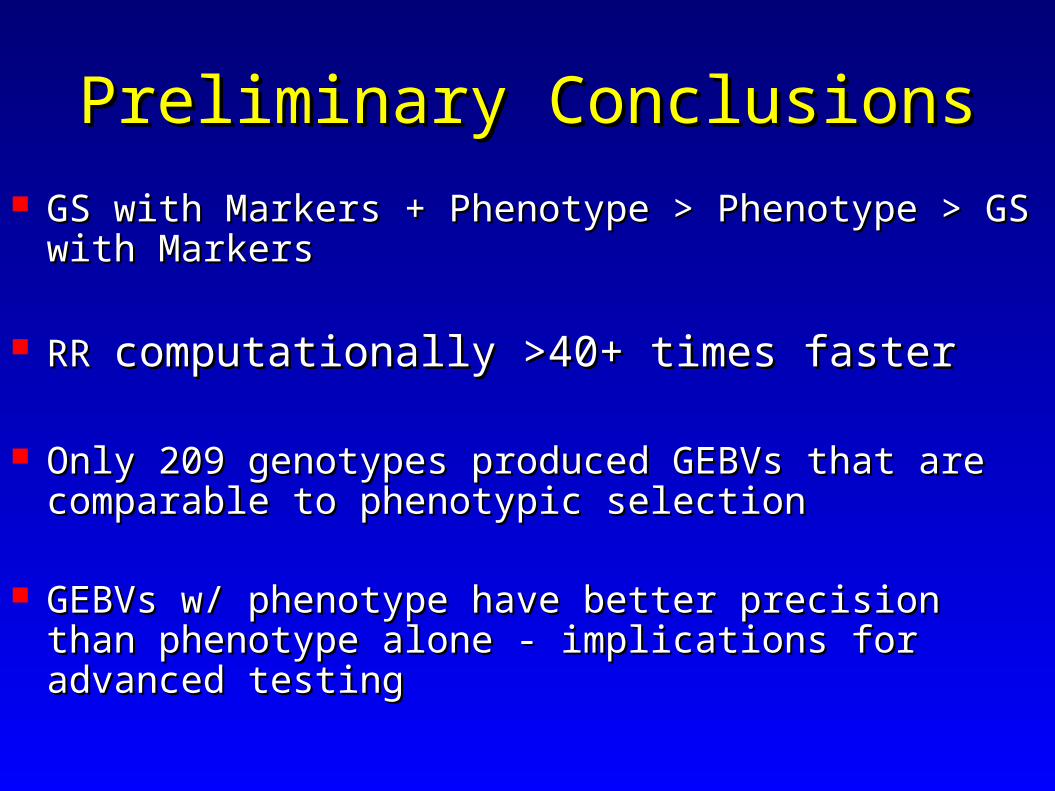
Preliminary ConclusionsPreliminary Conclusions GS with Markers + Phenotype > Phenotype > GS with MarkersGS with Markers + Phenotype > Phenotype > GS with Markers
RR RR computationally >40+ times fastercomputationally >40+ times faster
Only 209 genotypes produced GEBVs that are comparable to Only 209 genotypes produced GEBVs that are comparable to phenotypic selectionphenotypic selection
GEBVs w/ phenotype have better precision than phenotype alone GEBVs w/ phenotype have better precision than phenotype alone - implications for advanced testing- implications for advanced testing
Summary:Summary:Association Breeding and Genomic SelectionAssociation Breeding and Genomic Selection
Association Breeding:
• New alleles can be identified and characterized to determine their value
• Allelic values of previously identified alleles can be dynamically updated based
on advanced trial data as desiredGenomic Selection:
• Captures small-effect QTL and genetic relationships
• Can increase gain from selection & reduce advanced testing
• Requires a large number of markers and accurate prediction models
Both Association Breeding & Genomic Selection:
• Genome saturation is not required (but does improve prediction) and supplemental
markers can focus on specific QTL regions and candidate genes
• The most important advantages are The most important advantages are reductions in the length of the selection cycle reductions in the length of the selection cycle
and the associated phenotyping cost resulting in greater gain per year.and the associated phenotyping cost resulting in greater gain per year.
Future OpportunitiesFuture Opportunities
• Develop economic assessment of GS in breeding strategies
• Prediction of Epistatic effects
• Develop prediction models for different target
environments & high value traits
• Predict utility of new germplasm from other sources