28
Mark J. Mitchell Vice President, School Information Services Solomon Schechter Day Schools Association December 11, 2006 Thinking Strategically About Affordability
| Date post: | 28-Dec-2015 |
| Category: |
Documents |
| Upload: | charity-owen |
| View: | 214 times |
| Download: | 0 times |
Mark J. Mitchell
Vice President, School Information Services
Solomon Schechter Day Schools Association
December 11, 2006
Thinking Strategically About Affordability

Copyright National Association of Independent Schools, 2006
Defining Affordability
Depends on who you ask!!
Consumer-oriented: “Believed to be within one’s financial reach”– dictionary.com
Organization-oriented: “Quality service at the best possible price” – automobile service provider
Mission-oriented: “A variety of innovative, financial assistance programs … designed to provide the most help to those most in need” – utility services company
For private schools, it’s ALL of the above!!
Copyright National Association of Independent Schools, 2006
Defining Affordability
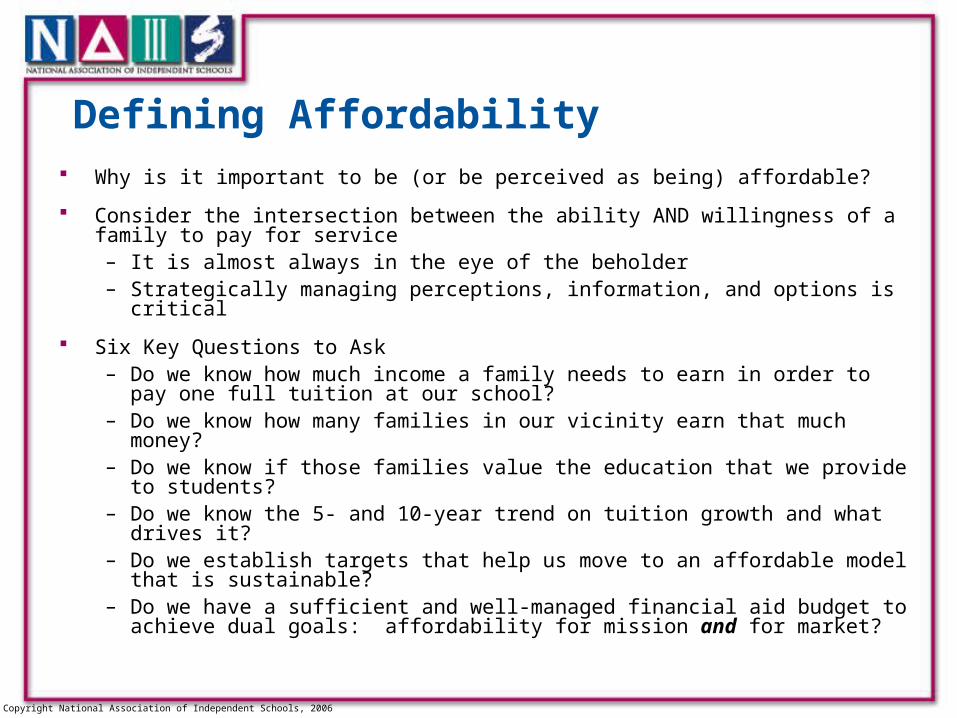
Why is it important to be (or be perceived as being) affordable?
Consider the intersection between the ability AND willingness of a family to pay for service
– It is almost always in the eye of the beholder– Strategically managing perceptions, information, and options is critical
Six Key Questions to Ask– Do we know how much income a family needs to earn in order to pay one full
tuition at our school?– Do we know how many families in our vicinity earn that much money?– Do we know if those families value the education that we provide to students?– Do we know the 5- and 10-year trend on tuition growth and what drives it? – Do we establish targets that help us move to an affordable model that is
sustainable?– Do we have a sufficient and well-managed financial aid budget to achieve dual
goals: affordability for mission and for market?
Copyright National Association of Independent Schools, 2006
First Key Question
Do we know how much income a family needs to earn in order to pay one full tuition at our school?
Copyright National Association of Independent Schools, 2006
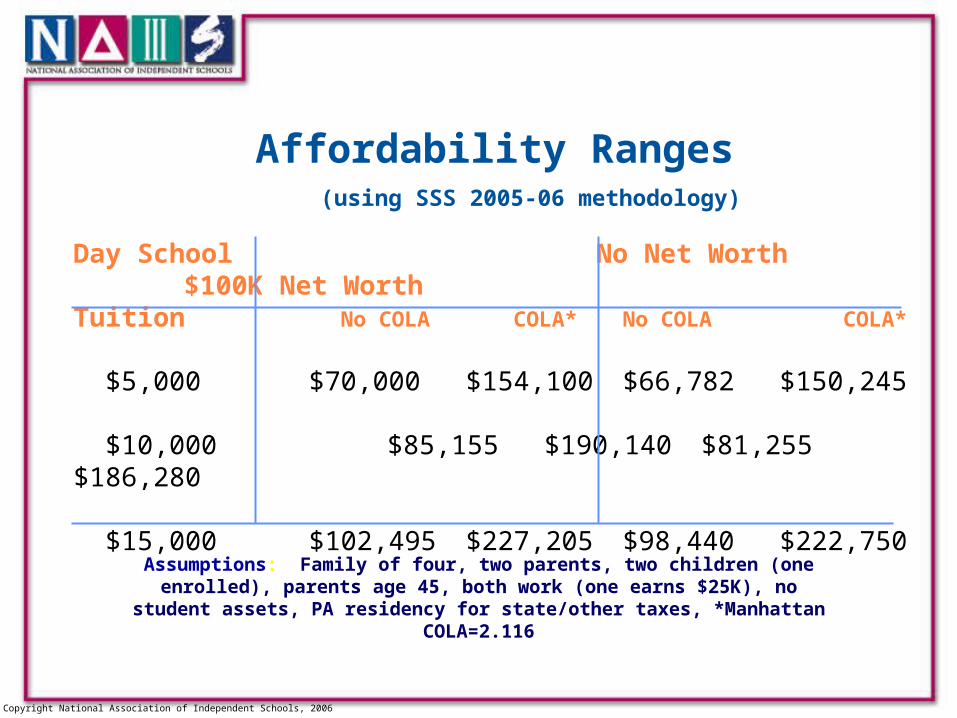
Affordability Ranges (using SSS 2005-06 methodology)
Assumptions: Family of four, two parents, two children (one enrolled), parents age 45, both work (one earns $25K), no
student assets, PA residency for state/other taxes, *Manhattan COLA=2.116
Day School No Net Worth $100K Net WorthTuition No COLA COLA* No COLA COLA*
$5,000 $70,000 $154,100 $66,782 $150,245
$10,000 $85,155 $190,140 $81,255 $186,280
$15,000 $102,495 $227,205 $98,440 $222,750

Copyright National Association of Independent Schools, 2006
Second Key Question
Do we know how many families in our vicinity earn that much money?
Copyright National Association of Independent Schools, 2006
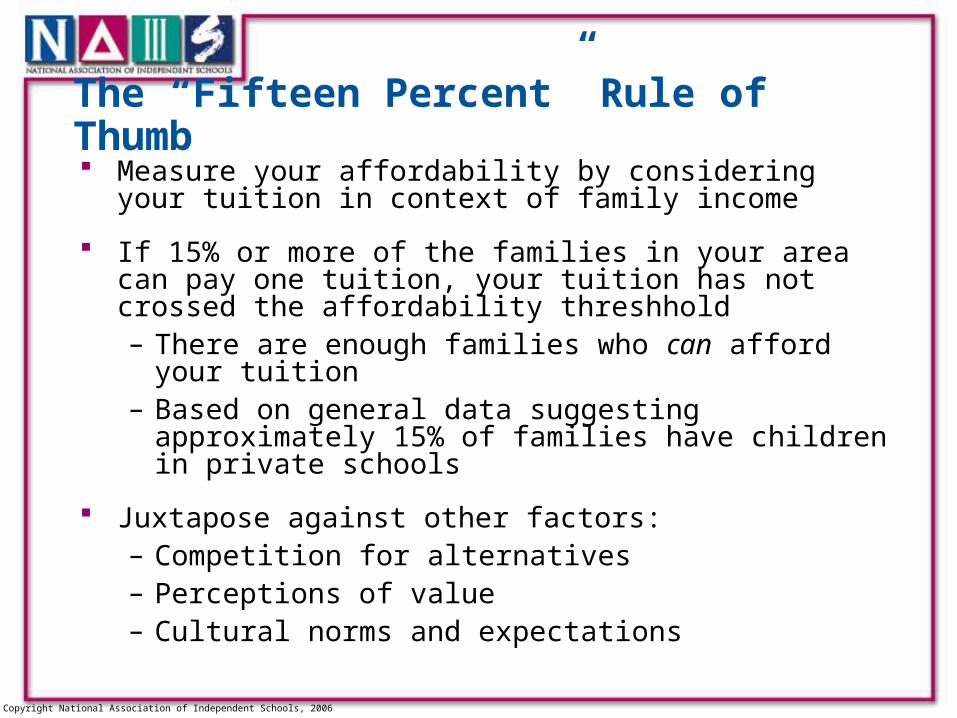
The “Fifteen Percent” Rule of Thumb Measure your affordability by considering your tuition in
context of family income
If 15% or more of the families in your area can pay one tuition, your tuition has not crossed the affordability threshhold– There are enough families who can afford your tuition– Based on general data suggesting approximately 15% of
families have children in private schools
Juxtapose against other factors:– Competition for alternatives– Perceptions of value– Cultural norms and expectations

Copyright National Association of Independent Schools, 2006
The “Fifteen Percent” Rule of Thumb Find out what income is needed to pay your tuition
– Don’t guess or rely on “what the customer wants to pay”
– SSS subscribers can use the SSS Comp*Assist software to determine this, based on SSS methodology
Use demographic data on your city, zip code, or other locale(s) to find income distribution of local families
– www.census.gov
– www.easidemographics.com
– www.demographicsnow.com
– NAIS Demographics Center (members only)
See samples
Currently being beta tested

Copyright National Association of Independent Schools, 2006
All Demographics Are Local
USA MiamiMetro
New YorkMetro
Chicago Metro
San Francisco
Metro
$0 - $50K 46.2 58.9 48.8 36.2 29.5
$50 - $75K 21.3 17.3 16.9 20.8 16.7
$75 - $100K 13.5 9.5 11.6 16.1 13.8
$100 - $150K 12.0 8.1 12.4 16.4 17.9
$150K+ 7.2 6.2 10.2 10.5 22.0
Median Income
$53,692 $40,927 $51,150 $66,302 $82,242
Source: 2004 American Community Survey, www.census.gov
% distribution by income range, selected locales
Copyright National Association of Independent Schools, 2006
Third Key Question
Do we know if those families value the education that we provide to students?
Copyright National Association of Independent Schools, 2006
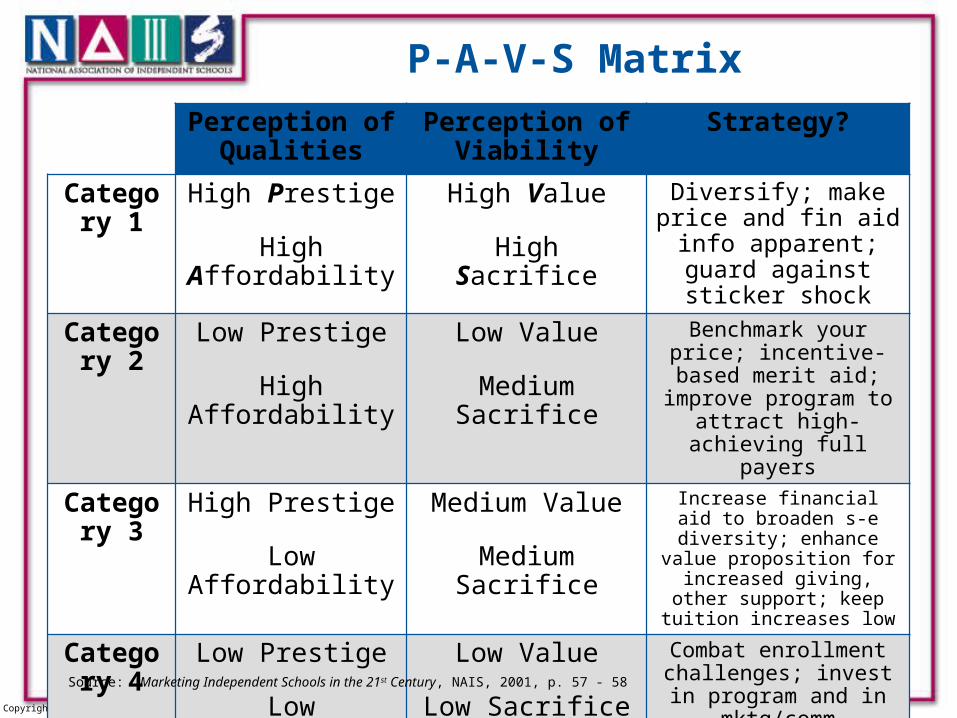
P-A-V-S Matrix
Perception of Qualities
Perception of Viability
Strategy?
Category 1
High Prestige
High Affordability
High Value
High Sacrifice
Diversify; make price and fin aid info apparent;
guard against sticker shock
Category 2
Low Prestige
High Affordability
Low Value
Medium Sacrifice
Benchmark your price; incentive-based merit aid; improve program to attract high-achieving full payers
Category 3
High Prestige
Low Affordability
Medium Value
Medium Sacrifice
Increase financial aid to broaden s-e diversity; enhance value proposition for increased
giving, other support; keep tuition increases low
Category 4
Low Prestige
Low Affordability
Low Value
Low Sacrifice
Combat enrollment challenges; invest in
program and in mktg/comm campaigns; net tuition
revenue approach a short-term fix
Source: Marketing Independent Schools in the 21st Century, NAIS, 2001, p. 57 - 58
Copyright National Association of Independent Schools, 2006
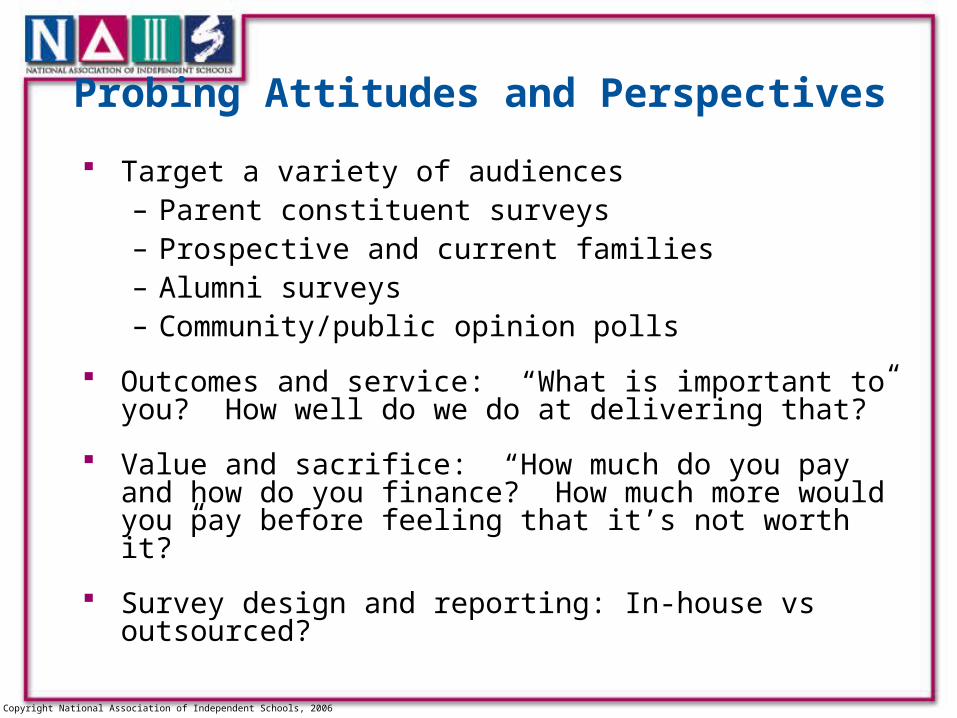
Probing Attitudes and Perspectives
Target a variety of audiences– Parent constituent surveys– Prospective and current families– Alumni surveys– Community/public opinion polls
Outcomes and service: “What is important to you? How well do we do at delivering that?”
Value and sacrifice: “How much do you pay and how do you finance? How much more would you pay before feeling that it’s not worth it?”
Survey design and reporting: In-house vs outsourced?

Copyright National Association of Independent Schools, 2006
Fourth Key Question
Do we know the 5- and 10-year trends on tuition growth and what drives them?
How do they compare to income and inflation trends?

Copyright National Association of Independent Schools, 2006
Making Data-Driven Decisions
“In God we trust. All others, bring data.”
– Margaret Spellings, Secretary, Dept. of Education
Make decisions that are less “opinion-rich” and more “data-rich.”
What are the five- and 10-year trends of your school in terms of the key financial factors that impact affordability and perception of value?
What do your school's trends suggest about the future?
Use school-based data, NAIS StatsOnline tools (for NAIS members), PEJE Yardstick, other data

Copyright National Association of Independent Schools, 2006
NAIS Data: 10-Year Trends
Tuitions Up Dramatically: Median NAIS tuitionUp 30% in real dollars = CPI +3 Inelasticity of pricing? Are you seeing a price break
point in the near future?
Giving up Significantly (22%): Averaging about $1000 gift from parents (67%), $5000 from trustees (93%), $300 from alumni (20%), $500 from Grandparents (20%).
Enrollment Stable or Up (on average but not everywhere): For schools that are full, enrollment growth not an option to fund budget growth. But Katrina made us wonder, “What is ‘full’”?
Copyright National Association of Independent Schools, 2006
NAIS Data: 10-Year Trends
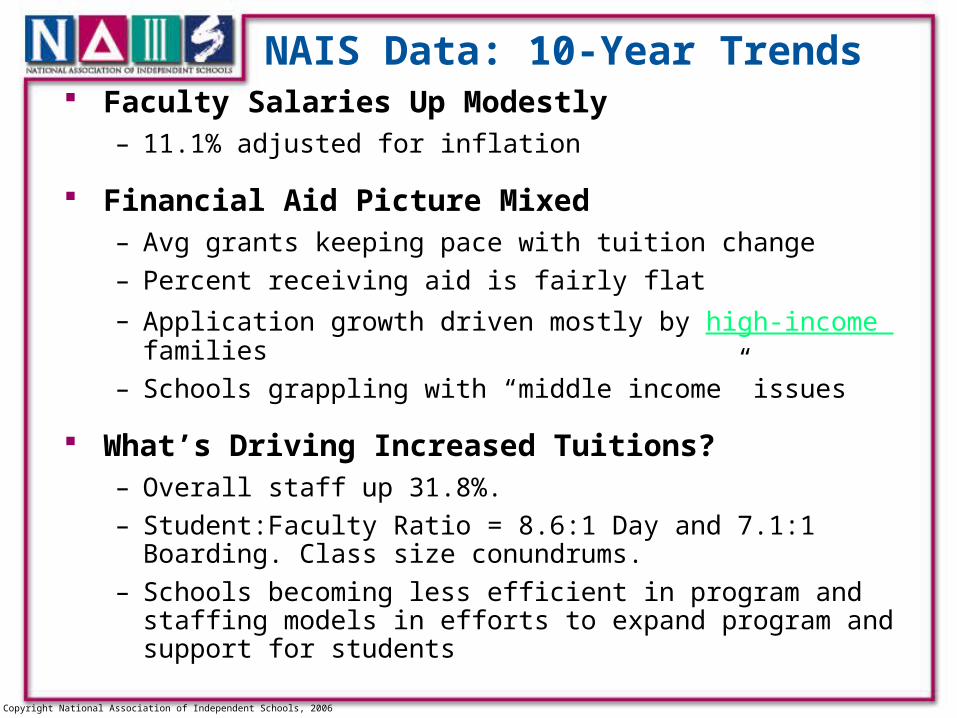
Faculty Salaries Up Modestly– 11.1% adjusted for inflation
Financial Aid Picture Mixed– Avg grants keeping pace with tuition change
– Percent receiving aid is fairly flat
– Application growth driven mostly by high-income families
– Schools grappling with “middle income” issues
What’s Driving Increased Tuitions? – Overall staff up 31.8%.
– Student:Faculty Ratio = 8.6:1 Day and 7.1:1 Boarding. Class size conundrums.
– Schools becoming less efficient in program and staffing models in efforts to expand program and support for students

Copyright National Association of Independent Schools, 2006
Fifth Key Question
Do we establish targets that help us move to an affordable model that is sustainable?
Copyright National Association of Independent Schools, 2006
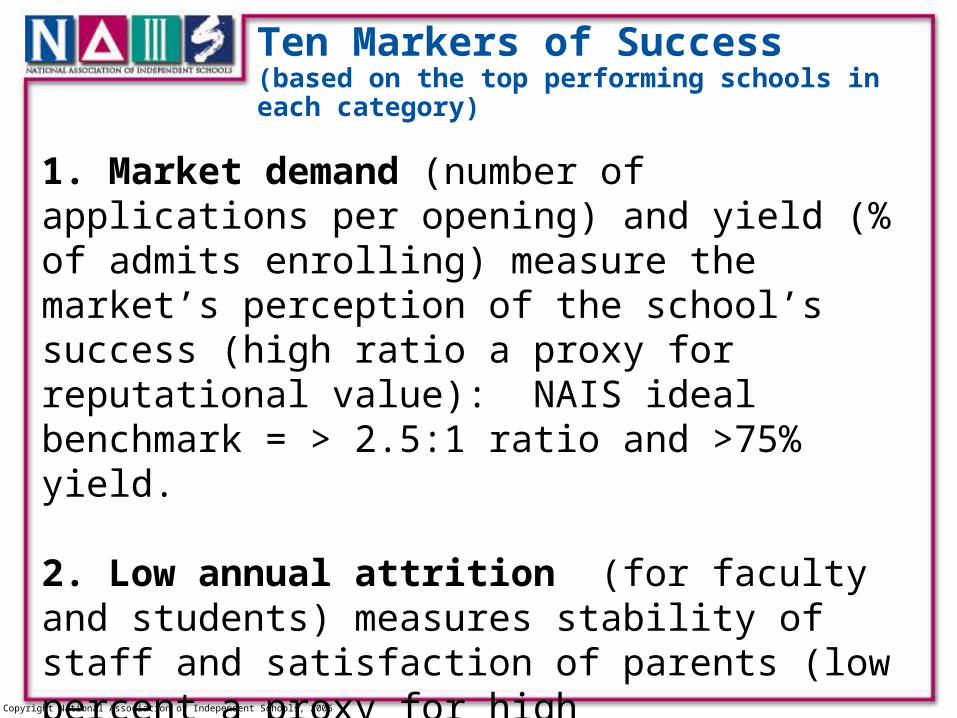
Ten Markers of Success (based on the top performing schools in each category)
1. Market demand (number of applications per opening) and yield (% of admits enrolling) measure the market’s perception of the school’s success (high ratio a proxy for reputational value): NAIS ideal benchmark = > 2.5:1 ratio and >75% yield.
2. Low annual attrition (for faculty and students) measures stability of staff and satisfaction of parents (low percent a proxy for high satisfaction): NAIS ideal benchmark = < 5% day and < 9 % boarding annually.
Copyright National Association of Independent Schools, 2006
Financing Sustainable Schools: Ten Markers of Success
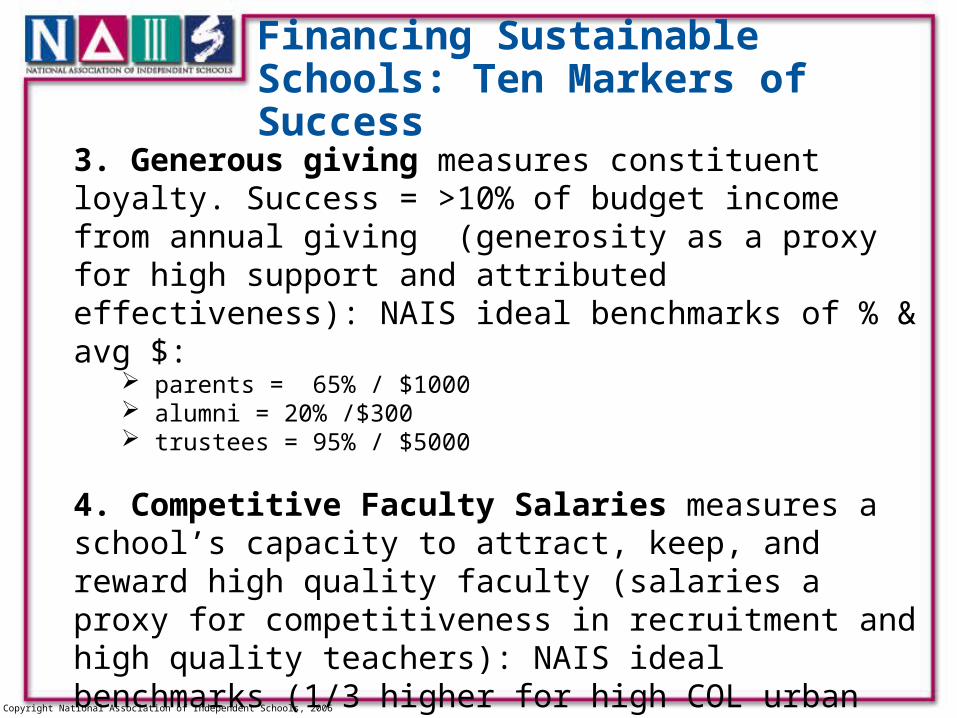
3. Generous giving measures constituent loyalty. Success = >10% of budget income from annual giving (generosity as a proxy for high support and attributed effectiveness): NAIS ideal benchmarks of % & avg $:
parents = 65% / $1000 alumni = 20% /$300 trustees = 95% / $5000
4. Competitive Faculty Salaries measures a school’s capacity to attract, keep, and reward high quality faculty (salaries a proxy for competitiveness in recruitment and high quality teachers): NAIS ideal benchmarks (1/3 higher for high COL urban centers):
>$35K starting >$50 K median >$75K top

Copyright National Association of Independent Schools, 2006
Financing Sustainable Schools: Ten Markers of Success
5. Relatively low tuition and moderate annual tuition increases measure value in the value proposition (a proxy for comparative “affordability” and moderated inflationary pricing): NAIS ideal benchmarks = Between 25 - 50 %ile of tuitions for comparable schools in similar circumstances or markets; annual tuition increases at CPI + 2 or less.
6. A stable, sustainable proportion of students receiving financial aid measures a school’s commitment to diversity (financial aid a proxy for socio-economic diversity) balanced by financial prudence. NAIS ideal benchmark = 20-25% (33% at boarding schools) of students receiving financial aid (including tuition remission and merit aid) and average awards = 50% of tuition.
Copyright National Association of Independent Schools, 2006
Financing Sustainable Schools: Ten Markers of Success
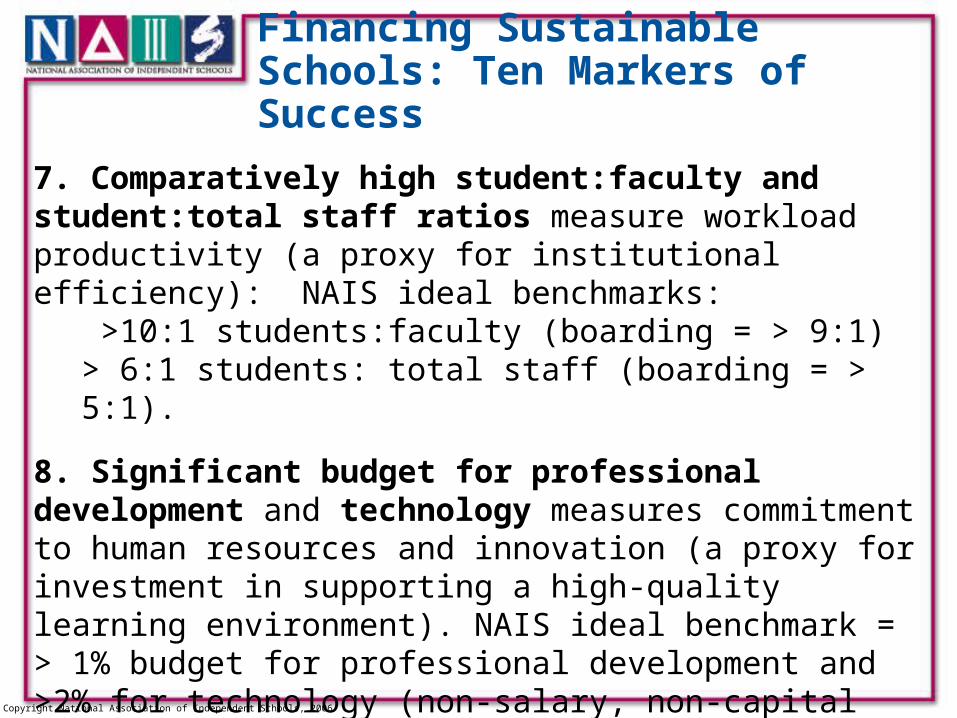
7. Comparatively high student:faculty and student:total staff ratios measure workload productivity (a proxy for institutional efficiency): NAIS ideal benchmarks:
>10:1 students:faculty (boarding = > 9:1)> 6:1 students: total staff (boarding = > 5:1).
8. Significant budget for professional development and technology measures commitment to human resources and innovation (a proxy for investment in supporting a high-quality learning environment). NAIS ideal benchmark = > 1% budget for professional development and >2% for technology (non-salary, non-capital replacements for technology; ongoing tech operating expenses).
Copyright National Association of Independent Schools, 2006
Financing Sustainable Schools: Ten Markers of Success
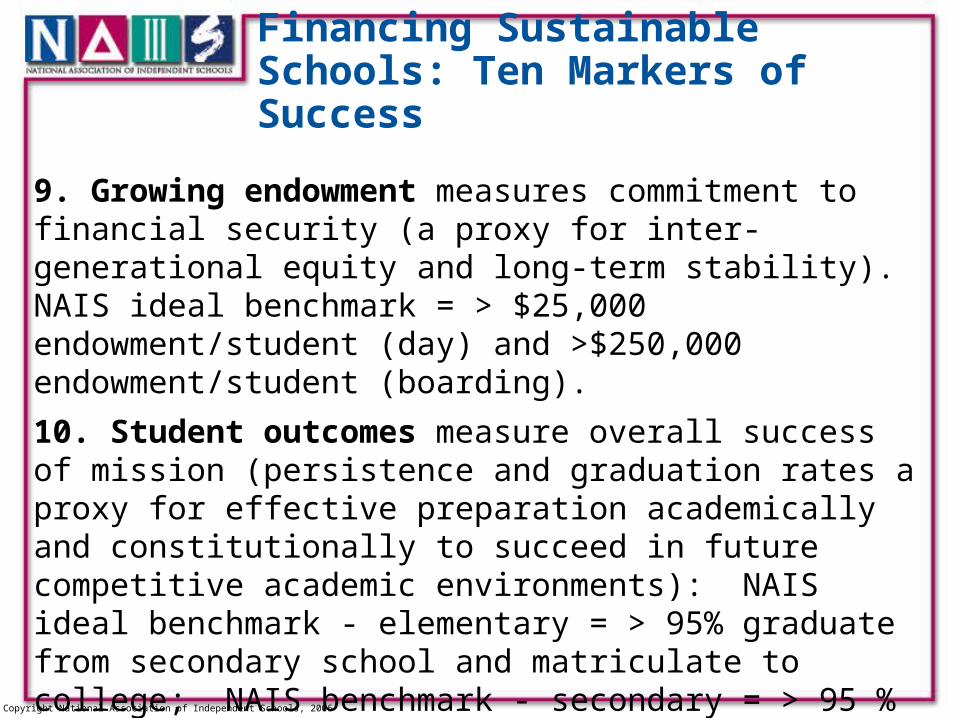
9. Growing endowment measures commitment to financial security (a proxy for inter-generational equity and long-term stability). NAIS ideal benchmark = > $25,000 endowment/student (day) and >$250,000 endowment/student (boarding).
10. Student outcomes measure overall success of mission (persistence and graduation rates a proxy for effective preparation academically and constitutionally to succeed in future competitive academic environments): NAIS ideal benchmark - elementary = > 95% graduate from secondary school and matriculate to college; NAIS benchmark - secondary = > 95 % graduate from college within six years.
Copyright National Association of Independent Schools, 2006
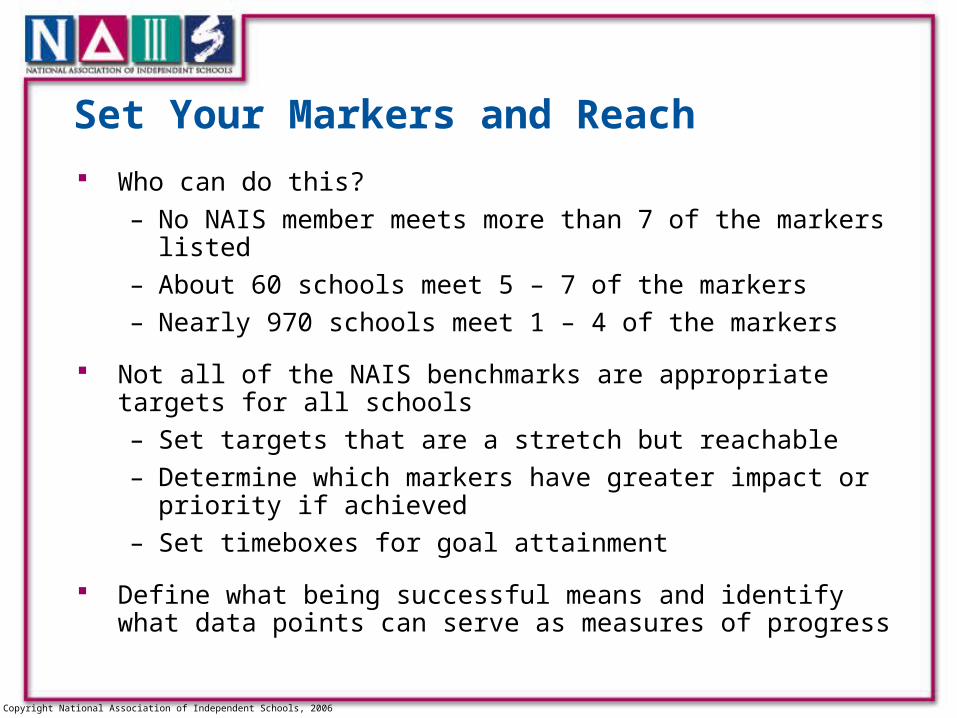
Set Your Markers and Reach
Who can do this?
– No NAIS member meets more than 7 of the markers listed
– About 60 schools meet 5 – 7 of the markers
– Nearly 970 schools meet 1 – 4 of the markers
Not all of the NAIS benchmarks are appropriate targets for all schools
– Set targets that are a stretch but reachable
– Determine which markers have greater impact or priority if achieved
– Set timeboxes for goal attainment
Define what being successful means and identify what data points can serve as measures of progress
Copyright National Association of Independent Schools, 2006
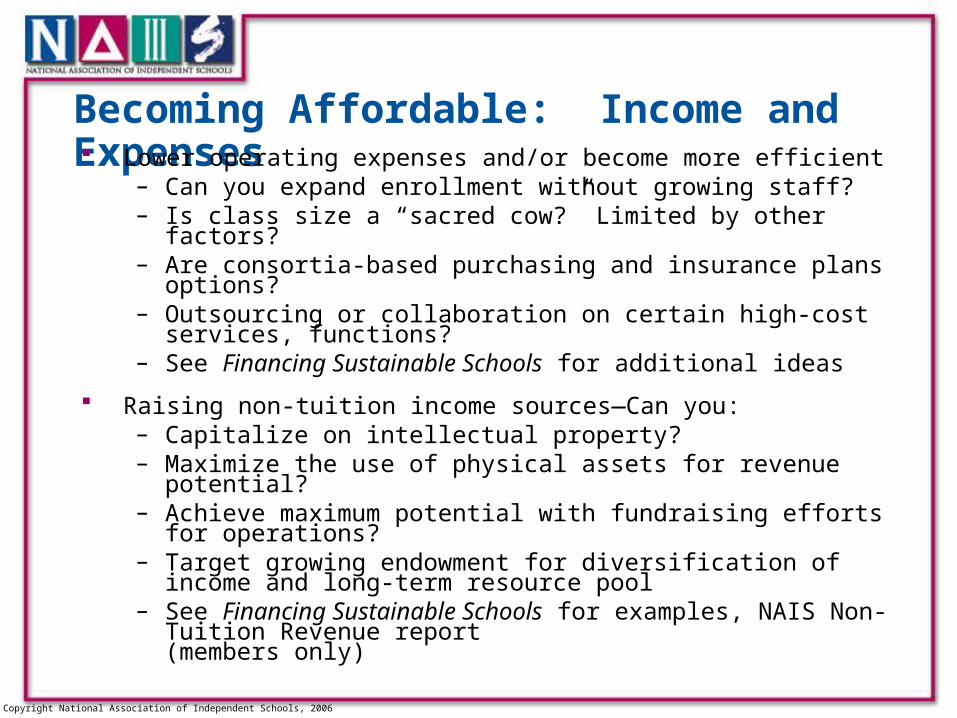
Becoming Affordable: Income and Expenses
Lower operating expenses and/or become more efficient– Can you expand enrollment without growing staff?– Is class size a “sacred cow?” Limited by other factors?– Are consortia-based purchasing and insurance plans options? – Outsourcing or collaboration on certain high-cost services, functions?– See Financing Sustainable Schools for additional ideas
Raising non-tuition income sources—Can you:– Capitalize on intellectual property?– Maximize the use of physical assets for revenue potential?– Achieve maximum potential with fundraising efforts for operations?– Target growing endowment for diversification of income and long-term
resource pool– See Financing Sustainable Schools for examples, NAIS Non-Tuition
Revenue report (members only)
Copyright National Association of Independent Schools, 2006
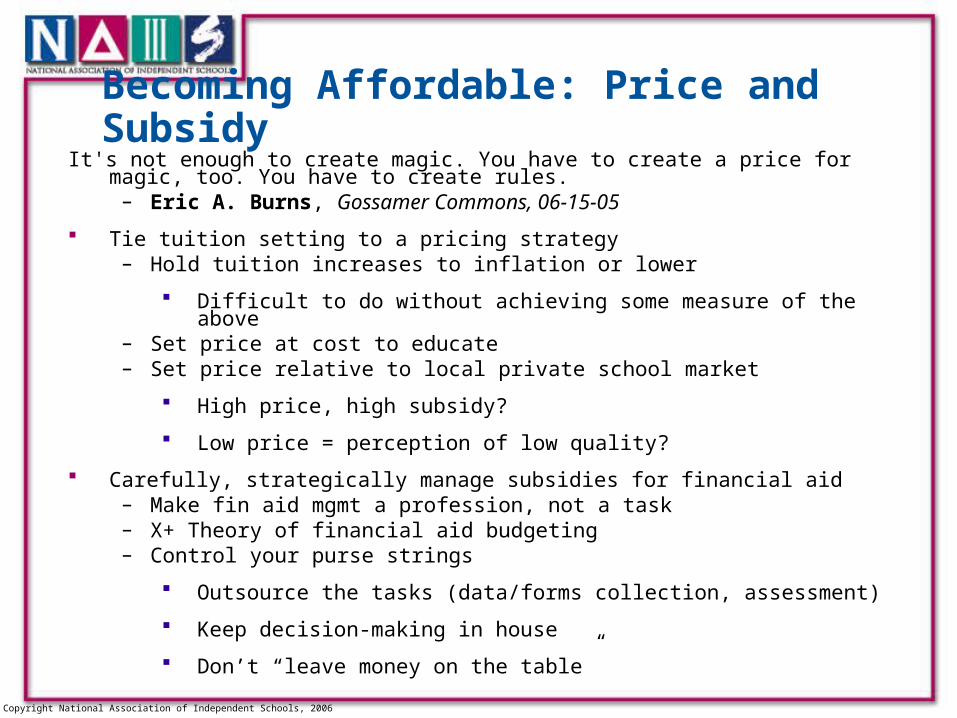
Becoming Affordable: Price and SubsidyIt's not enough to create magic. You have to create a price for magic, too. You have to create
rules.– Eric A. Burns, Gossamer Commons, 06-15-05
Tie tuition setting to a pricing strategy– Hold tuition increases to inflation or lower
Difficult to do without achieving some measure of the above– Set price at cost to educate – Set price relative to local private school market
High price, high subsidy?
Low price = perception of low quality?
Carefully, strategically manage subsidies for financial aid– Make fin aid mgmt a profession, not a task– X+ Theory of financial aid budgeting– Control your purse strings
Outsource the tasks (data/forms collection, assessment)
Keep decision-making in house
Don’t “leave money on the table”

Copyright National Association of Independent Schools, 2006
Sixth Key Question
Do we have a sufficient and well-managed financial aid budget to achieve dual goals:
Affordability for mission and for market?
Copyright National Association of Independent Schools, 2006
NAIS Principles in Financial Aid Management Science of financial aid
– SSS methodology
– Determination of need
– Calculating family contributions
– Budget projections
– Statistics and trends
Art of financial aid
– Mission-driven
– Professional judgment
– Confidentiality
– Flexibility
– Communication
– Adaptation

Copyright National Association of Independent Schools, 2006
Additional Resources
Resources at www.nais.org– NAIS Principles of Good Practice – Professional development: NAIS Annual Conference, Financing
Sustainable Schools Institute– Marketing Independent Schools in the 21st Century– Financing Sustainable Schools– Member listservs for school leaders
NAIS Resources for Financial Aid Management– School and Student Service for Financial AidSchool and Student Service for Financial Aid– Financial Aid Administration for Schools, 2nd Edition– “Put It In Writing” guide to developing policy manuals– Fall training workshops, spring leadership seminar, summer institute– Financial aid management monographs, presentations, articles – Listings of K-12 tuition payment plan, loan, and scholarship providers– Member listservs for feedback, idea sharing


