UNIVERSITY OF CAMBRIDGE INTERNATIONAL EXAMINATIONS GCE Advanced Subsidiary and Advanced Level MARK SCHEME for the June 2004 question papers 9706 ACCOUNTING 9706/01 Paper 1 (Multiple Choice), maximum raw mark 30 9706/02 Paper 2 (Structured Questions), maximum raw mark 90 9706/03 Paper 3 (Multiple Choice), maximum raw mark 30 9706/04 Paper 4 (Problem Solving), maximum raw mark 120 These mark schemes are published as an aid to teachers and students, to indicate the requirements of the examination. They show the basis on which Examiners were initially instructed to award marks. They do not indicate the details of the discussions that took place at an Examiners’ meeting before marking began. Any substantial changes to the mark scheme that arose from these discussions will be recorded in the published Report on the Examination. All Examiners are instructed that alternative correct answers and unexpected approaches in candidates’ scripts must be given marks that fairly reflect the relevant knowledge and skills demonstrated. Mark schemes must be read in conjunction with the question papers and the Report on the Examination. • CIE will not enter into discussion or correspondence in connection with these mark schemes. CIE is publishing the mark schemes for the June 2004 question papers for most IGCSE and GCE Advanced Level syllabuses. www.theallpapers.com
Transcript
UNIVERSITY OF CAMBRIDGE INTERNATIONAL EXAMINATIONS
GCE Advanced Subsidiary and Advanced Level
MARK SCHEME for the June 2004 question papers
9706 ACCOUNTING
9706/01 Paper 1 (Multiple Choice), maximum raw mark 30
9706/02 Paper 2 (Structured Questions), maximum raw mark 90
9706/03 Paper 3 (Multiple Choice), maximum raw mark 30
9706/04 Paper 4 (Problem Solving), maximum raw mark 120
These mark schemes are published as an aid to teachers and students, to indicate the requirements of the examination. They show the basis on which Examiners were initially instructed to award marks. They do not indicate the details of the discussions that took place at an Examiners’ meeting before marking began. Any substantial changes to the mark scheme that arose from these discussions will be recorded in the published Report on the Examination. All Examiners are instructed that alternative correct answers and unexpected approaches in candidates’ scripts must be given marks that fairly reflect the relevant knowledge and skills demonstrated. Mark schemes must be read in conjunction with the question papers and the Report on the Examination.
• CIE will not enter into discussion or correspondence in connection with these mark schemes. CIE is publishing the mark schemes for the June 2004 question papers for most IGCSE and GCE Advanced Level syllabuses.
www.theallpapers.com
Grade thresholds taken for Syllabus 9706 (Accounting) in the June 2004 examination.
minimum mark required for grade: maximum mark
available A B E
Component 1 30 21 19 14
Component 2 90 64 58 38
Component 3 30 22 20 14
Component 4 120 88 79 45
The thresholds (minimum marks) for Grades C and D are normally set by dividing the mark range between the B and the E thresholds into three. For example, if the difference between the B and the E threshold is 24 marks, the C threshold is set 8 marks below the B threshold and the D threshold is set another 8 marks down. If dividing the interval by three results in a fraction of a mark, then the threshold is normally rounded down.
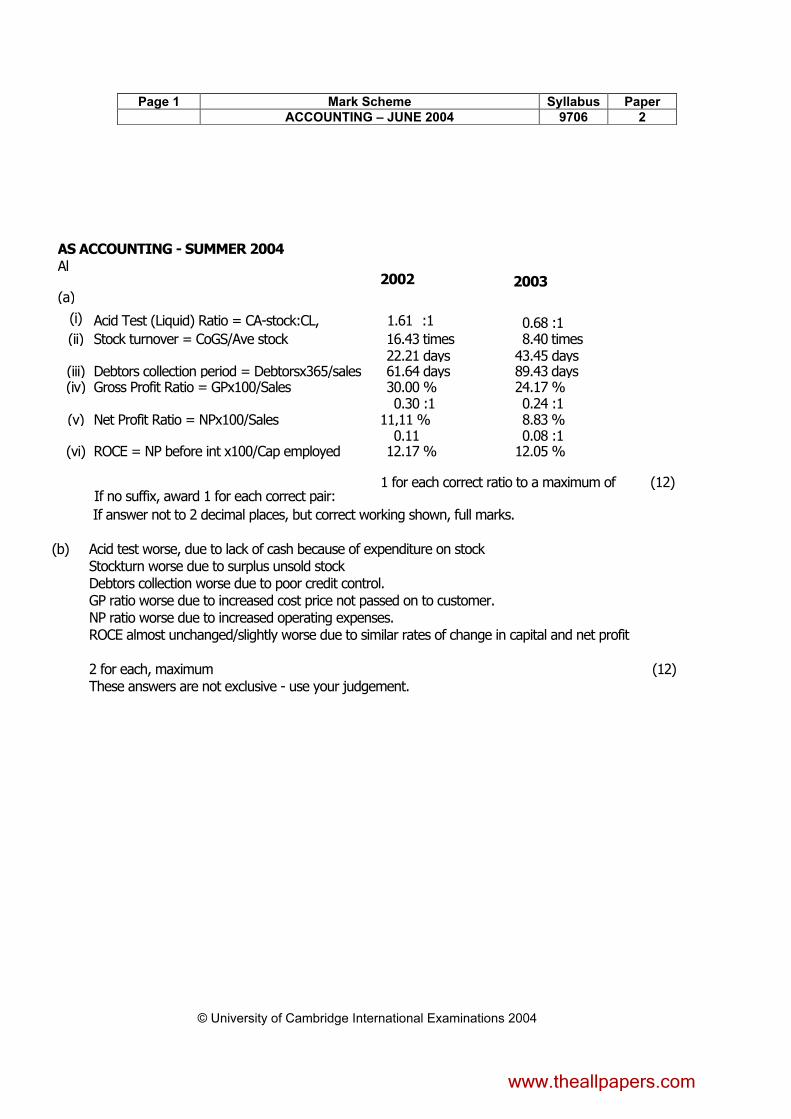
(i) Acid Test (Liquid) Ratio = CA-stock:CL, 1.61 :1 0.68 :1 (ii) Stock turnover = CoGS/Ave stock 16.43 times 8.40 times
22.21 days 43.45 days (iii) Debtors collection period = Debtorsx365/sales 61.64 days 89.43 days (iv) Gross Profit Ratio = GPx100/Sales 30.00 % 24.17 %
0.30 :1 0.24 :1 (v) Net Profit Ratio = NPx100/Sales 11,11 % 8.83 %
0.11 0.08 :1 (vi) ROCE = NP before int x100/Cap employed 12.17 % 12.05 %
1 for each correct ratio to a maximum of (12)
If no suffix, award 1 for each correct pair:
If answer not to 2 decimal places, but correct working shown, full marks. (b) Acid test worse, due to lack of cash because of expenditure on stock
Stockturn worse due to surplus unsold stock Debtors collection worse due to poor credit control. GP ratio worse due to increased cost price not passed on to customer. NP ratio worse due to increased operating expenses. ROCE almost unchanged/slightly worse due to similar rates of change in capital and net profit
2 for each, maximum (12) These answers are not exclusive - use your judgement.
www.theallpapers.com
Page 2 Mark Scheme Syllabus Paper ACCOUNTING – JUNE 2004 9706 2
NB No marks for profit if market research included (5)
Due to wording of question, accept any figures in (a) or (b) for variable costs.
(b)(iii) Sales 1,250,000 DM 157,500 DL 270,000
VO 54,000 V Ad O 63,000
Fixed Costs 345,000 1
Cost of buying in 500 x 200 100,000 2 989,500
Net Profit 260,500
1 +1of
(5) Fixed costs will have to be calculated in most cases.
www.theallpapers.com
(c) Option 1 Second most profitable option, but could lead to employees expecting overtime in future.
Option 2 Market research costs already spent, so no further outlay, and best net profit. But there may be teething troubles and possible re-training problems.
Option 3 No additional capital outlay, but possible problems of quality control. Any three relevant points If unit costing used, award where correct.
(ii) Shindig Ltd would not have purchased Goodwill.(1) The purchase of assets does not give rise to payment for Goodwill (1) Goodwill is only relevant when a company acquires a business as a going concern. (1) The settlement would more likely to have been made in cash. (1)
The partnership business would not have been terminated (1) [5]
2 (a) Budget statement for the production of 10 000 units Process 1 Process 2 $ $ From process 1 1 230 000 (1)(OF)
Materials (10 000 X 4 X $12) 480 000 (1) (10 000 X 3 X $7) 210 000 (1) Labour (10 000 X 3 X $15) 450 000 (1) (10 000 X 5 X $10) 500 000 (1) Overhead (30 000 X $10) 300 000 (1) (50 000 X £16) 800 000 (1) Transferred to process 1 1 230 000 (1) (OF) Finished goods 2 740 000 (1)(OF) [9]
(b) Flexed budget statement for the production of 9 500 units [9000 + (1000 X 50%)] Process 2 $ From process 1 (9500 X 123) 1 168 500 (1(OF) Materials (9500 X 3 X $7) 199 500 (1) Labour (9 500 X 5 X $10) 475 000 (1) Overhead (9 500 X 5 X £16) 760 000 (1)
2 603 000 (1) (OF) [5]
(c) Process accounts for actual production
Process 1 account (10 000 units) $ $ Material (10 000 X 4.2 X $13.5) 567 000 (1) Labour (10 000 X 2.8 X $15.75) 441 000 (1) Production transferred Overhead (10 000 X 2.8. X $10) 280 000 (1) process 2 1 288 000 (1) 1 288 000 1 288 000 Process 2 account (9 500 complete units) $ $
Materials from process 1 1 288 000 (1)(OF) Added materials (9500 X 2.9 X $7.3) 201 115 (1) Labour (9500 X 5.25 X $9) 448 875 (1) Finished goods (note) 2 530 980 (1)(OF) Overhead (9500 X 5.25 X $16) 798 000 (1) Work in progress c/d (note) 205 010 (1)(OF)
2 735 990 2 735 990 [10]
Note Finished goods Work in progress $ $ ($1 288 000 X .9) 1 159 200 ($1 288 000 X .1) 128 800 ($1 447 990 X 9/9.5) 1 371 780 ($1 447 990 X .5/9.5) 76 210 2 530 980 205 010 (d) (i) Materials price variance $(12.0 – 13.5)42 000 $63 000 A (2)* (ii) Materials usage variance (40 000 – 42 000)$12 $24 000 A (2)*
(iii) Labour efficiency variance ( 47 500 – 49 875)$10 $23 750 A (2)*
(iv) Labour rate variance $(10 – 9)49 875 $49 875 F (2)* [8] * 1 mark only if $ sign omitted; no mark if A or F omitted.
(e)(i) By-products are products which arise incidentally in the processing of the main product(s). (1)
(ii) The directors may purchase the machine because the ARR is well above the rate currently being earned by the company (1) and The IRR at 14.7% is almost in line with the rate currently being earned. (1) The payback period is acceptable (1) because it is within the life of the project (1) [3]
• profitability of a project may be compared with present profitability of business
• it is relatively easy to calculate Disadvantages
• average annual profit may not be typical of any year
• timing of cash inflows and outflows is ignored
• it ignores the payback risk factor
• it ignores the time value of money
• ‘profit’ is subjective (provisions for depreciation, bad debts etc.)
• no commonly accepted method of calculating capital employed
• ignores duration of project Payback period Advantages
• it is relatively easy to calculate
• calculation of net cash flows is less subjective than calculation of profitability
• where competing projects are being considered, the risk factors may be compared
• short payback periods benefit business’s liquidity and facilitate faster growth Disadvantages
• life expectancy of project is ignored
• different projects may have similar payback periods but different patterns of cash flows
• time value of money may be ignored Internal rate of return Advantages
• indicates return actually to be expected from expenditure
• may assist in ranking different proposals
• often used in businesses
• recognises time value of money Disadvantages
• more difficult to calculate than NPV
• NPV is usually more useful in ranking different projects ( 1 method discussed – maximum 8 2 methods discussed – maximum 10 3 methods discussed – maximum 12) [12]