Introduction For high value olive oil, the country of origin and type of olive cultivar has a dramatic effect on the price. Falsifying the provenance of such oils is an attractive proposition to fraudulent suppliers. Polar components such as phenolic acids and lignans are present in olive oils. 1 Secoiridoids; phenolics which include an elenolic acid moiety, are unique to the Olearaceae family. These compounds are known to have beneficial health effects due to their antioxidant properties and are associated with the organoleptic properties. Measuring the levels of these polar components in oils from different cultivars and geographic origins is of interest for nutritional and authenticity reasons. In this study a statistical analysis of the polar chemical components of olive oils was used to determine potential markers for olive cultivars. These markers could be used to confirm the provenance of unknown samples. Markers for Spanish Olive Oil Cultivars – Statistical Analysis of Polar Compounds from LC/MS Results APPLICATION NOTE Liquid Chromatography/ Mass Spectrometry Authors: Robert Seward Catherine Stacey PerkinElmer, Inc. Waltham, MA
Transcript
Introduction For high value olive oil, the country of origin and type of olive cultivar has a dramatic effect on the
price. Falsifying the provenance of such oils is an attractive proposition to fraudulent suppliers.
Polar components such as phenolic acids and lignans are present in olive oils.1 Secoiridoids; phenolics which include an elenolic acid moiety, are unique to the Olearaceae family. These compounds are known to have beneficial health effects due to their antioxidant properties and are associated with the organoleptic properties. Measuring the levels of these polar components in oils from different cultivars and geographic origins is of interest for nutritional and authenticity reasons.
In this study a statistical analysis of the polar chemical components of olive oils was used to determine potential markers for olive cultivars. These markers could be used to confirm the provenance of unknown samples.
Markers for Spanish Olive Oil Cultivars – Statistical Analysis of Polar Compounds from LC/MS Results
A P P L I C A T I O N N O T E
Liquid Chromatography/ Mass Spectrometry
Authors:
Robert Seward
Catherine Stacey
PerkinElmer, Inc. Waltham, MA
2
Method
Spanish Olive Oil SamplesA number of authentic branded Spanish Extra Virgin Olive oils (EVOOs) were analyzed. Each of the oils were cold pressed from either a single cultivar olive or from a known blend of cultivars grown in a distinct geographic region in Spain. The single cultivars were Manzanilla Cacereña, Arbequina, Picual, Arbequina, Empeltre and Cornicabra and the blends were comprised of various mixtures of Hojiblanco, Picudo and Picual cultivars.
LC/MS Analysis of Polar Components in Olive OilsPolar Compound ExtractionLiquid-liquid extraction was performed to enrich the polar components of the oils for improved sensitivity. Extraction also reduced the high levels of hydrophobic triacylglycerides and diacylglycerides, which would be retained on reversed-phase columns during the HPLC separation of the polar components.
Olive oil samples were extracted three times with N,N-dimethylformamide (DMF). Extracts were pooled and washed twice with hexane to remove hydrophobic components. Residual hexane was removed from the DMF extracts by centrifugal evaporation. The DMF extracts were diluted 1:20 with water and 2 µL of each extract were injected for LC/MS analysis.
LC/MS MethodExtracts were analyzed in triplicate with a single chromatographic method, with separate analyzes for the detection of components either with positive or negative mode electrospray ionization.
Components were separated by reversed-phase gradients on a Brownlee SPP C18 column with a Flexar™ FX-10 UHPLC pump, using water/methanol eluents at 0.4 mL/min, with a gradient from 10% methanol to 50% methanol over 10 mins, then detected with an AxION® 2 TOF MS fitted with an Ultraspray™ 2 ion source.
An example separation of components for one sample is shown, with the same gradient used for both ionization modes (Figure 1 and Figure 2). Many compounds were selectively detected in either positive or negative modes, although some compounds were detected in both modes. In negative mode (Figure 1), long chain fatty acids and a number of phenolics are detected. In positive mode (Figure 2) a number of phenolics, terpenes and fatty acids are observed as [M + H]+ or [M + Na]+ ions.
For components of interest, the accurate mass and isotope patterns of the molecular ions in the original datasets were used to obtain elemental formulas, which were correlated to known compounds in olive oil. The names and elemental formulas of all the compounds detected in both modes are summarized in a table (see Table 1).
Statistical AnalysisAll of the LC/MS datasets were processed with a proprietary algorithm to extract the intensities for significant LC peaks. The results were compiled into a table, with a row for each dataset, and columns of intensities for each significant peak. Each column was labeled with a text summary of the rounded m/z and time values for that peak. The table was imported into TIBCO Spotfire® for statistical analysis using an S-Plus Principal Component Analysis (PCA) function and for graphical display of result in color-coded scatter plots and bar charts.
Methods for extracting the significant features from each LC/MS dataset and for the PCA of these features with Spotfire have been described in previous applications notes.
Figure 1. Example separation showing EVOO polar components detected in negative ion mode, with peaks labeled with the nominal mass of each compound.
3
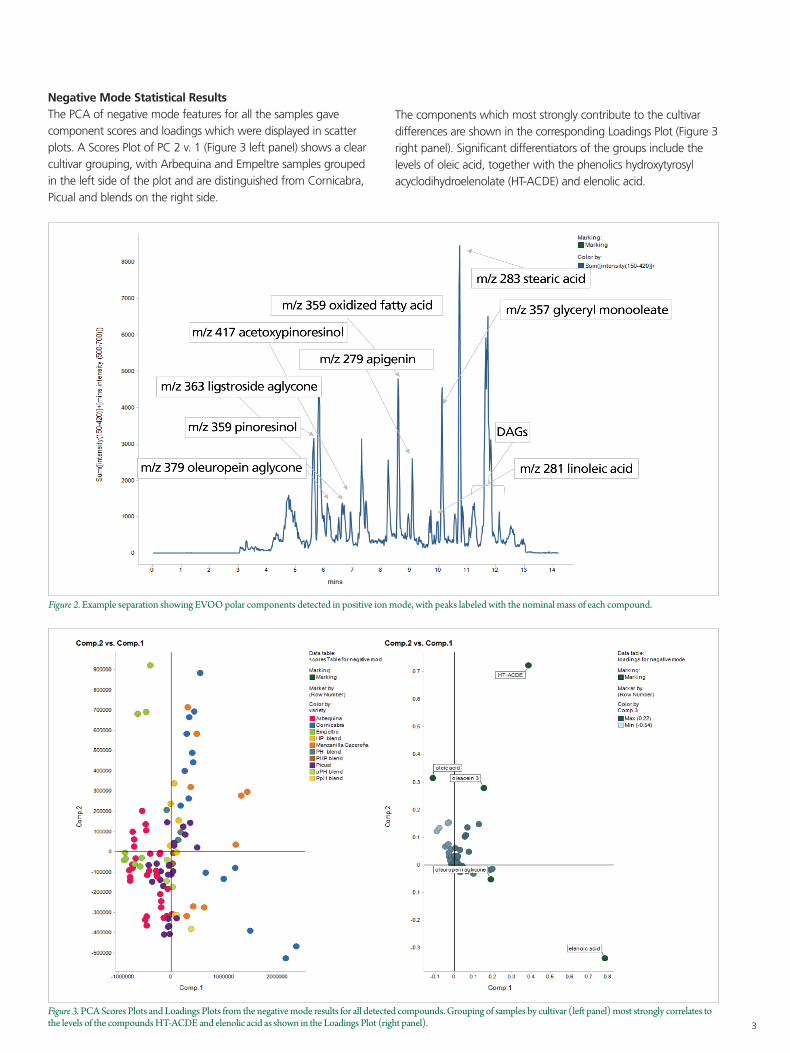
Negative Mode Statistical ResultsThe PCA of negative mode features for all the samples gave component scores and loadings which were displayed in scatter plots. A Scores Plot of PC 2 v. 1 (Figure 3 left panel) shows a clear cultivar grouping, with Arbequina and Empeltre samples grouped in the left side of the plot and are distinguished from Cornicabra, Picual and blends on the right side.
The components which most strongly contribute to the cultivar differences are shown in the corresponding Loadings Plot (Figure 3 right panel). Significant differentiators of the groups include the levels of oleic acid, together with the phenolics hydroxytyrosyl acyclodihydroelenolate (HT-ACDE) and elenolic acid.
Figure 2. Example separation showing EVOO polar components detected in positive ion mode, with peaks labeled with the nominal mass of each compound.
Figure 3. PCA Scores Plots and Loadings Plots from the negative mode results for all detected compounds. Grouping of samples by cultivar (left panel) most strongly correlates to the levels of the compounds HT-ACDE and elenolic acid as shown in the Loadings Plot (right panel).
4
All cultivars had similar levels of fatty acids, except for one Empeltre cultivar which had higher levels. Normally free fatty acid levels in EVOOS are low, but high levels are related to the breakdown of TAGs in the olive oil. The high levels in this one sample suggest that the oil may be degraded. These results suggest that levels of free fatty acids are not reliable markers for cultivar or origin.
The levels of phenolics vary widely between cultivars and between different brands within each cultivar. Some brands have extremely high levels of elenoic acid. Because of a chemical transformation of elenolic acid in acidic eluents, a broad peak was observed with the chromatography method used. Thus, the reported peak height and area were not as reproducible between samples as for other compounds, leading to a wide scatter of sample points in the initial Scores Plot.
A new PCA of the negative mode results excluded the elenolic acid and fatty acids component intensities which had shown large variability in the first analysis. The new Scores Plots (Figure 4 left panel) now show groupings due only to the variation in levels of the phenolic compounds. Arbequina, Empeltre and Picual samples are each closely grouped, although Cornicabra and Manzanilla Cacereña samples were scattered.
The compounds in the Loadings Plot (Figure 4 right panel) which were most related to the cultivar grouping were oleuropein aglycone, oleocein, HT-ACDE and ligstroside aglycone decarboxymethyl (p-HPEA-EDA or oleocanthal).
Two of these compounds, oleuropein and oleocanthal, contribute to the bitterness of the oils. Levels are lowest in the Arbequina and Empeltre cultivars, which have low bitterness levels, as shown in a bar chart (Figure 5).
Variability of oleuropein levels for brands within each cultivar may be due to different ripeness levels of the olives used for the oils.
Oleuropein levels are reduced during the ripening of the olives. A recent report1 analyzed the levels of oleocanthal and oleacein in Greek and Californian oils and found levels varied by both cultivar and processing temperature.
Positive Mode Statistical ResultsThe PCA of positive mode phenolic compounds levels produced a Scores Plot of PC 2 v. 1 (Figure 6, left panel), which showed cultivar grouping. The Loadings Plot showed that the compounds ligstroside aglycone (p-HPEA-EA or oleocanthal), oleuropein aglycone (DHPEA-EA), acetoxypinoresinol and pinoresinol were most correlated to the cultivars.
The lignans pinoresinol and acetoxypinoresinol showed widely varying levels between cultivars. All Manzanilla Cacereña, some Cornicabra and Picual cultivars and blended samples have high levels of both lignans; Empeltre and Arbequina brands had no detectable acetoxypinoresinol and moderate levels of pinoresinol.
These lignans have been detected previously2,3 in Spanish olive oils. Levels of acetoxy-pinoresinol were reported to be abundant in Arbequina and Hojiblanco oils, but low in Picual and Hojiblanco oils; with pinoresinol abundant in Picual and Cornicabra cultivars.
Our findings differ, but a large variation in levels of these lignans between oils from different brands was predictable. Pinoresinols are major components of olive seeds, so levels may be related to the different olive crushing conditions rather than cultivar.
Free fatty acids are also detected in positive mode as [M + H]+ ions. Oleic acid has high levels in one Empeltre cultivar, similar to the findings from negative ion results. 2-oleoylglycerol, resulting from oxidative degradation of TAGs, was also detected in positive mode and has highest levels in the same Empeltre cultivar sample. Other compounds proposed to be oxidized forms of oleic acid are also higher in all Empeltre samples.
Figure 4. PCA Scores Plots and Loadings Plots of phenolics detected in negative mode. Scores Plot (left panel) shows grouping correlated to levels of oleuropein aglycone, oleocein, HT-ACDE and ligstroside aglycone (p-HPEA-EDA).
5
Figure 6. PCA Scores and Loadings Plots of the positive mode results. Scores Plot (left panel) shows grouping into cultivars dominated by levels of acetoxypinoresinol, pinoresinol, ligstroside aglycone HPEA-EA and oleuropein aglycone DHPEA-EA.
Figure 5. Levels of the bitter compounds oleuropein (top) and oleocanthal (bottom) for each sample, ordered and color coded by cultivar. Levels of both are lowest in the Arbequina (red) and Empeltre (green) cultivars.
For a complete listing of our global offices, visit www.perkinelmer.com/ContactUs
PerkinElmer, Inc. 940 Winter Street Waltham, MA 02451 USA P: (800) 762-4000 or (+1) 203-925-4602www.perkinelmer.com
Conclusion
Oils from a number of olive cultivars could be partly differentiated by the levels of polar component features detected in either positive or negative mode analysis. The most significant differentiators determined from PCA are certain lignans and secoiridoids, including pinoresinol, acetoxypinoresinol, oleuropein and oleocanthal.
Methods combining these results, from separate analytical methods, for more of a complete statistical evaluation of the oils, will be covered in a separate application note.
References
1. Evangelia Karkoula, Angeliki Skantzari, Eleni Melliou and Prokopios Magiatis. Quantitative Measurement of Major Secoiridoid Derivatives in Olive Oil Using qNMR. Proof of the Artificial Formation of Aldehydic Oleuropein and Ligstroside Aglycon Isomers. J. Agric. Food Chem., 62, 3 (2014), 600–607.
2. M. Brenes, F. J. Hdalgo, A. Garcia, J.J.Rios, P. Garcia, R. Zamora and A. Garrido. Pinoresinol and acetoxypinoresinol, two new phenolic compounds indentified in olive oil. JAOCS, 77, 7 (2000), 715-720.
3. Carrasco-Pancorbo, Alegria. Rapid Quantification of the Phenolic Fraction of Spanish Virgin Olive Oils by Capillary Electrophoresis with UV Detection. J Agric Food Chem, 54 (2006), 7984-7991.