17
ECONOMIC DEVELOPMENT STRATEGY WOLLONGONG 2013-23

ECONOMIC DEVELOPMENT
STRATEGY
WOLLONGONG 2013-23

3
Vision
We are global leaders in innovative and sustainable research, development and new industries. We become renowned
for leading the way with green technology and jobs.
Wollongong is established as the Regional Centre, creating hubs of
activity with a thriving and resilient local economy. The city is able to
support the establishment of new industries, enterprises and business which attract and retain people to
live and work.
Wollongong is a student friendly city and our residents are educated and employed. We have access to
employment and education through our diverse industry base and world
class learning institutions.
Source: Wollongong 2022. Community Goal 2: We have an innovative and sustainable economy.

4 Wollongong City Council’s Economic Development Strategy outlines the key priorities, goals and actions of Council, with respect to its role in supporting economic activity in the City of Wollongong.
One of the early actions taken by the Councillors elected in September 2011 was to establish an Economic Development Advisory Board (EDAB). EDAB is made up of Councillors, business and community representatives. As part of its role to help Council facilitate regional economic development, one of EDAB’s initial key actions was to complete an Economic Development Strategy. This Strategy aligns with Community Goal 2 of Wollongong 2022, ‘We have an innovative and Sustainable economy’, and is a key deliverable in Council’s Delivery Program 2012-17 and Annual Plan 2013-14. The Economic Development Strategy will inform the annual work plan of Council’s Economic Development Unit.
Wollongong’s greatest economic challenge is to improve employment opportunities in the city. Employment has been a major challenge for Wollongong since the mid-1980s. In recent years there has been an increase in structural related unemployment as the economy continues to diversify. Our city also has large numbers of commuters who travel to Sydney for work (see
section 1). As the Illawarra’s regional Capital, Wollongong also plays a key role in providing employment opportunities for residents of neighbouring Local Government Area’s (LGA’s) of Shellharbour and Kiama.
This Strategy recognises Council cannot resolve the employment challenge on its own. The solution requires a partnership between all levels of government, the business community and residents. This Strategy outlines what policy levers Council can use to contribute to solving the employment challenge.
These include:
■ Civic Leadership – by developing, communicating and implementing a vision for the future of the city, playing a strong advocacy role for the city and wider Illawarra Region.
■ Marketing – by promoting the city as a desirable place to live, work and play. This includes taking a proactive approach to marketing the region as a place to invest, highlighting our many competitive advantages, the provision of business marketing collateral and information about the city, support of Wollongong’s visitor economy, including hosting national and international conferences and delegations.
■ Knowledge hub – by acting as a knowledge hub and information broker – a central point for investors, business and the community for information about Wollongong.
■ Infrastructure – by advocating for long term planning and funding for key infrastructure projects which encourage economic activity supporting further private sector investment. Council’s own asset renewal program also seeks to improve Wollongong’s amenity and ensure it’s a desirable place to live, work and play.
■ Planning – by delivering a planning system that encourages investment and employment, and underpinning individual planning decisions with strong strategic planning for the CBD and key employment precincts.
■ Business support – by supporting businesses, especially Small to Medium Enterprises (SME), by providing a positive business environment, seeking to reduce red tape and improving internal Council systems and processes, along with ongoing support for local business networks and industry clusters.
Wollongong is a city in transformation. Renowned for its world-class steel-making and coal mining industries, Australia’s City of Innovation is today also an important knowledge services centre, international trade hub and a leading university city.
Wollongong is just a 90 minute drive south of Sydney, making it one of Australia’s most well connected regional cities, an ideal destination to live, work and play. Wollongong has many advantages, including our low-cost business location, connections to infrastructure including Sydney’s International Airport, access to high speed broadband, skilled multilingual workforce and envious coastal lifestyle. Our proximity to Sydney also allows us to build strong international links, including to the growing Asia Pacific market. Already, our city has solid ties to this part of the world, particularly China. Our university attracts some 2,500 Chinese students each year.
In the 2012/13 financial year more than $500 million worth of construction was underway or completed in the City Centre. This included the $200 million investment by The GPT Group for its new shopping complex, the Australian Taxation Office’s new $16 million building and Council’s own $19.4 million upgrade of the Crown Street Mall. There are also a number of other private large-scale residential complexes and mixed use developments were in planning or
under construction. Together these investments bring more people into our City Centre.
The city’s economy continues to diversify, broadening our economic base. Our economy’s makeover has seen it move from being heavily reliant on the steel and mining industries to one focused on advanced manufacturing, mining services and technologies. Wollongong remains home to Australia’s largest manufacturing facility BlueScope.
In addition, NSW Ports Port Kembla operation, just a 10 minute drive from the CBD, is supporting our diversification as it develops into a major port and logistics hub, with a $700 million outer harbour expansion set to continue over the coming years.
Supporting the transformation of our city is the University of Wollongong. The University has a strong reputation nationally and internationally as a leader in education and research. It brings 22,000 students, including 5,800 international students, to our region every year. Its advances in research and development are putting Wollongong on the global map in addition to fostering young entrepreneurs and start-up businesses.
We’ve established ourselves as a knowledge services hub with a density of ICT, contact centres, business processing and head office operations in the CBD. The city will also benefit
from the State Government’s investment in a Tier III Data Centre that will put Wollongong a mouse click away from Sydney.
Our city is establishing a strong health and aged care industry. Growth in this industry is coming from both the public and private sectors with the $186 million expansion of Wollongong public hospital and many local private companies servicing this growing market.
In addition, our city’s natural beauty and pristine beaches make Wollongong an ideal tourism destination. The city attracts over 4.5 million visitors annually with approximately 7,000 visitors from China. The tourism industry injects $573 million into our local economy each year and supports 3,575 local jobs. We are working towards the improvement of key tourism assets and to actively promote the city as an ideal conference and event location.
Our Council, early in its term, set up the Economic Development Advisory Board. This Board is a mix of Councillors and key industry representatives, and I’m grateful for the Board’s time and commitment in working with us to develop the Economic Development Strategy.
I look forward to continuing to work with the Board, Wollongong businesses and the broader community to deliver a successful future for our city.
Executive SummaryForeword
ECONOMIC DEVELOPMENT STRATEGY 2013-23
Wollongong City Council Lord Mayor Councillor Gordon Bradbery OAM
5

76 The Economic Development Strategy aligns with our city’s long term strategic plan, Wollongong 2022. Within Wollongong 2022 are six community goals, including Community Goal 2 that states “We have an innovative and sustainable economy”. The Strategy focuses on Council-led actions and projects to help achieve this community goal. Wollongong’s current economic circumstances are identified in a SWOT analysis in the Strategy (see section 5). This SWOT analysis and background research is used in the Strategy to develop the key strategic areas within Council’s sphere of influence and budget.
Each of these strategic areas has a series of actions and projects that Council will undertake. These actions and projects can only be achieved by working with a range of key partners in the city including but not limited to the University of Wollongong (UOW), Regional Development Australia (RDA) Illawarra, the Illawarra Business Chamber (affiliated with the NSW Business Chamber), Destination Wollongong, regional offices of the Australian Industry Group and Property Council of Australia, ICT Illawarra (ICTI), the Illawarra Innovative Industry Network (i3net), as well as State and Federal Government, along with our local council colleagues across the region.
It should be noted this Strategy will need to be reviewed on a regular basis. It has also been written at the same time as a number of other regional development projects. These include RDA’s Transition Illawarra project which include the development of a region wide Economic Plan, the NSW Government’s work on the Illawarra Regional Growth Plan, and Illawarra Regional Transport Plan.
One Central Focus: Jobs Growth
Wollongong needs to continue to grow and broaden its economic base to create more of the jobs required in the 21st century.
Key aspects of this strategy and associated key priorities are specifically aimed at addressing three related challenges:
■ Bring unemployment in line with the state/national average, including Wollongong’s higher rate of youth unemployment.
■ Reduce the number of people forced to commute each day. This recognises the significant social costs and associated escape spending.
■ Reduce the ‘brain drain’ as many of our best and brightest young people leave the region after graduating from their studies due to limited career opportunities in Wollongong and the Illawarra.
Wollongong’s proximity to Sydney, its world-class university, enviable coastal lifestyle and skilled workforce mean we are better placed than many other regions to meet these challenges.
Wollongong needs to continue to grow and broaden its economic base to create more of the jobs required in the 21st century.
EXECUTIVE SUMMARY ECONOMIC DEVELOPMENT STRATEGY 2013-23
Enterprise 1 building at the Innovation Campus

8 9■ Continue to partner with UOW
and TAFE to further strengthen links and opportunities to grow our reputation as a university city. To leverage our University’s highly-skilled graduates, world class research and development capabilities, along with an extensive Alumni network.
■ Council will continue to work with Destination Wollongong and local conference and tourism providers to market Wollongong as a destination to visit and encourage more overnight stays.
Knowledge hub Council is often the first point of contact for many people looking to invest in, or move to Wollongong. Much of this information is shared through our website or via our close working relationship with other key stakeholders and agencies.
Actions:
■ Ensure that Council’s message to investors is that the city is open for business. Relevant information and referrals to other government agencies and key business networks are provided to investors and businesses to ease the uncertainties of coming into a new city.
■ Council will continue to lead the way in providing the up-to-date economic and demographic data required by investors and businesses in our city. This information will be
available through the Economic Development section of Council’s website.
■ Council will continually review the way economic data is presented and look for examples of best practice in the delivery of this information.
Infrastructure Access to reliable and high quality infrastructure drives business growth and influences decisions about business locations. Council has a clear advocacy role to ensure key transport links are maintained and enhanced to meet the needs of a growing economy. Council also has a role to play in providing quality local infrastructure which lifts the city’s amenity and attractiveness. Council is committed to meet its infrastructure renewal needs. Recent examples include the Blue Mile, rollout of free WiFi in Wollongong CBD and the refurbishment of the Crown Street Mall.
Actions:
■ Council will continue to advocate for regionally significant infrastructure to be included on NSW Infrastructure’s priority list.
■ Work with State and Federal governments and key regional stakeholders to implement the NSW Long Term Transport Master Plan to improve transport connections with Sydney and other regions.
■ Maintain our asset renewal program, recognising the important contribution Council plays in improvements to the public realm and the role it plays in encouraging private sector investment.
■ Work with key stakeholders in the development of key tourism infrastructure that adds to Wollongong’s attractiveness as a destination, as well as a place to live and work.
Planning The planning role ranges from undertaking high-level strategic planning around precincts through to ensuring specific sites have appropriate zoning controls, services and are attractive to potential investors. Council is focused on simplifying the development assessment process and ensuring it remains transparent. One of the ways this may be achieved is by aiming to reduce the turnaround times for development applications by increasing the use of complying development provisions for both residential and commercial applications.
Council’s role in economic development
This Strategy’s primary focus is to outline how Council can best support economic development especially by fostering greater investment and jobs growth in the LGA, sending a strong message that Wollongong is open for business.
Wollongong’s expansion will need to be facilitated through appropriate planning arrangements and infrastructure delivery, in line with the NSW Government’s Illawarra Regional Growth Plan.
Council has a direct impact on many aspects of business operations including planning, infrastructure and business support. Consequently, we can contribute to economic development by ensuring there are efficient planning processes and ensuring the city’s public amenity is well maintained. These operational roles will encourage investment from the private sector.
Council’s policy levers can be divided into six key areas:
Civic leadership Council works with many stakeholders involved in economic development including industry, business and community groups, and other government agencies and departments. Wollongong Council also acts as a strong regional advocate to other levels
of Government, helping coordinate various groups and facilitate joint projects. This way, resources can be used to collectively benefit the city and our region more broadly.
Actions:
■ Council will continue to play a strong leadership role in advocating for policies and enabling infrastructure to drive new investment and foster the growth of existing businesses and industry.
■ Continue initiatives to create a vibrant and attractive City Centre, recognising the role it plays as the region’s capital and its importance both in terms of future employment and population growth for the broader Illawarra region.
■ Council will continue to lobby for more support for local small businesses and to leverage more opportunities for jobs growth along with the relocation of government jobs to Wollongong.
Marketing activities A Council is often the ‘face’ of a city, and can encourage economic development and tourism attraction by undertaking or supporting activities that promote Wollongong and the Illawarra more broadly. These might be events, marketing initiatives or hosting delegations. Council currently works with organisations such as UOW and
the NSW Government, to promote the city via Advantage Wollongong. It also works with Destination Wollongong to market the city as a destination to visit through various campaigns such as the Grand Pacific Drive. These activities are part of the broader leadership role Council performs for Wollongong. It’s vital Wollongong’s key business and lifestyle factors be promoted both domestically and internationally to enable the population and economic growth the city desires.
Council recognises the importance of maintaining and forging international business relations. Our Civic Relations Policy has identified key international markets and Council regularly hosts foreign delegations. Our Sister City and Friendship relationships bring economic, social and cultural benefits to each city. With the growth of the Asian economy, our city’s proximity to this market offers many opportunities
Actions:
■ Enhancing awareness about Wollongong and the Illawarra region more broadly, including in targeted overseas markets, particularly China.
■ Develop an ongoing Business Investment and Attraction program, in conjunction with key stakeholders, aligned with key growth sectors.
IntroductionECONOMIC DEVELOPMENT STRATEGY 2013-23
The GPT Groups $200M new Wollongong Shopping Complex
We can contribute to economic development by ensuring there are efficient planning processes and ensuring the city’s public amenity is well maintained.
10 11Actions:
■ Ensure adequate capacity of strategic employment lands to support development required to satisfy economic and jobs growth.
■ Council aims to implement best practice systems to facilitate and encourage investment. This includes ways to continue to streamline the planning process particularly for small business.
Business support Council works with other key agencies to ensure a coordinated approach to business support services. We also provide ongoing support for initiatives such as i3net, ICTI, StartPad and the Wollongong Small Business Club. Council will continue to support small businesses and encourage innovation. Council can also provide the frameworks to encourage and foster small business in the city by ensuring a regulatory framework to foster entrepreneurship and creative industries.
Actions:
■ Develop an Evening Economy Strategy that will encourage the use of our city both day and night. The strategy will aim to improve the ambience of the city by encouraging new cafes and bars and outdoor dining. The Strategy will be aligned with Council’s Cultural Plan and include the development of a Live Music Taskforce.
■ In order to attract and facilitate new events to the city, Council will look to streamline the approval processes for major events.
Resource and budget constraints
A key part of this Strategy is to prioritise activity so funding and resources are targeted at areas which most effectively support employment in Wollongong.
The structure of the Economic Development Strategy
The Economic Development Strategy is divided into six sections.
1. Background and context A discussion on the current state of Wollongong’s economy and the ongoing or emerging challenges we face as the city moves from its traditional manufacturing base to a knowledge based economy.
2. Wollongong Employment Lands Identifies Wollongong’s key sites in driving employment growth for the city’s future.
3. Key future industry drivers This section includes identifying the sectors likely to underpin future growth and key industry drivers.
4. The Wollongong Advantage Outlines the competitive advantages Wollongong offers as a business location in comparison to other similar sized locations.
5. SWOT analysis A SWOT analysis identifies Wollongong’s positive features, key opportunities, the barriers hindering employment and potential threats to the city’s economic wellbeing.
6. Appendix Past reports on Wollongong’s economic development and reference documents used in this Strategy.
Central policy focus: Jobs
The main economic challenge facing Wollongong is the need to increase employment opportunities. As a result, this Strategy has job growth as its central focus.
Official unemployment data from the Australian Bureau of Statistics (ABS) shows Wollongong’s unemployment rate is consistently above the state and national average. Over the past four years Australia’s average unemployment rate has been 5.2%, while Wollongong’s is 7.1%. This is an improvement of 1998’s rate of 12%. For youth aged between 15-19 years, the unemployment rate was 15.8% in 2011 which is higher than the NSW average of 12.8%.
The employment challenge is larger than the official statistics suggest.
Some 27,660 workers living in the LGA commute out of the city each day for work. The majority of these, or around 16,553 people, commute to Sydney and surrounds. This makes the Wollongong to Sydney route one of Australia’s busiest commuter corridors.
Around 35% of Wollongong workers with a graduate diploma and graduate certificate commute to work outside the LGA. This reflects a number of factors including a lack of opportunities in Wollongong along with opportunities for better pay in Sydney.
Some 22% of the city’s commuters are professionals. This represents the highest percentage of commuters, along with 10.9% classified as managers. This shows a high proportion of commuters are
travelling for highly qualified jobs. For businesses considering relocation to Wollongong, this represents a large potential workforce.
Large numbers of people travelling out of the area for work has broader economic and social implications. Sydney workers are more likely to spend a portion of their income there, resulting in a loss of economic activity for the city. The commute also means people are less likely to participate in family and community activities, such as sporting clubs, school communities and other broader community and cultural activities. There is not however, a clear understanding of the full economic and social costs of having such high a proportion of commuters.
Unemployment Rate - Wollongong vs NSW
COUNCIL’S ROLE IN ECONOMIC DEVELOPMENT ECONOMIC DEVELOPMENT STRATEGY 2013-23
16%
12%
8%
4%
0%
1998
1999
200
0
200
1
200
2
200
3
200
4
200
5
200
6
200
7
200
8
200
9
2010
2011
2012
Mar
-13
Jun
- 1
3
Rat
e %
% Wollongong
% NSW
Section 1
Background and Context
Council works with other key agencies to ensure a coordinated approach to business support services.
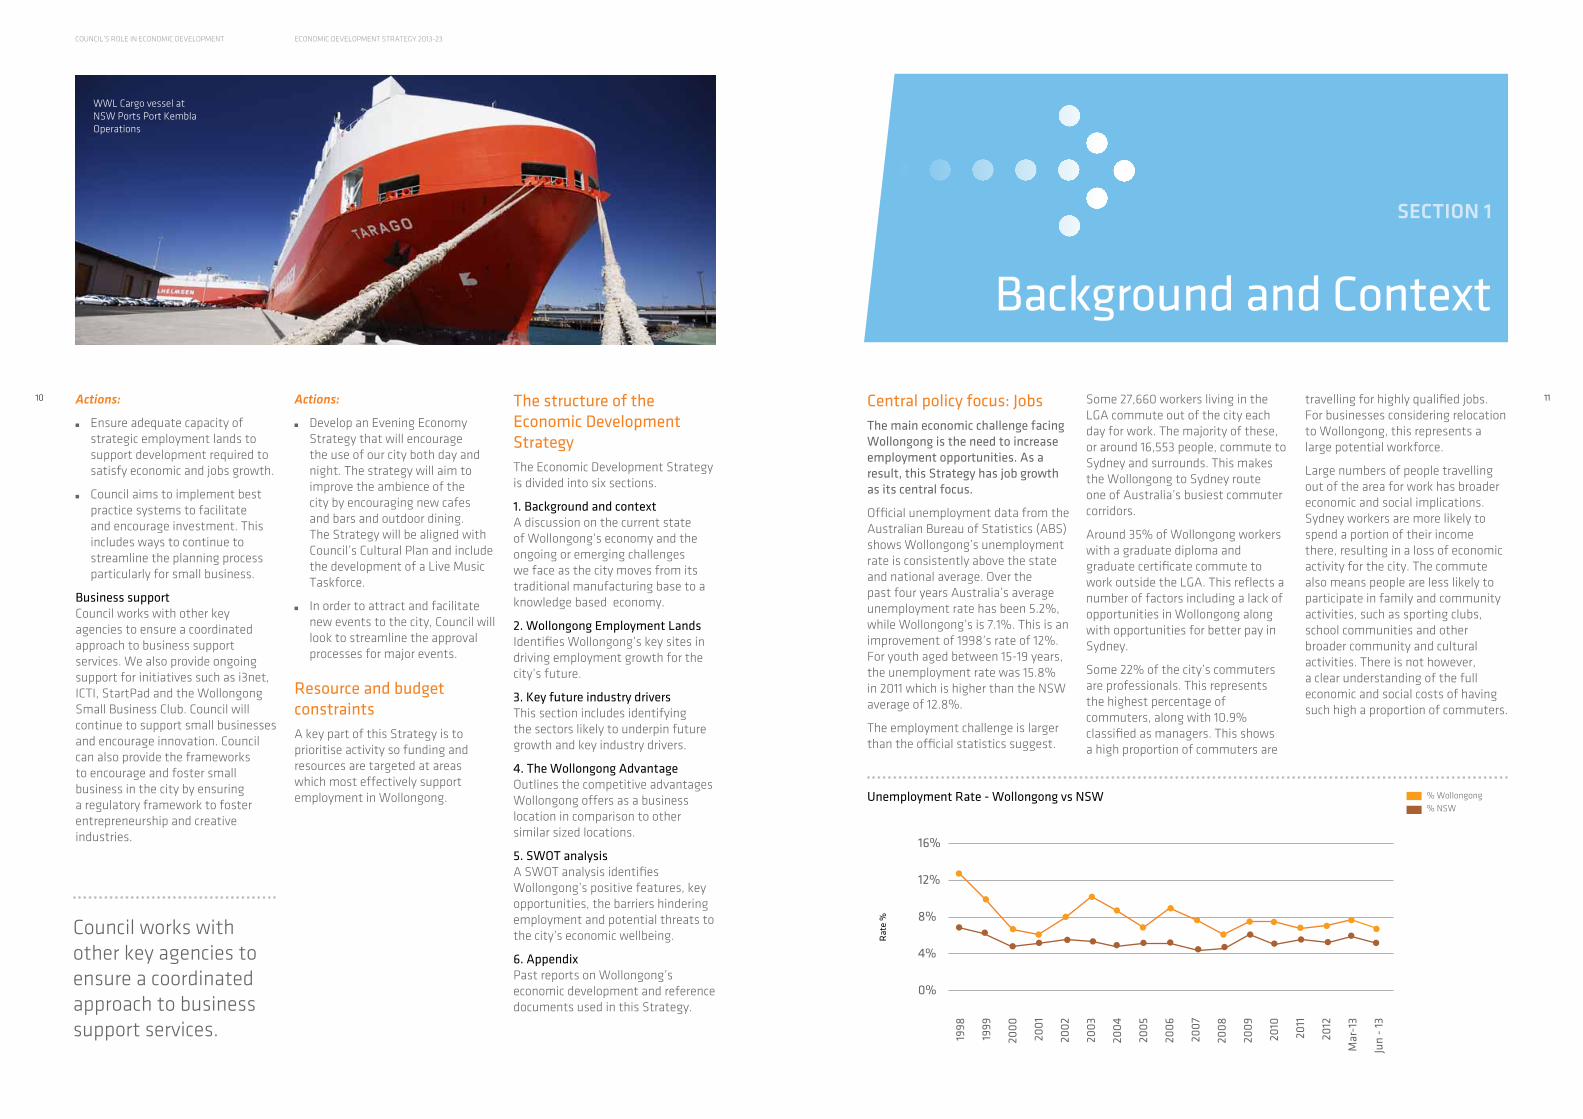
WWL Cargo vessel at NSW Ports Port Kembla Operations

12 13
The long-term employment trends, and their economic and social implications, is another reason job creation is at the centre of this Economic Development Strategy.
Economic transition has been underway since the early 1980s
The diversification of Wollongong and the Illawarra’s economy has been underway for over 30 years.
Wollongong’s economic transformation started in the early 1980s, when BHP began to downsize its workforce at Port Kembla steelworks. Today, BlueScope Steel (formerly BHP) employs 3,500 people making them still the largest private employer in the region. The Port Kembla facility remains the largest manufacturing plant in Australia producing 2.6 million tonnes per annum. The region has a high skill base in both the mining and manufacturing sectors. In addition to BlueScope and BHP Billiton, there are a large number of smaller businesses supporting this sector. These businesses are well placed to continue to look for new opportunities in niche markets outside the region.
Today, Wollongong is emerging as an important business and financial services centre, and is home to one of Australia’s leading universities, the UOW. In 2012 the University boasted 25% of NSW’s IT graduates, which was also the second highest number of IT graduates in Australia. The Knowledge Services Sector, meanwhile, employs 4,900 people in 72 locations in Wollongong in areas such as business/shared services, ICT including software development and digital media, and financial services and funds administration. Other key growth sectors include advanced manufacturing and, on the back of the expansion of NSW Ports, Port Kembla operations, the growth of the logistics sector. The Tourism sector is also proving to be a growing sector for our city and the greater region, assisted by the investment in key infrastructure, street level activation and collaborative marketing.
Between 2006 to 2011 the biggest change in the Wollongong economy has been the growth of the health care and social assistance industry with a 2.3% growth in the market share of the local economy. Followed by education and training at 0.9%, accommodation and food services at 0.8% and mining at 0.7%.
The sectors that have contracted the most were manufacturing at -3.5%, retail at -0.9% and construction at -0.6%.
Wollongong the Regional Capital
The Illawarra is defined as the three LGA’s of Wollongong, Shellharbour and Kiama. As the regional capital Wollongong generates the highest economic output and also provides employment for 44% of the workforce from Shellharbour’s LGA and 24% of the workforce from Kiama’s LGA.
Size of economy The Wollongong LGA generates Gross Regional Product (GRP) of $11.8 billion per year. This represents 83% of the Illawarra’s GRP of $14.2 billion. In terms of the whole of NSW, Wollongong represents 2.6% of Gross State Product (GSP).
Looking ahead, GRP for Wollongong is projected to grow to between $14 and $16 billion by 2022.
BACKGROUND AND CONTEXT ECONOMIC DEVELOPMENT STRATEGY 2013-23
Population and output trends Wollongong has a higher Gross Domestic Product (GDP) per capita than the Illawarra average. This reflects the higher skilled employment opportunities in the city centre, which is where many professional services firms and government agencies are located.
Despite this positive region-wide comparison, Wollongong GDP per capita is below the state and national averages. This may be linked to Wollongong’s above average
unemployment rate and the resulting short-fall in actual economic growth versus the potential for economic activity in the city.
The GDP per worker data reveals a more positive picture for the city. Wollongong leads the region in terms of GDP generated per worker ($163,921 versus $156,904 for the Illawarra) but also has a GDP per worker outcome above the NSW average. In other words, workers make an above average contribution to the NSW economy.
These results reinforce the importance of putting employment at the centre of the Economic Development Strategy. Increasing employment in Wollongong will have a positive impact on economic growth and allow the city and the region to better utilise its potential workforce.
Wollongong v Illawarra GRP
Rest of the Illawarra $14.2 billion
Wollongong $11.8 billion
$ $
Looking ahead, GRP for Wollongong is projected to grow to between $14 and $16 billion by 2022.
Occupation of Wollongong’s Commuters 2011 Change in Market Share of employees by industry 2006 - 2011
-4% -3% -2% -1% 0% 1% 2% 3%
Other Services
Arts & Recreation
Health Care & Social Assistance
Education & Training
Public Administration & Safety
Administration & Support Services
Professional, Scientific & Technical Services
Rental, Hiring & Real Estate Services
Financial & Insurance Services
Information Media & Telecommunications
Transport, Postal & Warehousing
Accommodation & Food Services
Retail Trade
Wholesale Trade
Construction
Electricity, Gas, Water & Waste Services
Manufacturing
Mining
Managers
7000
6000
5000
4000
3000
2000
1000
0
Profe
ssionals
Technici
ans and Tra
des Work
ers
Comm
unity and P
ersonal S
ervice
Work
ers
Clerical a
nd Adm
inistra
tive W
orkers
Sales Work
ers
Mach
inery Opera
tors
And Driv
ers
Labourers
Not sta
ted -
Inadequate
ly desc
ribed

14 15
BACKGROUND AND CONTEXT ECONOMIC DEVELOPMENT STRATEGY 2013-23
Population and income trends
Average income for employees in Wollongong is $71,803 per year which is above the Illawarra average of $69,610 (This most likely reflects the salaries of CBD workers employed in professional services sectors and the public service). However, this rate is below the NSW average of $72,875.
Level of Education
Wollongong’s workforce in general terms is on par with NSW in terms of its level of education. Wollongong has a higher than NSW average in Certificate level education, which is a reflection of our traditional employment industries in manufacturing. However, in contrast Wollongong does have a lower portion of people with Bachelor degrees.
As our economy continues to diversify into more knowledge based industries there will be a greater need to increase the regions education levels to align with the jobs of the future.
Employment and Output by industry
Health care and social assistance is Wollongong’s largest employment sector, providing work for more than 15% of the labour force.
Level of Education
Level of Education
Postgraduate Degree
Graduate Diploma and Graduate Certificate
Bachelor Degree
Advanced Diploma and Diploma
Certificate
Level of education inadequately described
Level of education not stated
Not applicable
No. People in Wollongong
4,615
1,918
13,424
8,649
21,933
1,145
2,071
27,383
Live in Wollongong
Live in NSW
40 35 30 25 20 15 10 5 0
%
Output: Output data represents the gross revenue generated by businesses/organisations in each of the industry sectors in a defined region. Gross revenue is also referred to as total sales or total income.
Employment: The employment data presented above represents the number of people employed by businesses / organisations in each of the industry sectors in the defined regions. In this report the employment data is place of work data and represents total numbers of employees without any conversions to full-time equivalence. Retail jobs for instance represent typical employment profiles for that sector, i.e. some full time, some part time and some casual.
Jobs and Output of industry in Wollongong 2011
Health Care
& S
ocial A
ssist
ance
Manufa
cturin
g
Educatio
n & Tra
ining
Retail T
rade
Accom
modatio
n & Food S
ervice
s
Public A
dminist
ratio
n & S
afety
Constru
ction
Profe
ssional, S
cientifi
c & Tech
nical S
ervice
s
Transp
ort, P
ostal &
Ware
housing
Financial &
Insu
rance
Servi
ces
Other S
ervice
s
Administ
rativ
e & S
upport Servi
ces
Wholesa
le Trade
Mining
Rental, H
iring &
Real E
state
Servi
ces
Arts &
Recre
ation S
ervice
s
Info
rmatio
n Media &
Telecom
munica
tions
Electric
ity, G
as, W
ater &
Wast
e Servi
ces
Agricultu
re, F
orest
ry & Fish
ing
NSW
$65,813$65,642
$61,309
$51,500
Australia Wollongong Illawarra
GDP Per Capita
Manufacturing accounts for 12% of the workforce and Education 11%.
In comparison to the NSW industry breakdown, the top three sectors have an above state average share of employees - health care and social assistance 12%, manufacturing 8%, and education 8%. The other notable industry is mining where Wollongong boasts a higher than state average with 2.28% versus 0.99% in employment breakdown.
When comparing the size of the economy by output, manufacturing and mining represent the highest market share with 24 and 14% respectively. Health care in this instance only represents 5% of the local economy. This emphasises the importance of the manufacturing and mining sectors to our city both in terms of export income and high flow on effects to the rest of the economy, despite the contraction of these industries in terms of
employment over the past 30 years.
The high value of the manufacturing industry to the local economy illustrates the fact that Wollongong needs to ensure it has adequate industrial lands for manufacturing and port logistics-related industries, along with an ability to accommodate the education, health and aged care sectors and professional service businesses.
Average income per worker
Wollongong
$72,875$71,803
$69,610
IllawarraNSW
12,000
10,000
8,000
6,000
4,000
2,000
0
$7,000
$6,000
$5,000
$4,000
$3,000
$2,000
$1,000
$0
Jobs
Output (M)

16 17
BACKGROUND AND CONTEXT ECONOMIC DEVELOPMENT STRATEGY 2013-23
Health care and social assistance is Wollongong’s largest employment sector, providing work for more than 15% of the labour force.
Business Counts (staff numbers)
Non employing
1-4
5-19
20-199
200 +
6,612
3,467
1,554
473
34
Business landscape, by industry and size
There are more than 12,000 businesses in the city and just over half of these, or 54%, are non-employing / self employing operators. A further 40% are small businesses which employ up to 19 employees. Along with these SMEs, there are also a number of national and international businesses with
operations in Wollongong. These include BHP Billiton, BlueScope Steel, WIN Network, UOW, Vesuvius, KPMG, Energy Australia, Metal Manufactures (MM Kembla Products), Pillar Administration and ANZ OnePath. Only 34 businesses in our city employ more than 200 employees.
This structure means economic development policies need to
incorporate strategies that support existing SMEs to grow, and attract new, possibly larger, employing businesses to the city. It has been demonstrated by previous business expansion and attraction projects that 80% of growth in an economy will come from existing businesses in the area and only 20% will come from relocations or establishments (Lead Local Compete Global - McKenzie Report 1995).
Wollongong LGA 2011 Census Data Snapshot
■ Population 192,418 ■ Median age 38■ Median personal income (weekly, pre tax) $489 ■ Median household income (weekly, pre tax) $1,101■ Median mortgage repayment (monthly) $1,950■ Median weekly rent (weekly) $250■ Unemployment rate 7.1%■ Participation rate 56.8%■ Labour force 89,048
Digital Economy
Wollongong’s high speed broadband network presents many of the region’s large and small businesses with the ability to access worldwide markets. Our focus on the digital economy has seen Council secure funding from the Federal Government for the Digital Local Government program which will ensure Council as a business, and our city as a whole, can take further advantage of the fast speed broadband and the digital economy. Council has also launched free
Wi-Fi in outdoor areas in the city centre on Crown Street between Gladstone Avenue and Corrimal Street, as well as in Globe Lane, and the Arts Precinct (formerly Civic Plaza) on Burelli Street. The city is also set to benefit from the newly constructed Tier III Data Centre. This Data Centre, which launched in December 2013, puts Wollongong just two milliseconds from Sydney, and provides the city with fast and reliable connectivity to the world.
Institute for Super Conducting and Electronic Materials, Innovation Campus

18 19
EMPLOYMENT LANDS ECONOMIC DEVELOPMENT STRATEGY 2013-23
11.628 Jobs
100 Jobs
Jobs per suburb across Wollongong LGA
city centre is well underway with $500m worth of construction works underway or completed in 2012/13. Council is also revitalising the city centre with a $19.4m upgrade of the Crown Street Mall. This work compliments a $200m new shopping complex by the GPT Group.
The Wollongong CBD office market equates to approximately 150,000sqm of commercial office space. According to the Property Council of Australia’s Office Market Report, Wollongong has a shortage of A-grade office accommodation and the fifth tightest market in the country. A-Grade vacancies are under 0.5%, which indicates an opportunity for further development. In the past five years 180,000sqm of new commercial offices have been DA approved for the city centre. However, tenant pre-commitment to move projects into construction phase remains a challenge post the Global Financial Crisis. The additional 30,000 workers required in Wollongong by 2030 will contribute to strong demand for office accommodation.
The city centre is also an important precinct for tourism related businesses. With the majority of accommodation, restaurants/cafes and retail operators located here or in the CBD fringe along the foreshore. The density of these businesses in the CBD is what draws the visitors and residents to the area daily making it the city’s focal destination.
West Dapto The West Dapto Land Release Area is located 12km south of Wollongong and covers an area of approximately 4,700 hectares. The release area will provide an additional 17,000 dwellings for 50,000 people and 184 hectares of employment land creating 8,500 jobs over the coming decades. This is an important key site for the region as it is the largest single release area outside the Sydney metropolitan area.
Innovation Campus The Innovation Campus, or the “iC” as it’s known, is a $500 million master-planned Research and Development and Technology Precinct. iC is an ICT, mining services, innovative materials, health and sustainability hub, which offers direct links to the ‘Global Challenges Research Program’ and the research strengths of UOW.
Kembla Grange Kembla Grange, to the south-west of Wollongong, has been earmarked as a key employment precinct. Existing facilities are to be expanded to include additional manufacturing, a business park and service industries. These employment lands will also support the expansion of the NSW Ports Port Kembla Operation.
Tallawarra Business Park The Tallawarra Business Park Precinct, on the Western shores of Lake Illawarra, sits adjacent to the gas-fired Tallawarra Power station developed by Energy Australia. Planning controls for the site propose a range of employment and tourism land. It sits in an area that also includes proposed residential land, open space, and environmental conservation land.
NSW Port’s, Port Kembla Operation Annual trade through Port Kembla increased from $4 billion to $13.6 billion in the 2011/12 financial year. While the Port has traditionally served as a bulk goods facility handling iron ore, coal and grain, it’s now the largest vehicle import hub in NSW and the principal grain export port in southern and south western NSW. Managed by NSW Ports on a 99 year lease, the Port directly and indirectly sustains 3,863 jobs and contributes $839 million in gross economic output and $239 million in household income to the regional economy each year. Its growth will be a catalyst for further development of employment lands in the Illawarra. Expansion is underway through the $700 million redevelopment of the Port’s Outer Harbour. Stage 1 of this plan was completed in 2012 and provided an additional 8 ha of employment land.
71,968 people are employed in Wollongong’s LGA with the largest concentration of these – or 11,628 jobs – in the city centre. This number grows to 20,810 when taking into account the CBD fringe including North Wollongong (excluding the Innovation Campus), Wollongong Hospital and Coniston. Further afield, Port Kembla accounts for 7,042 jobs, Unanderra has 4,421
and UOW’s main campus and surrounding businesses in Keiraville/Gwynneville account for 3,316 jobs.
Wollongong has a number of key employment lands precincts. Both the commercial and industrial lands markets present substantial growth opportunities. In terms of industrial lands, while Wollongong has substantial zoned land, sections
of this land have servicing and supply issues that need to be addressed in order for it to be successfully brought to market. Wollongong’s key employment lands include:
Wollongong City Centre The CBD has a vital role as the commercial administrative centre not only for Wollongong but the broader Illawarra. The revitalisation of the
Section 2
Employment Lands
Council is also revitalising the city centre with a $19.4m upgrade of the Crown Street Mall. This work compliments a $200m new shopping complex by the GPT Group.

KEY FUTURE INDUSTRY DRIVERS ECONOMIC DEVELOPMENT STRATEGY 2013-23
2120
Section 3
Key Future Industry Drivers
As the economy transitions there are a number of key industry areas which will become key drivers of growth in Wollongong.
Advanced Manufacturing With the dominance of manufacturing in the Wollongong economy it is no surprise that it will continue to be a strong driver in the future. However, just as our economy has diversified so has the manufacturing sector through innovation and technology enhancements. Advanced manufacturing is a key source of innovation, technology and skills transfer for the local economy. Wollongong boasts a growing number of advanced manufacturers who successfully compete domestically and internationally for business. These companies are recognised industry leaders such as BlueScope Steel, MM Kembla, Bisalloy Steels, David Brown Gear, Vesuvius, Stolway, Leussink Engineering, Fibre Optics Design and Construct and Alminco.
Business Services / Shared Services The past decade has seen multi-location corporations aggregate business support functions into Shared Services Centres. Wollongong has experienced strong growth in Shared Services as companies in this expanding sector tap into the city’s stable, skilled and multilingual workforce, competitive business costs, modern business infrastructure and superb connectivity.
Wollongong’s Shared Services industry features companies such as Insurance Australia Group (IAG), WIN Network, Peoplecare, IMB, Australian Health Management and Stellar. In Wollongong, Shared Services Centres employ more than 4,900 people in:
- Back office functions in finance, accounting and IT
- Headquarter functions in administration, human resources and marketing
- Inbound/Outbound customer facing operations such as call centres
- Inbound technical help desks and support centres.
Clean Technologies Renewable Energy is one of the fastest growing industries worldwide. Australia has a rich diversity of renewable energy sources including wind, solar, etc. In 2009 the Illawarra Green Jobs Action Plan was developed from which a Clean Technologies Network was established with the aim of encouraging the Illawarra manufacturing sector to look for new opportunities and markets in this high growth sector.
Creative Industries The creative industries sector in Wollongong is dominated by newspaper publishing, free-to-air television, architectural services and arts education jobs. There has been an increase in the number of people designated as creative artists,
musicians, writers and performers in the city, as well as workers engaged in software publishing, conference and event organisers and interior designers. Between 2006 and 2011 the growth in creative worker jobs increased from 1,599 to 1,769.
Education and Research Wollongong’s education sector is led by UOW, which is a five star university ranked in the top 2% of universities in the world. UOW has a strong and growing research capacity, underpinned by its well established links to business through its Innovation Campus. In 2012 the University attracted more than 22,000 students, including 5,800 overseas students.
Funds Administration Australia has the fourth largest pool of investment fund assets in the world and the largest in Asia. As a result of compulsory superannuation fund contributions, total consolidated funds under management total $A1.4 trillion as at 30th June 2012. This is the fastest growing industry sector in NSW, and Wollongong is playing an important role in this success story. Our city is home to several large funds management organisations including ANZ OnePath, Pillar Administration, GBST and OneWealth.
Health, Aged Care and Community Services The health care sector, including hospitals, medical centres, clinics and aged care facilities, is a
major employment generator in Wollongong. This sector is expected to continue to grow strongly to meet the changing needs of the city and its ageing population, and has further potential growth opportunities given the proximity to Sydney. The sector’s growth is supported by UOW’s Illawarra Health and Medical Research Institute (IHMRI), the Graduate Medical Program, the $186 million expansion of Wollongong’s Public Hospital (a major teaching hospital) and the establishment of a new Wollongong private hospital worth $120 million. Local companies include The IRT Group, Ramsay Health Care, Warrigal Care and INS Health.
Information and Communication Technology UOW’s competencies in research areas such as ICT has seen Wollongong successfully attract development centres for multinational companies such as CSC, Telecommunications Systems Inc, Bond International, GBST, Pactera and tickets.com. Wollongong has many home-grown success stories as well, with UOW graduates establishing ICT businesses, which have achieved global success. These include Oasis Asset Management, which was sold to ING, and InfoComp, which sold to GBST. Other local success stories include iTree, Plaut IT, Evanscorp, Selera, Internetrix and eHiive. UOW has one of the largest university-based ICT research
facilities in Australia, and also has one of the largest ICT undergraduate teaching programs.
Logistics The continued upgrading of the NSW Ports Port Kembla operation is creating opportunities for companies operating in the logistics field. Port related industries such as shipping, stevedoring, warehousing, distribution, support services and repair and maintenance are growing to cater for the port’s expanding trade in vehicles, containers and break-bulk cargoes, as well as its traditional strengths in steel and bulk cargoes such as coal and grain. Companies include WWL, Patrick Autocare, Prixcare Services and AAT.
Mining Technology and Services (MTS) Wollongong has a long and proud history of supplying innovative mining technology and services for the Australian and international resources industry. Products and services developed in the region include coal long-wall mining equipment, hydraulic roof support systems, roof bolting machines and mine planning and evaluation software. Wollongong MTS companies have the proven capacity to undertake all facets of mining projects including design, construction, project management and equipment supply. Companies include Valley Longwall, Nepean Conveyors, Longwall Hydraulics,
Joy Global, Cram Fluid Power and Ringway Control and Automation.
Tourism The tourism sector continues to use the natural and cultural assets of Wollongong to increase visitor numbers and drive employment growth with 943,000 domestic, 56,000 international visitors and 3.7 million day visitors in 2012. Our proximity to Sydney and the international airport gives us the opportunity to further grow our linkages with Asia and to increase the number of business events and conferences to the city which currently injects $10 million annually to the local economy. Major events are also a key driver of visitors to the city and in 2012/13 contributed $22 million. Natural assets include the Illawarra Escarpment, coastal foreshore and Lake Illawarra. Our cultural assets include the Illawarra Performing Arts Centre, Wollongong Entertainment Centre, WIN Stadium, Nan Tien Temple, Wollongong Art Gallery, as well as numerous festivals and events. The iconic Sea Cliff Bridge is a key tourist experience and features prominently in successful marketing campaigns such as the Grand Pacific Drive.
Sea Cliff Bridge

These objectives are further segmented to specific actions over varying timeframes and, importantly, a discussion of ‘what success looks like’.
Wollongong continues to
expand as a place of learning
New industries and
green technologies are established
and flourish.
The profile of
Wollongong, as the regional city of the
Illawarra, is expanded and improved.
The region’s
industry base is diversified.
Local employment
opportunities are increased within a
strong local economy.
KEY FUTURE INDUSTRY DRIVERS ECONOMIC DEVELOPMENT STRATEGY 2013-23
Existing Council plans - Wollongong 2022
The Economic Development Strategy is consistent with the goals and actions outlined in Wollongong 2022. This is our Community Strategic Plan for 2012 to 2022 which outlines the vision for the city and six key community goals of which Goal 2 relates to the local economy.
This goal states that “We have an innovative and sustainable economy”. Sitting beneath this high level community goal are five objectives:22 23
Key objective We will have achieved this when:
1. Local employment opportunities are
increased within a strong local economy.
Cross-sector initiatives are implemented to increase business
investment and jobs growth, particularly for young people.
Wollongong’s CBD continues to expand as the regional centre for
commercial services, health services and other high order services,
retail, entertainment and dining to stimulate and retain local
employment.
Initiatives to retain local talent are developed and implemented.
Innovation through social enterprise and social business
opportunities is encouraged and supported.
Opportunities for training and education for unemployed and
disadvantaged community members in employment growth areas
are pursued.
Major urban growth areas such as West Dapto are managed
effectively to balance employment and population growth.
2. The region’s industry base is diversified.
A coordinated approach to business and investment attraction
results in an increase in the number of new businesses opening in
the Wollongong area.
Working in partnerships with industry and education institutions, an
Enterprise Hub is supported within the city.
Lobbying for necessary infrastructure required to support tourism in
the region and to attract new industries is coordinated.
Organisations work in collaboration to support the development
of innovation industries, including the regional Information
Communication Technology (ICT) sector and creative cultural
industries.
3. The profile of Wollongong, as the
regional city of the Illawarra, is expanded
and improved.
Wollongong’s City Centre is revitalised and active.
Wollongong is promoted as a preferred conference and events
destination, and the place to live, learn, work and visit.
4. New industries and green technologies
are established and flourish.
The development of renewable energy products and services is
supported.
Partnership opportunities in research and development are
expanded.
5. Wollongong continues to expand as a
place of learning.
Wollongong is established as a learning place of excellence.

24 25
KEY FUTURE INDUSTRY DRIVERS ECONOMIC DEVELOPMENT STRATEGY 2013-23
University of Wollongong
UOW is a world-class university with extensive research and development capabilities that is driving Wollongong’s reputation as the City of Innovation. UOW is currently ranked in the top 2% of universities worldwide in the QS World University Rankings. UOW is a research intensive university recognised
internationally for the quality of its performance across a range of diverse areas. UOW’s strategic research priority areas and emerging strengths are the Illawarra Health and Medical Research Institute (IHMRI); the Smart Infrastructure Research Facility (SMART) and Australian Institute for Innovative Materials (AIIM). UOW is a vital part of the Wollongong
economy contributing $2.06 billion in gross economic output, or $607 million in household income and 7,979 full time equivalent jobs to Wollongong. UOW also brings international students into the city, providing local companies with access to students and graduates and through research and collaboration with business.
Approximate Number of Graduating Students in 2012, excluding overseas campuses:
Arts: 560 Commerce: 1250 Creative Arts (including Design): 230 Education: 250 Engineering: 320
Health & Behavioural Sciences: 550 IT/Computer Science: 470 Law/ Legal Studies: 100 Science: 200
Wollongong is one of Australia’s major cities without the associated costs of capital city-based operations. We have great connections both in terms of transport and technology, and an enviable costal lifestyle. Renowned for its world-class steel making and coal mining industries, Australia’s City of Innovation is reinventing itself as an important knowledge services centre, international trade hub and leading university city.
Wollongong has many advantages as a competitive business location:
Strategic Location Our city benefits greatly from its proximity to Sydney with the international airport one hour’s drive away. This gives Wollongong superb connectivity to Australia and the world for both business and tourism. Wollongong is also strategically connected to Canberra.
World-Class University UOW is internationally recognised for its extensive research and development capabilities, which are helping drive Wollongong’s reputation as the City of Innovation. The University has strong links with business and industry and offers opportunities for extensive collaborative research, and well-trained, job-ready graduates.
Skilled Multilingual Workforce Wollongong’s large and experienced workforce has skills ranging from traditional manufacturing to high
technology and knowledge-based industries. There is a large Sydney commuter pool, trained graduates from UOW and TAFE, and a broad mix of foreign language skills to draw upon thanks to the city’s multicultural population.
Competitive Business Costs We are a major city without many of the high costs associated with capital cities like Sydney and Melbourne. Labour, facilities, telecommunications and utilities costs compare favourably to similar sized locations in Australia.
Modern Business Infrastructure Wollongong has a lot to offer. From ultra-modern office spaces at UOW’s Innovation Campus to the state-of the-art import/export infrastructure at NSW Ports Port Kembla operation. Wollongong also has the latest technological infrastructure with the development of a Tier III Data Centre and access to fast speed broadband.
Supportive Business Networks This city has a number of strong business networks including UOW, RDA Illawarra, Illawarra Business Chamber (affiliated with the NSW Business Chamber), Destination Wollongong, the regional offices of the Australian Industry Group and Property Council of Australia, ICTI and i3net, as well as State and Federal Government business agencies including NSW Trade and Investment, AusIndustry, Industry Capability Network and Austrade.
Enviable Coastal Lifestyle With its mild climate and relaxed coastal lifestyle Wollongong is a great place to live and raise a family. People can choose to live in the inner-city, suburbs or semi-rural locations. Everyone can enjoy good shopping, excellent sporting facilities and a spectacular natural environment.
Affordable Living Wollongong offers affordable living, with relatively low housing and journey to work costs.
Quality Public Infrastructure Wollongong has quality education, medical and transport infrastructure. The city’s educational institutions include excellent state and private schools, an internationally recognised university and a TAFE college network. Wollongong has excellent public and private hospitals and a large medical specialist community with close connections to UOW’s Graduate School of Medicine. Wollongong is connected to the Sydney Trains (formerly CityRail) network and free shuttle buses link the CBD with the university, hospital and Innovation Campus.
Section 4
The Wollongong Advantage
Enterprise 1 Building at Innovation Campus

26 27
ICT Illawarra (ICTI)
Within the Illawarra, the ICT sector is predominately comprised of small businesses and a cluster is an ideal way for these businesses to work together without reducing their independence, entrepreneurial spirit or individual competitiveness.
ICTI has been formed to assist with the ongoing growth and competitiveness of the Illawarra’s ICT industry, recognising the potential for the IT sector in the region, based on the success of local companies already performing on the international stage and major international organisations using this region as a base of operations.
www.icti.org.au
THE WOLLONGONG ADVANTAGE ECONOMIC DEVELOPMENT STRATEGY 2013-23
Illawarra Innovative Industry Network (i3net)
i3net is a network of manufacturing and engineering businesses in the Illawarra. The network provides member companies with the opportunity to take part in activities previously out of reach of smaller enterprises including networking, joint marketing initiatives, joint project bids, and information regarding tendering opportunities.
i3net is your gateway to the Illawarra’s vast range of manufacturers, engineering service providers and industrial suppliers.
www.i3net.com.au In order to develop key strategies and actions to promote economic development, it’s important to understand the economic strengths, weaknesses, opportunities and threats facing Wollongong.
■ The ‘Strengths’ in this analysis are the issues that can be used now to promote the benefits of operating a business in Wollongong.
■ The ‘Weaknesses’ in this analysis are the barriers to economic development that Council needs to work towards lowering so they can become ‘strengths’.
■ The ‘Opportunities’ in this analysis are the issues that Council – and other stakeholders - need to act upon in order to realise the potential gains so they become ‘strengths’.
■ The ‘Threats’ in the analysis are the issues that Council needs to be aware of – often external – and to act to minimise the impact
The diagram on the following page represents the SWOT which was produced and endorsed by the EDAB.
Section 5
SWOT Analysis
North Wollongong BeachPublic Forum, Wollongong City Council

28 29Strengths
Natural assets (coal deposits, harbour, beautiful and diverse landscape, agricultural land)
Proximity to Sydney and Canberra (global city, international links, functioning main arterial links)
Lifestyle (access to key services and community services)
Strong education institutions (UOW, TAFE, Innovation Campus researchers)
Port Kembla (its import and export capabilities and direct economic benefits to the region)
People (skilled commuters to Sydney, regional pride, multilingual workforce, integrated multicultural population that welcomes newcomers, solid graduate base, active volunteering culture)
Business support services (professional services, innovative and creative industries, networks)
Affordable and accessible (housing, local road network, land available for residential growth)
Engaged civic leadership (Councils and local State/Federal MPs)
Beaches/foreshore/escarpment (Attracting tourists to Wollongong and providing a higher quality of life for residents)
Major arterial road/rail corridor (Well connected)
Strong industry clusters (Aged care, Mining centre for Excellence, i3net,)
Access to industrial land (Proximity to road networks and port)
Data connectivity (on main Sydney/Canberra link - will further improve with fast speed broadband)
Economic Development ➔ Wollongong
Opportunities
Communication and transport projects ($100 million Port privatisation funds - potential to lower unemployment rate, lower dependency on Sydney for jobs, grow Port Kembla, fast speed broadband opportunities)
Economy in transition (shifting from industrial to service base e.g. ICT, finance, business services, tourism, higher-end manufacturing, education and research, logistics/freight, aged care, mining services)
Planning (regional planning under new planning system, potential future employment lands on old manufacturing sites no longer in use, vision for CBD and precincts within it)
New partnerships (regional based such as south west Sydney, organisational based such as social enterprise and creative businesses or with business organisations)
Fly in fly out (chance to keep families in the region with temporary external employment arrangements - Shellharbour Council already planning around this)
Health (both private and public expansions underway)
Tourism (including business tourism potential and cultural/sporting events)
Nan Tien Temple (expansion into education)
Growing creative industries (growing numbers of professional artists in region)
University (research opportunities plus links to international students)
Threats
Natural assets (degraded by development or vandalism, natural disasters)
Investment outlook (lack of entrepreneurs/incentives, lack of visitors or new businesses)
Economy (too reliant on ‘old’ sectors, loss of key workers, ‘brain drain’, public funding access limited and finite, lack of private sector investor interest)
Image/attitudes (continue to do what has been done in past, apathy, lack of co-ordination, reactive not proactive, competition from surrounding LGAs)
FIFO (poor planning could see the benefits of employment outweighed by high social costs)
Proximity to Sydney (encourages less action in Wollongong)
Weakness
Inward looking (escarpment is physical and mental barrier)
Transport (improvements to road and rail links to Sydney required)
Communications (patchy broadband coverage in certain areas)
Planning and investment (lack of A grade office space, West Dapto has many challenges, lack of community support for high density, small developers can’t access finance, no overall policy vision - too project focused)
Poor external image and awareness (‘steel city’, ‘ICAC hangover’, lack of regional ambassadors, focus on downturn in manufacturing, lack of awareness on Wollongong offer)
High unemployment (youth and unskilled, ‘brain drain’ to Sydney, pockets of great social disadvantage and welfare dependency)
Political situation (safe seats, some sensitive representatives, fragmented, under-resourced community/business organisations)
Housing (pockets of unaffordability, seasonal student demand)
SWOT analysis
SWOT ANALYSIS ECONOMIC DEVELOPMENT STRATEGY 2013-23

30
APPENDIX ECONOMIC DEVELOPMENT STRATEGY 2013-23
There have been a number of reports commissioned by Wollongong City Council and other stakeholders that have looked at economic development issues in Wollongong. Many of these were used in compiling the Economic Development Strategy.
These include:
■ State of Australian Cities Report 2013 (Infrastructure Australia)
■ National Urban Policy 2011 (Infrastructure Australia)
■ Regional and Census data 2011 (Australian Bureau of Statistics)
■ Illawarra Regional Strategy 2007 (NSW Gov)
■ NSW Long Term Transport Master Plan 2012 (NSW Gov)
■ NSW State Infrastructure Strategy 2012 (NSW Gov)
■ Wollongong LEP 2009 (WCC)
■ Wollongong LEP (West Dapto) 2010
■ Wollongong 2022 Community Strategic Plan 2012 (WCC)
■ Delivery Program 2012-17 and Annual Plan 2013-14 (WCC)
■ Advantage Wollongong 2010 (WCC)
■ Wollongong Economic Development Road Map 2003 (WCC)
■ Wollongong City Centre Economic Development Strategy 2005 (WCC)
■ Wollongong Business Attraction Review – Knowledge Services 2012 (KMPG)
■ Illawarra/South Coast Regional Action Plan 2012 (NSW Govt)
■ The Planning Bill 2013 (NSW Govt)
■ RDA Illawarra Plan 2011 (RDA Illawarra)
■ Various Illawarra data reports (IRIS)
■ Reports undertaken by local business groups – IBC, PCA and Ai Group
■ Civic Relations Policy 2013 (WCC)
■ Remplan 2013
■ Leading locally, competing globally: measuring the University of Wollongong’s contribution to economic and social prosperity: Wollongong: University of Wollongong 2013
■ The GPT Group’s Wollongong Central – totally transforming Wollongong City Centre – 2012
■ Fast track Wollongong City revitalisation with NSW Government pre-commitment - 2012
Section 6
Appendix

Wollongong City Council Economic Development Unit
Ph: (02) 4227 7111 Email: [email protected]
www.wollongong.nsw.gov.au


