MARKET ASSESSMENT: Review market data and examine trends to understand what bio-composite products are sold today and where are they sold A paper prepared for CFC/ITTO-USDL By Bintang C. H. Simangunsong Bedyaman Tambunan i
Transcript
MARKET ASSESSMENT: Review market data and examine trends to understand what
bio-composite products are sold today and where are they sold
A paper prepared for CFC/ITTO-USDL
By
Bintang C. H. Simangunsong Bedyaman Tambunan
i
CONTENTS
Page I. Introduction 1 II. Market and Trade of Plywood 3
2.1. World 3 2.2. ITTO Countries 5 2.3. Indonesia 6 2.4. Malaysia 8 2.5. Papua New Guinea 9
III. Market and Trade of Veneer Sheets 10
3.1. World 10 3.2. ITTO Countries 12 3.3. Indonesia 13 3.4. Malaysia 15 3.5. Papua New Guinea 16
IV. Market and Trade of Particleboard 17
4.1. World 17 4.2. ITTO Countries 19 4.3. Indonesia 20 4.4. Malaysia 22 4.5. Papua New Guinea 23
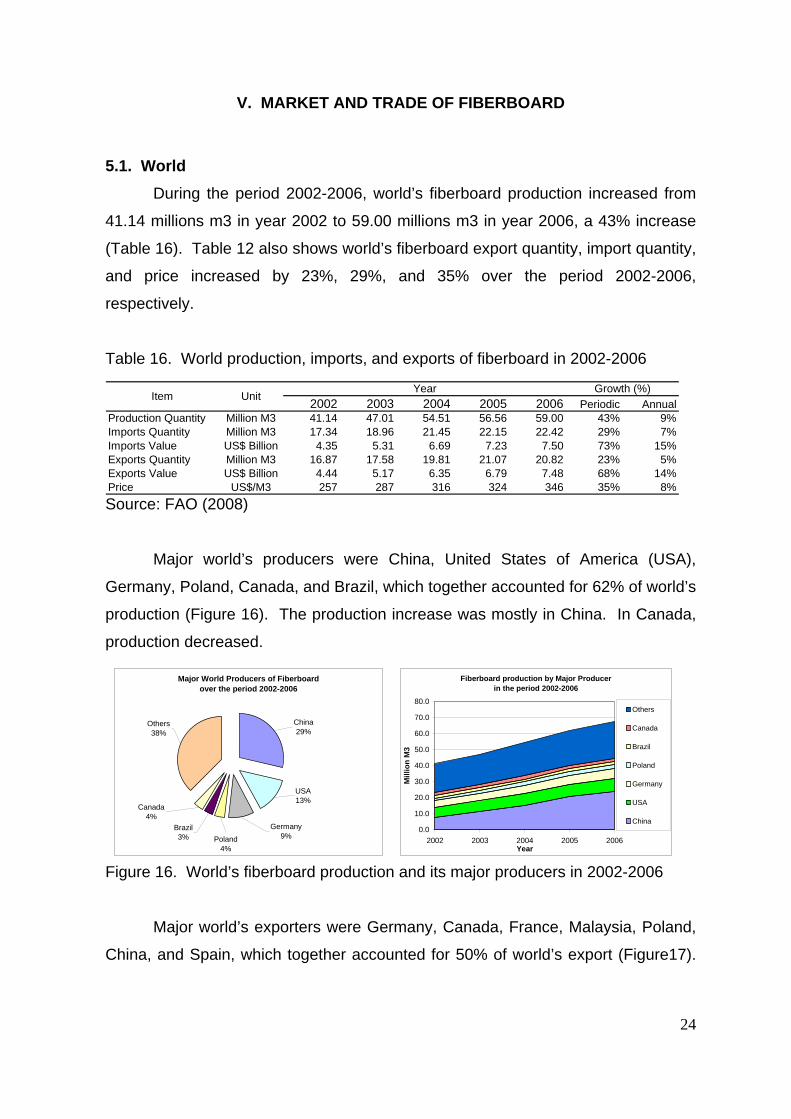
V. Market and Trade of Fibreboard 24
5.1. World 24 5.2. ITTO Countries 26 5.3. Indonesia 27 5.4. Malaysia 28 5.5. Papua New Guinea 29
VI. Summary 30
References 32
i
LIST OF TABLES Page
Table 1. World production, imports, and exports of plywood in 2002-2006 3 Table 2. Production, exports, change, country and regional shares of
plywood in the period 2002-2006 6 Table 3. Production, imports, and exports of Indonesia plywood
in 2003-2007 (MOF 2008a and 2008b) 7 Table 4. Production, imports, and exports of Indonesia plywood
in 2002-2006 (FAO 2008) 7 Table 5. Production, imports, and exports of Malaysia plywood
in 2002-2006 8 Table 6. World production, imports, and exports of veneer sheets
in 2002-2006 10 Table 7. Production, exports, change, country and regional shares of
veneer sheets in the period 2002-2006 13 Table 8. Production, imports, and exports of Indonesia veneer sheets
in 2003-2007 (MOF 2008a and 2008b) 14 Table 9. Production, imports, and exports of Indonesia veneer sheets
in 2002-2006 (FAO 2008) 14 Table 10. Production, imports, and exports of Malaysia veneer sheets
in 2002-2006 16 Table 11. World production, imports, and exports of particleboard
in 2002-2006 17 Table 12. Production, exports, change, country and regional shares of
particleboard in the period 2002-2006 19 Table 13. Production, imports, and exports of Indonesia particleboard
in 2003-2007 (MOF 2008a and 2008b) 20 Table 14. Production, imports, and exports of Indonesia particleboard
in 2002-2006 (FAO 2008) 21 Table 15. Production, imports, and exports of Malaysia particleboard
in 2002-2006 22 Table 16. World production, imports, and exports of fiberboard
in 2002-2006 24
ii
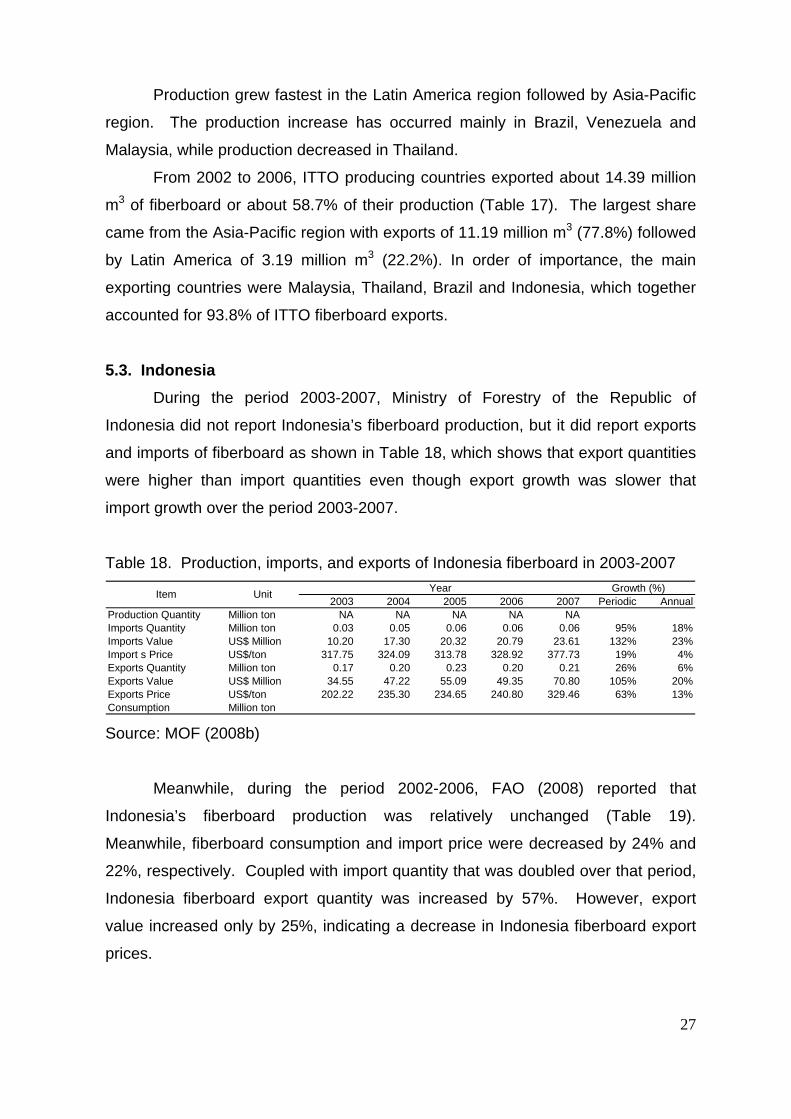
Table 17. Production, exports, change, country and regional
shares of fibreboard in the period 2002-2006 26 Table 18. Production, imports, and exports of Indonesia fiberboard
in 2003-2007 (MOF 2008a and 2008b) 27 Table 19. Production, imports, and exports of Indonesia fiberboard
in 2002-2006 (FAO 2008) 28 Table 20. Production, imports, and exports of Malaysia fiberboard
in 2002-2006 29
iii
LIST OF FIGURES
Page Figure 1. World’s plywood production and its major producers
in 2002-2006 3 Figure 2. World’s plywood export and its major exporters in 2002-2006 4 Figure 3. World’s plywood import and its major importers in 2002-2006 4 Figure 4. Major importers of Indonesia's plywood over
the period 2002-2006 8 Figure 5. Major importers of Malaysia's plywood in 2005 9 Figure 6. World’s veneer sheets production and its major producers
in 2002-2006 10 Figure 7. World’s veneer sheets export and its major exporters
in 2002-2006 11 Figure 8. World’s veneer sheets import and its major importers
in 2002-2006 11 Figure 9. Major importers of Indonesia's veneer sheets
over the period 2002-2006 15 Figure 10. Major importers of Malaysia's veneer sheets in 2005 16 Figure 11. World’s particleboard production and its major producers
in 2002-2006 17 Figure 12. World’s particleboard export and its major exporters
in 2002-2006 18 Figure 13. World’s particleboard import and its major importers
in 2002-2006 18 Figure 14. Major importers of Indonesia's particleboard
over the period 2002-2006 21 Figure 15. Major importers of Malaysia's particleboard in 2005 23 Figure 16. World’s fiberboard production and its major producers
in 2002-2006 24
iv
Page Figure 17. World’s fiberboard export and its major exporters in 2002-2006 25 Figure 18. World’s fiberboard export and its major exporters in 2002-2006 25 Figure 19. Major importers of Indonesia's fiberboard
over the period 2002-2006 28
Figure 20. Major importers of Malaysia's fiberboard in 2005 29
v
I. INTRODUCTION
This paper provides a review and brief analysis of bio-composite products
markets and trade. Bio-composite products defined here are any composite that
contains a blend of wood and other lignocellulosic fiber and polymer to produce a
material that can be processed like wood and has the best features of wood and
plastic. These products can be used in building and construction, interiors,
automobiles, mouldings, garden and outdoor, etc. Initially, engineered wood
products such as glued-laminated timber, laminated veneer lumber and parallel
strand lumber would be included in a review as these products represent emerging
markets for tropical timber. However, due to the lack of data on production and
trade for those products, the review and analysis are focused instead on wood-
composite products such as plywood, veneer sheets, particleboard and fiberboard
in ITTO countries for the period 2002-2006. These are known commodities and
have been proven in the marketplace. The review and analysis for those products
were also conducted for countries such as Indonesia, Malaysia, and Papua New
Guinea.
Comparisons with global totals or totals for ITTO countries for wood-
composite products are based on statistics from the FAOSTAT database, the latest
summary of global forest statistics available. For each product, year and country,
apparent consumption was estimated by production + imports - exports. The data
on production, imports and exports were obtained from the FAOSTAT database
(FAO 2008). Similar data reported in Forest Products Annual Market Review
published by United Nations Economic Commission for Europe (UNECE) and in
Annual Review and Assessment of the World Timber Situation published by ITTO
were also used. In addition, data on production and trade provided by Ministry of
Forestry of Indonesia (MOF) and related agencies such as Central Bureau of
Statistics of Indonesia (BPS) and Indonesia Wood Based Panel Association
(APKINDO) were also used.
There are few data on domestic prices of forest products, and those that are
reported are often export or import prices. For countries that have both
import/export and domestic price, the two are usually highly correlated, as they
should in competitive markets. Therefore, for this study, the unit values of imports
1
or exports were used to build the price index. Quantities and values, in current
United States dollars, of imports and exports have been obtained from the
FAOSTAT database. The nominal price in each country, in current United States
dollars, was estimated as the weighted arithmetic average of the unit value of
imports and exports.
In the case of Indonesia, plywood product includes block board and
laminated veneer lumber and particleboard includes oriented strand board (OSB)
product. Moreover, as Indonesia’s forest products industry facing a wood raw
materials deficit and government policy and industry push for innovation and value
addition to resources, utilization of small-diameter logs from plantations, logging
waste, community forests, and rubber estates by this industry continues to rise.
The review consists of four substantive chapters, which provide an analysis
of production, export, import, consumption, trade and prices for each wood-
composite products: plywood, veneer sheets, particleboard and fiberboard; in
World, ITTO countries, Indonesia, Malaysia, and Papua New Guinea.
2
II. MARKET AND TRADE OF PLYWOOD
2.1. World
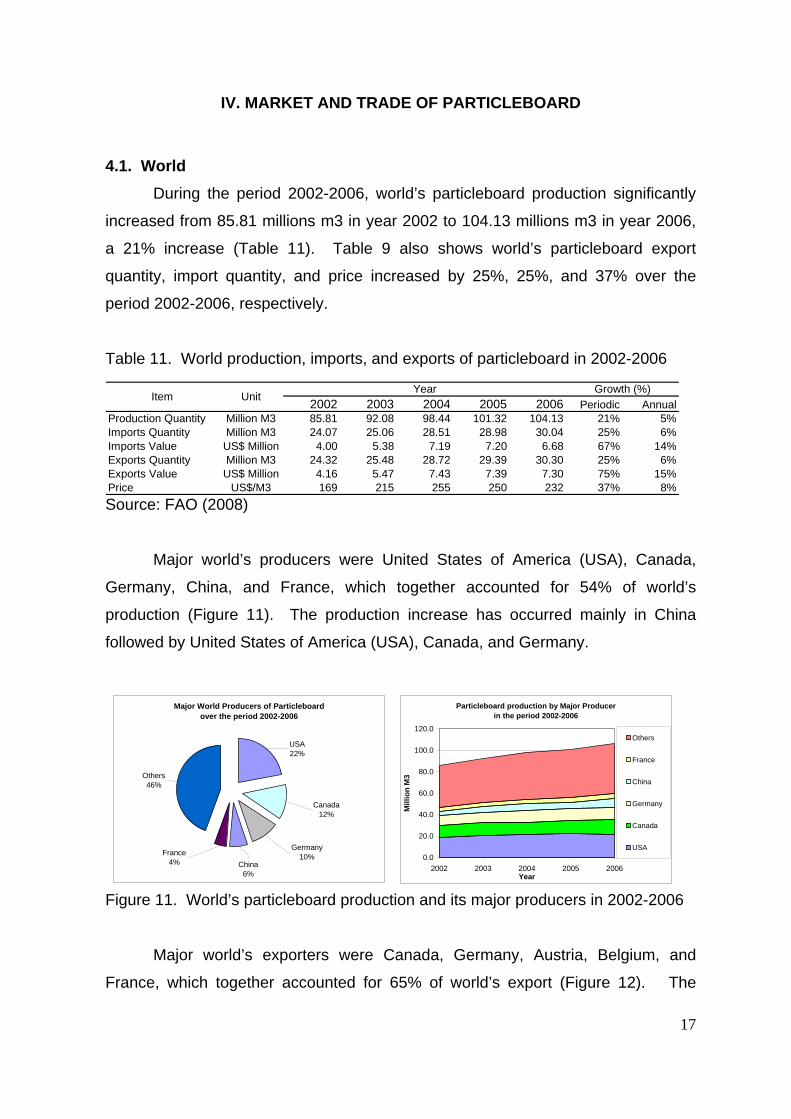
During the period 2002-2006, world’s plywood production increased from
59.25 millions m3 in year 2002 to 68.01 millions m3 in year 2006, a 15% increase
(Table 1). Table 1 also shows world’s plywood export quantity, import quantity, and
price increased by 23%, 21%, and 25% over the period 2002-2006, respectively.
Table 1. World production, imports, and exports of plywood in 2002-2006
2002 2003 2004 2005 2006 Periodic AnnualProduction Quantity Million M3 59.27 68.79 68.66 69.08 68.01 15% 3%Imports Quantity Million M3 20.81 21.80 24.35 24.66 25.08 21% 5%Imports Value US$ Million 7.36 7.88 9.99 10.31 10.83 47% 10%Exports Quantity Million M3 20.75 21.49 24.49 25.35 25.52 23% 5%Exports Value US$ Million 6.69 7.42 9.30 10.23 10.50 57% 12%Price US$/M3 338 354 395 411 421 25% 6%
Item UnitYear Growth (%)
Source: FAO (2008)
Major world’s producers were China, United States of America (USA),
Indonesia, Malaysia, Brazil and Japan, which together accounted for 77% of
world’s production (Figure 1). The production increase has occurred mainly in
China followed by Malaysia, Brazil and Japan. In Indonesia and USA, production
decreased.
Major World Producers of Plywood over the period 2002-2006
Malaysia7%
Indonesia8%
Brazil5%
Japan4%
Others23%
USA21%
China32%
Plywood production by Major Producer in the period 2002-2006
0.0
10.0
20.0
30.0
40.0
50.0
60.0
70.0
80.0
2002 2003 2004 2005 2006Year
Mill
ion
M3
Others
Japan
Brazil
Indonesia
Malaysia
USA
China
Figure 1. World’s plywood production and its major producers in 2002-2006
Major world’s exporters were China, Malaysia, Indonesia, Brazil, and
Russian Federation, which together accounted for 71% of world’s export (Figure 2).
3
The export increase has occurred mainly in China, Malaysia and Russian
Federation, while production decreased in Indonesia.
Figure 2. World’s plywood export and its major exporters in 2002-2006
In order of importance, major world’s importers were United States of
Americ
largest world’s
produc
Major World Exporters of Plywood over the period 2002-2006
China19%
Malaysia18%
Others29%
Russian Federation
6%
Brazil10%
Indonesia18%
Plywood export by Major Exporter in the period 2002-2006
0.0
5.0
10.0
15.0
20.0
25.0
30.0
2002 2003 2004 2005 2006Year
Mill
ion
M3
Others
RussianFederation
Brazil
Indonesia
Malaysia
China
a (USA), Japan, China, United Kingdom, the Republic of Korea, and
Germany, which together accounted for 68% of world’s import (Figure 3). The
import increase has occurred mainly in United States of America (USA) followed by
Germany and United Kingdom. In Japan, import slightly decreased.
Although United States of America and Japan were two of the
ers, which together accounted for 25% of world’s production, they were net
importers, which together accounted for 43% of world’s import.
Figure 3. World’s plywood import and its major importers in 2002-2006
Major World Importers of Plywood over the period 2002-2006
USA22%
Japan21%
Others32%
Germany5%
Korea, Rep.6%
United Kingdom
6%
China8%
Plywood import by Major Importer in the period 2002-2006
0.0
5.0
10.0
15.0
20.0
25.0
30.0
2002 2003 2004 2005 2006Year
Mill
ion
M3
Others
Germany
Korea, Rep.
UnitedKingdomChina
Japan
USA
4
2.2. ITTO Countries Plywood production from ITTO producing countries decreased slightly from
17.53 million m3 in 2002 to 16.31 million m3 in 2006, a decrease of 7.0% (Table 2).
Over this period, about 84.32 million m3 of plywood were produced which
accounted for 25% of the world’s production of plywood. Of this 63.19 million m3
(74.9%) was provided by the Asia-Pacific region, 19.30 million m3 (22.9%) by Latin
America, and 1.83 million m3 (2.2%) by Africa. The largest single producer was
Indonesia, which alone accounted for 31.5% of ITTO producing countries’
production. Other important producers were Malaysia (28.8%), Brazil (20.3%) and
India (11.3%).
Production grew fastest in the Latin America region followed by Africa,
whereas in Asia-Pacific region, production decreased. The production decrease
has occurred mainly in Indonesia. In Malaysia, India and Brazil, production
increased.
From 2002 to 2006, ITTO producing countries exported about 57.42 million
m3 of plywood or about 68.1% of their production (Table 2). The largest share
came from the Asia-Pacific region with exports of 43.55 million m3 (75.8%). Latin
America and Africa exported about 12.63 million m3 (22.0%) and 1.25 million m3
(2.2%), respectively. The main exporting countries were Indonesia and Malaysia,
which together accounted for 74.5% of ITTO plywood exports. Another important,
but smaller exporter was Brazil (20.8%). Although Indonesia was an exporter
country, its exports declined by 2.76 million m3 between 2002 and 2006.
Further, plywood exports decreased as production decreased (Table 2).
This decrease in exports mainly came from Indonesia and Guyana, while in other
countries exports increased. ITTO (2007) reported major tropical plywood
importers in 2006 were Japan, United States of America, The Republic of Korea,
Taiwan and China. A few Western European countries were also important
importers, though smaller.
5
Table 2. Production, exports, change, country and regional shares of plywood in
which only 19 units were producing at normal capacity.
Table 3 also shows plywood export was also drastically decreased during
the period 2003-2007 from 3.31 millions m3 in year 2003 to 1.77 millions m3 in year
003, a 46% decrease. On the other hand, in terms of value, plywood export value
as only decreased by 7%, indicating an increase in Indonesia’s plywood export
price. Meanwhile, despite a sharp increase of import quantity of more than 63
s Quantity Million M3 1.06 1.08 1.09 1.17 1.17 10% 3%ts Value US$ Million 228.12 265.29 244.01 284.67 284.67 25% 6%
ExC
On the other hand, in terms of value, fiberboard export value was increased
by 25%, 2.5 times the increase of export quantity, indicating an increase in
Malaysia’s fiberboard export price. Similar to that export, import quantity increased
by 77%, but import value increased by 149%, indicating an increase in Malaysia’s
fiberboard import price during the period 2002-2006.
FAO (2008) reported in 2005, major importer countries were Japan, United
States of America, The Republic of Korea, China, and United Kingdom, which
together accounted for 81% of Malaysia’s fiberboard exports (Figure 20).
Major importer of Malaysia plywood in 2005
United Kingdom4%
Others19%
China4%
Korea, Republic of
10% United States of America
12%
Japan51%
29
VI. SUMMARY
Plywood production from ITTO producer countries decreased by 7.0% over
the period 2002-2006. Over that period, about 84.32 million m3 of plywood were
produced which accounted for 25% of the world’s production of plywood. The Asia-
Pacific region provided 74.9%, the Latin America region 22.9%, and the Africa
region 2.2%. The largest single producer was Indonesia, which alone accounted
for 31.5% of ITTO producer countries production. Other important producers were
Malaysia (28.8%), Brazil (20.3%) and India (11.3%). Major tropical plywood
importers in 2006 were Japan, United States of America, The Republic of Korea,
Taiwan and China. A few Western European countries were also important
importers, though smaller.
Veneer sheet production from ITTO producer countries increased sharply by
33.6% during the period 2002-2006. Over this period, about 15.78 million m3 of
veneer sheet were produced which accounted for one third of the world’s
production of veneer sheets. Of this 54.3% was provided by the Asia-Pacific
Latin America region, and 21.4% by the Africa region. Main
roducers were Malaysia, Brazil, Indonesia, Ghana, India, the Philippines, and
Côte d
veneer
import
ingle producer was Brazil, which
lone accounted for 59.0% of ITTO production. Other important producers were
Malaysia (8.4%), and Indonesia (6.0%).
O
fiberboard. Of this 53.7% was provided by the Asia-Pacific region, 45.7% by the
region, 24.3% by the
p
'Ivoire, which together accounted for 87.2% of ITTO producer countries
production. Major tropical veneer sheet importers in 2006 were The Republic of
Korea, Taiwan, French, China and Italy. Japan, formerly a major tropical
er, became less significant with imports continuing to decline.
Particleboard production from ITTO producer countries increased slightly
by1.5% during the period 2002-2006. Over this period, about 18.96 million m3 of
particleboard were produced which accounted for 3.9% of the world’s production of
particleboard. The Latin America region provided 69.3%, the Asia-Pacific region
29.4%, and the Africa region 1.3%. The largest s
a
Thailand (14.25),
ver the period 2002-2006, fiberboard production from ITTO producer
countries increased sharply by 39.5%. Over this period, about 24.51 million m3 of
fiberboard were produced which accounted for 9.5% of the world’s production of
30
Latin America region, and 0.6% by the Africa region. The main producers were
Brazil (37.0%), Malaysia (27.7%) and Thailand (14.8%), which together accounted
r 79.5% of ITTO production. Other important producers were Indonesia (8.7%),
fo
Venezuela (5.6%) and India (2.5%).
31
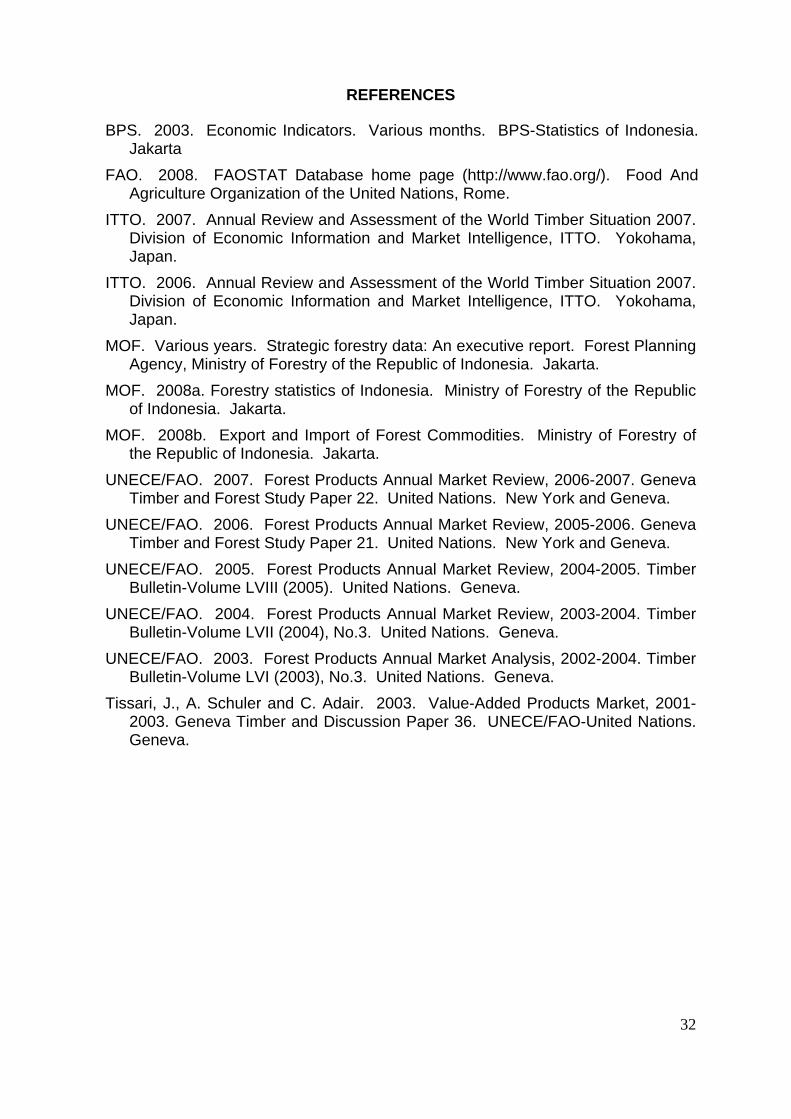
REFERENCES
BPS. 2003. Economic Indicators. Various months. BPS-Statistics of Indonesia. Jakarta
FAO. 2008. FAOSTAT Database home page (http://www.fao.org/). Food And Agriculture Organization of the United Nations, Rome.
ITTO. 2007. Annual Review and Assessment of the World Timber Situation 2007. Division of Economic Information and Market Intelligence, ITTO. Yokohama, Japan.
ITTO. 2006. Annual Review and Assessment of the World Timber Situation 2007. Division of Economic Information and Market Intelligence, ITTO. Yokohama, Japan.
MOF. Various years. Strategic forestry data: An executive report. Forest Planning Agency, Ministry of Forestry of the Republic of Indonesia. Jakarta.
MOF. 2008a. Forestry statistics of Indonesia. Ministry of Forestry of the Republic of Indonesia. Jakarta.
MOF. 2008b. Export and Import of Forest Commodities. Ministry of Forestry of
UNECE/FAO. 2007. Forest Products Annual Market Review, 2006-2007. Geneva Timber and Forest Study Paper 22. United Nations. New York and Geneva.
006. Forest Products Annual Market Review, 2005-2006. Geneva Tim