Market and regulatory incentives for cost efficient integration of DG in the electricity system IMPROGRES project Final Report Frans Nieuwenhout, Jaap Jansen, Adriaan van der Welle (ECN) Luis Olmos, Rafael Cossent, Tomás Gómez (Comillas) Jos Poot, Martijn Bongaerts (Liander) David Trebolle (Union Fenosa) Barbara Doersam (MVV) Stefan Bofinger, Norman Gerhardt (ISET), Henrik Jacobsen, Stephanie Ropenus, Sascha Schröder (Risø DTU) Hans Auer, Lukas Weissensteiner, Wolfgang Prüggler, Carlo Obersteiner, Karl Zach, (EEG) Research Project supported by the European Commission, Directorate-General for Energy and Transport, under the Energy Intelligent Europe (EIE) programme WP 6 Deliverable 7 May 2010
Transcript
Market and regulatory incentives for cost efficient integration of DG in the electricity
system
IMPROGRES project Final Report
Frans Nieuwenhout, Jaap Jansen, Adriaan van der Welle (ECN) Luis Olmos, Rafael Cossent, Tomás Gómez (Comillas)
Jos Poot, Martijn Bongaerts (Liander) David Trebolle (Union Fenosa)
Barbara Doersam (MVV) Stefan Bofinger, Norman Gerhardt (ISET),
Henrik Jacobsen, Stephanie Ropenus, Sascha Schröder (Risø DTU)Hans Auer, Lukas Weissensteiner, Wolfgang Prüggler, Carlo
Obersteiner, Karl Zach, (EEG)
Research Project supported by the European Commission, Directorate-General for Energy and Transport,
under the Energy Intelligent Europe (EIE) programme
WP 6 Deliverable 7 May 2010
IMPROGRES EIE/07/137/SI2.466840 Deliverable D7 Final Report Page 2
Acknowledgement
The IMPROGRES research project is supported by the European Commission, Directorate-General for Energy and Transport, under the Energy Intelligent Europe (EIE) Programme. The contract number for this project is: EISAS/EIE/07/137/2007. The sole responsibility for the content of this document lies with the authors. It does not represent the opinion of the European Commission. The European Commission is not responsible for any use that may be made of the information contained in this report. Project objectives
The IMPROGRES project aims to identify possible improvements in the direction of a socially optimal outcome of market and network integration of distributed generation (DG) and electricity production from renewable energy sources (RES-E) in Europe with a focus on efficient interactions between distribution networks and embedded DG, fossil-based and from renewable energy sources (RES). To that effect the project sets out to: • identify current interactions between DG/RES businesses, distribution system operators (DSOs) and
energy markets directed at coping with increased DG/RES penetration levels; • develop DG/RES-E scenarios for the EU energy future up to 2020 and 2030; • quantify, for selected network operators, the total future network costs that have to be incurred to
accommodate increasing shares of DG/RES according to the DG/RES-E scenarios; • identify cost minimising response alternatives to accommodate increasing penetration levels of
DG/RES for the same network operators, as compared to prevailing conventional DSO practices; • recommend policy responses and regulatory framework improvements that effectively support
improvements towards a socially optimal outcome of integrating DG/RES in European electricity networks and markets.
Project partners
- Energy research Centre of the Netherlands (ECN), The Netherlands (coordinator) - Liander, (previous name: Continuon) The Netherlands - Fraunhofer Institute for Wind Energy and Energy System Technology IWES (previous name:
ISET), Germany - MVV Energie, Germany - Risø National Laboratory for Sustainable Energy, Technical University of Denmark
(Risø DTU), Denmark - Union Fenosa Distribucion, Spain - Universidad Pontificia Comillas, Spain - Vienna University of Technology, Austria For further information:
Frans Nieuwenhout Energy research Centre of the Netherlands (ECN) P.O. Box 1, NL-1755 ZG Petten, The Netherlands Telephone: +31 224 564849, Telefax: +31 224 568338, E-mail: [email protected] Project website: www.improgres.org
IMPROGRES EIE/07/137/SI2.466840 Deliverable D7 Final Report Page 3
CONTENTS LIST OF FIGURES 4
LIST OF TABLES 5
1 ASSESSMENT OF THE INTERACTIONS OF DG SUPPORT MECHANISMS, DSO REGULATION AND BALANCING AND WHOLESALE MARKET MECHANISMS 10
1.1 Introduction 10
1.2 Interactions between the main actors in DG integration 11
1.3 Support mechanisms and network regulation 12
1.3.1 Support mechanisms 12
1.3.2 Network regulation 14
1.4 Power markets 15
1.5 DG integration issues 16
2 SUPPORT SCHEMES AND NETWORK REGULATION IN FIVE COUNTRIES 19
2.1 Denmark 19
2.2 Germany 19
2.3 The Netherlands 20
2.4 Spain 20
2.5 United Kingdom 21
2.6 Summary of the country findings 21
3 SCENARIOS FOR RENEWABLE ENERGY SOURCES 25
3.1 Total RES penetration in the EU-27 Member States 25
3.2 RES Scenarios 2005-2030 26
4 CASE STUDIES OF SYSTEM COSTS OF DISTRIBUTION AREAS 30
5 RESPONSE OPTIONS FOR MINIMISING THE COSTS OF DG INTEGRATION INTO POWER NETWORKS 36
6 RECOMMENDATIONS FOR KEY STAKEHOLDERS 41
6.1 Grid Operators 41
6.2 Regulatory Authorities 42
6.3 DG Developers / Investors / Industry Associations 44
6.4 Policy makers 44
ANNEX A LIST OF REPORTS OF THE IMPROGRES PROJECT 46
REFERENCES 47
IMPROGRES EIE/07/137/SI2.466840 Deliverable D7 Final Report Page 4
LIST OF FIGURES Figure 1.1: Major regulatory interactions of DG, and DSO revenue streams ...................................................................... 11
Figure 1.2: Overview of support schemes (investment and operating support) ................................................................... 14
Figure 2.1: Support schemes and network regulation – transition to more market based mechanisms ............................... 22
Figure 2.2: Historical evolution of support schemes in five country cases .......................................................................... 23
Figure 3.1: Actual penetration of RES-E in 2006 and 2003 versus 2010 target for EU-27 [CEC,2008] ............................. 25
Figure 3.2: RES-Electricity by technology as a share of the total achieved potential in 2006 for the EU .......................... 26
Figure 3.3: GreenNet BAU simulation results including projections until 2030 and conventional CHP updates for electricity generation on European level ........................................................................................................... 27
Figure 3.4: RES and conventional CHP capacity development on disaggregated technology level in Germany from 2005 to 2030 (including projections based on [European commission 2008]) ................................................. 28
Figure 4.1: graphical representation of the incremental distribution costs for the Aranjuez area (Spain). Evolution of these costs (in € per kW installed DG) with the level of penetration of DG for the 2020 storyline. ................. 32
Figure 4.2: Evolution of the impact of DG in the North Holland case study area on total supply costs (in €/kW DG per year) with the DG penetration level (installed DG as percentage of contracted load). Results for 2020 storyline ............................................................................................................................................................. 33
Figure 4.3: Incremental costs per installed kW of DG. Overview ....................................................................................... 34
Figure 5.1: Savings in total distribution network costs after the implementation of advanced response options as compared to a BAU situation [%]. .................................................................................................................... 37
IMPROGRES EIE/07/137/SI2.466840 Deliverable D7 Final Report Page 5
LIST OF TABLES Table 2.1: Network regulation in the five country cases (2007) ........................................................................................ 22
Table 2.2: Country matrix with combinations of network and support scheme regulation ................................................ 24
Table 4.1: Installed capacity of load and DG for each technology. Spanish case [MW] ................................................... 30
Table 4.2: Installed capacity of load and DG for each technology. Dutch case [MW] ...................................................... 31
Table 4.3: Installed capacity of load and DG for each technology. German case [MW] ................................................... 31
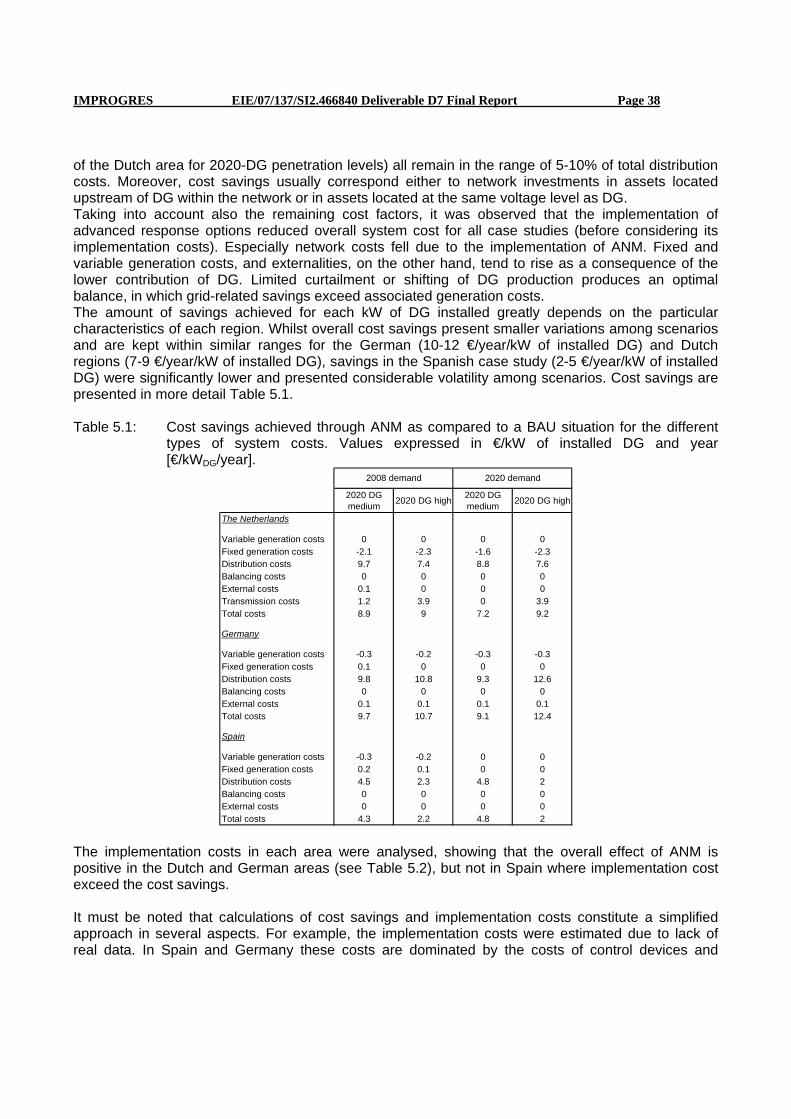
Table 5.1: Cost savings achieved through ANM as compared to a BAU situation for the different types of system costs. Values expressed in €/kW of installed DG and year [€/kWDG/year]. ...................................................... 38
Table 5.2: Summary of average annualised costs and benefits of Active Network Management for the three case study regions (in €/kWDG/year) ......................................................................................................................... 39
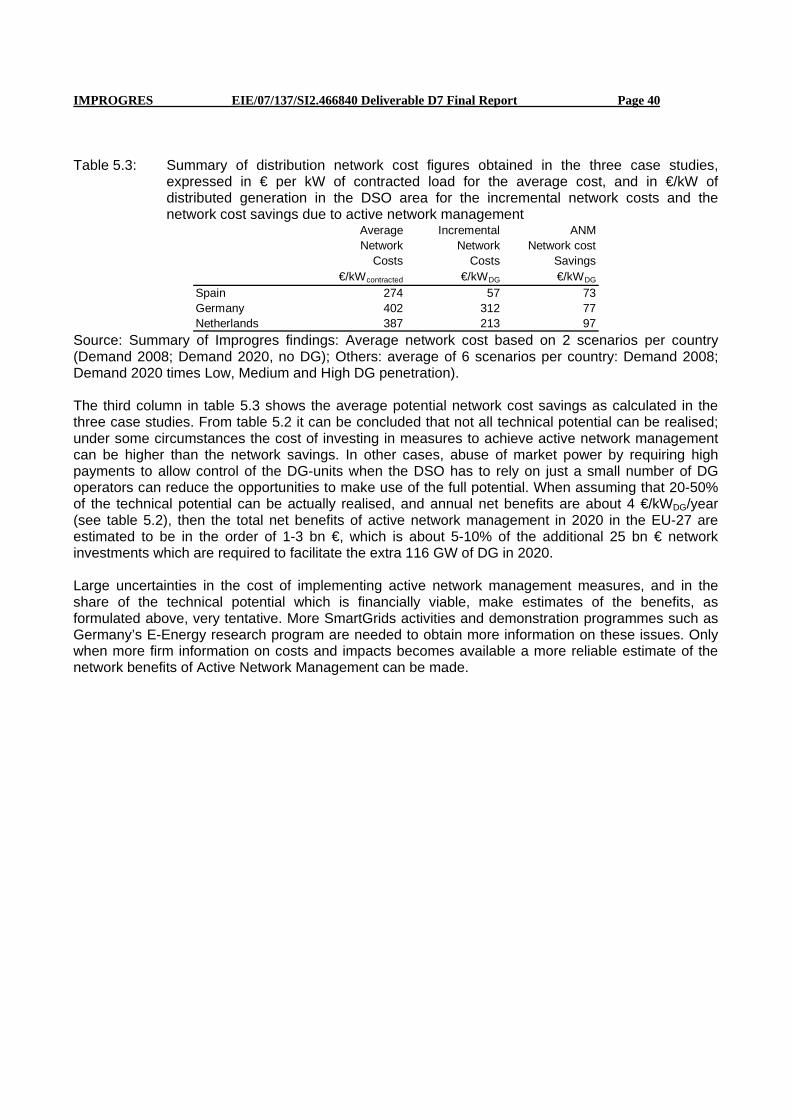
Table 5.3: Summary of distribution network cost figures obtained in the three case studies, expressed in € per kW of contracted load for the average cost, and in €/kW of distributed generation in the DSO area for the incremental network costs and the network cost savings due to active network management.......................... 40
Table A. 1: Reports of the IMPROGRES project ................................................................................................................ 46
IMPROGRES EIE/07/137/SI2.466840 Deliverable D7 Final Report Page 6
EXECUTIVE SUMMARY
Achieving the European target of 20% reduction of greenhouse gases in 2020 relies for a major part on increasing the share of renewable electricity generation, and more efficient fossil fuel based generation in combined heat and power installations. Most of these renewable and CHP generators are smaller in size than conventional power plants and are therefore usually connected to distribution grids instead of transmission grids. Different support schemes for renewable energy sources (RES) have been successfully implemented and have resulted in a rapid growth of distributed generation (DG). IMPROGRES scenario analysis shows that the installed capacity of DG in the EU-25 is expected to increase from 201 GW in 2008 to about 317 GW in 2020. A large part of this increase will be made up of more variable and less controllable renewable energy sources like wind and photovoltaics. The increase of those ‘intermittent’ renewable energy sources does not only change the generation mix, but also influences other sectors of the electricity supply chain, especially markets and networks. There is a recent tendency towards the implementation of more market-based financial support instruments such as the feed-in premiums currently applied in Denmark, the Netherlands and Spain. Such subsidies on top of the electricity prices create an additional incentive for flexible DG units to follow demand patterns by generating electricity when prices are high. This process of market integration stimulates DG to become more responsive to the overall electricity generation and demand situation. While the process of market integration of DG has started, network integration of DG in distribution networks has not yet received sufficient attention. Integration goes beyond merely connecting new DG units, by including whenever possible the potential of DG in improving system operation by reducing network losses or preventing system peaks. Network operators also have to deal with more fluctuating power flows and frequent situations in which electricity production exceeds demand and has to be exported to other regions. These issues are likely to result in barriers for further DG development, if network integration is not improved. The EU-funded IMPROGRES project (Improvement of the Social Optimal Outcome of Market Integration of DG/RES in European Electricity Markets)1 has analysed the impacts of large-scale deployment of distributed generation for the whole electricity supply system. As the viewpoint of society is taken, impacts outside the network are also included. But the primary focus in IMPROGRES has been on the integration of distributed generation in distribution networks. All electricity generation in distribution networks is included as DG. Part of this DG consists of renewable electricity generation (RES), while the non-renewable part mainly consists of Combined Heat and Power (CHP) generation. In order to take due account of the interactions between different electricity system segments, the analysis assesses the impact on the total supply system for three distribution networks in Germany, Spain and the Netherlands, which have a substantial amount of DG and quantitative data available.
1 The IMPROGRES project is supported by the EU in the Altener programme of Intelligent Energy Europe, and was conducted between September 2007 and March 2010. The Energy research Centre of the Netherlands is coordinator of the project, involving the following partners: Liander, (previous name: Continuon) The Netherlands, Fraunhofer Institute for Wind Energy and Energy System Technology IWES (previous name: ISET), Germany, MVV Energie, Germany, Risø National Laboratory for Sustainable Energy, Technical University of Denmark, (Risø DTU), Denmark, Union Fenosa Distribucion, Spain, Universidad Pontificia Comillas, Spain, and Vienna University of Technology, Austria
IMPROGRES EIE/07/137/SI2.466840 Deliverable D7 Final Report Page 7
Support schemes for renewable energy Financial support schemes for RES and efficient CHP remain crucial in the coming decade to achieve the EU 20-20-20 targets. In the initial stages of market penetration of a technology, characterized by low penetration levels, high cost and high risk, support schemes providing high investment security, such as the fixed feed-in tariff, are typically implemented. During the transition more market signals are successively incorporated until a technology reaches the commercial stage and becomes competitive with other technologies in the absence of support. Case studies of system integration In three case studies, detailed cost estimates were made to quantify the impact of rising shares of DG on electricity networks. All electricity generation and loads connected to distribution grids were included, with the exception of offshore wind and large-scale hydro, which are usually directly connected to high-voltage transmission grids. Distribution network costs are driven by a number of factors. Three main factors are the relative level of demand and DG, their spatial overlap, and the network management philosophy applied. If DG makes up a small percentage of the electricity demand, network costs usually increase only modestly. However, with larger shares of DG compared to the load, substantial extra network investments as well as higher losses are usually unavoidable. Local generation, closer to the point of use than in case of large-scale generation, can lead to slightly smaller grid capacity requirements and to somewhat lower electric losses. The level of the distribution network costs is also related to the ‘fit-and-forget’ network planning philosophy, which means that the network itself is prepared for all possible network situations and no active contribution of generation and demand to network operation is expected. When the variability of network flows increases due to intermittent production, passive network management may no longer be the most favourable type of network management. Response options for minimising costs of DG integration in networks The increasing supply from intermittent renewable energy sources adds an additional source of fluctuations to the generation mix, which increases system integration costs, especially distribution network costs. In order to limit the growth of these network costs, Active Network Management (ANM) is often mentioned as a solution. With ANM the operational management is changed; all possible demand and generation situations are no longer resolved in advance through network reinforcements. Part of them are resolved in a smart way (i.e. ‘smart grids’) in the operational time frame by means of ICT (Information and Communication Technologies)-related measures. In this way, bi-directional electricity flows can be controlled by measures such as condition monitoring and fault analysis. Furthermore, connected customers are enabled to contribute to optimal network operation by deploying their flexibility in either generation or consumption. Both aspects of ANM have the potential to reduce peak currents in the grid, thereby providing opportunities for network cost savings due to reductions in network investments and electric losses. In the case studies a cost savings potential was found of about 5-10% of the additional network cost. Extrapolating these findings to the EU-27 would imply network cost savings due to active network management of about € 1-3 billion in the period up to 2020. Regulatory issues for better integration of DG in networks and markets Five key regulatory issues concerning the integration of DG in networks and markets are elaborated below: network cost recovery, network innovation, network planning, network charging and providing incentives for demand response.
IMPROGRES EIE/07/137/SI2.466840 Deliverable D7 Final Report Page 8
a) Network cost recovery Current network regulation does not yet (fully) consider the effects of the energy transition taking place. Regulators often do not allow for network costs caused by the increasing amount of energy produced by DG in the efficiency assessments of DSOs. Consequently, network costs for the integration of DG are not fully recovered by DSOs in areas with large increases of DG.
b) Network innovation Regulation often does not allow for realization of full (long-term) potential benefits of ANM for both markets and networks. The benefits of ANM type of innovations are only partly experienced by DSOs; part of the benefits flow to other parties in the electricity value chain like generators, suppliers and loads. When DSOs experience full costs but not full benefits of investments in ANM, this affects their trade-off between conventional network solutions and ANM. Consequently, in a number of cases they will be inclined/biased to invest in conventional grid solutions instead of ANM. Therefore, some smart grids projects will not be realized although these are preferable for the country as a whole. One exception is the UK, which has introduced the Innovation Funding Incentive (IFI) to allow for recovery of eligible innovative investments.
c) Network planning Proper mid-term planning procedures should be in place to anticipate future flexible and additional load. This should be incorporated in distribution network planning. One fundamental challenge is to find the economic optimum between the necessary costs of network extension and benefits of system flexibility enhancing DG/RES integration measures at DSO level.
d) Network charging When distribution grids are increasingly dominated by the requirements of distributed generators, the remaining grid reinforcement costs can no longer be unambiguously attributed to load only. A future with high penetration rates of both load as well as production calls for allocation of part of the grid reinforcement costs to generation. Consequently, Member State governments and regulators are advised to consider the introduction of use-of-system (UoS) charges for generators. A shallow connection charge approach is recommended as this provides a fair and transparent access treatment for DG investors. The remaining costs for integrating distributed generators in networks are at least partly covered by UoS charges. These Generation UoS charges should be in line with the level of GUoS charges to be introduced at the same time for large conventional generators to balance the impact on the competitive environment of DG producers. This would give generators due financial signals of the network-cost-consequences of their interactions with the public electricity grid. Additionally, time-of-use signals may contribute to lower network peak demand by shifting generation and consumption to times with lower network utilization. This can be relevant in case a sufficient amount of flexible DG is present. For those cases, UoS charges should preferably be made time-dependent. In the longer term, where applicable, DSOs should be incentivised to supplement UoS charges with locational signals. In that way, potential DG investment will face reduced UoS charges at locations where DG investment has a positive network impact and the other way around. For transparency reasons, it is recommended to provide locational signals directly through network charges.
e) Demand response Currently, demand response is nearly non-existent, because very few customers have contracts that include real-time or near real-time price information. In several Member States the roll-out of smart meters among low-voltage customers is ongoing, in order to increase the responsiveness of the demand side of the electricity system. This should be accompanied by sending consumers price
IMPROGRES EIE/07/137/SI2.466840 Deliverable D7 Final Report Page 9
and/or volume signals, because otherwise customers will probably not react. These price signals would constitute differentiated energy prices. Common schemes are time-of-use (TOU) prices, real-time pricing (RTP) or critical peak pricing (CPP). Volume signals are limitations on the consumption of specific loads during a certain time span through, for instance, interruptibility contracts. Additionally, demand response programs ought to be defined and progressively implemented, starting with those customers that already have smart meters. It is important to carefully define the role of each of the agents involved, especially for the retailers. Home automation ought to be developed and promoted to harness the demand response potential to a larger extent. Evidently, the functionalities of the “smart meters” that are being installed should enable endorsement of such applications. Regulatory priorities for meeting the EU-2020 targets A major contribution to the EU objectives towards achieving improved sustainability, security of supply and competitiveness in the energy sector will come from harnessing the potential flexibility in electricity demand and in distributed generation. Regulated network companies have a role in facilitating this process by developing sufficient network capacity, and by establishing advanced metering and communication infrastructure at every grid connection. However, a major part of the benefits of smarter grids are outside the regulated domain, affecting the relation between customers and their energy suppliers or energy services companies. As a consequence, network regulation should give a prominent place to ‘external effects’: cost and benefits outside the network. Developing the infrastructure for smart metering and control of distributed generation and demand response are more likely to lead to financially viable ‘smart grids projects’ when not only viewed from a network cost-benefit perspective, but also including other electricity system benefits. The main regulatory recommendations from the IMPROGRES project are: • Choose for shallow connection charges to lower the barriers for distributed generation and to
simplify connection procedures. • Introduce Generation Use of System charges to provide better incentives for improved network
utilization of distributed generation, and to improve the financial position of those Distribution System Operators (DSOs) with larger shares of distributed generation.
• Introduce more incentives for DSOs, preferably output-based, to internalize in DSO investment decisions the favorable effects of smart grid solutions for other electricity system actors.
• Support the establishment of a smart metering infrastructure as the precondition for further market integration of distributed energy resources.
• Depending on availability of smart meters, flexible network tariffs should be introduced, at least using Time of Use tariffs, and wherever relevant and possible, also locational incentives.
IMPROGRES EIE/07/137/SI2.466840 Deliverable D7 Final Report Page 10
1 ASSESSMENT OF THE INTERACTIONS OF DG SUPPORT MECHANISMS, DSO REGULATION AND BALANCING AND WHOLESALE MARKET MECHANISMS
1.1 Introduction Due to increasing shares of electricity from distributed generation (DG) and renewable energy sources (RES) during the last decades, the interactions between DG operators, distribution system operators (DSOs) and the electricity markets have been changing. In the IMPROGRES project, we define all electricity generation in distribution networks as DG. Part of this DG consists of renewable electricity generation (RES) and the non-renewable part is mainly Combined Heat and Power (CHP) generation. The term DG/RES is used as distributed generation and renewable sources, and is used as a synonym for DG, and thereby stressing the important role of RES.
Electricity production from DG is a key element for the attainment of the three energy policy objectives of the European Union (EU), i.e., sustainability, competitiveness and security of supply. At present, most DG technologies are not economically viable yet and may therefore be entitled to national support schemes. Operational support schemes range from price-based promotion, such as the classic feed-in tariff, to quantity-based support, such as green quotas with tradable green certificate markets. Also, investment support may be applied. The choice and design of support schemes are to the discretion of the individual Member States. The schemes differ in terms of market price exposure, but also in terms of the financial level of support given for the individual technologies across countries. The operations of DG are hence driven by the support mechanism and the electricity market prices (in the case of market-based systems), or by the support mechanism only. At the same time, DG induces costs and benefits for the DSO, which in turn strongly depend on the operations of the DG units. The realization of benefits of DG depends on the provision of the right incentives through network charges. Financial support mechanisms for renewables and network charges should take into account the effects of market prices on the operators of DG, and all three should be arranged in such a way so that they will not conflict, which would result in perverse incentives for DG operators.
This chapter analyses the development of these interactions in Europe in general. In chapter 2 the same issues are treated, but now focusing on five case studies: West Denmark, the Netherlands, Germany, Spain and the United Kingdom. Furthermore, it identifies the existing support schemes in these five regions. In chapter 3 an overview is provided of scenarios for distributed generation and renewable energy sources in Europe up to 2030. Chapter 4 deals with the network and system integration cost of DG in three regional case studies in Germany, The Netherlands and Spain. In chapter 5 different response options are analysed for reducing the cost of integrating DG into distribution networks for these three case study regions. Chapter 6 formulates the regulatory recommendations which could be based on the case studies.
IMPROGRES EIE/07/137/SI2.466840 Deliverable D7 Final Report Page 11
1.2 Interactions between the main actors in DG integration
Figure 1.1: Major regulatory interactions of DG, and DSO revenue streams Figure 1.1 gives an overview of the main interactions between the relevant stakeholders. These are: • The regulator: this term subsumes all relevant governmental authorities issuing relevant legislation
and rules, such as national Energy Ministries and national network regulation agencies. They set the framework for both transmission and distribution system operators, such as the incentive regulation scheme and the allowed rate of return for new investments that can be recovered among the customers. In addition, support schemes are chosen for eligible generation technologies. The design of support schemes – e.g. higher remuneration for meeting certain innovation or availability standards – is crucial when promoting DG.
• The transmission system operator (TSO): responsible for the overall system stability in its area, and subject to regulation. The income stream is generated through Transmission Use-of-System (TUoS) charges. High-voltage customers pay these directly, whereas the majority of customers are connected via distribution networks and pay the charges indirectly.
IMPROGRES EIE/07/137/SI2.466840 Deliverable D7 Final Report Page 12
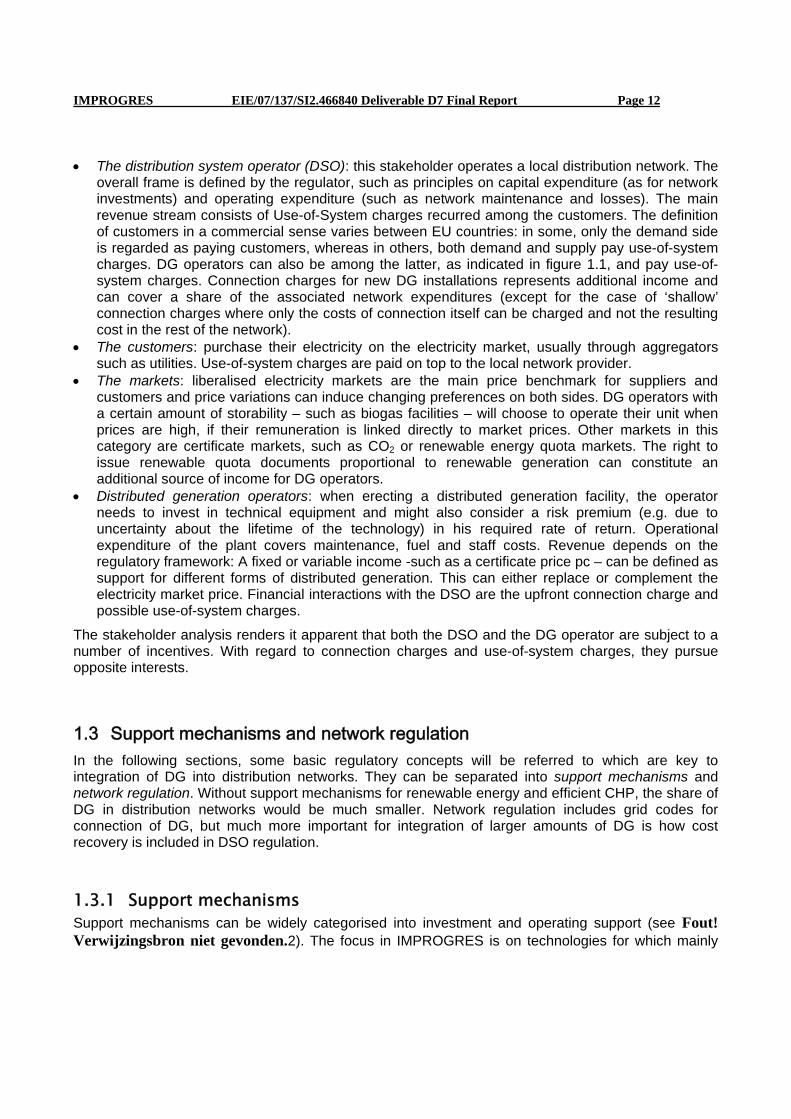
• The distribution system operator (DSO): this stakeholder operates a local distribution network. The overall frame is defined by the regulator, such as principles on capital expenditure (as for network investments) and operating expenditure (such as network maintenance and losses). The main revenue stream consists of Use-of-System charges recurred among the customers. The definition of customers in a commercial sense varies between EU countries: in some, only the demand side is regarded as paying customers, whereas in others, both demand and supply pay use-of-system charges. DG operators can also be among the latter, as indicated in figure 1.1, and pay use-of-system charges. Connection charges for new DG installations represents additional income and can cover a share of the associated network expenditures (except for the case of ‘shallow’ connection charges where only the costs of connection itself can be charged and not the resulting cost in the rest of the network).
• The customers: purchase their electricity on the electricity market, usually through aggregators such as utilities. Use-of-system charges are paid on top to the local network provider.
• The markets: liberalised electricity markets are the main price benchmark for suppliers and customers and price variations can induce changing preferences on both sides. DG operators with a certain amount of storability – such as biogas facilities – will choose to operate their unit when prices are high, if their remuneration is linked directly to market prices. Other markets in this category are certificate markets, such as CO2 or renewable energy quota markets. The right to issue renewable quota documents proportional to renewable generation can constitute an additional source of income for DG operators.
• Distributed generation operators: when erecting a distributed generation facility, the operator needs to invest in technical equipment and might also consider a risk premium (e.g. due to uncertainty about the lifetime of the technology) in his required rate of return. Operational expenditure of the plant covers maintenance, fuel and staff costs. Revenue depends on the regulatory framework: A fixed or variable income -such as a certificate price pc – can be defined as support for different forms of distributed generation. This can either replace or complement the electricity market price. Financial interactions with the DSO are the upfront connection charge and possible use-of-system charges.
The stakeholder analysis renders it apparent that both the DSO and the DG operator are subject to a number of incentives. With regard to connection charges and use-of-system charges, they pursue opposite interests.
1.3 Support mechanisms and network regulation In the following sections, some basic regulatory concepts will be referred to which are key to integration of DG into distribution networks. They can be separated into support mechanisms and network regulation. Without support mechanisms for renewable energy and efficient CHP, the share of DG in distribution networks would be much smaller. Network regulation includes grid codes for connection of DG, but much more important for integration of larger amounts of DG is how cost recovery is included in DSO regulation.
1.3.1 Support mechanisms Support mechanisms can be widely categorised into investment and operating support (see Fout! Verwijzingsbron niet gevonden.2). The focus in IMPROGRES is on technologies for which mainly
IMPROGRES EIE/07/137/SI2.466840 Deliverable D7 Final Report Page 13
operating support schemes are applied. Support mechanisms can be categorised into price- and quantity based schemes as further discussed in the D2 report. Feed-in tariff schemes and price premiums constitute the predominantly applied price-based support instruments in the EU-27. Under a feed-in tariff system, qualified (RES) electricity producers are granted a fixed price per kWh above market rates set by the federal or provincial authorities. This price is guaranteed for a certain period of time, with durations of frequently up to 15 to 20 years. The tariff rates can be differentiated with respect to generation technologies, depending on the latter’s state of maturity and resource conditions in the relevant Member State. This allows for technology- and site-specific promotion. Commonly, generators qualifying for feed-in tariff schemes are simultaneously granted priority access to the grid. One of the key features of feed-in tariff schemes is that they provide a high level of investment certainty (investor confidence) and reduced risk exposure to price volatility on power markets. The effectiveness of feed-in tariffs in promoting RES-E penetration has become evident in terms of the wind capacity evolution in Denmark, Germany and Spain. Price premiums are applied as a market-based variant of the feed-in tariff. Under this type of regime, RES-E generators obtain a premium paid additionally on top of the wholesale market price, often supplemented by a premium for balancing costs. An important difference between the feed-in tariff and the premium payment is that the latter introduces competition between producers on the electricity market. The exposure of generators to the volatility of the wholesale market price provides incentives to adjust output, following variations in demand and supply of power2. The costs for financing feed-in tariff schemes are typically socialized, though this can be done among a different group than network cost socialisation. As an example, German electricity-intensive industry is exempted from contributing to renewable energy support in line with other customer groups. Both feed-in tariffs and premiums are mostly structured to encourage specific technology promotion and to induce future cost-reductions by applying dynamic decreasing tariffs/premiums. Besides the level of the tariff or premium, its guaranteed duration period represents an important parameter for an appraisal of the actual financial incentive. Quantity-based support schemes can be subdivided into tendering systems and quota obligations. In a tendering system, investors and/or producers compete for getting awarded a contract for a (publicly) funded RES project (e.g., support by means of power purchase agreements). Depending on the contract award mechanism, different selection criteria for the judgment of the bids may be applied. Under the lowest-bid-tendering procedure, all participants solely compete for offering the lowest bidding price. In a competitive bidding system, the proposals of RES operators are ranked in increasing order of cost until the amount to be contracted is reached [Menanteau et al. 2003]. Each selected generator obtains a long-term contract to supply electricity at the pay-as-bid price [ibid]. Tender as a procurement mechanism allows differentiating between technologies and renewable energy sources so that there will be only competition between, e.g., wind projects or between biomass projects. A tendering-based support scheme used to be in place in France.
In the last few years several countries (e.g., the United Kingdom) adopted renewable obligations, also called quota obligations, where minimum shares of renewable energy sources in total electricity generation are imposed on consumers, suppliers or producers. Typically, this system is combined with the issuance of tradable green certificates for the amount of kilowatt hours (kWh) of green electricity produced; the green certificates in turn can be traded on a separate financial market. This means that renewable power producers generate income by means of the wholesale electricity price and additionally by means of the green certificate price when they sell their certificates on the certificate 2 Naturally, this necessitates that the RES-E technology does not exhibit natural or technological variability, or is economically storable.
IMPROGRES EIE/07/137/SI2.466840 Deliverable D7 Final Report Page 14
market. In a similar fashion, the instrument of white certificates may be applied to achieve a quantitative target in energy savings. If the imposed obligations are not fulfilled, the producer will have to pay a penalty, which is also set by the government. Various stakeholders (energy producers, traders, suppliers and brokers) have developed ‘the Renewable Energy Certificate Trading System (RECS)’ for Europe for the promotion of a solid policy framework for cross-border trade of renewable energy.
Support Schemes in EU Support Schemes in EU
Investment Support SchemesInvestment Support Schemes Operating Support SchemesOperating Support Schemes
Price-based Support SchemesPrice-based Support Schemes Quantity-based Support SchemesQuantity-based Support Schemes
Feed-In TariffFeed-In Tariff
Feed-In PremiumFeed-In Premium
Quotas with Tradable CertificatesQuotas with Tradable Certificates
Price Reductions on GoodsPrice Reductions on Goods
Tax ExemptionsTax Exemptions
Figure 1.2: Overview of support schemes (investment and operating support)
1.3.2 Network regulation Network regulation consists of several aspects: Economic network regulation determines the income of DSOs which is necessary due to their natural monopoly characteristics. Competition is increasing from rate-of-return regulation (where a predefined rate of return is given on the bound capital) to incentive regulation. In incentive regulation schemes, efficiency incentives are higher under yardstick regulation than under price and revenue cap regulation. Incentive regulation limits the scope for just passing increasing costs to customers. Depending on the design, incentive regulation may allow only a partial cost pass-through of DG integration investments. This may be caused by the aim of regulation to minimise costs; investments are only fully remunerated if they are deemed efficient by the regulator. Other parts of network regulation cover network access and network usage tariffs: these are important for a DG operator to know under which conditions he is allowed to connect to the network and which charges are associated. We distinguish three different kinds of connection charges: shallow, shallowish and deep charges. Shallow charges mean that the DG operator only pays the connection costs to the nearest network point. All further necessary expenses, such as converter stations and grid reinforcements, are borne by the network operators and typically socialized through Use-of-System (UoS) charges. If a deep charging method is applied, the DG operator has to pay for all expenses associated with its grid connection, including upgrades at the transmission level. Shallowish charges are a hybrid between these two concepts: the DG operator pays for the connection to the nearest network point and the proportional use of grid infrastructure reinforcements at the distribution level.
IMPROGRES EIE/07/137/SI2.466840 Deliverable D7 Final Report Page 15
The type of charging methodology is hence crucial for the allocation of variable and upfront costs incurred by the DG operator.
1.4 Power markets Spot markets The basic functioning of power markets is addressed in Deliverable D3 of the IMPROGRES project (see annex A for a full list of IMPROGRES reports). For a DG operator, there are two possibilities of selling power in such markets: 1. Direct bidding at the power exchange 2. Bidding the generation capacity through an aggregator
Case 1 involves the issues that DG operators tend to be small units with variable output. Direct bidding can entail high upfront cost (such as participation fees for trading on the power exchange) and high variable cost because the promised generation cannot always be met. Case 2 adapts the DG sector to the rules of the power market: multiple units are aggregated and thereby achieve access on comparable terms with conventional generation. This applies to physical constraints (bid sizes in MWh) as well as to commercial constraints, such as annual fixed power exchange fees. By contrast, an alternative to facilitate case 1 is to adapt the rules of the power market partially to the need of DG operators: the fee structure of the power exchange can be modified in a way that also smaller actors can use it directly. This means that a package of lower annual fees, but higher variable trading fees is offered. Such a regime might be interesting to a certain number of actors and is therefore generally encouraged. It should be left to the single actors whether they prefer to use this or trade via aggregators, which can also use the DG portfolio for minimising balancing demand. Intraday- and regulating markets These less important parts of the market for an average DG generator in terms of volume could provide additional revenue especially for flexible DG generators. For the majority of DG generators (wind, PV), the variable and uncontrollable characteristics of their generation reduce the potential revenue from this activity. However, the cost element of being ‘balancing responsible’ (paying for regulating their own deviations) make it important that they are allowed to decrease their balancing costs. The interrelation to DSO and distribution grids must be characterised as marginal at present. The scope for DSO managed regional/local balancing markets is limited. Some DG generators are operated on a ‘must-run’ basis, while others are more flexible and their operation can be market-price dependent. Some DG operators have to pay balancing costs are able to reduce these by participating in balancing markets, which would induce them to reduce their output at times of expected excess aggregate output (sell less at the spot market at the low prices) and reduce their export to the DSO grid in these hours. For dimensioning to peak output, this might reduce costs for the DSO relative to a situation where there is no participation in regulating markets. Gate-closure time The time period between settling of spot markets (day-ahead and intra-day or adjustment markets) and the actual delivery hour is called the gate-closure time. This duration (often from 1-24 hours) is important for DG generators that are non-dispatchable and have to pay for balancing. The closer that spot settling is to actual delivery the smaller is the average deviation of scheduled from actual
IMPROGRES EIE/07/137/SI2.466840 Deliverable D7 Final Report Page 16
production and the smaller the balancing cost. However, the same could be achieved by allowing the DG generator to participate in intraday and regulating markets (for a more thorough investigation of this option: see the RESPOND project: http://www.respond-project.eu/ ). In general, the relation between DSO and DG is not much affected by reduced gate closure time but a DG generator that is balance responsible and not allowed to trade in balancing markets could benefit from reduced balancing costs.
1.5 DG integration issues Integration of DG and DSO operations Vertical integration between network operators, in particular DSOs, and DG influences the incentives of market actors in different directions. The level of integration between DSOs and DG is subject to the unbundling requirements by the EU. Four levels of unbundling can be distinguished: ownership unbundling, legal unbundling, functional unbundling, and unbundling of accounts. Legal and functional unbundling are mandatory for all DSOs, but Member States can apply an exception rule for small DSOs. Regulation on provisions governing the unbundling of DSOs has to balance the danger of a vertically integrated DSO exercising local market power (e.g., aggravation of network access for competitors in a rural network) against the financial and operational burden unbundling imposes on small DSOs that have to compete with large-scale generators in the European electricity market. Network regulation The regulation and level of network charges determine the access conditions of DG generators; this applies in particular to third party access for generators not owning and operating networks themselves. Network charges can be differentiated with respect to connection charges to be paid for obtaining the initial connection to the network, and Use-of-System (UoS) charges for transporting electricity through networks.
Connection charges can be separated according to DG cost participation: from shallow do deep charges. UoS charges are variable and applied per transmitted kilowatt-hour. However, charging methodologies and liable groups (consumers only or consumers and generators) depend on national legislation. The income of TSOs and DSOs consists of the sum of all network charges and can itself be subject to an overall cap to incentivise the DSO to operate cost-effectively. Results of the project expert survey show that a multitude of different network regulation approaches – economic network regulation as well as connection and use-of-system charges – are followed in practice. Shallow connection charges with no generator UoS charges are optimal to foster a fast growth of DG units, but neglect potential integration costs for DSOs.
Market participation of DG DG operators can access power markets either by making single units participate directly or by aggregating several units to a portfolio which matches the usual criteria for market participation. The incentive to participate in power markets depends on the kind of operating support: under price premiums and quota schemes, DG operators market their electricity themselves. However, special rules for small generators – e.g., lower fixed annual energy exchange fees – can facilitate integration. Such special fees are implemented in the Nordic and German energy exchanges.
IMPROGRES EIE/07/137/SI2.466840 Deliverable D7 Final Report Page 17
Active network management A crucial factor for active network management by the DSO is whether it is informed about the DG generation schedule. This information is necessary for planning actions of activating demand response or adjusting generation schedules including the optimisation of local storage options. In the planning perspective, active management includes also investment planning so as to balance the benefits and costs of expected DG investments. Participation in ancillary services
Ancillary services comprise a wide field of necessary network services, such as the provision of frequency control, voltage control, black-start capability, island operation, solution of network constraints and organising balancing mechanisms. DSOs do not operate any ancillary service markets until now, but participation by DG in regulating markets is possible in most countries. Minimum capacity requirements are a hindrance for DG market entrance. Most local voltage problems could be solved through active cooperation of DG in voltage control services. A pro-active DSO would then take over part of the responsibilities for system stability from the TSO and can thus extend its responsibilities.
Allocation of costs arising from DG integration The costs a DSO faces due to DG integration, if fully acknowledged in network regulation, are generally recovered either through deep connection charges or through the combination of shallowish connection charges and UoS charges. The level and kind of costs depend highly on the penetration and local conditions. Generally, none of the survey countries considers compensation payments for DG due to advantages DSOs have because of these units. The impact of network costs, losses and quality of service is not taken into account in the Netherlands and Spain. In Denmark, necessary new investments due to DG lead to a higher revenue cap, whereas network losses and the impact on quality of service are not considered. The UK regulatory regime regards DG as an explicit cost factor and, additionally, allows a higher revenue cap due to innovation activities and registered power zones (where a more active network management approach can be followed). Planning of grid expansion with regard to DG In order for DG to be able to deter or delay possible future network investments, it is necessary for the DSOs to make sure that DG will be producing/not producing when it is required by the system. Thus, some level of controllability of the output of DG by DSOs is necessary. DSOs in most countries do not consider the possibility of avoiding network reinforcements because of the presence of DG. DSOs in Denmark and the UK can sign contracts with DG generators. This allows the former to partially control the output of the latter. Regulation in other countries does not consider this possibility. In the UK, DSOs are encouraged to take DG into account in the planning process. Impact of DG integration on the quality of supply Allowed DSO revenues in most of the countries assessed explicitly depend on achieved levels of transport quality. DG units can have positive or negative effects on these quality aspects, which also depends on network operation. If part of the potential benefits brought about by DG in terms of quality of service were reflected in DSOs’ revenues, the latter would consider the possibility of connecting more DG and interacting with it in order to reduce supply interruptions. Implementing DG controllability and realizing the potential for increase in quality of service would probably require the use of active network management techniques, such as balancing control capabilities, in situations where transmission grids are disconnected or in black start situation. DG could also keep part of the benefits caused by their contribution to quality of service levels for themselves.
IMPROGRES EIE/07/137/SI2.466840 Deliverable D7 Final Report Page 18
Incentives for innovation In general, innovation, often related to ‘smart grids concepts’ is expected to support the development of a conventional, “passive” DSO to an “active” DSO considerably. This would benefit DG integration. Innovation incentives could be associated with the reduction of grid expansion and operation costs (network costs and energy losses) and the increase of service quality levels. Since the investments in R&D and innovative activities are risky, the regulator should allow cost recovery through the revenue cap regulation or provide financial support in the first stages of the innovation process until the benefits resulting from the introduction of these innovations become clear. Economic impacts of DG integration on power markets The power market is divided into several submarkets according to the time to delivery. Large amounts of fluctuating generation with low marginal costs have a strong impact on spot market prices. Intraday spot markets are a means of correcting the day-ahead plans without having to use the regulating power market. It can generally be assumed that higher DG penetration leads to a higher usage of these markets because market participants want to correct forecast errors without having to use the more expensive regulating markets. In a geographically small market, such forecast errors will show a high correlation among all units of a generation technology and have a uniform impact on market prices.
Regulating power is traditionally supplied by hydro storage and large power plants and organized centrally by the respective TSO. DG is usually most suited to participate in minute and secondary regulating power markets as these are rather short-term based. In most cases, this requires grouping them to virtual power plants and controlling them with necessary communication infrastructure. Participation in primary regulating power markets is even under such conditions hardly achievable because the offered capacity has to be available during the whole period.
It seems that concerns about market power decrease strongly when the capacity bid into the market is divided between as many actors as possible. If DG capacities are not marketed through the trading divisions of large vertically integrated companies, they can help to mitigate market power.
IMPROGRES EIE/07/137/SI2.466840 Deliverable D7 Final Report Page 19
2 SUPPORT SCHEMES AND NETWORK REGULATION IN FIVE COUNTRIES
2.1 Denmark Denmark politically fostered the development and diffusion of wind and CHP units after the oil crises. Thus, the share of DG increased from 1% in 1980 to 35% in 2001. These 35% are composed of distributed CHP, onshore wind turbines and industrial CHP. The very early wind farm development was mainly financed by local wind turbine associations who had a guaranteed feed-in tariff income. The wide diffusion of CHP technology was mainly due to a legal requirement that all gas-fired power plants had to be converted to CHP during the 1990s and the remaining district heating plants use biomass (as far as possible). Both construction and operation of these plants were subsidised, the latter by means of a fixed feed-in tariff with three time-dependent steps. From 2008 onwards, the support for onshore wind and biomass is a pure price premium. However, the controllable CHP generation is fully exposed to price fluctuations since 2005 to give an incentive to adapt to market conditions. With the increasing size of wind farms, the investor structure turned from private persons to institutions. Nowadays, the Nordic energy exchange Nord Pool offers a special trading regime for small direct participants to facilitate market integration. There are over 100 DSOs in Denmark. All of them are legally unbundled and subject to a revenue cap incentive regulation whose implementation since 2000 showed some problems. DG have to pay shallow connection charges, but most of the existing capacity is exempt from paying generator Use-of-System charges.
2.2 Germany In Germany, the operation support scheme for DG has traditionally been a feed-in tariff (FIT). Until the end of 2008, the Renewable Energy Sources Act of 2004 (EEG 2004) and the Combined Heat and Power Generation Act (KWKG - Kraft-Wärme-Kopplungsgesetz) of 2002 were valid. From 2009 onwards, the FIT of RES have been adapted; main changes constitute a remarkably higher degression for solar energy and higher rates for geothermal and wind power. The KWKG was extended to include also units over 2 MW. EU regulations have been adopted with the Energiewirtschaftsgesetz (EnWG, 1998) and its update in 2005. In general, network charges have to be approved by the Federal Network Agency. Only real costs arising from a distinct network structure can be charged. DG units pay shallow connection charges. Use-of-system charges are paid by end consumers only. In current network regulation, there are no provisions that aim at compensating DG-E operators for their possible positive impact on DSO network operations, for example with respect to network losses. However, negative impacts, especially occurring in the transmission grids, are also not penalized. Until now, RES has not participated in the energy markets because they can receive larger revenues from the FIT. The new FIT valid from 2009 onwards provides an option for a temporary opt-out of the FIT, which is why spot market integration is expected to increase. With respect to congestion management, CHP units do not contribute as their FIT does not provide an incentive for time-dependent generation. In hours with extremely high wind penetration, wind farms can be curtailed to ensure grid stability.
IMPROGRES EIE/07/137/SI2.466840 Deliverable D7 Final Report Page 20
2.3 The Netherlands The predominant support mechanism for renewable electricity and renewable gas is a feed-in premium on top of the market price. According to a recent revision the premium is no longer a fixed amount per kWh over the project lifetime but rather it is varying with the electricity revenues. The original support scheme started in 2003 and has been suspended since august 2006. Since April 2008 it has been reopened again. Before the year 2000, CHP was supported through priority access, a fixed feed-in tariff and a number of tax measures. From 2000-2005, besides the tax support for new investments, production support was provided in the form of a feed-in premium. Annually, the feed-in premium level was determined based on forward market prices for gas and electricity. Due to the rise in electricity prices after 2005, the feed-in premium for CHP was set at zero level. The Netherlands implemented performance-based network regulation in 1998. After the first price control period from 2001-2003, a price cap based on yardsticking was implemented and comprises quality-of-service incentives. In general, different DSOs can experience different cost structures due to differential geographical integration of DG-E units in their networks. Until now, this is not something that is taken into account in the benchmarking procedure. Connection charges are shallow and regulated for units below 10 MVA, and are shallow and negotiated between parties for units above 10 MVA. The regulated connection charges are differentiated over voltage levels and are usually distance dependent (i.e. distance between the existing network and the unit to be connected). Next to connection charges there are also use of system charges. Only consumers pay a use of system charge. DG units participate to a certain extent directly in energy markets, particularly horticulture and industrial CHP units. Wind energy is commonly marketed in a portfolio with other generation technologies. Due to the strong growth of CHP in some parts of the country, congestion management became necessary. For example, one DSO has established a regional market for down-regulation.
2.4 Spain Spain first introduced a FIT (both energy and capacity components) in 1994. In the year 1998, once the general law of the electric sector had been approved, the previous scheme was replaced by another FIT scheme where the level of the tariff was dependent on the average market energy price. In 2004, a hybrid system of FITs and premiums (both dependent on the average electricity tariff) was applied for the first time. According to regulation, premiums applied were the result of adding up a premium, properly speaking, and extra incentives. Finally, in 2007 this hybrid system was replaced by another one where FITs and premiums no longer depended on the average tariff. In this system, cap and floor values were introduced for the price earned by RES units. DSOs are remunerated according to a revenue cap approach based on four year regulatory periods. The revenue cap formula includes specific terms regarding energy losses and continuity of supply (based on number and duration of interruptions). Penalties exist in case of non-compliance with power quality standards. Incremental costs related to the connection and operation of DG in distribution networks should be recognized in the DSO’s allowed revenues. At the moment, intermittent energy sources are not able to participate in the Spanish secondary reserve market. Wind promoters are investigating possibilities for wind farms to provide load following services. From a technical point of view it is feasible in the near future, but actual premiums over
IMPROGRES EIE/07/137/SI2.466840 Deliverable D7 Final Report Page 21
market price do not encourage wind farms to reserve part of their generation capacity to offer as regulating capacity in the secondary reserve market [Lobato et al, 2009]. DG pay deep distribution connection charges in Spain, i.e. DG has to pay for any equipment and network reinforcement that is required to meet the technical conditions. The amount of these connection charges is calculated by the corresponding DSO. The rules for this calculation are not simple or transparent, thus discriminatory treatment may arise. DG does not pay UoS charges. As long as UoS charges for DG are not implemented, main network reinforcement costs are socialized among consumers.
2.5 United Kingdom The first support scheme for DG was the Non-Fossil Fuel Obligation (NFFO). It was announced in 1990 as a mechanism that would award competitive orders for building nuclear or renewable based electricity generating capacity [Mitchell, 2000]. The NFFO system can be qualified as a combination of an obligation and a tendering system. Different NFFO projects competed against each other (within technology categories) for an NFFO award, with the lowest bid winning the award guaranteeing a certain premium price for electricity. The Renewables Obligation (RO) was introduced in April 2002 and requires energy suppliers to source an annually increasing percentage of their sales from renewable sources. The generators of renewable electricity receive a Renewables Obligation Certificate (ROC) per produced MWh (irrespective of time or voltage level to which the generating unit is connected) that is tradable between suppliers but only valid in one period. British DSOs are regulated with a revenue cap incentive scheme since 1990. UK regulatory authorities have implemented explicit incentive schemes for DSOs to encourage innovation regarding DG connection issues. These schemes are the Innovation Funding Incentive (IFI) and the Registered Power Zones (RPZ). The IFI is a mechanism to encourage DNOs to invest in appropriate R&D activities that focus on the technical aspects of network design, operation and maintenance. The RPZ is an initiative which provides a financial incentive to distribution companies to develop and implement innovative projects connecting distributed generation to networks where this may not have otherwise been economically feasible. These schemes are brought into the price control mechanism as a cost-plus adder: for specific new DG capacity connected to the network the operating DSO is allowed to receive an additional charge under the price control. At distribution level, DSO and DG have bilateral connection agreement which allows DG to be curtailed for a relatively short period of time if it leads to significant saving in the cost of upgrading the network to facilitate the connection [Lobato et al., 2009]. This approach can be described as a bilateral market-based congestion management approach. DSOs negotiate with distributed electricity suppliers on the fair charge to be applied. The connection charge methodology is categorized as shallowish. DG do not pay Use-of-System charges for the transmission grid, but only for the distribution grid.
2.6 Summary of the country findings The regulatory provisions applied by the Member States affect the incentives of market actors, here in particular of the DG operator and of the DSO. In general, there is a tendency among Member States in the field of network regulation of migrating from the traditional cost-of-service (COS)/rate-of-return (ROR) regulation to more incentive-based schemes, such as price/revenue cap or eventually yardstick. This incentivises DSOs to decrease their network cost and increase their efficiency since,
IMPROGRES EIE/07/137/SI2.466840 Deliverable D7 Final Report Page 22
under incentive regulation, the difference between cost and allowed revenue accrues to them as profit. A summary of the main characteristics of network regulation in the five country cases is shown in table 2.1.
Table 2.1: Network regulation in the five country cases (2007)
Network Regulation
Connection charges
Application of use of system charges for
generators Denmark
Revenue cap
Shallow
No, not for most existing DG; new wind and CHP installations can be affected.
Germany
Rate-of-Return
Shallow
No, only end consumers pay UoS charges.
Netherlands
Yardstick
Shallow No, only end consumers pay UoS charges.
Spain
Distribution: Revenue cap3
Deep
No, only end consumers pay UoS charges.
United Kingdom
Revenue cap
Shallowish
Yes, DG does not pay TUoS charges; large scale power generation does not pay DUoS charges4.
SUPPORT SCHEMES
NETWORK REGULATION
Feed-In Tariff Price Premium Green Quota
COS/ROR Price/Revenue Cap Yardstick
Figure 2.1: Support schemes and network regulation – transition to more market based
mechanisms
3 Transmission: Cost of service 4 In transmission, generation pays shallow connection charges.
IMPROGRES EIE/07/137/SI2.466840 Deliverable D7 Final Report Page 23
As for predominant support schemes in the individual case study countries, Figure 2.1 depicts the transition to more market-based mechanisms from the traditional feed-in tariff scheme to the price premium and, finally, to the green quota with tradable green certificates. In the initial phases of market penetration of a technology characterized by low penetration levels, high cost and high risk, support schemes providing high investment security, such as the fixed feed-in tariff, are typically applied. Along the transition, more market signals are successively incorporated until a technology reaches the commercial phase and becomes competitive to other technologies in the absence of support. This transition in the evolution of predominant support schemes is also reflected by the application of support in the five country cases, as depicted by Figure 2.2. In Denmark, the Netherlands and Spain, the promotion schemes move from the classic feed-in tariff scheme (lower left-hand corner) to more market-oriented price premiums over the years. Only the United Kingdom has applied tendering and quota schemes since 1990 (which are subsumed as quota schemes in this case). Note that the figure merely displays the support instruments, but does not refer to their efficacy or efficiency for the promotion of DG.
Figure 2.2: Historical evolution of support schemes in five country cases
Combining the dimensions of network regulation regime, connection charging methodology and predominant support scheme, it can easily be seen that a variety of combinations of regulatory regimes is applied as the country matrix presented in the table 2.2 below.
IMPROGRES EIE/07/137/SI2.466840 Deliverable D7 Final Report Page 24
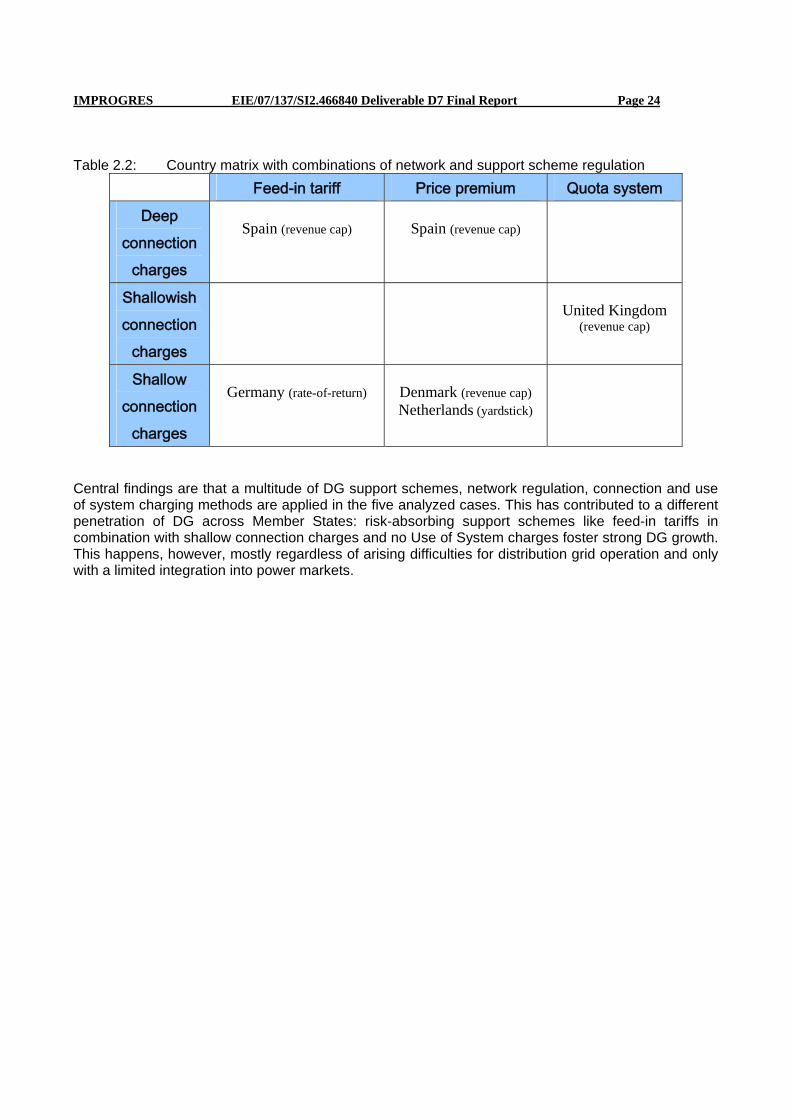
Table 2.2: Country matrix with combinations of network and support scheme regulation Feed-in tariff Price premium Quota system
Deep connection
charges
Spain (revenue cap)
Spain (revenue cap)
Shallowish connection
charges
United Kingdom
(revenue cap)
Shallow connection
charges
Germany (rate-of-return)
Denmark (revenue cap) Netherlands (yardstick)
Central findings are that a multitude of DG support schemes, network regulation, connection and use of system charging methods are applied in the five analyzed cases. This has contributed to a different penetration of DG across Member States: risk-absorbing support schemes like feed-in tariffs in combination with shallow connection charges and no Use of System charges foster strong DG growth. This happens, however, mostly regardless of arising difficulties for distribution grid operation and only with a limited integration into power markets.
IMPROGRES EIE/07/137/SI2.466840 Deliverable D7 Final Report Page 25
3 SCENARIOS FOR RENEWABLE ENERGY SOURCES
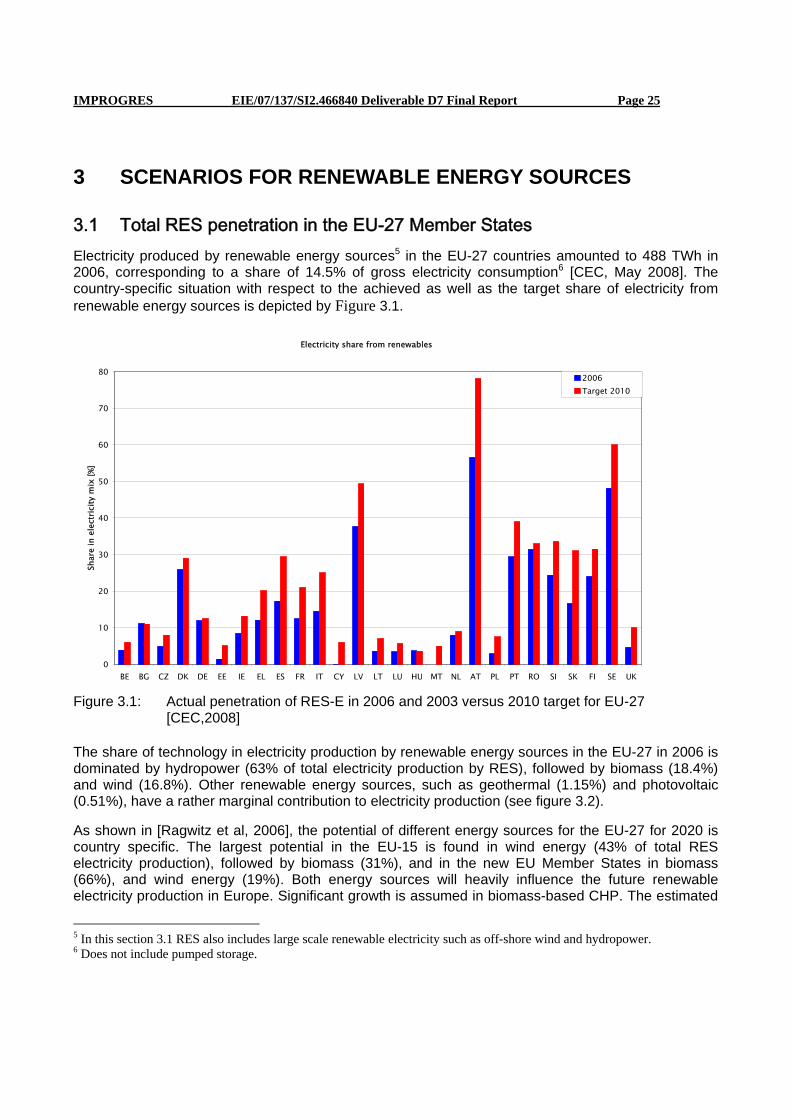
3.1 Total RES penetration in the EU-27 Member States Electricity produced by renewable energy sources5 in the EU-27 countries amounted to 488 TWh in 2006, corresponding to a share of 14.5% of gross electricity consumption6 [CEC, May 2008]. The country-specific situation with respect to the achieved as well as the target share of electricity from renewable energy sources is depicted by Figure 3.1.
Electricity share from renewables
0
10
20
30
40
50
60
70
80
BE BG CZ DK DE EE IE EL ES FR IT CY LV LT LU HU MT NL AT PL PT RO SI SK FI SE UK
Shar
e in
ele
ctri
city
mix
[%]
2006Target 2010
Figure 3.1: Actual penetration of RES-E in 2006 and 2003 versus 2010 target for EU-27
[CEC,2008] The share of technology in electricity production by renewable energy sources in the EU-27 in 2006 is dominated by hydropower (63% of total electricity production by RES), followed by biomass (18.4%) and wind (16.8%). Other renewable energy sources, such as geothermal (1.15%) and photovoltaic (0.51%), have a rather marginal contribution to electricity production (see figure 3.2).
As shown in [Ragwitz et al, 2006], the potential of different energy sources for the EU-27 for 2020 is country specific. The largest potential in the EU-15 is found in wind energy (43% of total RES electricity production), followed by biomass (31%), and in the new EU Member States in biomass (66%), and wind energy (19%). Both energy sources will heavily influence the future renewable electricity production in Europe. Significant growth is assumed in biomass-based CHP. The estimated
5 In this section 3.1 RES also includes large scale renewable electricity such as off-shore wind and hydropower. 6 Does not include pumped storage.
IMPROGRES EIE/07/137/SI2.466840 Deliverable D7 Final Report Page 26
maximum potential for the installed capacity of biomass CHP in the EU-27 is up to 42 GWel by 2020 and 52 GWel by 2030, where biomass CHP installations approximately represent two thirds of the total installed capacities of biomass based power plants [CEC, 2007]. Although the potential in photovoltaic is assumed to be at around 3% in 2020, this is a market with high growth rates.
0%
10%
20%
30%
40%
50%
60%
70%
80%
90%
100%
BE BG CZ DK DE EE IE EL ES FR IT CY LV LT LU HU MT NL AT PL PT RO SI SK FI SE UK
Shar
e of
tota
l RES
gen
erat
ion
by te
chno
logy
sha
re [%
]
GeothermalSolarBiomassWindHydro
Figure 3.2: RES-Electricity by technology as a share of the total achieved potential in 2006 for the EU 27 [CEC, 2008]
3.2 RES Scenarios 2005-2030 The recently observed increase in renewable energy sources and distributed generation in the European electricity system is most likely to continue or even increase its growth rate in the future. The time horizon analysed is set between 2005 and 2030 in order to calibrate the model according to historic developments with respect to possible future evolvements.
Countries and case study regions where the installation of additional RES is analysed are located in the Netherlands, Germany and Spain, These areas have different characteristics in terms of already existing load and the type of generation installed whereas the penetration levels evaluated can vary significantly. For derivation of future RES scenarios the simulation software GreenNet has been updated for specific needs of the IMPROGRES project. GreenNet has been developed within the Fifth Framework project GreenNet (EU-15) and has recently been extended in the EIE project GreenNet – EU27 to the EU-27 region and, finally, the Western Balkan region was included in the EIE project GreenNet -Incentives in 2009 (finally covering the major 35 European countries). The model is capable to derive future RES development scenarios on an aggregated basis (e.g. EU-27 region as a
IMPROGRES EIE/07/137/SI2.466840 Deliverable D7 Final Report Page 27
whole) as well as on disaggregated country (e.g. The Netherlands) or even case specific level (e.g. case study region in Spain).
As it was decided to use BAU scenario and policy settings (2005) of GreenNet it must be mentioned that policy changes of course influence the future RES scenario evolvement. Overall, these tendencies – even if they are not considering most recent policy updates – imply a significant growth of RES on European as well as on national levels. As a result, distribution grids are further charged and tested by integration of renewable electricity generation, as well as conventional generation technologies.
Figure 3.3: GreenNet BAU simulation results including projections until 2030 and conventional
CHP updates for electricity generation on European level Simulation results show, that on European level according to a Business As Usual (BAU) scenario total RES electricity generation within the EU Member States (EU-27) increases from 490 TWh/yr in 2005 to about 1280 TWh/yr in 2030 (see figure 3.3). While generation from RES technologies like hydro power and biowaste remain almost stable, wind power, biomass and biogas increase considerably up to 2030. The share of electricity generated from RES regarding overall electricity demand increases from about 15% in 2005 to approximately 26% in 2020. According to the reference scenario wind power (onshore and offshore) is likely to be the dominant RES technology up to 2030. Within this technology also offshore installations are becoming increasingly important as from 2010. Besides that, also future promising technologies like PV and solar thermal electricity show increasing installations as from 2013 onwards.
IMPROGRES EIE/07/137/SI2.466840 Deliverable D7 Final Report Page 28
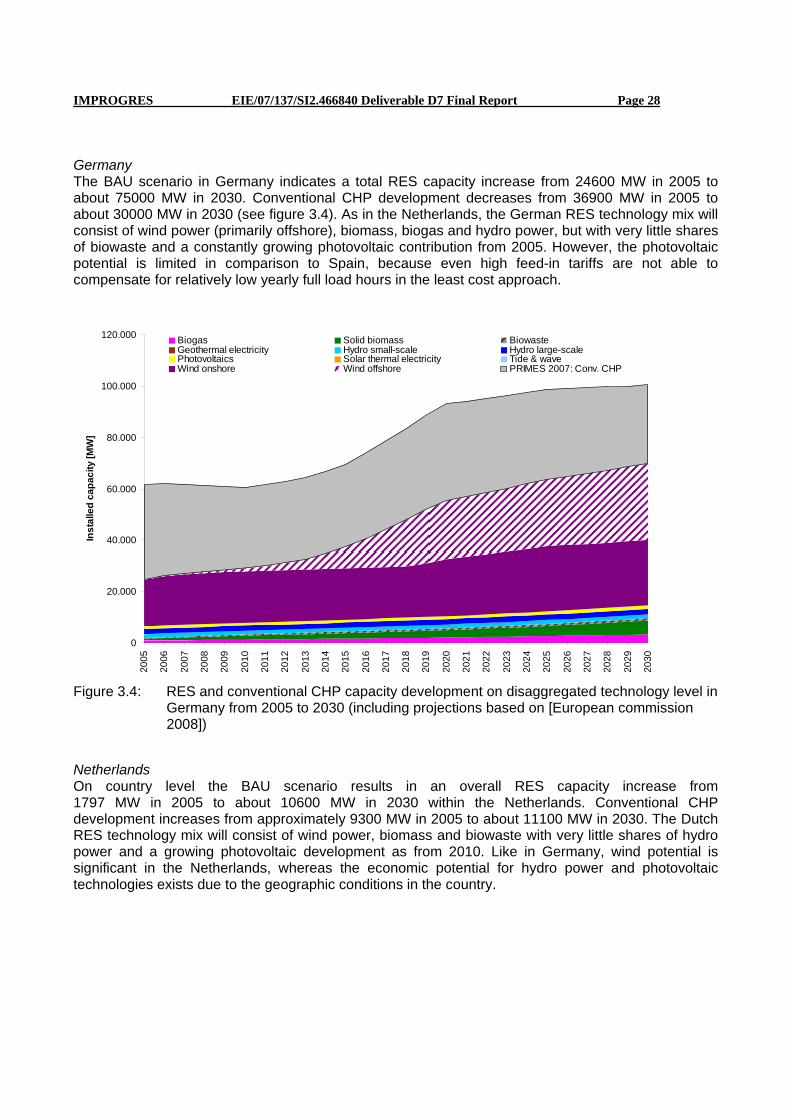
Germany The BAU scenario in Germany indicates a total RES capacity increase from 24600 MW in 2005 to about 75000 MW in 2030. Conventional CHP development decreases from 36900 MW in 2005 to about 30000 MW in 2030 (see figure 3.4). As in the Netherlands, the German RES technology mix will consist of wind power (primarily offshore), biomass, biogas and hydro power, but with very little shares of biowaste and a constantly growing photovoltaic contribution from 2005. However, the photovoltaic potential is limited in comparison to Spain, because even high feed-in tariffs are not able to compensate for relatively low yearly full load hours in the least cost approach.
Figure 3.4: RES and conventional CHP capacity development on disaggregated technology level in
Germany from 2005 to 2030 (including projections based on [European commission 2008])
Netherlands On country level the BAU scenario results in an overall RES capacity increase from 1797 MW in 2005 to about 10600 MW in 2030 within the Netherlands. Conventional CHP development increases from approximately 9300 MW in 2005 to about 11100 MW in 2030. The Dutch RES technology mix will consist of wind power, biomass and biowaste with very little shares of hydro power and a growing photovoltaic development as from 2010. Like in Germany, wind potential is significant in the Netherlands, whereas the economic potential for hydro power and photovoltaic technologies exists due to the geographic conditions in the country.
IMPROGRES EIE/07/137/SI2.466840 Deliverable D7 Final Report Page 29
Spain In Spain the BAU scenario derives a total RES capacity increase from 23400 MW in 2005 to about 69400 MW in 2030. Conventional CHP capacity remains at approximately 7000 MW. The RES technology mix in Spain will consist of hydro power, followed by wind power, of which only a minor share offshore. Biomass, biogas, solar thermal, tidal and photovoltaic technologies also show significant and growing shares as from 2010. High shares of solar energy utilisation can be realised.
Summarising, all GreenNet simulation results show a significant growth in RES capacities in Europe, both on country-level and on case study level. In addition to RES development, conventional CHP capacity is expected to increase in most of the analysed countries. With respect to wind capacities, significant grid related cost increases due to grid connection and grid reinforcement measures can be expected. The installed capacity of RES in the EU-25 (including CHP, but excluding off-shore wind and large scale hydro) will grow from 201 GW in 2008 to about 317 GW in 2020, which corresponds to an increase of around 116 GW in 12 years.
IMPROGRES EIE/07/137/SI2.466840 Deliverable D7 Final Report Page 30
4 CASE STUDIES OF SYSTEM COSTS OF DISTRIBUTION AREAS
Increasing DG penetration levels are expected to affect a wide range of electricity system costs components. The most relevant are:
• distribution costs, since the size of distribution assets can no longer depend only on flows caused by peak demand;
• generation, since DG will replace conventional generation and change the generation mix;
• balancing, due to the unpredictability and variability of some DG technologies;
• external cost, since emissions of different polluting substances are significantly lower when electricity is produced using clean renewable technologies.
Within the IMPROGRES project the evolution of the different types of costs with increasing shares of DG, ceteris paribus, has been determined. The set of system variables that are kept constant (level of demand, fuel prices, CO2 prices, etc.) are known as the background or storyline, within which DG impact is measured. Two different storylines have been considered, one corresponding to the year 2008 and another one corresponding to the expected situation in the year 2020. For each storyline several DG scenarios have been analysed: no-DG, 2008 DG, 2020 DG Medium and 2020 DG High.
Three distribution areas which have a high potential for the integration of DG have been studied. These are located in Spain, the Netherlands and Germany. These areas have different characteristics in terms of the type of load existing in the area (rural/urban, etc.), the type and amount of DG present, as well as unit costs and other parameters of design of the grid. These areas are not meant to be representative of the current average situation in Europe regarding DG penetration, but they may be more representative for the (near) future.
The area in Spain is located in Aranjuez. It is an urban and semi-urban area with about 60.000 customers and mainly wind and CHP capacity currently installed, concentrated in specific locations. In the future, PV capacity is also expected. Up to 35% DG penetration is expected for 2020. The impacts on high voltage, medium voltage and low voltage distribution networks are considered in this region.
Table 4.1: Installed capacity of load and DG for each technology. Spanish case [MW]
Network user 2008 2020 medium scenario
2020 high scenario
Load 407.97 641.12 641.12DG CHP 35 35 45DG PV 0 11.099 40.099DG Wind 10 30 50 The area in the Netherlands is a semi-urban area with 80.000 customers and very large in size (675 km2). It is located in Kop van Noord Holland. DG installed and expected consists of wind and CHP and DG penetration levels, which are already very high, will probably reach 200% of the contracted load in 2020. Only high voltage and medium voltage distribution networks are considered here since
IMPROGRES EIE/07/137/SI2.466840 Deliverable D7 Final Report Page 31
expected future problems focus on integration of large volumes of wind and CHP. This entire grid must be build underground.
Table 4.2: Installed capacity of load and DG for each technology. Dutch case [MW]
Network user 2008 2020 medium scenario
2020 high scenario
Load 317.27 856.15 856.15DG CHP 116.402 573.152 886.302DG Wind 109.995 214.345 503.345 The area in Germany is located in Mannheim. This is a residential area with about 6000 customer where future DG technologies expected include PV and micro-CHP, located within households. DG penetration levels are nowadays negligible but are expected to reach about 30% of contracted load in 2020. Only medium voltage and low voltage distribution networks are considered.
Table 4.3: Installed capacity of load and DG for each technology. German case [MW]
Network user 2008 2020 medium scenario
2020 high scenario
Load 63.68 71.75 71.75DG CHP 0.006 1.691 3.38DG PV 0.362 10 20 In order to assess distribution costs, two reference network models have been employed to compute the optimally adapted distribution network for each of the previously defined scenarios. These reference network models take into account the cost of investments, operation and maintenance and losses when developing the minimum cost grid that is able to cope with the flows that are expected in each case. They take into account DG to reduce costs if possible as well as to compute the extra costs that the latter may cause. Apart from the distribution network costs, the following cost items were included: • Variable generation costs in the dispatch are computed using COMPETES, an economic dispatch
model, assuming perfect competition and taking into account the substitution of conventional generation associated with the presence of DG in a set of operation scenarios representative of the operation of the system during the whole year.
• Fixed generation cost are computed from the result of the dispatch computed by COMPETES and using levelized costs so as to determine the amount of capacity from each conventional generation technology required to provide this energy.
• External cost are based on the total production from each technology computed by COMPETES, using unit emission factors corresponding to each technology.
• Balancing costs are computed considering characteristic increases in balancing costs per unit of energy produced from wind in each type of area, and for the corresponding wind penetration level in the corresponding country, taking into account total wind production in the area. Balancing costs for other DG-RES technologies were assumed to be negligible.
• Finally, transmission network costs, only considered for the Dutch case study, were estimated by the network operators in the area based on their own planning studies.
IMPROGRES EIE/07/137/SI2.466840 Deliverable D7 Final Report Page 32
All these cost factors, except distribution cost, are scaled to take into account the capacity credits of each technology, to assess the production and installed capacity needed to supply the required electricity. Determinants of network costs The main cost drivers for the distribution grid are the relative level of demand and DG, their spatial overlap, their simultaneity, and the unit investment costs and price of energy used. Flows in the grid are lowest when DG production coincides with local consumption. Thus, for low penetration levels of DG (compared to load) costs tend to decrease with increasing power produced by DG (that is, the higher the DG penetration level is). This is illustrated in figure 4.1 for the Spanish case study. Total network costs in this graph are composed of the network investments plus the Net Present Value of maintenance and electric losses. For very high DG penetration levels, costs tend to increase with the penetration level. In order for DG to decrease power flows, generation must be located close to load. Thus, up to a certain penetration rate, reduction in costs will exceed increasing cost factors, if generation and demand are located close together. The same applies to the operation profile. Reduction in distribution costs will be higher (or the increase will be lower) the more similar the operation profiles of demand and generation are (mainly the simultaneity factors and the time when maximum generation output or load consumption occurs). Last but not least, total distribution costs fall with lower unit investment costs and the price of energy losses.
0
10
20
30
40
50
60
70
80
0% 5% 10% 15% 20% 25% 30% 35% 40% 45%
penetration level (contracted demand) (%)
€ / k
Wdg
Total Investment Maintenance + losses
Figure 4.1: graphical representation of the incremental distribution costs for the Aranjuez area (Spain). Evolution of these costs (in € per kW installed DG) with the level of penetration of DG for the 2020 storyline.
Other costs and benefits of integration of DG Assessment of generation costs must distinguish between fixed and variables costs. The former tend to increase as a result of the installation of DG because the unit investment costs of this generation capacity are higher than that of conventional generation. On the other hand, total variable generation costs tend to decrease with the integration of DG because the costs of producing power from conventional generation replaced by DG are usually higher than that of the latter type of generation. CO2 emissions and external costs (caused by the emission of other type of pollutants) are also higher for conventional generation capacity than for DG.
IMPROGRES EIE/07/137/SI2.466840 Deliverable D7 Final Report Page 33
Despite this general trend, differences between DG technologies exist. The investment costs for CHP generation tend to be lower than those of wind, which in turn are lower than those of solar power. Fuel costs and emissions are higher for CHP than for wind or solar power. Consequently, the higher the fraction of total CHP capacity, the lower investment costs and the higher variable cost will be. The higher the fraction of solar capacity, the higher investment cost will, since this is, by far, the most expensive technology amongst the ones considered. This effect is reinforced by the fact that the capacity credit of solar is below that of the wind, which, in turn, is below that of CHP capacity. The balance between variable and fixed generation cost caused by DG, depends on several aspects, like the prices of electricity and CO2, the amount of electricity produced by each DG technology in the area and unit investment costs considered. For the case study scenarios, the increase in fixed generation costs caused by DG was found to be larger than the corresponding decrease in variable costs. So, overall, total generation costs tend to increase as a result of the installation of DG. It is clear that these findings very strongly depend on the chosen mix of DG technologies. A lower share of high fixed cost wind energy and a higher share of lower cost CHP would give a completely different picture with lower fixed generation cost and lower variable cost savings. However, the general picture regarding the increasing total costs, and increasing network cost with high shares of DG is expected to remain unchanged.
-80.0
-60.0
-40.0
-20.0
0.0
20.0
40.0
60.0
80.0
0% 20% 40% 60% 80% 100% 120% 140% 160% 180%
DG/RES Penetration level
Uni
t Cos
ts [€
/kW
DG
/yea
r]
Variable Generation Costs Fixed Generation CostsDistribution Costs Balancing CostsExternal Costs Total System CostsTransmission Costs
Figure 4.2: Evolution of the impact of DG in the North Holland case study area on total supply costs (in €/kW DG per year) with the DG penetration level (installed DG as percentage of contracted load). Results for 2020 storyline
As mentioned earlier, external costs will decrease as a result of the installation of DG, though the impact of these reduction will in general be smaller than other effects of installing DG. Balancing costs, on the other hand, will increase with the amount of DG installed, though the magnitude of this increase
IMPROGRES EIE/07/137/SI2.466840 Deliverable D7 Final Report Page 34
will depend on the percentage of DG capacity that corresponds to wind, which is the main technology responsible for an increase in balancing costs because of its unpredictability. Overall, total supply costs will increase with the installation of new DG units for almost any DG penetration level, with two exceptions: An exception may be low penetration levels, where the impact of generation costs may be smaller than that of other cost components like distribution costs, which may decrease with DG. Another, more significant, exception may be those scenarios where energy and CO2 prices are very high. In this case, the decrease in variables costs (or increase in social welfare) may surpass the increase in generation investment costs. Figure 4.2 shows the total supply costs for the Netherlands case study area, expressed in €/year per kW of DG installed. The blue triangles in the top of the graph differ for the three cases shown here because each has a slightly different capacity mix (% of wind and CHP). Therefore variable generation costs (mainly conventional fuel savings) (yellow triangle at the bottom of the graph) differ too. Variable costs include the CO2 cost, set at 20 €/ton in this analysis. Since the total cost is in all cases around zero or positive, this is an indication that a CO2 price of 20 €/ton does not reflect the value society currently attaches to renewable electricity. With a CO2 price of 50€/ton the whole curve will shift downwards with about 45 €/kWDG/year, resulting in net benefits to society for all DG/RES penetration levels shown in this graph. The total supply costs in Figure 4.2 must therefore be interpreted in the light of the value attached to CO2 and other social indicators. More relevant is the fact that when DG is more than about half of the contracted load, the network costs and the total costs start to increase with higher shares of DG. Note that the North Holland case is an extreme case and that in most areas in Europe DG penetration rates in 2020 are expected to be much lower than 100% of the contracted load.
-100.0
0.0
100.0
200.0
300.0
400.0
500.0
600.0
700.0
0% 10% 20% 30% 40% 50% 60% 70% 80% 90% 100%
penetration level (contracted demand)
€/kW
dg
Netherlands Germany Spain
Figure 4.3: Incremental costs per installed kW of DG. Overview Finally, we estimate the impact of DG in each of the areas considered on distribution cost and other types of costs. DG-related distribution network incremental costs for DG penetration levels below 100% are in the range 45-70 €/kWDG for the Spanish case. Those in the Dutch case are in the range
IMPROGRES EIE/07/137/SI2.466840 Deliverable D7 Final Report Page 35
95-164 €/kWDG, and those in the Mannheim area lie between 200-675 €/kWDG.(see figure 4.3) Differences in the former values for different areas may be partly caused by the use of different unit costs of network elements in different areas. Thus, unit costs considered for the German area are significantly higher than those in the Dutch and the Spanish ones. Assumptions about the behaviour of demand and generation differ widely among areas, which may also cause non-negligible differences. These assumptions concern the fraction of DG installed capacity that is producing power at peak load time and the amount of power consumed in periods when DG production is highest. In the analyses here presented, conservative assumptions were made, according to planning practices by DSOs and the regulation in some countries. If the behaviour of DG were better adapted to load conditions in the system, incremental costs caused by DG could be significantly reduced. The relative importance of variable and fixed generation costs determine the overall cost impacts of DG. They depend on the level of energy prices and the unit investment costs for DG technologies. In the considered cases, fixed costs range between 58 (for the Dutch and Spanish areas) and 98 (for the German area) €/year per kW DG installed, and variable costs between -117 and -22 €/year per kW DG installed, both values obtained for the Dutch area. Changes in the social welfare are in the same order of magnitude as changes in variable generation costs. Lastly, changes in external costs and balancing costs caused by DG are much smaller than those in the previous cost factors: these range between 0 and 2 €/(kW DG installed*year) for balancing costs and between 0 and -6.3 €/(kW DG installed*year) for external costs. Total system costs tend to increase as a result of the integration of DG. Thus, changes in the total socio-economic impact range between close to 0 values for relatively low DG penetration levels in the Netherlands and 114 €/year per kW DG installed in Germany for relatively high DG penetration levels.
IMPROGRES EIE/07/137/SI2.466840 Deliverable D7 Final Report Page 36
5 RESPONSE OPTIONS FOR MINIMISING THE COSTS OF DG INTEGRATION INTO POWER NETWORKS
The previous chapter described how network costs and other cost items will change with increasing shares of DG. Active Network Management (ANM) is sometimes promoted as a ‘smart grids’ solution to limit the growth in network costs due to integration of DG. Two response options were identified notably advanced control of distributed generation and demand side management, for which the impact on network costs were quantified. Firstly, a business-as-usual analysis considered completely passive behaviour of loads and DG, as it is mostly the case nowadays. Results showed that overall system costs tend to increase with a higher share of DG connected, although the impact on each of the different cost factors varies and also strongly depend on the type of DG. Both fixed generation costs and distribution costs increase significantly due to the growing wind penetration levels. Higher fixed generation costs are caused by the need to have back-up capacity due to the low capacity credit of wind, while distribution costs increase due to the need to reinforce the networks to cope with the increased power flows. On the contrary, variable generation costs and the monetary value of externalities decreased owing to the fact that DG production substitutes (in terms of energy) part of the more polluting and expensive centralised generation. Balancing costs tend to increase as well, but to a lesser extent than other costs.7 Assumptions made for the ‘business as usual’ situations were conservative with respect to the network requirements. These situations were compared to situations with deployment of advanced response strategies. DG-driven incremental costs were expected to be significantly mitigated under alternative conditions by using advanced response strategies. For the analysis of alternative network response options, the same methodology defined one alternative for every original scenario in the ‘business as usual’ situation. In these alternative scenarios, a combination of several response options was implemented. Two response options were modelled for each of the three country case studies: advanced generation control and demand side management. – The Kop van Noord Holland area is a region very favourable to the location of medium-sized wind
farms and CHP units. Maximum DG production is expected to surpass consumption. In this area, the advanced response options considered comprise shifting demand of greenhouses from periods with low DG production to those where most CHP units are running, curtailing wind output at specific times (a few hours per year) and matching CHP production with demand, using heat stores or resort to back-up gas boilers.
– The Mannheim area is residential. There, solar PV panels on roofs and micro-CHP units are expected to become widespread. By 2020, the production of PV panels connected at LV may have surpassed the maximum instantaneous consumption at this voltage level. Thus, limiting maximum DG production at certain times was deemed the most promising alternative due to the availability of thermal storage. A 20% reduction has been assumed sensible.
7 In order to be able to make comparisons among regions, the total impact of DG on system costs was normalised with the installed capacity of DG. DG-related distribution network incremental costs for DG penetration levels below 100% are in the range 45-70 €/kWDG for the Spanish case. Those in the Dutch case are in the range 95-164 €/kWDG. Finally, those in the Mannheim area lie between 200-675 €/kWDG.
IMPROGRES EIE/07/137/SI2.466840 Deliverable D7 Final Report Page 37
– The Aranjuez region is a mostly residential and industrial area with a few medium-sized wind farms and industrial CHP plants. Additionally, some PV farms will have been connected by 2020 at MV level. Nonetheless, peak demand is the most relevant cost driver. Hence, advanced response options considered include both a reduction in peak LV demand which partly/mainly result from a shift in time of peak demand using time-of-use tariffs, though some demand response is also considered, and changes to CHP and PV production patterns which are also the result of active generation control and changing tariffs.
Comparing the situation with and without advanced response options, shows that increasing DG penetration levels may cause distribution network costs to rise, although to lower levels due to implementing advanced response options. An exception to this occurs in the Spanish case study, where network costs could decrease when low or moderate amounts of DG are connected. In this case, DG production during peak demand periods would reduce need for strenghtening upstream network elements and, consequently, capacity requirements. However, implementing advanced response options could noticeably mitigate the negative impact of high shares of DG on distribution costs. Cost savings range from above 30% in the Dutch area to about 2% in the most unfavourable scenario of the Spanish case study (see Figure 5.1). The different results for the benefits of ANM between areas result from a myriad of parameters: DG penetration levels, relative location of loads and DG, DG technologies, assumptions made regarding load and DG behaviour and the nature and degree of implementation of response options considered.
0%
5%
10%
15%
20%
25%
30%
35%
40%
Dem
and
2008
Dem
and
2020
Dem
and
2008
Dem
and
2020
Dem
and
2008
Dem
and
2020
Dem
and
2008
Dem
and
2020
Dem
and
2008
Dem
and
2020
Dem
and
2008
Dem
and
2020
Dem
and
2008
Dem
and
2020
Dem
and
2008
Dem
and
2020
Dem
and
2008
Dem
and
2020
Dem
and
2008
Dem
and
2020
Dem
and
2008
Dem
and
2020
Dem
and
2008
Dem
and
2020
TheNetherlands
Germany Spain TheNetherlands
Germany Spain TheNetherlands
Germany Spain TheNetherlands
Germany Spain
No DG DG 2008 DG 2020 medium DG 2020 high
AN
M v
s. B
AU
Savi
ngs
in to
tal d
istri
butio
n co
sts
[%]
Figure 5.1: Savings in total distribution network costs after the implementation of advanced
response options as compared to a BAU situation [%].
Generally, distribution cost savings were highest for those areas with high levels of controllability of load and DG. The highest benefits were obtained for the Dutch case study in the 2020-DG penetration level scenarios. It should be taken into account that DG penetration rates in this area are extremely high whilst the planning assumptions considered in BaU case were extremely conservative. Therefore, it is reasonable that cost savings brought about by advanced response options are high when compared to those results for other areas. Cost savings in the remaining scenarios (with the exception
IMPROGRES EIE/07/137/SI2.466840 Deliverable D7 Final Report Page 38
of the Dutch area for 2020-DG penetration levels) all remain in the range of 5-10% of total distribution costs. Moreover, cost savings usually correspond either to network investments in assets located upstream of DG within the network or in assets located at the same voltage level as DG. Taking into account also the remaining cost factors, it was observed that the implementation of advanced response options reduced overall system cost for all case studies (before considering its implementation costs). Especially network costs fell due to the implementation of ANM. Fixed and variable generation costs, and externalities, on the other hand, tend to rise as a consequence of the lower contribution of DG. Limited curtailment or shifting of DG production produces an optimal balance, in which grid-related savings exceed associated generation costs. The amount of savings achieved for each kW of DG installed greatly depends on the particular characteristics of each region. Whilst overall cost savings present smaller variations among scenarios and are kept within similar ranges for the German (10-12 €/year/kW of installed DG) and Dutch regions (7-9 €/year/kW of installed DG), savings in the Spanish case study (2-5 €/year/kW of installed DG) were significantly lower and presented considerable volatility among scenarios. Cost savings are presented in more detail Table 5.1. Table 5.1: Cost savings achieved through ANM as compared to a BAU situation for the different
types of system costs. Values expressed in €/kW of installed DG and year [€/kWDG/year].
The implementation costs in each area were analysed, showing that the overall effect of ANM is positive in the Dutch and German areas (see Table 5.2), but not in Spain where implementation cost exceed the cost savings. It must be noted that calculations of cost savings and implementation costs constitute a simplified approach in several aspects. For example, the implementation costs were estimated due to lack of real data. In Spain and Germany these costs are dominated by the costs of control devices and
IMPROGRES EIE/07/137/SI2.466840 Deliverable D7 Final Report Page 39
intelligent meters for households and other small connections, while in the Netherlands only a small number of larger installations needed to be controlled. This comparison of costs and benefits allowed for drawing preliminary conclusions, albeit a definite decision about the acceptance or rejection of ANM would require a more detailed and profound cost-benefit analysis. Since significant differences across regions can be found depending on their particular characteristics, this analysis should be made on a region specific basis. Furthermore, there are many other advantages of the implementation of response options that could not be quantified in WP5 such as the contribution of energy efficiency and DG to security of supply (using endogenous resources), barriers to building new network assets (which could in fact make ANM the only solution), contribution of smart metering to improve continuity of supply, provision of ancillary services by DG and/or loads, etc. Additionally, a generalised use of ANM could push the development of the ICT technologies and drive unit implementation costs down. However, shaving peak loads or curtailing DG production may imply some loss of comfort for consumers or loss of income for DG operators respectively. This could be mitigating through compensation payment or lucrum cessans. These issues should be addressed in future research.
Table 5.2: Summary of average annualised costs and benefits of Active Network Management for
the three case study regions (in €/kWDG/year) Network Technology Net
Source: Improgres findings: Based on 4 scenarios per country (Demand 2008 and Demand 2020 for both Medium and High DG). The role of ANM to reduce network cost in Europe Combining the GreenNet scenarios for the development of renewable energy sources in Europe with Primes 2007 scenarios for the growth of combined heat and power, one can obtain a scenario for the growth of DG in the EU-25. Large-scale hydro and off-shore wind are not included as DG. The resulting figures show an increase of installed DG capacity in the EU-25 from 201 GW in 2008 to 317 GW in 2020. To estimate the future network cost of the integration of DG into distribution networks, cost outcomes were summarised of the main IMPROGRES network simulations in Table 5.3. The first column shows the average network costs for the simulated networks without distributed generation. The average for the three case studies is approximately 350 € per kW of contracted load. In the second column the additional costs for extra distributed generation is shown. This depends strongly on the type of network and the share of distributed generation. In Germany the incremental cost are determined to a large extent by the low voltage connections, which are relatively costly per kW. A typical average for the incremental network cost is about 200 € per kW of distributed generation.
IMPROGRES EIE/07/137/SI2.466840 Deliverable D7 Final Report Page 40
Table 5.3: Summary of distribution network cost figures obtained in the three case studies, expressed in € per kW of contracted load for the average cost, and in €/kW of distributed generation in the DSO area for the incremental network costs and the network cost savings due to active network management
Average Incremental ANMNetwork Network Network cost
Source: Summary of Improgres findings: Average network cost based on 2 scenarios per country (Demand 2008; Demand 2020, no DG); Others: average of 6 scenarios per country: Demand 2008; Demand 2020 times Low, Medium and High DG penetration). The third column in table 5.3 shows the average potential network cost savings as calculated in the three case studies. From table 5.2 it can be concluded that not all technical potential can be realised; under some circumstances the cost of investing in measures to achieve active network management can be higher than the network savings. In other cases, abuse of market power by requiring high payments to allow control of the DG-units when the DSO has to rely on just a small number of DG operators can reduce the opportunities to make use of the full potential. When assuming that 20-50% of the technical potential can be actually realised, and annual net benefits are about 4 €/kWDG/year (see table 5.2), then the total net benefits of active network management in 2020 in the EU-27 are estimated to be in the order of 1-3 bn €, which is about 5-10% of the additional 25 bn € network investments which are required to facilitate the extra 116 GW of DG in 2020. Large uncertainties in the cost of implementing active network management measures, and in the share of the technical potential which is financially viable, make estimates of the benefits, as formulated above, very tentative. More SmartGrids activities and demonstration programmes such as Germany’s E-Energy research program are needed to obtain more information on these issues. Only when more firm information on costs and impacts becomes available a more reliable estimate of the network benefits of Active Network Management can be made.
IMPROGRES EIE/07/137/SI2.466840 Deliverable D7 Final Report Page 41
6 RECOMMENDATIONS FOR KEY STAKEHOLDERS In the following sections, most relevant recommendations for the key stakeholders involved in policy design, regulation and realisation of large scale DG grid and system integration are summarized. These recommendations have been derived from theoretical and applied analysis of implemented grid regulation mechanisms and consultation of stakeholders and experts’ opinion as communicated in the course of different events (expert discussion platforms, workshops, dissemination events). They express the authors’ suggestions for removing non-technical barriers of DG grid integration.
6.1 Grid Operators As grid operators fulfil a crucial role in the integration of DG, they are usually being consulted when preparing national legislation and regulatory mechanisms. Furthermore, because networks are natural monopolies due to prohibitive high costs of duplicating networks, grid operators do not operate in a market but are usually regulated enterprises. For that reason, economic incentives for network planning and operation have to be defined by policy makers and regulatory authorities. Even though this stakeholder group may have limited influence on their economic environment following recommendations are targeted towards grid operators: • Through active involvement in the decision making process of renewable energy legislation,
infrastructure planning and energy regulation, grid operators and their associations on national and international level can bring in their expertise on the topic of DG grid and system integration and communicate the measures, which will enable them to support the achievement of national and international renewable energy policy goals.
• Grid operators should provide opportunities for DG and demand to participate in different energy and ancillary services markets for different time periods (ranging from real-time to year-ahead) by relaxation of network requirements. Therefore (minimum size) participation requirements to DG should be removed as far as economically and technically feasible. Furthermore, the current procurement of ancillary services should be evaluated against a number of economic and technical alternatives.
• Grid operators should allow for interoperability of smart grid equipment, including smart metering equipment. Communication standards of equipment should be defined and agreed upon on an European wide scale to allow for provision of new services by third parties (for example energy services companies (ESCOs)). Smart metering standards should offer possibilities for two-way communication, separate accounting of consumption and production exported to the grid, etc.
• Grid operators should aim at highest transparency in the procedure of granting grid access to generators; respective cost allocation mechanisms and detailed methodology of determining disaggregated cost components shall be publicly available to all interested parties. The provision of this information facilitates the improvement of implemented regulation, and reduces project risks for DG developers. Respective information should be available also in English language in order that international competition between prospective project developers is encouraged.
IMPROGRES EIE/07/137/SI2.466840 Deliverable D7 Final Report Page 42
6.2 Regulatory Authorities Energy regulatory authorities play a significant role in the enhancement of integration of DG in distribution networks. While regulatory bodies act on the basis of national and international legislation and therefore are facing a stringent framework for their operation, their level of activity and engagement heavily influences the interplay between grid operators, generators and consumers. Recent innovations of the grid regulation model in UK and Germany demonstrate the way forward for amending the traditional incentive regulation approaches enabling large-scale grid integration of DG. Regulatory elements that should be dealt with in a better way are recovery and allocation of grid costs induced by DG, inclusion of innovation aspects and more forward-looking elements in network planning. Following actions are recommended for regulatory authorities: Network charging • Implementation of shallow connection charges for all generators in order to provide a fair and
transparent access treatment for DG investors. At the same time, the additional grid infrastructure cost related to DG integration should be fully recovered by DSOs through use-of system (UoS) charges. When distribution grids are increasingly dominated by the requirements of generation, DGs should be incentivised to take into account grid costs in their production decisions. Consequently, generation should be allocated part of the grid reinforcement costs through Generation UoS charges. In this way, generators are forced to internalize the consequences of their production decisions on network costs, which will improve network utilization and ultimately increase social welfare. Besides, the transparency of the costs of (distributed) generation is improved when DG receives network incentives which are clearly separated from support schemes for generation instead of general subsidies covering all kind of costs.
• The European Regulators Group for Electricity and Gas (ERGEG) should facilitate and support the comparability of national economic provisions for the charging of costs related to access to and usage of the electricity grid infrastructure. Currently, harmonisation efforts are fully directed to transmission network charging, while distribution network charging is entirely left to national authorities. The advent of DG requires more intelligent distribution networks i.e. distribution networks will increasing obtain the same characteristics as transmission networks. Besides, with the increasing penetration of DG there is an increasing need for a level playing field between conventional generation (often connected to transmission networks) and DG that is usually connected to distribution networks. Regulatory efforts should aim at establishing a level playing field for network users (both generators and consumers) at European level for connection and use-of-system charging methodologies in distribution networks. This could result in a stepwise implementation of best practise methodologies with respect to network cost allocation.
• In order to induce better network usage and lower peak demand for network services, time-of-use based network signals should be provided to all generators (including DG) and consumers. When possible and appropriate, cost-reflective locational signals for DGs should be implemented on the basis of forward-looking long run incremental cost (LRIC) rather than solely in relation to the direct cost incurred of a specific connection of a single DG facility.8 This approach can help
8 In general, the decision on the boundary between fixed connection charges and volume based ‘Generation Use of System
Charges (GUoS)’ – both having to be paid by DG generators to distribution grid operators – needs to take into account of
IMPROGRES EIE/07/137/SI2.466840 Deliverable D7 Final Report Page 43
minimise problems associated with first movers and free-riding in case of more than one DG on the same connection point on distribution grid level.
• Demand response Currently, demand response is nearly non-existent. More demand response is widely considered as valuable to increase the flexibility of power systems with much intermittent generation. More specifically, demand response can lower the peak demand in networks and increase the network utilization over time. Demand response is commonly facilitated by smart meters. In several Member States the roll-out of smart meters among low-voltage customers is ongoing. This should be accompanied by sending consumers price and/or volume signals, otherwise they will probably not react. Price signals would constitute differentiated energy prices, being the most common schemes time-of-use (TOU) prices, real-time pricing (RTP) or critical peak pricing (CPP). Volume signals are limitations on the consumption of specific loads during a certain time span through, for instance, interruptible contracts. Additionally, demand response programs ought to be defined and progressively implemented, carefully defining the role of each of the agents involved. Furthermore, the retailing sector should be fully developed and home automation ought to be developed and promoted. Evidently, the functionalities of the “smart meters” that are being installed should enable to endorse such applications.
• Grid codes Implement operational procedures in grid codes for distribution voltage control and congestion management including active response from distributed generation and responsive loads. Innovation
• Introduce in DSO regulation the requirement to plan future grid infrastructures taking in to account innovative smart grid implementations as a way of reducing investments required under the the traditional ‘fit and forget’ approach. Consideration of a mechanism to directly cover and/or remunerate investment and operational cost allocated to innovative DG grid integration projects (i.e. personnel cost for research, feasibility studies and preparatory operations of DG grid integration projects) in incentive regulation.
Network planning
• In some countries there are queues for the connection of new generation capacity, slowing down the connection of new distributed generation amongst others. In order to be able to integrate substantial shares of DG in short notice, current investment planning policy could be improved. Brattle (2007) indicates a number of possibilities with high potential to improve the current situation;
• Publish information on the amount of connection capacity available at different parts of the network, preferably on a substation by substation basis. This improves transparency and therefore the investment climate.
• Implement project milestones in the planning process with cancellation fees. Project milestones may concern procurement of planning permission by the generator and/or progress in securing equipment or fuel delivery, among others. Cancellation fees can be tuned to the connection costs
the desirability of reflecting cost to DG generators on a forward-looking long-run incremental cost (LRIC) basis. These charges, furthermore, should be cost reflective and also incorporate a sensible apportionment of forward-looking LRIC providing both correct signals and cost-recovering mark-ups.
IMPROGRES EIE/07/137/SI2.466840 Deliverable D7 Final Report Page 44
including the cost of required grid reinforcements behind the connection point. In that way, cancellation fees vary by location and are higher in congested areas. Consequently, investors are forced to be more carefully in their connection requests, especially at places with high network reinforcement and therefore social costs. Likewise, also the DSO should be subject to milestones in order to complete certain tasks within time.
• The permit process for network expansion is often started only after receiving applications for new capacity. Required time for network expansion can be reduced by starting the permit process for likely network reinforcements prior to receiving those applications. For the time being, therefore it is advised to start the permit process for network expansion prior to receiving those applications. In case this measure proves to be insufficient, constructing connections and concomitant grid reinforcements prior to applications for connections might be considered as an option. Unbundling
• Safeguarding the compliance of grid operators and utilities with the basic unbundling principles provides a necessary precondition for successful entrepreneurial activities of DGs, by preventing scope for discriminatory grid access procedures by vertically integrated network operators for commercial reasons.
6.3 DG Developers / Investors / Industry Associations DG developers and investors are eventually delivering the progress towards meeting renewable energy policy goals (together with consumers). Their economic environment is determined not only by accessible support mechanisms for DG but also (and prior) by the conditions in place for utilising the electricity grid infrastructure. DG developers, investors and industry associations can positively influence the decision making process of policy makers. Respective targets include: • Highest efforts need to be dedicated to their core competences (project development, realisation
and operation). Therefore, a clear separation of responsibilities from the core competences of grid operators is regarded essential.
• This stakeholder groups can contribute to increasing transparency in the provisions for grid access and grid utilisation by grid operators. Associations may gather and disseminate respective information on costs, tariffs and support mechanisms.
• Industry associations can on this basis exert influence on policy makers with the goal of implementing proven best practise regulations.
6.4 Policy makers Policy makers establish the economic framework for the integration of distributed generation in networks on international and national level. Legislation is a key determinant for the success in meeting policy goals. This legislation needs to be aimed at maximizing social welfare i.e. the benefits of the society of each country, and preferably larger areas, as a whole. For this aim, legislation should enforce network planning, operational and cost sharing arrangements which reflect efficiency, quality of supply and sustainability goals together. Furthermore, legislation should not only aim at benefits for
IMPROGRES EIE/07/137/SI2.466840 Deliverable D7 Final Report Page 45
industries, investors or grid operators, but focus on achieving maximum social benefits for the whole value chain including customers. Following actions are recommended for policy makers: • Enabling innovation incentives to encourage consideration by DSOs of innovative approaches with
possibly low long-term integration costs for efficient integration of DG in distribution networks • Incentive regulation schemes need to be adapted to ensure that DSOs are reimbursed fully for
additional costs arising from the integration of DG. • Long investment cycles of electricity grid infrastructures and high capital intensity need to be
reflected in the design of a forward looking investment environment for grid operators i.e. legislation should allow for certainty of reimbursement of network investments, including the amount of investment, in advance. At the same time, the efficiency of investments should not deteriorate substantially.
• For improving network planning, a strategy needs to be developed, addressing issues including: – which distributed generation shall be deployed, provided generation and network incentives – to what extent these resources are likely to be deployed – in which timeframe they shall be deployed – in which regions different potentials shall be preferably deployed.
On this basis, permitting procedures for new network connections can be started before applications for new connections are (formally) received.
IMPROGRES EIE/07/137/SI2.466840 Deliverable D7 Final Report Page 46
ANNEX A LIST OF REPORTS OF THE IMPROGRES PROJECT
Table A. 1: Reports of the IMPROGRES project Deliverable WP Title of the deliverable Authors D2 2 Development of interactions between
distributed generation and distribution system operators West Denmark, Germany, the Netherlands, Spain and the United Kingdom
D3 2 Assessment of interactions between the economics of distributed generators, distribution system operators and markets
Stephanie Ropenus (Risø DTU) Sascha Thorsten Schröder (Risø DTU) Henrik Klinge Jacobsen (Risø DTU) Luis Olmos (Comillas) Tomás Gómez (Comillas) Rafael Cossent (Comillas)
D4 3 Scenarios for DG/RES energy futures on case study, country and European level
Wolfgang Prüggler, Carlo Obersteiner, Karl Zach, Hans Auer (EEG) Luis Olmos, Rafael Cossent (Comillas) Jeroen de Joode, Frans Nieuwenhout (ECN) Henrik Jacobsen, Stephanie Ropenus, Sascha Schröder (Risø DTU) Stefan Bofinger, Norman Gerhardt (ISET) Jos Poot, Martijn Bongaerts (Liander), David Trebolle (Union Fenosa), Barbara Doersam (MVV)
D5 4 Case studies of system costs of distribution areas
Luis Olmos, Rafael Cossent, Tomás Gómez, Carlos Mateo (Comillas) Jeroen de Joode, Martin Scheepers, Frans Nieuwenhout (ECN) Jos Poot, Martijn Bongaerts (Liander), David Trebolle (Union Fenosa), Barbara Doersam (MVV) Stefan Bofinger, Umit Cali, Norman Gerhardt (ISET)
D6 5 The role of alternative network response options in minimising the costs of DG integration into power networks
Rafael Cossent, Luis Olmos, Tomás Gómez, Carlos Mateo (Comillas) Frans Nieuwenhout and Özge Özdemir (ECN)
D7 6 Market and regulatory incentives for cost minimisation in the electricity system IMPROGRES project Final Report
Luis Olmos, Rafael Cossent, Tomás Gómez (Comillas) Jaap Jansen, Adriaan van der Welle, Frans Nieuwenhout (ECN) Jos Poot, Martijn Bongaerts (Liander), David Trebolle (Union Fenosa), Barbara Doersam (MVV) Stefan Bofinger, Norman Gerhardt (ISET), Henrik Jacobsen, Stephanie Ropenus, Sascha Schröder (Risø DTU) Hans Auer, Lukas Weissensteiner, Wolfgang Prüggler, Carlo Obersteiner, Karl Zach, (EEG)
D8 6 Regulatory strategies for selected Member States (Denmark, Germany, Netherlands, Spain, the UK)
Luis Olmos, Rafael Cossent, Tomás Gómez (Comillas) Jaap Jansen, Adriaan van der Welle, Frans Nieuwenhout (ECN) Jos Poot, Martijn Bongaerts (Liander), David Trebolle (Union Fenosa), Barbara Doersam (MVV) Stefan Bofinger, Patrick Lichtner, Norman Gerhardt (ISET), Henrik Jacobsen, Stephanie Ropenus, Sascha Schröder (Risø DTU) Hans Auer, Lukas Weissensteiner, Wolfgang Prüggler, Carlo Obersteiner, Karl Zach, (EEG)
D11 7 IMPROGRES brochure
IMPROGRES EIE/07/137/SI2.466840 Deliverable D7 Final Report Page 47
REFERENCES Auer H., C. Obersteiner, W. Prüggler, L. Weissensteiner, T. Faber, G. Resch: „Guiding a Least Cost
Grid Integration of DG/RES lectricity in an extended Europe“, Action Plan, Project GreenNet-Europe, 2007a.
Auer H.: “Grid Integration of Distributed Generation”, Script: MSc Programme ´Renewable Energy in Central and Eastern Europe´, Vienna University of Technology, 2007b.
Auer H.: “The Relevance of Unbundling for Large-Scale DG/RES Grid Integration in Europe”, Energy & Environment, Vol. 17, No. 6, p. 907-928, ISSN 0958-305X, 2006
Auer H., C. Huber, M. Stadler, C. Obersteiner: “Large-scale DG/RES Grid Integration: Strategies, Requirements and Cost”, Re-xpansion Project Report, 2005.
Averch H., L. Johnson: “The Behavior of the Firm Under Regulatory Constraint”, American Economic Review, Vol. 52, p. 1053-1069, 1962.
Barth R., C. Weber, D.J. Swider: ”Distribution of costs induced by the integration of DG/RES power”, submitted to Energy Policy, Manuscript No. JEPO-D-07-00521, 2008.
Baumol W. J., J.C. Panzar, R. D. Willig: “Contestable Markets And The Theory of Industry Structures”, Academic Press Ltd., Revised Edition, ISBN 0-15-513911-8, 1983.
Baumol W.J., D.F. Bradford: “Optimal Departure from Marginal Cost Pricing”, American Economic Review, Vol. 60, p. 265-283, 1970.
Brattle (2007), A review of TenneT’s connections policy, July.
CEC (Commission of the European Communities), 2008. Technical Annex to the 2007 Report. Commission Staff Working Document. Accompanying Document to the Report on Progress in Creating the Internal Gas and Electricity Market. COM(2008) 192 final. Brussels, 15.04.2008.
CEC (Commission of the European Communities), DG-TREN: EU energy in figures 2007/2008. Update, May 2008.
CEC (Commission of the European Communities), 2007. A Technology Map for the European Strategic Energy Technology Plan. Commission Staff Working Document. SEC(2007) 1510, Brussels, 22.11.2007.
DTI (Department of Trade and Industry): „A Guide to Distribution Network Operation Charging – Connection and Use of System Methodologies“, URN Number: 06/653, available on www.distributed-generation.gov.uk, 2006.
Eriksen P.B., A. Orths: „Large-scale integration of wind power in Denmark from the TSO point-of-view – from 20% to 50% of wind energy“, 3rd Workshop of Respond Project, Roskilde, Denmark, 10 June 2008.
European Commission, “European Energy and Transport - Trends to 2030 - update 2007” European Commission, ISBN 978-92-79-07620-6, Luxembourg, 2008.
Jamasb T., K. Neuhoff, D. Newbery, M. Pollitt: “Long-Term Framework for Electricity Distribution Access Charges”, Project Report for OFGEM, University of Cambridge, 2005.
L’Abbate A., G. Fulli, S.D. Peteves: “The impact of DG on the European electricity grid”, in: Cogeneration and On-Site Power Production, May/June, 2008
IMPROGRES EIE/07/137/SI2.466840 Deliverable D7 Final Report Page 48
Lobato, E., L. Olmos, T. Gómez, F.M. Andersen, P. E. Grohnheit, P. Mancarella, and D. Pudjianto, 2009. Regulatory and other Barriers in the implementation of Response Options to reduce impacts from variable RES-E sources, Deliverable 6 of the RESPOND project.
Menanteau, P., Finon, D., Lamy, M.-L., 2003. Prices versus quantities: choosing policies for promoting the development of renewable energy. Energy Policy (31), Issue 8, June 2003, pp. 799-812.
Mitchell, C.M., 2000. The England and Wales non-fossil fuel obligation: History and lessons, Annual review of energy and the environment, Volume 25, 285-312.
Ragwitz, M., Held, A., Sensfuss, F., Huber, C., Resch, G., Faber, T., Haas, R., Coenraads, R., Voogt, M., Morotz, A., Grenaa Jensen, S., Morthorst, P.E., Konstantinaviciute, I., Heyder, B., 2006. OPTRES - Assessment and optimisation of renewable support schemes in the European electricity market. Interim Report of the project. Contract N°: EIE/04/073/S07.38567. Karlsruhe, January 2006.
RESPOND project website: http://www.respond-project.eu/ Vogel P.: “Efficient Investment Signals for Distributed Generation”, Institute for Energy Economics,