CONTRIBUTED RESEARCH ARTICLE 298 Market Area Analysis for Retail and Service Locations with MCI by Thomas Wieland Abstract In retail location analysis, marketing research and spatial planning, the market areas of stores and/or locations are a frequent subject. Market area analyses consist of empirical observations and modeling via theoretical and/or econometric models such as the Huff Model or the Multiplicative Competitive Interaction Model. The authors’ package MCI implements the steps of market area analysis into R with a focus on fitting the models and data preparation and processing. Introduction A market area (also called trading area , service area or catchment area ) is a part of the earth’s surface where the actual or potential customers of a supply location come from. This supply location can be any kind of location which provides goods and/or services and generates a geographically segmented market. In retailing, a supply location can be a single store, a retail agglomeration (planned or unplanned shopping centre) or even an entire city (Berman and Evans, 2013; Löffler, 1998). The market area of a store/location can be regarded as the spatial equivalent to its sum of all customers and/or sales. The total customers/sales of a supply location can be determined by summing the customer flows/expenditures from each geographic region in its market area (Huff and McCallum, 2008; Rodrigue et al., 2006). For practical reasons, a market area can also be divided by zones of market penetration and/or distance/travel time (Berman and Evans, 2013). Market areas of retail locations result from the consumer spatial shopping behaviour, more precisely, their store choice . Thus, a market area is influenced by many factors such as the transport costs (e.g. distance, travel time) between customers and locations and, of course, the characteristics of the competitors (e.g. perceived "attraction", pricing, image or the opportunity for multi-purpose and comparison shopping). Mostly, the market areas of competing supply locations overlap, which means that they are in spatial competition (Rodrigue et al., 2006; Wieland, 2015a). Traditionally, market area analysis includes the delineation and segmentation of market areas and can be divided into inductive-empirical and deductive-theoretical approaches. The first type consists of constructing market areas based on empirical observations such as point-of-sale (POS) surveys (customer spotting ), while in the latter approach this work is done by using mathematical market area models (Löffler, 1998). Modern market area analyses are mostly a combination of both, especially when using econometric market area models which are fitted by empirical data (Wieland, 2015a). Market area models can be used in retail location analysis to find new locations, to evaluate the existing outlets or to assess the impact of changes in the competitive landscape (Berman and Evans, 2013; Huff and McCallum, 2008). Market area analyses are also subject of governmental spatial planning in Germany (Wolf, 2012). The econometric models can also be utilized to identify variables influencing consumer decisions and market areas and to check hypotheses about these relations, which means to find out what affects store choice (Wieland, 2015a). The usage of market area models can also be transferred to other service locations, such as health services (Jia et al., 2015). This paper presents two market area models, the Huff Model and the Multiplicative Competitive Interaction (MCI) Model, and their implementation into R by the authors’ package MCI (Wieland, 2016). Yet, only the basic Huff Model formula is integrated in R by the packages SpatialPosition (Giraud and Commenges, 2016), which can be used especially for graphical visualization, and huff-tools (Pavlis et al., 2014), which combines the basic formulation with GIS functions. In contrast, the emphases of the MCI package lie on 1) fitting the MCI Model and the Huff Model via OLS (ordinary least squares) regression and nonlinear techniques, respectively, and 2) the steps of processing and transforming empirical data to be usable in the models (especially working with interaction matrices ). Market area models: theory and application Almost all market area models have in common that they are based on an attraction/utility function including transport costs and further characteristics of the supply locations which are subjects of a trade-off by the consumers. The dependent variable of these models is the store choice and/or the choice probability and/or the market shares of the stores/locations (Wieland, 2015a). The first retail market area models (Reilly, 1929; Converse, 1949) were deterministic , which means that each customer origin is assigned completely to one supply location while overlapping market The R Journal Vol. 9/1, June 2017 ISSN 2073-4859
Transcript
CONTRIBUTED RESEARCH ARTICLE 298
Market Area Analysis for Retail andService Locations with MCIby Thomas Wieland
Abstract In retail location analysis, marketing research and spatial planning, the market areas ofstores and/or locations are a frequent subject. Market area analyses consist of empirical observationsand modeling via theoretical and/or econometric models such as the Huff Model or the MultiplicativeCompetitive Interaction Model. The authors’ package MCI implements the steps of market areaanalysis into R with a focus on fitting the models and data preparation and processing.
Introduction
A market area (also called trading area , service area or catchment area) is a part of the earth’s surfacewhere the actual or potential customers of a supply location come from. This supply location can beany kind of location which provides goods and/or services and generates a geographically segmentedmarket. In retailing, a supply location can be a single store, a retail agglomeration (planned orunplanned shopping centre) or even an entire city (Berman and Evans, 2013; Löffler, 1998).
The market area of a store/location can be regarded as the spatial equivalent to its sum of allcustomers and/or sales. The total customers/sales of a supply location can be determined by summingthe customer flows/expenditures from each geographic region in its market area (Huff and McCallum,2008; Rodrigue et al., 2006). For practical reasons, a market area can also be divided by zones of marketpenetration and/or distance/travel time (Berman and Evans, 2013).
Market areas of retail locations result from the consumer spatial shopping behaviour, moreprecisely, their store choice . Thus, a market area is influenced by many factors such as the transportcosts (e.g. distance, travel time) between customers and locations and, of course, the characteristics ofthe competitors (e.g. perceived "attraction", pricing, image or the opportunity for multi-purpose andcomparison shopping). Mostly, the market areas of competing supply locations overlap, which meansthat they are in spatial competition (Rodrigue et al., 2006; Wieland, 2015a).
Traditionally, market area analysis includes the delineation and segmentation of market areas andcan be divided into inductive-empirical and deductive-theoretical approaches. The first type consistsof constructing market areas based on empirical observations such as point-of-sale (POS) surveys(customer spotting), while in the latter approach this work is done by using mathematical market areamodels (Löffler, 1998). Modern market area analyses are mostly a combination of both, especiallywhen using econometric market area models which are fitted by empirical data (Wieland, 2015a).
Market area models can be used in retail location analysis to find new locations, to evaluatethe existing outlets or to assess the impact of changes in the competitive landscape (Berman andEvans, 2013; Huff and McCallum, 2008). Market area analyses are also subject of governmental spatialplanning in Germany (Wolf, 2012). The econometric models can also be utilized to identify variablesinfluencing consumer decisions and market areas and to check hypotheses about these relations, whichmeans to find out what affects store choice (Wieland, 2015a). The usage of market area models canalso be transferred to other service locations, such as health services (Jia et al., 2015).
This paper presents two market area models, the Huff Model and the Multiplicative CompetitiveInteraction (MCI) Model, and their implementation into R by the authors’ package MCI (Wieland, 2016).Yet, only the basic Huff Model formula is integrated in R by the packages SpatialPosition (Giraud andCommenges, 2016), which can be used especially for graphical visualization, and huff-tools (Pavliset al., 2014), which combines the basic formulation with GIS functions. In contrast, the emphases ofthe MCI package lie on 1) fitting the MCI Model and the Huff Model via OLS (ordinary least squares)regression and nonlinear techniques, respectively, and 2) the steps of processing and transformingempirical data to be usable in the models (especially working with interaction matrices).
Market area models: theory and application
Almost all market area models have in common that they are based on an attraction/utility functionincluding transport costs and further characteristics of the supply locations which are subjects of atrade-off by the consumers. The dependent variable of these models is the store choice and/or thechoice probability and/or the market shares of the stores/locations (Wieland, 2015a).
The first retail market area models (Reilly, 1929; Converse, 1949) were deterministic , which meansthat each customer origin is assigned completely to one supply location while overlapping market
areas are not envisaged. Furthermore only two supply locations can be processed and the explainingvariables of the models are not founded theoretically. These gaps were filled by Huff (1962, 1963,1964) by introducing his probabilistic market area model. An important content enhancement and, atthe same time, an econometric transformation of the Huff Model was introduced in the form of theMultiplicative Competitive Interaction Model by Nakanishi and Cooper (1974, 1982).
The Huff Model
Theoretical background and formulation
The basis of the Huff Model is the following multiplicative utility function with two explanatoryvariables representing two determinants of store choice (Huff and Batsell, 1975):
Uij = Aγj d−λ
ij , (1)
where Uij is the utility of the supply location j for the customers at origin i, Aj reflects the attractionof supply location j and dij contains the transport costs customers from i have to take to reach j. Theexponents γ and λ are weighting parameters.
The attraction is translated as the size of the location due to the increasing probability for a"successful" shopping trip on condition of consumer uncertainty (the greater the locations’ offer, themore likely is to get the desired goods). The size is operationalized by the sales area of the locations.But, as the consumers’ decision costs normally rise with an increasing number of offered goods, themarginal utility of the locations’ offer decreases which is reflected by a degressive weighting of size(0 < γ < 1). The indicator for the transport costs is the travel time from i to j, reflecting the timeconsumed by a shopping trip. To integrate the opportunity costs and the perceived disutility oftraveling, the travel time is weighted negatively and progressively (|λ| > 1) (Huff, 1962).
The parameter λ also reflects the range of the offered goods dependent on the shopping frequency:the more high-order the good/less frequently purchased, the less is the disutility of transport costs(Güssefeldt, 2002). But this distance decay function of the power type can also be replaced by anexponential or a logistic function (Kanhäußer, 2007). As suggested by Huff (1962), also the attractionfunction can be logistic to better reflect the effect of decreasing marginal utility of size.
Derived from the behavioral scientific Luce choice axiom (Luce, 1959), the consumer decision inthe Huff Model is regarded as probabilistic. The probability to choose the alternative j from a set ofalternatives (j = 1, ..., n) is the quotient of its utility Uij and the sum of the utilities of all alternatives(Huff, 1962):
pij =Uij
∑nj=1 Uij
=Aγ
j d−λij
∑nj=1 Aγ
j d−λij
, (2)
where pij is the probability that the customers from origin i travel to location j, what can be calledinteraction probability , where: ∑n
j=1 pij = 1 and 0 < pij < 1. These probabilites can be interpreted asmarket shares of location j in origin i, what can be called local market shares . These shares implicitlyrepresent a final state of consumer preference patterns in a spatial equilibrium (Huff and Batsell, 1975).Thus, in the Huff Model, the revenues of a retail store/location j depend on its own attraction, theattraction of all competitors and the transport costs between all locations and the customer origins.
The expected customer/expenditure flows from i to j are estimated by multiplying the local marketshares with the local market potential (Huff, 1962):
Eij = pijCi, (3)
where Eij is the number of expected customer/purchasing power flows from origin i to location j andCi is the total market potential (number of potential customers or purchasing power) in i.
The complete market area of location j is the sum of all regional customer or purchasing powerflows, while the former represents the total number of customers and the latter equals the total salesof the location, e.g. within a year (Huff, 1964):
Tj =m
∑i=1
Eij, (4)
where Tj is the market area of j containing m submarkets, normally measured in persons or money.
The R Journal Vol. 9/1, June 2017 ISSN 2073-4859
CONTRIBUTED RESEARCH ARTICLE 300
i j dij Aj Uij ∑ Uij pij Ci Eij
i1 j1 di1 j1 Aj1 Ui1 j1 ∑ Ui1 pi1 j1 Ci1 Ei1 j1
i1 j2 di1 j2 Aj2 Ui1 j2 ∑ Ui1 pi1 j2 Ci1 Ei1 j2
i1 j3 di1 j3 Aj3 Ui1 j3 ∑ Ui1 pi1 j3 Ci1 Ei1 j3
i2 j1 di2 j1 Aj1 Ui2 j1 ∑ Ui2 pi2 j1 Ci2 Ei2 j1
i2 j2 di2 j2 Aj2 Ui2 j2 ∑ Ui2 pi2 j2 Ci2 Ei2 j2
... ... ... ... ... ... ... ... ...
im jn dim jn Ajn Uim jn ∑ Uim pim jn Cim Eim jn
Table 1: Huff interaction matrix (schematic).
Empirical usage
While working with the Huff Model, the first step is to delineate the study area itself and to record thefocused origins and locations. The explanatory variables must be observed empirically by mappingthe regarded stores/locations (Aj) and calculating travel times (dij), respectively (Huff, 1962).
All data is stored into a special kind of linear table that is called interaction matrix and is thebasis for all further calculation steps (see Table 1). The interaction matrix contains one row for each(potential) spatial interaction between the origins, i (where i = 1, ..., m), and the locations, j (wherej = 1, ..., n), so the number of rows sums up to m ∗ n. For every row, the utilities and probabilities arecalculated using the formulas mentioned above (Wieland, 2015a).
Many approaches were developed to estimate the weighting coefficients by nonlinear iterativetechniques. Huff (1962) showed a way to estimate λ with a fitting algorithm comparing expected andobserved market shares by correlation coefficients while keeping γ constantly equal to one. But, ifpij, the dependent variable in the Huff Model, was observed, probably the best way to estimate theparameters is the econometric transformation of the model which was achieved by the MultiplicativeCompetitive Interaction Model by Nakanishi and Cooper (1974) (see the next section).
In many cases, no empirical market shares are available but only observed total sales of stores orlocations, Tj. Thus, many studies focus the model fitting by nonlinear optimization algorithms basedon empirical total values (Baecker-Neuchl and Wagenseil, 2015; De Beule et al., 2014; Güssefeldt, 2002;Marinov and Czamanski, 2012; Orpana and Lampinen, 2003; Klein, 1988; Yingru and Lin, 2012). In thefollowing, a new optimization algorithm of this type is introduced which is based on the idea of thelocal optimization of attraction approach by Güssefeldt (2002) (which is the only one with an explicittheoretical fundament) and features of other mentioned procedures.
A new optimization algorithm for the Huff Model
Consider a location system with j supply locations (where j = 1, ..., n), where Tjobsdefines the real
(observed) annual sales of j. Güssefeldt (2002) argues that every store or location has its own unknownrevenue function and the sales (=revenues) depend on its own attraction (=input) and each competitors’behaviour. The attraction variable in the Huff Model, Aj, is a proxy variable for size (e.g. sales area)reflecting the extent of offers which is the input in the unknown revenue function. But this non-adjusted attraction measure does not reflect the "real" attraction because every competitor modifiesthe input in his revenue function (e.g. via marketing efforts) without any change in the size variable.
Thus, the expected sales using non-adjusted attractions in the Huff Model, Tjexp , do not correspondto the observed sales what can be measured on the local level (which means a single store/location)by the absolute percentage error :
APEj =|Tjexp − Tjobs
|Tjobs
, (5)
where Tjexp is the expected total sales of supply location j (Huff Model result), Tjobsis the observed total
sales and APEj is the absolute percentage error for supply location j.Since the algorithm by Güssefeldt (2002) addresses the local level, there is no fit measure for the
global level (which means the model fit for the complete location system). The global model fit can beevaluated in different ways, where three fit measures were already used in the context of optimizingthe Huff Model: the mean absolute percentage error (MAPE) and a PseudoR2 measure, both used by
The R Journal Vol. 9/1, June 2017 ISSN 2073-4859
CONTRIBUTED RESEARCH ARTICLE 301
De Beule et al. (2014), and the global error (GE) used by Klein (1988):
MAPE =1N
N
∑n=1
|Tjexp − Tjobs|
Tjobs
, (6)
where Tjexp is the expected total sales of location j (Huff Model result), Tjobsis the observed total sales
and N is the number of objects.
PseudoR2 =var
(Tjobs
)− var
(ε j
)var
(Tjobs
) , (7)
where Tjobsis the observed total sales and ε j is the residuum, Tjobs
− Tjexp .
GE =∑ |ε j|∑ Tjobs
, (8)
where Tjobsis the observed total sales and ε j is the residuum, Tjobs
− Tjexp .
Since the real sales are known and on condition that the location attraction and the sales are relatedto each other, the attraction Aj can be described as a function of the sales (Güssefeldt, 2002):
Aj = a + bTj, (9)
where Aj is the predicted attraction of location j, Tj is the total sales of j, a is the intercept and b isthe slope of the attraction function. As every supply location has its own revenue function (eachcompetitor has an individual factor use), the attraction function is also different for each store/location.
On condition that an interval is known, this function can be parametrized by calculating the slopeusing the difference quotient and the intercept, thereafter (Güssefeldt, 2002). Unlike in the mentionedapproach, this function must pass the origin because in the Huff Model with its multiplicative utilityfunction (Formula 1), an attraction equal to zero (Aj = 0) must result in an utility equal to zero(Uij = 0) which results in local market shares equal to zero (pij = 0, Formula 2). Thus, the totalsales (Formulae 3 and 4) must be equal to zero (Tj = 0), too. This is a logical consequence from thetheoretical basement of the Huff Model but is also part of the principle of logical consistency of marketshares in marketing research (Cooper and Nakanishi, 2010).
Thus, formula 9 has no intercept (a = 0) which means a directly proportional relation betweensales and attraction. But, as the revenue function differs by each supply location, the attraction functionmust also be parametrized for each store/location. The slope in the attraction function of location jcan be calculated via:
bj =Aj − Aj0
Tjexp − Tj0=
Aj
Tjexp
, (10)
where bj is the slope of the attraction function for j, Aj is the non-adjusted attraction of location j (suchas sales area), Tjexp is the total expected sales of j predicted by the Huff Model, Aj0 is the attractionwhen the sales are equal to zero and Tj0 represents the sales when the attraction is equal to zero, bothequal to zero (Aj = 0⇔ Tj = 0). The adjusted attraction of supply location j can be calculated via:
Ajadj= bjTjobs
, (11)
where Ajadjis the adjusted attraction of j, bj is the slope of the attraction function for j and Tjobs
represents the real (observed) sales of j.The relations mentioned above can be brought together in an optimization algorithm for the Huff
Model with respect to a location system with j locations (j = 1, ..., n) containing the following 8 steps:
1. Set a tolerance value, tolAPE, to define which difference between the real and the expected salesof location j is accepted, e.g. tolAPE = 5, which means an accepted deviation of +/- 5 percent.Define a transport costs weighting function (power, exponential or logistic) and the weightingparameter(s) λ for formula 2.
2. Calculate the market areas for the location system and the total sales of the n locations usingformulae 2 to 4 with γ = 1 and the transport costs weighting as defined in step 1.
3. Calculate the absolute percentage error between the expected and the observed total sales oflocation j (APEj) by formula 5. If the error APEj is smaller than the tolerance tolAPE, no furtherlocal optimization for location j is needed, so you can repeat step 3 with location j + 1. IfAPEj > tolAPE, go to step 4.
4. Calculate the slope of the attraction function by formula 10. Calculate the adjusted attractionvia formula 11.
The R Journal Vol. 9/1, June 2017 ISSN 2073-4859
CONTRIBUTED RESEARCH ARTICLE 302
5. Save the adjusted attraction of location j, Ajadj, in the actual Huff interaction matrix and repeat
the procedure beginning at step 2 with the next location, j + 1.
6. Repeat steps 2 to 5 for all locations (j = 1, ..., n).
7. After the last location j = n was processed, calculate the global fit measures for the completelocation system by formulae 6 to 8.
8. Repeat steps 2 to 7 for the complete location system until the local optima and/or the globaloptimum is sufficiently approximated. The former can be evaluated by the tolerance value (step3) for every j location, while the latter can be controlled by the global fit measures (step 7).
The Multiplicative Competitive Interaction (MCI) Model
Theoretical background and formulation
The Multiplicative Competitive Interaction Model (in short: MCI Model ) is based on the Huff Modelbut also belongs to the model family of market share models which were developed in marketingscience. Thus, it can be regarded as a crossover of these two model families (Cliquet, 2013). Thefundamental theorem behind market share models is the following simple relationship between thecompetitors’ characteristics and their market shares (Cooper and Nakanishi, 2010):
MSj =Aj
∑nj=1 Aj
, (12)
where MSj is the market share of competitor j and Aj is the attraction of j. This leads to twocharacteristics of market shares which are summarized as logical-consistency requirements for marketshares: 0 < MSj < 1, and ∑n
j=1 MSj = 1, respectively (Cooper and Nakanishi, 2010). This marketshare logic is obviously related to the probabilistic concept of the Huff Model when the term "marketshares" is replaced by "choice probabilities", "interaction probabilities" or "local market shares" and theconstruct "attraction" is replaced by the construct "utility" (Wieland, 2015a).
Derived from the Huff Model, the MCI Model is explicitly formulated to regard a market whichis segmented into i submarkets (i = 1, ..., m) and which is served by j suppliers (j = 1, ..., n). Theattraction function is multiplicative and consists of h (h = 1, ..., H) explanatory variables which areweighted exponentially to reflect their sensitivity (Nakanishi and Cooper, 1974):
pij =∏H
h=1 Aγhhj
∑nj=1 ∏H
h=1 Aγhhj
, (13)
where pij is the probability that the customers from submarket i choose supplier j, Ahjis the value of
the h-th variable describing the object j, γh is the weighting parameter for the sensitivity of pij withrespect to the variable h. The next steps (customer or expenditure flows, total market area) can betaken analogously to the Huff Model (Formulae 3 and 4).
The market can be subdivided in any kind of submarkets (e.g. customer groups, time periods,geographic areas). When the market is segmented geographically, it is a matter of a Spatial MCIModel , especially when integrating transport costs as an explanatory variable (Cliquet, 2013; Huff andMcCallum, 2008). The MCI Model can also be regarded as a generalization of the Huff Model, whilethe Huff Model can be considered as a special case of multiplicative competitive interaction model.
The log-centering transformation
The models mentioned above are deterministic (no random variation) and nonlinear models whichcannot be estimated directly by common econometric techniques but by iterative algorithms (see theformer section) which do not allow statements about the statistical significance of the explanatoryvariables and other inference statistics. The main breakthrough of the MCI Model is the transformationof the nonlinear structure into a linear stochastic model which can be estimated via OLS (OrdinaryLeast Squares) regression (Huff and McCallum, 2008).
This requires a re-arrangement of the model to be linear in parameters which is achieved by amulti-step transformation of the variables using geometric means and logarithms for standardizationand linearization called the log-centering transformation (Nakanishi and Cooper, 1974):
log( pij
pi
)=
H
∑h=1
γh log
(Ahj
Ahj
)+ log
(εij
εi
), (14)
The R Journal Vol. 9/1, June 2017 ISSN 2073-4859
CONTRIBUTED RESEARCH ARTICLE 303
where pi and Ahjare the geometric means of pij and Ahj
, respectively, and εi is the geometric meanof the disturbance term (residuum) εij which is added to the original model to be stochastic. Thegeometric means of pij and any submarket-related explanatory variable (such as travel time, dij) arecalculated on the submarket level. As in the original model, the transformation does not include anintercept (regression through the origin) to match the logical-consistency requirements for marketshares (Nakanishi and Cooper, 1982).
Once the variables are transformed, the model function is linear in its parameters and can beprocessed as a multiple linear regression model to be estimated by OLS regression (Rawlings et al.,1998). Thus, the model allows to test hypotheses about the influence of store/location characteristics(such as sales area, pricing) and transport costs (such as travel time, distance) on the local market sharesin the submarkets (customer origins) by interpreting the regression coefficients and their inferencestatistics (Nakanishi and Cooper, 1974, 1982; Huff and McCallum, 2008).
After an estimation of the parameters, they can be included as exponents in the original nonlinearmodel (Formula 13) to be utilized for market share/market area predictions (Nakanishi and Cooper,1982; Huff and McCallum, 2008). It is also possible to integrate dummy variables reflecting qualitativeinformation (such as brands or store chains) or an intercept (if necessary). Since the former causesproblems in the multiplicative attraction/utility function (multiplication by zero) and the latter iscontrary to the logical consistency requirement, a different retransformation of the model called theinverse log-centering transformation is required (Nakanishi and Cooper, 1982):
yij =H
∑h=1
γh log
(Ahj
Ahj
), (15)
pij =eyij
∑nj=1 eyij
, (16)
where yij is the transformed attraction/utility function and pij is the expected response variable, theinteraction probabilities/market shares of the supplier j in the submarket i. Thus, in that cases, thevariables are processed as they were transformed in formula 14.
Empirical usage
In the first step, a MCI Model analysis requires the formulation of hypotheses and/or researchquestions addressing the influence of the H explanatory variables on the market shares based ontheoretical considerations. The Huff Model can be regarded as a theoretical base since Huff (1962)assumes size and transport costs as explanatory variables which can be tested by the MCI Model(Kubis and Hartmann, 2007; Suárez-Vega et al., 2015). But the number of additional influences testedis nearly unlimited and ranges from further store/location attributes like age or price level (Huffand McCallum, 2008; Tihi and Oruc, 2012) to the surrounding coupling and competition potential(Wieland, 2015a) to consumer-related subjective variables (Cliquet, 2013; González-Benito et al., 2000).
Since the delineation of the study area and the identification of the relevant competing locationshave an enormous impact on the results, these definitions should be made corresponding to the LIFO(little in from outside) and LOFI (little out from inside) principles (Huff and McCallum, 2008). Thismeans that the majority of shopping interactions should take place within the study area.
The supplier characteristics can be obtained by mapping the relevant stores/locations and addi-tional research. The market shares, pij, cannot be observed directly but have to be calculated based onempirically observed shopping interactions (shopping trips and/or expenditures) which are collectedon the individual or household level. In a representative household survey (or, if not possible, apoint-of-sale survey), every respondent is asked for the destination(s) of the last shopping trip(s) atthe j location(s) and/or the associated expenditures (Huff and McCallum, 2008; Wieland, 2015a).
To calculate the local market shares of shopping trips and/or expenditures, the individual datamust be aggregated on the submarket level:
pij =Oij
∑nj=1 Oij
, (17)
where pij is the empirical market share of supplier j in submarket i and Oij equals the observedfrequencies/expenditures of the customers in i with respect to supplier j. ∑n
j=1 Oij is the empiricalequivalent to the total customer/purchasing power potential in i, Ci, in the Huff Model (formula3). As in the Huff Model, the empirical market shares, pij, and the observed explanatory variables(A1, ..., AH , dij) are stored in an interaction matrix (see Table 2).
Mostly, the observed variables cannot be processed directly: the log-centering transformation
The R Journal Vol. 9/1, June 2017 ISSN 2073-4859
CONTRIBUTED RESEARCH ARTICLE 304
i j pij A1j A2j A3j ... AHj dij
i1 j1 pi1 j1 A11 A21 A31 ... AH1 di1 j1
i1 j2 pi1 j2 A12 A22 A32 ... AH2 di1 j2
i1 j3 pi1 j3 A13 A23 A33 ... AH3 di1 j3
i2 j1 pi2 j1 A11 A21 A31 ... AH1 di2 j1
i2 j2 pi2 j2 A12 A22 A32 ... AH2 di2 j2
... ... ... ... ... ... ... ... ...
im jn pim jn A1n A2n A3n ... AHn dim jn
Table 2: MCI interaction matrix (schematic).
requires every variable to be ratio-scaled, non-negative and greater than zero. Thus, also marketshares equal to zero, pij = 0, what may occur, are invalid. A simple way to correct the raw dataaccepting a small bias is to increase the variable by a small constant (Kubis and Hartmann, 2007;Wieland, 2015a) and/or to aggregate the submarkets (Perales, 2002; Tihi and Oruc, 2012). Anyway,the raw data should be adjusted by removing singular instances and outliers to fulfil the LIFO/LOFIrequirements mentioned above (Huff and McCallum, 2008; Wieland, 2015a).
Interval scaled variables (e.g. consumer judgements in rating scales) which may contain negativevalues can be transformed by the zeta-squared transformation (Cooper and Nakanishi, 1983):
zhij=
Xhij− Xhi
ρhi
, (18)
ζ2hij
=
{ (1 + z2
hij
)if zhij
≥ 0(1
1+z2hij
)if zhij
≤ 0, (19)
where zhijis the z-standardized score of Xhij
and ζ2hij
is the zeta-squared value resulting from zhij.
Nominal scaled variables (e.g. store chains, brands) cannot be processed directly in the MCI Modelbut can be transformed into dummy variables which are ignored in the log-centering transformation.
All in all, an econometric market share/market area analysis using the MCI Model on condition ofexisting research questions and hypotheses contains the following 8 steps:
1. Define the study area and divide it into i submarkets (here: customer origins).
2. Obtain the relevant variables: shopping trips and/or expenditures on the individual/householdlevel (Oij), H characteristics of the j regarded suppliers and the transport costs, dij.
3. If necessary, correct or transform the variables to match the requirements of the log-centeringtransformation: if some Oij or other variables are equal to zero, add a constant, aggregate thesubmarkets in the study area and remove outliers, respectively. If there are interval scaledvariables, transform them by formulae 18 and 19. If there are nominal variables, transform themto dummy variables.
4. Calculate the market shares, pij, by formula 17.
5. Store the submarkets, suppliers, local market shares and the H explanatory variables in aninteraction matrix (see Table 2).
6. Apply the log-centering transformation (formula 14) to the previously created interaction matrix.
7. Apply the OLS regression to the log-centering transformed interaction matrix with log( pijpi)
as dependent variable treating the model like any other multiple linear regression model:determine the estimators, compute fit measures and inference statistics for the hypothesis tests.
8. Interpret the model results. For market share predictions, insert the estimated parameters in thenonlinear model using formula 13 or formulae 15 and 16.
R implementation
As outlined in the former section, market area analysis for retail and service locations requires amixture of descriptive and inference statistics, iterative optimization and, of course, a lot of processing
The R Journal Vol. 9/1, June 2017 ISSN 2073-4859
CONTRIBUTED RESEARCH ARTICLE 305
and preparation of empirical data which may be even more complex (or, at least, more time-consuming)than the models themselves. Except the Huff Model basis formulation which is implemented in Rby the packages SpatialPosition and huff-tools none of the mentioned models were integrated in Ryet. The former mentioned package is focused on graphical visualization and other spatial interactionmodels while the latter combines the basic Huff formula with GIS-related functions. The MultiplicativeCompetitive Interaction Model and the related procedures of data handling are just as little integratedin R as the OLS and nonlinear fitting procedures for the Huff Model and the MCI Model, respectively.The motivation of the presented package MCI is to fill this gap.
The MCI package
The Huff Model and the Multiplicative Competitive Interaction (MCI) Model are implemented in theMCI package which is focused on:
1. Fitting the mentioned models by empirically observed data using the MCI linearization (log-centering transformation) combined with OLS regression (functions mci.fit(), mci.transmat()and mci.transvar()) and the Huff Model optimization algorithm described above (functionshuff.attrac() and huff.fit()).
2. The steps of data preparation and processing to make empirical data usable in these models,especially the creation and processing of interaction matrices used in MCI analyses which issubject of the function ijmatrix.create().
The MCI package also provides tools that can be used for descriptive analyses of empirical orestimated market areas, such as zoning (see the function shares.segm()) and, of course, the basicHuff and MCI formulations (see the functions mci.shares() and huff.shares(), respectively). Thecorrection of variables to match the MCI requirements can be done by the functions var.correct()and var.asdummy().
The input of the most functions is required to be a "data.frame" where the first function argumentis the dataset name, followed by a set of variable names (columns) each one in double quotation marksand further function arguments. Also, the output of nearly every function is a "data.frame", exceptthe mci.fit() function which returns an object of type "lm" and model.fit() which returns a "list".Three functions (huff.decay(), model.fit() and shares.total()) also provide an optional graphicaloutput.
The package does not import any other packages (except some already implemented functionsfrom stats and graphics, of course) and does not contain any non-R scripts.
The data used in the following examples is distributed over several datasets to demonstrate theseveral data sources and the components of a market area analysis, respectively. In fact, there is noneed to split the working data like this, but, of course, it is recommended since the voluminous datamay lead to confusion.
Examples
Analyzing market areas of single locations
The first example deals with a more descriptive analysis of empirical market areas obtained by a POSsurvey (customer spotting technique). The package-included example dataset shopping1 is a surveyconducted at two supply locations in the east of Karlsruhe, Germany, in May 2016.
The dataset contains 434 surveyed individuals at both locations, including 410 cases from the mainsurvey and 24 cases from the pretest. Amongst other things, the respondents were asked about theirplace of residence, their shopping preferences in general (last shopping trip with respect to differentgoods) and their on-site shopping behaviour (duration of stay, expenditures). The customers’ origin isstored in the column resid_code. The variable POS indicates the location: "POS1" is a town centre andthus, an evolved retail agglomeration, while "POS2" is an out-of-town planned shopping centre.
It should be noted that a POS survey mostly does not fulfill the requirements of statistical represen-tativity: besides that shopping behaviour differs by weekdays, time periods and, of course, weather,independent from the size and heterogeneity of the sample, the statistical population is unknown.
library(MCI)data(shopping1)# The survey datasetdata(shopping2)# Dataset with distances and travel times
The R Journal Vol. 9/1, June 2017 ISSN 2073-4859
CONTRIBUTED RESEARCH ARTICLE 306
The first step is to filter the dataset since only the interviews are needed which were conducted atboth supply locations simultaneously. We subset the relevant data and store it into a new workingdata frame (shopping1_adj) which we use to create an interaction matrix of type "data.frame" calledijmatrix using the function ijmatrix.create():
shopping1_adj <- shopping1[(shopping1$weekday != 3) & (shopping1$holiday != 1)& (shopping1$survey != "pretest"),]# Removing every case from tuesday, holidays and the ones belonging to the pretest
ijmatrix <- ijmatrix.create(shopping1_adj, "resid_code", "POS", "POS_expen")# Creates an interaction matrix based on the observed frequencies (automatically)# and the POS expenditures (Variable "POS_expen" separately stated)
The resulting data frame (rows 1-3 are displayed) contains the interaction (from each origin toeach destination) in the first column (interaction) and each origin and destination in the columnsresid_code and POS, respectively, both adopted from the column names in the input dataset. Theabsolute number of respondents and the total value of expenditures from the origins, i, at the des-tinations, j, is stored in freq_ij_abs and freq_ij_abs_POS_expen, respectively. The freq_i_total*columns contain the total number/sum of observed customers/expenditures from each origin, whilethe p_ij_obs* are the local market shares of customers and expenditures, pij, respectively. The namesare set automatically based on the original variable names (e.g. POS_expen).
The next step is the zoning of the empirical market areas by driving time using the functionshares.segm() and the travel time stored in the shopping2 dataset. The routes were calculated in Rusing the package ggmap (Kahle and Wickham, 2013). We want to know how much of the customersand expenditures come from origins with a maximal travel time of 10, 20, 30 and more than 30 minutes:
# Segmentation by travel time using the number of customers/visitors# Parameters: interaction matrix (data frame), columns with origins and destinations,# variable to divide in classes, absolute frequencies/expenditures, class segments
The "data.frame" output of the used function contains the segment classes, named based on theinput variable name (d_time_class), e.g. d_time_class="0-10" represents the zone up to 10 minutesof travel time. The further columns contain the sums and the percentage shares for each location,respectively, both named based on the original values (e.g. POS1_abs, POS1_rel).
We see that, at "POS1" (town centre) 108 surveyed customers come from an origin up to 10 minutesof driving time what corresponds to 72.48% of all customers. At POS2 (out-of-town planned shoppingcentre), only 40.28% of the visitors are generated from places of residence where to drive less or equalto 10 minutes. The difference is more clear when looking at the expenditures: at the town centre,76.42% of the observed expenditures are spent by customers from origins of the first driving time class,while the share in the corresponding class at the shopping centre is 34.35%.
Since the survey was only conducted at these two supply locations but not at other possible com-petitive locations, it would not make any sense to use these empirical market areas in an econometricmarket area model. But, of course, it is possible to analyze the distance decay on the level of singlelocations.
Before fitting and plotting distance decay functions, some corrections of the data have to bemade and, since we don’t have local market shares, the dependent variable reflecting the intensity ofinteraction (surveyed visitors per 1,000 inhabitants) has to be calculated:
# Calculating the dependent variable# visitper1000: surveyed customers per 1,000 inhabitants of the origin
ijmatrix_alldata <- ijmatrix_alldata[(!is.na(ijmatrix_alldata$visitper1000))& (!is.na(ijmatrix_alldata$d_time)),]# Removing NAs (data for some outlier origins and routes not available)
POS1 <- ijmatrix_alldata[ijmatrix_alldata$POS == "POS1",]# Dataset for POS1 (town centre)POS2 <- ijmatrix_alldata[ijmatrix_alldata$POS == "POS2",]# Dataset for POS2 (out-of-town shopping centre)
A fit of distance decay functions can be done with the package function huff.decay() whichcompares four types of possible distance decay functions (linear, power, exponential, logistic). Forboth locations, "POS1" and "POS2", we test the influence of distance in km (d_km) and travel time inminutes (d_time) on the dependent variable (visitper1000):
huff.decay(POS1, "d_km", "visitper1000")Model type Intercept p Intercept Slope p Slope R-Squared Adj. R-squared
The huff.decay() function returns a "data.frame" containing a summary of the regression resultsand a plot of the four estimated functions and the observed values (see Figure 1). The output showsthe model estimators (Intercept and Slope), their p-values (p Intercept, p Slope) and the goodnessof fit measures (R-Squared, Adj. R-Squared) for every model type.
Figure 1: Distance decay functions for POS1 (top) and POS2 (bottom).
Note that the nonlinear models are not fitted via nonlinear regression but by linearization andretransformation, thereafter, since the usually used distance decay functions mentioned above areintrinsically linear (Rawlings et al., 1998). Internally, the linearized models are fitted via lm(). It isimportant to say that the usage of logarithmic transformations has, apart from many advantages of lin-earization, also serious drawbacks: with respect to gravity models, Silva and Tenreyro (2006) point outthat OLS fitting of log-transformed data produces significant biases depending on heteroscedasticity.The same issue is also addressed by Manning and Mullahy (2001).
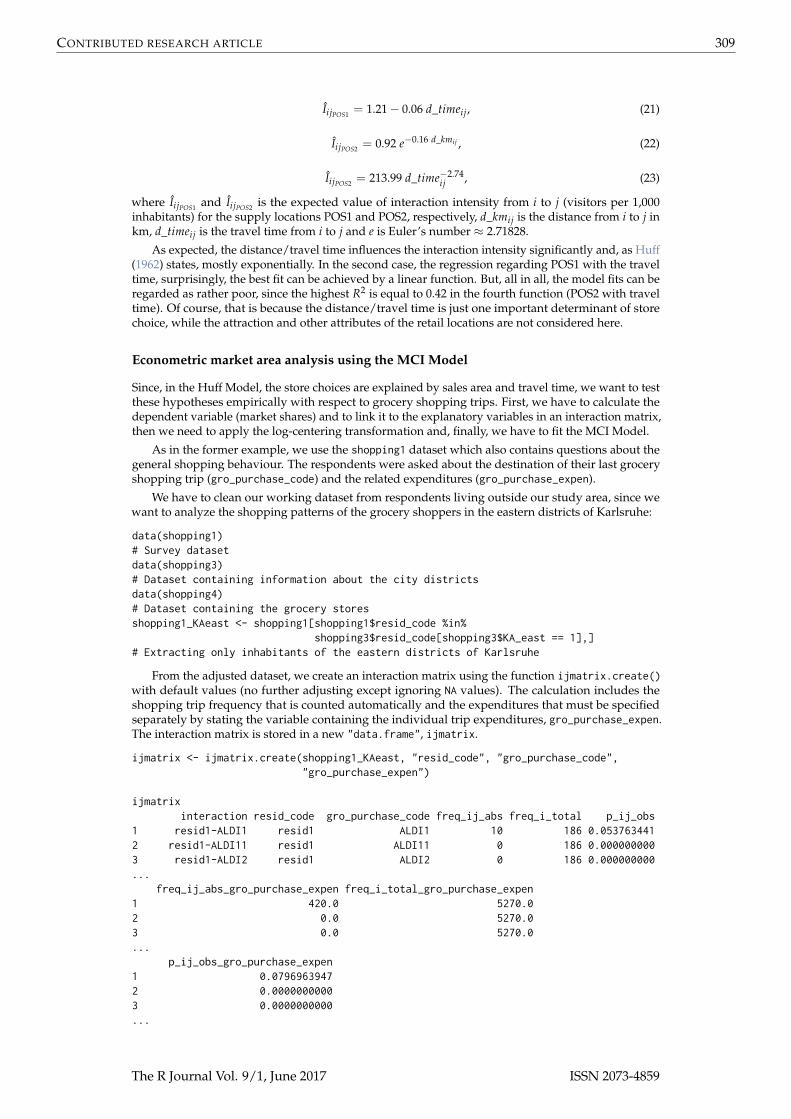
Huff (1962) assumed that a power function fits best to describe the distance decay. Since other typesof distance decay functions are possible, Kanhäußer (2007) uses the explained variance as a criterionfor choosing the best function type. Note that, strictly speaking, the R2 values of the models can notbe compared directly since they rest on different dependent variables. In the practical application, thechoice for the preferred function type should be based on examining the model results and the plot asa case-by-case decision. With respect to R2 the best distance decay functions for the two locations are:
IijPOS1 = 1.91 d_km−1.53ij , (20)
The R Journal Vol. 9/1, June 2017 ISSN 2073-4859
CONTRIBUTED RESEARCH ARTICLE 309
IijPOS1 = 1.21− 0.06 d_timeij, (21)
IijPOS2 = 0.92 e−0.16 d_kmij , (22)
IijPOS2 = 213.99 d_time−2.74ij , (23)
where IijPOS1 and IijPOS2 is the expected value of interaction intensity from i to j (visitors per 1,000inhabitants) for the supply locations POS1 and POS2, respectively, d_kmij is the distance from i to j inkm, d_timeij is the travel time from i to j and e is Euler’s number ≈ 2.71828.
As expected, the distance/travel time influences the interaction intensity significantly and, as Huff(1962) states, mostly exponentially. In the second case, the regression regarding POS1 with the traveltime, surprisingly, the best fit can be achieved by a linear function. But, all in all, the model fits can beregarded as rather poor, since the highest R2 is equal to 0.42 in the fourth function (POS2 with traveltime). Of course, that is because the distance/travel time is just one important determinant of storechoice, while the attraction and other attributes of the retail locations are not considered here.
Econometric market area analysis using the MCI Model
Since, in the Huff Model, the store choices are explained by sales area and travel time, we want to testthese hypotheses empirically with respect to grocery shopping trips. First, we have to calculate thedependent variable (market shares) and to link it to the explanatory variables in an interaction matrix,then we need to apply the log-centering transformation and, finally, we have to fit the MCI Model.
As in the former example, we use the shopping1 dataset which also contains questions about thegeneral shopping behaviour. The respondents were asked about the destination of their last groceryshopping trip (gro_purchase_code) and the related expenditures (gro_purchase_expen).
We have to clean our working dataset from respondents living outside our study area, since wewant to analyze the shopping patterns of the grocery shoppers in the eastern districts of Karlsruhe:
data(shopping1)# Survey datasetdata(shopping3)# Dataset containing information about the city districtsdata(shopping4)# Dataset containing the grocery storesshopping1_KAeast <- shopping1[shopping1$resid_code %in%
shopping3$resid_code[shopping3$KA_east == 1],]# Extracting only inhabitants of the eastern districts of Karlsruhe
From the adjusted dataset, we create an interaction matrix using the function ijmatrix.create()with default values (no further adjusting except ignoring NA values). The calculation includes theshopping trip frequency that is counted automatically and the expenditures that must be specifiedseparately by stating the variable containing the individual trip expenditures, gro_purchase_expen.The interaction matrix is stored in a new "data.frame", ijmatrix.
The interaction matrix (rows 1-3 are displayed) shows the interaction (origin-destination) inthe first column interaction and the origins and destinations in the columns resid_code andgro_purchase_code, respectively, adopted from the column names in the input dataset shopping1_KAeast.The absolute number of respondents and the total value of expenditures from the origins, i, at thedestinations, j, is stored in freq_ij_abs and freq_ij_abs_POS_expen, respectively. The names are setautomatically based on the original variable names (e.g. POS_expen). The freq_i_total* columns con-tain the total number/sum of observed customers/expenditures from each origin, while the p_ij_obs*are the local market shares of customers and expenditures, pij, respectively.
Next, we calculate the total customers and expenditures and the corresponding over-all marketshares, respectively, using the function shares.total():
The resulting tables (rows 1-4 are displayed) contain 42 suppliers: in the first row, the store "ALDI1"has a share of about 3.94% of the obtained shopping trips and about 4.92% of the related expenditures.Obviously, the survey contains several singular instances and outliers: as can be seen in the secondand third row of the interaction matrix, there are observed market shares equal to zero. The table withthe total market areas show several stores only observed once (e.g. "ALDI11").
Thus, this interaction matrix cannot be processed in the MCI Model since it would not pass thelog-centering transformation. Consequently, the data has to be “cleaned” distinctly by creating acorrected and simplified interaction matrix. Only stores obtained more than twice are incorporatedand the absolute values are increased by a small constant of 0.1 before calculating the shares.
# Removing singular instances/outliers (remSing = TRUE) incorporating# only suppliers which are at least obtained three times (remSingSupp.val = 2)# Correcting the values (correctVar = TRUE)# by adding 0.1 to the absolute values (correctVar.val = 0.1)
There are still some observations that have to be excluded because, in the survey, any kind ofgrocery shopping trip was inquired, including non-relevant stores and shopping channels (such asbakeries, health food shops and even the local weekly market). There has been some incompleteanswers as well (gro_purchase_code="X_INCOMPLETE_STORE".) Thus, the interaction matrix has to beadjusted again:
Now, the interaction matrix (rows 1-3 are displayed) consists of 11 customer origins and 11
The R Journal Vol. 9/1, June 2017 ISSN 2073-4859
CONTRIBUTED RESEARCH ARTICLE 311
suppliers (121 rows). Structured as mentioned above, there are no zero values anymore and theabsolute values (freq_ij_abs and freq_ij_abs_POS_expen) are increased by 0.1:
In the next step, we have to add the travel times stored in the dataset shopping2 (the routecalculation was made in R using the ggmap package) and the grocery store characteristics (sales areain sqm and store chain, collected in June 2016 subsequent to the survey) from the shopping4 dataset:
ijmatrix_dist <- merge (ijmatrix_adj, shopping2, by.x="interaction", by.y="route")# Include the distances and travel times (shopping2)
The next step is to apply the necessary log-centering transformation to the interaction matrix. Thefunction mci.transmat() processes this transformation with a given number of MCI variables. Thefunctions output is a "data.frame" containing the transformed variables (ready for OLS regression):
In the transformed interaction matrix (2 x 3 rows are displayed), the column names of the origins(resid_code) and destinations (gro_purchase_code) are adopted from the columns in the input dataset.The metric MCI variables are marked with a "_t" to indicate that they were transformed (e.g. d_time_tis the log-centering transformation of d_time which contains the travel time, dij). The transformedinteraction matrix is in alphabetical order with respect to the origins (first) and the locations (second).If stated, the function recognizes dummy variables which are, of course, not transformed.
To combine transformation and fitting in one step, we use the function mci.fit() whose parame-ters are equal to those in mci.transmat() except that the column containing the market shares mustbe stated as the first variable. The default is a no-intercept model (to be set by the logical argumentorigin with default TRUE). The function returns an object of type "lm" which can be accessed viasummary():
Residual standard error: 0.4458 on 119 degrees of freedomMultiple R-squared: 0.4603, Adjusted R-squared: 0.4512F-statistic: 50.74 on 2 and 119 DF, p-value: < 2.2e-16
The output can be interpreted like any other linear model fitted by lm(). The results show a strongsignificant influence of the explanatory variables (travel time and sales area) on the observed localmarket shares (both p < 0.001). As the estimators are exponents in the original nonlinear model,the impact of travel time can be regarded as negative superlinear (λ = −1.2443) while the effect ofthe sales area is positive sublinear (γ = 0.9413). Thus, the model fit corresponds to the theoreticalunderpinning of the utility function in the Huff Model (Huff, 1962).
For the interpretation of the explained variance it is noteworthy that the common formulation ofR2 is only designed for models that include an intercept. For no-intercept models, in R, the functionsummary() returns a modified R2 which reflects the explained variance of the no-intercept model butcan not be compared to the related fit measure in a model including an intercept. Apart from this, themodel fit seems to be in need of improvement (R2 = 0.4458 and Adj.R2 = 0.4512, respectively).
But the market shares with respect to customer flows are not to be confused with market shares ofexpenditures: especially in grocery shopping, there are different kinds of shopping trips, such as lessfrequent major trips with high efforts and expenditures and more frequent and fast fill-in trips withlow expenditures (Reutterer and Teller, 2009). Thus, the MCI analysis is repeated with the shares ofexpenditures (p_ij_obs_gro_purchase_expen) as dependent variable:
Residual standard error: 0.8683 on 119 degrees of freedomMultiple R-squared: 0.4954, Adjusted R-squared: 0.487F-statistic: 58.43 on 2 and 119 DF, p-value: < 2.2e-16
As in the first model, both predictors are highly significant, but, in contrast, the impact of size(sales area) is also superlinear. The model fit is a little better than in the first model, what may alsobe explained by a smaller bias based on the variable correction above: due to their dimensions, theincrease of the absolute values by 0.1 has a smaller impact on the expenditures than on the shoppingtrips.
The R Journal Vol. 9/1, June 2017 ISSN 2073-4859
CONTRIBUTED RESEARCH ARTICLE 313
The utility/attraction function (or, more precisely, its deterministic component) with respect to theshopping trips (first model) can be written as:
Uijtrips = salesarea_qm0.9413j d_time−1.2443
ij , (24)
where Uijtrips is the utility/attraction of grocery store j for the customers in submarket/origin i, derivedfrom the shares of empirically obtained shopping trips, salesarea_qmj is the sales area of store j andd_timeij is the travel time from i to j.
In consequence, the utility function is included in the Huff/MCI probability function. Thus, thelocal market shares of shopping trips can be estimated by:
pijtrips =salesarea_qm0.9413
j d_time−1.2443ij
∑nj=1 salesarea_qm0.9413
j d_time−1.2443ij
, (25)
where pijtrips is the expected market share of shopping trips of the grocery store j in the submarket i.Analogously, the utility/attraction function and the market share/probability function of the
expenditures (second model) are:
Uijexpen = salesarea_qm2.0409j d_time−2.3788
ij , (26)
pijexpen =salesarea_qm2.0409
j d_time−2.3788ij
∑nj=1 salesarea_qm2.0409
j d_time−2.3788ij
, (27)
where pijexpen is the expected market share of expenditures of the grocery store j in the submarket i.A market share prediction can be done using the functions mci.shares() and huff.shares().
These functions can be used similarly but differ in the formulation of the utility/attraction function:according to the Huff Model, huff.shares() allows only two explanatory variables (attraction/sizeand transport costs) but three types of weighting function for each variable (power, exponential,logistic). The function mci.shares() is able to process any number of variables but only using thepower function from the MCI Model either retransformed or transformed (inverse log-centeringtransformation).
We predict market shares using the function mci.shares() and the estimations from the sec-ond model (expenditures). The variables and their weightings are function arguments which haveto be stated one after another (variable1,weighting1,variable2,weighting2, ...). The estimatedinteraction matrix containing the predicted shares is stored in a new dataset, expen:
# MCI market share prediction with two variables# salesarea_qm (weighting power function with exponent equal to 2.0409)# d_time (weighting power function with exponent equal to -2.3788)
The interaction matrix (rows 1-3 are displayed) contains the submarkets (resid_code), the suppliers(gro_purchase_code), the interaction between them (interaction), the explanatory variables (d_time,salesarea_qm) and the steps of calculation, named according to the Huff Model (U_ij, sum_U_ij) andresulting in the local market shares stored in the last column (p_ij). The sum of p_ij is equal to the
The R Journal Vol. 9/1, June 2017 ISSN 2073-4859
CONTRIBUTED RESEARCH ARTICLE 314
sum of submarkets, since, on the submarket level, the local market shares sum up to one.
Before using the MCI Model for further market share predictions, the validity of the modelshould be improved since store choices are, of course, not only influenced by size and transport costs.Especially in grocery retailing, there is a great heterogeneity between the store formats (supermarket,discounter etc.) and the store chains, such as concerning the image or price level of a chain. Thesemore qualitative differences should be reflected in a grocery store market area model. According toWieland (2015a), the model above is extended with dummy variables reflecting the grocery store chain.
The chains are already stored in the interaction matrix (column store_chain, adopted fromshopping4). As they are nominal scaled variables in character format, they have to be converted todummy variables using the function var.asdummy() which returns a new "data.frame" containingcorresponding dummy variables (0, 1) named automatically based on the original characteristics andmarked with "_DUMMY". Since they are in the same order, they can be directly attached:
chain <- var.asdummy(ijmatrix_alldata$store_chain)# Converting the character vector (column store_chain) to dummy variables# and storing in a new data frame
ijmatrix_alldata <- cbind(ijmatrix_alldata, chain)# Add dummy dataset to interaction matrix
In the next step, we repeat the fitting of the second MCI Model (expenditures) including the newdummy variables. Since one dummy is explained by the content of all the others, the last dummy isnot used:
Residual standard error: 0.7955 on 113 degrees of freedomMultiple R-squared: 0.5978, Adjusted R-squared: 0.5694F-statistic: 21 on 8 and 113 DF, p-value: < 2.2e-16
The independent variables d_time_t and salesarea_qm_t are still statistically significant (both
The R Journal Vol. 9/1, June 2017 ISSN 2073-4859
CONTRIBUTED RESEARCH ARTICLE 315
p < 0.001) but especially the latter estimator has strikingly decreased. Two dummy variables are alsosignificant: Lidl_DUMMY (p < 0.05) and Real_DUMMY (p < 0.001). Regarding R2 and Adj.R2, the modelvalidity could be improved compared to the former model.
As this new model includes dummies, it would not make any sense to insert the estimatedparameters in the multiplicative MCI function: if one dummy variable is equal to zero, the completeterm is equal to zero. Thus, in this case, it is necessary to use the inverse log-centering transformationwhich leads to the following transformed utility/attraction function:
yijexpen = −2.56243 log
(d_time_tij
˜d_time_ti
)+ 1.31622 log
salesarea_qm_tj
˜salesarea_qm_tj
−0.59177Lidl_DUMMYj + 1.32882Real_DUMMYj,
(28)
where yijexpen is the log-centering transformed utility/attraction of store j for the customers in i,˜d_time_ti and ˜salesarea_qm_tj are the geometric means of d_time_tij and salesarea_qm_tj, respectively,
and Lidl_DUMMYj and Real_DUMMYj are dummy variables reflecting if the store chain of j is Lidlor Real, respectively. Now, the local market shares are defined by:
pijexpen =eyijexpen
∑nj=1 eyijexpen
, (29)
where pijexpen is the expected market share of store j in i and e is Euler’s number ≈ 2.71828.
We repeat the market shares prediction including the dummies and their weights. The inverselog-centering transformation, which is required here, can be used in the function mci.shares()by stating the function parameter mcitrans to "ilc" (default: "lc"). In the next step, the totalexpenditures for each grocery store and the corresponding over-all shares are computed by thefunction shares.total():
# MCI market share prediction with four variables# (ratio-scaled variables are log-centering transformed)# salesarea_qm (multiplicative weighting with factor equal to 1.31622)# d_time (multiplicative weighting with factor equal to -2.56243)# Lidl_DUMMY (multiplicative weighting with factor equal to -0.59177)# Real_DUMMY (multiplicative weighting with factor equal to 1.32882)
The result of shares.total is a "data.frame" containing the suppliers (suppliers_single), thetotal values (sum_E_j) and the corresponding over-all market shares share_j, where the sum of allshare_j is equal to one. Here, the stores with the biggest shares of customer expenditures are "REAL1"(51.28%) and "EDEKA1" (39.74%).
Now, we analyze the impact of a change in the competitive environment: the biggest grocerystore in the study area is Real (gro_purchase_code = "REAL1"). On condition that the sales area ofthis store is increased by 10 % (because of an increase of offered goods), how will, ceteris paribus, the
The R Journal Vol. 9/1, June 2017 ISSN 2073-4859
CONTRIBUTED RESEARCH ARTICLE 316
purchasing power flows with respect to this supplier and to all other stores change? First, we updatethe regarded variable in the existing interaction matrix:
ijmatrix_alldata[ijmatrix_alldata$gro_purchase_code == "REAL1",]$salesarea_qm <- 8525# Replacing the sales area of REAL1 with a new value: 8525 sqm (increase of 10 %)
Now, we only have to repeat the MCI market share prediction above:
The results in the total sales/shares table show an impact of the trading-up in the regardedhypermarket: the over-all share of Real increases from 51.28% to 52.36%. The other stores are affecteddifferently: the over-all share of EDEKA1 decreases from 39.74% to 38.87%. Since this model doesnot consider any kind of agglomeration economies, the market shares of the competitors decreasedependent on their proximity to the hypermarket and the spatial distribution of customers.
It should be noticed that the survey in the shopping1 dataset is not statistically representative, sinceit is a POS survey not regarding customers shopping at other supply locations. Thus, the analysesand results shown here should not be overinterpreted but regarded as an example how to use theMCI-related functions in the MCI package.
Huff Model optimization
The final example deals with the problem of fitting the Huff Model on condition that no empiricallyobserved store choices, market shares and market areas, respectively, are available. The aim of theanalysis is to estimate the market areas of the grocery stores in Freiburg, Germany, based on their totalannual sales and their "attraction" (size).
The dataset Freiburg1 contains the preliminary stage of a Huff interaction matrix, containingthe origins (statistical districts of Freiburg, column district), codes representing the grocery stores(store), the sales area of these stores in sqm (salesarea) and the street distances between the originsand the stores (distance). The grocery stores and their characteristics were obtained in spring 2015(Wieland, 2015b), while the street distances were calculated via network analysis in GRASS (GRASSDevelopment Team, 2015) using OpenStreetMap vector data.
data(Freiburg1)# Distance matrix and sales area
First, we try to approximate the market areas using a conventional Huff Model calculation usingthe function huff.shares(). This function is similar to the mci.shares() function and allows twoexplanatory variables (size, transport costs) which can be weighted by given parameters in a power,exponential or logistic function. The function type (power) and the exponents are set corresponding tothe default parameters of the Huff Model: γ = 1 and λ = −2 (Güssefeldt, 2002):
huff_mat <- huff.shares (Freiburg1, "district", "store", "salesarea", "distance")# Market area estimation using the Huff Model with standard parameters# (gamma = 1, lambda = -2)
The R Journal Vol. 9/1, June 2017 ISSN 2073-4859
CONTRIBUTED RESEARCH ARTICLE 317
In the next step, the total annual sales of the grocery stores are computed based on the estimatedinteraction probabilities/local market shares and the grocery purchasing power potential on the districtlevel in EUR (calculated based on the local population size and the national average expenditures forgroceries), stored in the dataset Freiburg2:
data(Freiburg2)# Grocery purchasing power on the city district level
huff_mat_pp <- merge (huff_mat, Freiburg2)# Adding the purchasing power data for the city districts
huff_total <- shares.total (huff_mat_pp, "district", "store", "p_ij", "ppower")# Total expected sales and shares
The new dataset huff_total contains the expected total annual sales in EUR (sum_E_j) and thecorresponding over-all market shares (share_j). Since the “real” annual sales are known (calculatedby chain-based average retail space productivity, stored in the dataset Freiburg3), we compare theexpected values to the observed values using the help function model.fit():
data(Freiburg3)# Annual sales of the grocery stores
The function model.fit() returns a "list" with four entries containing the following goodness-of-fit measures: the sum of the squared residuals (resids_sq_sum), a Pseudo-R2 measure (pseudorsq),the global error (globerr) and the MAPE (mape), as described in the Huff Model section. Note thatthese fit measures are closely related to each other. Optionally, the function returns a plot to comparethe observed and expected values graphically (see the plot in Figure 2, top left).
Obviously, the fit in this Huff Model market area estimation using the default values is quite pooras can be seen from the fit measures and, of course, from the plot. E.g. the sales of the most high-sellinggrocery store is extremely underestimated. From this, one can conclude that also the estimated marketshares/market areas will not reflect the reality to some extent.
Thus, we have to use the optimization algorithm as discussed in the Huff Model section. Thefunction huff.attrac() provides one iteration of this algorithm, requiring the interaction matrix, thelocal market potential and the total values (e.g. sales) of the suppliers. The tolerance value to accepta difference of individual total sales or not is set equal to 5, while the function output contains theestimated total values (Internally, huff.attrac() uses the function shares.total()). We apply thefunction to the three datasets (Freiburg1, Freiburg2 and Freiburg3):
# One-time optimization (one iteration) with an accepted difference of +/- 5 %# Output of total sales/shares
Note that this calculation includes a great many calculation steps while working with 63 storesand 42 statistical districts. In a test environment (computer with CPU: Intel Core i3-2100, RAM: 4.00GB, OS: Windows 7 64bit), the command above takes about 43 seconds.
Since the option output was set to "total", the huff.attrac() function returns a "data.frame"(rows 1-4 are displayed) that contains a comparison between the observed (total_obs) and theexpected total values (sum_E_j) as well as the corresponding difference (diff) and the estimated newattractions (attrac_new_opt). If output is set to "matrix", the function returns an interaction matrixequal to the output of mci.shares() or huff.shares().
Next, the validity analysis of the new model using model.fit() is repeated as described above:
model.fit(huff_total_opt1$total_obs, huff_total_opt1$sum_E_j, plotVal = TRUE)# total_obs = observed total values, originally from dataset Freiburg3# sum_E_j = expected total values
$resids_sq_sum[1] 2.901841e+14
$pseudorsq[1] 0.9334801
$globerr[1] 0.1564878
$mape[1] 0.1620126
The goodness-of-fit measures and the plot (see the plot in Figure 2, top right) reveal a much betterfit: the Pseudo-R2 increases from 0.51 to 0.93 while the error measures decrease accordingly.
To extend this optimization algorithm to a given number of iterations, the MCI package providesthe function huff.fit(). First, we run two iterations decreasing the tolerance value equal to onewhich means a more strict check. Since this optimization takes some time, we enable the printing ofstatus messages. The output of the function huff.fit() is equal to the output of huff.attrac() andcan be processed in the same way. As above, the estimated total sales are compared to the observedsales using model.fit():
# total_obs = observed total values, originally from dataset Freiburg3# sum_E_j = expected total values
$resids_sq_sum[1] 4.806282e+13
$pseudorsq[1] 0.9889824
$globerr[1] 0.05946104
$mape[1] 0.0618133
To run the algorithm twice with a smaller tolerance leads to a much better fit: while Pseudo-R2
increases from 0.93 to 0.98, the global error and the MAPE reduce from about 15 and 16% to about 6%,respectively. This improvement is also obvious when looking at the plot (Figure 2, bottom left).
In the test environment mentioned above, this huff.fit operation takes about one and a halfminute (89 seconds). Consequently, to extend the procedure to more iterations means also an increaseof calculating time. We repeat the algorithm with 10 iterations and compare the results once more:
# 10 iterations of the optimization algorithm with an accepted difference of +/- 1 %# Output of total sales/shares, stored in dataset huff_total_opt10# with printing of status messages
This operation is, of course, very time-consuming: in the test environment mentioned above,ten iterations of the algorithm took about five minutes (308 seconds), while the time of an iterationdecreases since the local fits (for each store/locations) also gets better with each iteration. The finalresult is a nearly perfect fit with a MAPE of about 0.4% and a global error of about 0.5% while thePseudo-R2 approaches the maximum (0.99). The expected annual sales are highly accurate as can beseen in the corresponding plot (Figure 2, bottom right).
The function huff.fit() allows an evaluation of the iterations by returning the correspondingglobal fit measures for each step (Internally, huff.fit() uses the model.fit() function). We set thefunction parameter output = "diag" to make the function return a "data.frame" containing theiteration statistics:
Obviously, all goodness-of-fit measures show an improvement of the model fit with each iteration.But there is no noticeable improvement after the eighth iteration. All in all, the accuracy of the resultsare determined by the error tolerance (parameter tolerance) and the number of iterations (parameteriterations) which are stated by the user who has to trade off accuracy against computing time.
Figure 2: Huff Model fit algorithm.
Conclusions and limitations
Model-based market area analysis for retail and service locations includes 1) theoretical considerations,2) collection of empirical data regarding the locations and the customers, 3) data processing and, insome cases, data transformation, 4) fitting of the used models and 5) the market area prediction itself.While the first two aspects can not be offered by a statistical software, the presented package MCIprovides several functions to process the other mentioned steps by implementing the Huff Model andthe Multiplicative Competitive Interaction (MCI) Model into R.
The focus of the package is 1) on model fitting via OLS regression (MCI Model) or iterativeoptimization (Huff Model) and 2) on data preparation, while both aspects are closely related (especiallyin the MCI Model). As a consequence, some other related substeps are not considered.
Though the package is designed to allow a data exchange with a GIS (e.g. ijmatrix.crosstab() to
The R Journal Vol. 9/1, June 2017 ISSN 2073-4859
CONTRIBUTED RESEARCH ARTICLE 321
prepare an interaction matrix for a map visualization), it does not provide any GIS functions. Thus, theGIS-related steps of market area analysis have to be borrowed from other packages: especially distanceor travel time calculations are needed what can be done using GIS-orientated packages like ggmapwhich utilizes the Google API for routing (and was used in the example dataset shopping2), osmar(Eugster and Schlesinger, 2013) and osrm (Giraud, 2016) providing similar functions with respect toOpenStreetMap, or the huff-tools package mentioned above.
In econometric market area analyses using the MCI Model, also further diagnostics of the modelare recommended, especially with respect to the possible violations of the OLS-related assumptions,such as heteroscedasticity or multicollinearity. A discussion of specific problems and opportunitiesregarding logarithmic transformations can be found in Silva and Tenreyro (2006) and Manning andMullahy (2001). The violation of OLS assumptions and possible solutions have beed addressed inMCI studies several times (Nakanishi and Cooper, 1974; Kubis and Hartmann, 2007; Tihi and Oruc,2012; Wieland, 2015a), but there are no corresponding extensions implemented in MCI yet. Otherpackages may be helpful for this analyses: since the implemented functions return "data.frame"(mci.transmat()) and "lm" objects (mci.fit()), respectively, this data can be processed e.g. in car (Foxand Weisberg, 2011) for further diagnostics.
Another remaining step not yet provided by the presented package is the combination of the MCIModel with the Geographically Weighted Regression (GWR) which has been already used to identifyspatial nonstationarity in the estimated parameters (Suárez-Vega et al., 2015; Wieland, 2015a). TheGWR is implemented in R by the package spgwr (Bivand and Yu, 2015).
Acknowledgements
The author would like to thank the two anonymous reviewers for providing useful feedback thathelped to improve the paper.
Bibliography
S. Baecker-Neuchl and H. Wagenseil. Das Ganze sehen: Räumliche Analysen zur Ermittlung desZusammenhangs zwischen Umsatz- und Nachfragepotenzial. In O. Gansser and B. Krol, editors,Markt- und Absatzprognosen. Modelle - Methoden - Anwendung, pages 263–281. Springer-Verlag, 2015.URL https://doi.org/10.1007/978-3-658-04492-3_14. [p300]
B. R. Berman and J. R. Evans. Retail Management: A Strategic Approach. Pearson, 12 edition, 2013. [p298]
R. Bivand and D. Yu. Spgwr: Geographically Weighted Regression, 2015. URL https://CRAN.R-project.org/package=spgwr. R package version 0.6-28. [p321]
G. Cliquet. Retail Location Models. In G. Cliquet, editor, Geomarketing: Methods and Strategiesin Spatial Marketing, pages 137–163. John Wiley & Sons, 2013. URL https://doi.org/10.1002/9781118614020.ch6. [p302, 303]
P. D. Converse. New laws of retail gravitation. Journal of Marketing, 14(3):379–384, 1949. URLhttps://doi.org/10.2307/1248191. [p298]
L. G. Cooper and M. Nakanishi. Standardizing variables in multiplicative choice models. Journal ofConsumer Research, 10(1):96–108, 1983. URL https://doi.org/10.1086/208948. [p304]
L. G. Cooper and M. Nakanishi. Market-Share Analysis: Evaluating Competitive Marketing Effectiveness. In-ternational series in quantitative marketing. First published in 1988 by Kluver, E-Book edition, 2010.URL http://www.anderson.ucla.edu/faculty/lee.cooper/MCI_Book/BOOKI2010.pdf. [p301, 302]
M. De Beule, D. Van den Poel, and N. Van de Weghe. An extended Huff-model for robustly bench-marking and predicting retail network performance. Applied Geography, 46(1):80–89, 2014. URLhttps://doi.org/10.1016/j.apgeog.2013.09.026. [p300, 301]
M. J. A. Eugster and T. Schlesinger. Osmar: OpenStreetMap and R. R Journal, 5(1):53–63, 2013. URLhttps://journal.r-project.org/archive/2013-1/eugster-schlesinger.pdf. [p321]
J. Fox and S. Weisberg. An R Companion to Applied Regression. Sage, Thousand Oaks CA, 2nd edition,2011. URL http://socserv.socsci.mcmaster.ca/jfox/Books/Companion. [p321]
T. Giraud. Osrm: Interface Between R and the OpenStreetMap-Based Routing Service OSRM, 2016. URLhttps://CRAN.R-project.org/package=osrm. R package version 3.0.0. [p321]
T. Giraud and H. Commenges. SpatialPosition: Spatial Position Models, 2016. URL https://CRAN.R-project.org/package=SpatialPosition. R package version 1.1.1. [p298]
O. González-Benito, M. Greatorex, and P. A. Muñoz-Gallego. Assessment of potential retail segmenta-tion variables: An approach based on a subjective MCI resource allocation model. Journal of Retailingand Consumer Services, 7(3):171–179, 2000. URL https://doi.org/10.1016/S0969-6989(99)00026-0.[p303]
GRASS Development Team. Geographic Resources Analysis Support System (GRASS GIS) Software, Version7.0. Open Source Geospatial Foundation, 2015. URL http://grass.osgeo.org. [p316]
J. Güssefeldt. Zur Modellierung von räumlichen Kaufkraftströmen in unvollkommenen Märkten.Erdkunde, 56(4):351–370, 2002. URL https://doi.org/10.3112/erdkunde.2002.04.02. [p299, 300,301, 316]
D. L. Huff. Determination of Intra-Urban Retail Trade Areas. University of California, 1962. [p299, 300,303, 308, 309, 312]
D. L. Huff. A probabilistic analysis of shopping center trade areas. Land Economics, 39(1):81–90, 1963.URL https://doi.org/10.2307/3144521. [p299]
D. L. Huff. Defining and estimating a trading area. Journal of Marketing, 28(4):34–38, 1964. URLhttps://doi.org/10.2307/1249154. [p299]
D. L. Huff and R. R. Batsell. Conceptual and operational problems with market share models ofconsumer spatial behavior. Advances in Consumer Research, 2:165–172, 1975. [p299]
D. L. Huff and B. M. McCallum. Calibrating the Huff Model using ArcGIS Business Analyst. ESRIWhite Paper, September 2008, 2008. URL https://www.esri.com/library/whitepapers/pdfs/calibrating-huff-model.pdf. [p298, 302, 303, 304]
P. Jia, I. M. Xierali, and F. Wang. Evaluating and re-demarcating the Hospital Service Areas in Florida.Applied Geography, 60(4):248–253, 2015. URL https://doi.org/10.1016/j.apgeog.2014.10.008.[p298]
D. Kahle and H. Wickham. Ggmap: Spatial visualization with ggplot2. The R Journal, 5(1):144–161,2013. URL http://journal.r-project.org/archive/2013-1/kahle-wickham.pdf. [p306]
C. Kanhäußer. Modellierung und Prognose von Marktgebieten am Beispiel des Möbeleinzelhandels. InR. Klein and J. Rauh, editors, Analysemethodik und Modellierung in der geographischen Handelsforschung,volume 13 of Geographische Handelsforschung, pages 75–109. L.I.S., 2007. [p299, 308]
R. Klein. Der Lebensmittel-Einzelhandel im Raum Verden - Räumliches Einkaufsverhalten unter sich wan-delnden Bedingungen, volume 8 of Flensburger Arbeitspapiere zur Landeskunde und Raumordnung.Universität Flensburg, 1988. [p300, 301]
A. Kubis and M. Hartmann. Analysis of location of large-area shopping centres. a probabilisticgravity model for the Halle–Leipzig Area. Jahrbuch für Regionalwissenschaft, 27(1):43–57, 2007. URLhttps://doi.org/10.1007/s10037-006-0010-3. [p303, 304, 321]
R. D. Luce. Individual Choice Behavior: A Theoretical Analysis. John Wiley & Sons, 1959. [p299]
G. Löffler. Market areas - a methodological reflection on their boundaries. GeoJournal, 45(4):265–272,1998. URL https://doi.org/10.1023/A:1006980420829. [p298]
W. G. Manning and J. Mullahy. Estimating log models: To transform or not to transform? Journalof Health Economics, 20(4):461–494, 2001. URL https://doi.org/10.1016/S0167-6296(01)00086-8.[p308, 321]
M. Marinov and D. Czamanski. Normative issues in the organization of modern retailers in Israel.GeoJournal, 77(3):383–398, 2012. URL https://doi.org/10.1007/s10708-010-9394-2. [p300]
M. Nakanishi and L. G. Cooper. Parameter estimation for a Multiplicative Competitive InteractionModel: Least squares approach. Journal of Marketing Research, 11(3):303–311, 1974. URL https://doi.org/10.2307/3151146. [p299, 300, 302, 303, 321]
M. Nakanishi and L. G. Cooper. Simplified estimation procedures for MCI models. Marketing Science,1(3):314–322, 1982. URL https://doi.org/10.1287/mksc.1.3.314. [p299, 303]
T. Orpana and J. Lampinen. Building spatial choice models from aggregate data. Journal of RegionalScience, 43(2):319–347, 2003. URL https://doi.org/10.1111/1467-9787.00301. [p300]
M. Pavlis, L. Dolega, and A. Singleton. The huff-tools package (version 0.6). Technical Report (PDF),2014. URL https://github.com/alexsingleton/Huff-Tools/blob/master/huff-toolsvignette.pdf. [p298]
R. C. Perales. Consumer Choice in Competitive Location Models. Universitat Pompeu Fabra, 2002. URLhttp://www.tdx.cat/bitstream/handle/10803/7330/trcp1de1.pdf. [p304]
J. O. Rawlings, S. G. Pantula, and D. A. Dickey. Applied Regression Analysis. Springer-Verlag, 2ndedition, 1998. [p303, 308]
W. J. Reilly. Methods for the Study of Retail Relationships, volume 4 of Studies in Marketing. Bureau ofBusiness Research, The University of Texas, 1929. [p298]
T. Reutterer and C. Teller. Store format choice and shopping trip types. International Journal of Retail &Distribution Management, 37(8):695–710, 2009. URL https://doi.org/10.1108/09590550910966196.[p312]
J.-P. Rodrigue, C. Comtois, and B. Slack. The Geography of Transport Systems. Routledge, 2006. [p298]
J. M. C. S. Silva and S. Tenreyro. The Log of Gravity. The Review of Economics and Statistics, 88(4):641–658, 2006. URL https://doi.org/10.1162/rest.88.4.641. [p308, 321]
R. Suárez-Vega, J. L. Gutiérrez-Acuña, and M. Rodríguez-Díaz. Locating a supermarket using a locallycalibrated Huff model. International Journal of Geographical Information Science, 29(2):171–179, 2015.URL http://doi.org/10.1080/13658816.2014.958154. [p303, 321]
B. Tihi and N. Oruc. Competitive location assessment – the MCI approach. South East European Journalof Economics and Business, 7(2):379–384, 2012. URL https://doi.org/10.2478/v10033-012-0013-7.[p303, 304, 321]
T. Wieland. Räumliches Einkaufsverhalten und Standortpolitik im Einzelhandel unter Berücksichtigung vonAgglomerationseffekten. Theoretische Erklärungsansätze, modellanalytische Zugänge und eine empirisch-ökonometrische Marktgebietsanalyse anhand eines Fallbeispiels aus dem ländlichen Raum Ostwestfalens/Südniedersachsens, volume 23 of Geographische Handelsforschung. MetaGIS, 2015a. [p298, 300, 302,303, 304, 314, 321]
T. Wieland. Nahversorgung im Kontext raumökonomischer Entwicklungen im Lebensmitteleinzel-handel - Konzeption und Durchführung einer GIS-gestützten Analyse der Strukturen des Lebens-mitteleinzelhandels und der Nahversorgung in Freiburg im Breisgau. Technical report, Georg-August-Universität Göttingen, Geographisches Institut, Abteilung Humangeographie, 2015b. URLhttp://webdoc.sub.gwdg.de/pub/mon/2015/5-wieland.pdf. [p316]
T. Wieland. MCI: Multiplicative Competitive Interaction (MCI) Model, 2016. URL https://CRAN.R-project.org/package=MCI. R package version 1.3.0. [p298]
M. Wolf. Anforderungen an Einzelhandelsgutachten. In H. Konze and M. Wolf, editors, Einzelhandel inNordrhein-Westfalen planvoll steuern!, volume 2 of Arbeitsberichte der ARL [Akademie für Raumforschungund Landesplanung], pages 114–134. ARL, 2012. [p298]
L. Yingru and L. Lin. Assessing the impact of retail location on store performance: A comparisonof Wal-Mart and Kmart stores in Cincinnati. Applied Geography, 32(2):591–600, 2012. URL https://doi.org/10.1016/j.apgeog.2011.07.006. [p300]
Thomas WielandKarlsruhe Institute of TechnologyInstitute of Geography and GeoecologyKaiserstr. 12, 76131 [email protected]