Discussion papers are research materials circulated by theirauthors for purposes of information and discussion. Theyhave not undergone formal peer review or the editorialtreatment accorded RFF books and other publications.
ii
Market-Based Environmental Policies
Robert N. Stavins
Abstract
Some eighty years ago, economists first proposed the use of corrective taxes tointernalize environmental and other externalities. Fifty years later, the portfolio of potentialeconomic-incentive instruments was expanded to include quantity-based mechanisms--tradable permits. Thus, economic-incentive approaches to environmental protection areclearly not a new policy idea, and over the past two decades, they have held varying degreesof prominence in environmental policy discussions. This paper summarizes U.S. experienceswith such market-based policy instruments, including: pollution charges; deposit-refundsystems; tradable permits; market barrier reductions; and government subsidy reductions.
No particular form of government intervention, no individual policy instrument--whether market-based or conventional--is appropriate for all environmental problems. Whichinstrument is best in any given situation depends upon a variety of characteristics of theenvironmental problem, and the social, political, and economic context in which it is beingregulated. There is no policy panacea. Indeed, the real challenge for bureaucrats, electedofficials, and other participants in the environmental policy process comes in analyzing andthen selecting the best instrument for each situation that arises.
1. What Are Market-Based Policy Instruments? .......................................................................... 11.1 A Definition ................................................................................................................... 11.2 Characteristics of Market-Based Policy Instruments ....................................................... 21.3 Categories of Market-Based Instruments ......................................................................... 4
2. U.S. Experience with Tradable Permit Systems ....................................................................... 62.1 EPA's Emissions Trading Program ................................................................................. 82.2 Lead Trading .................................................................................................................. 82.3 Water Quality Permit Trading ......................................................................................... 92.4 CFC Trading ................................................................................................................ 102.5 SO2 Allowance System ................................................................................................. 112.6 The RECLAIM Program .............................................................................................. 122.7 Transferable Development Rights ................................................................................. 13
3. U.S. Experience with Charge Systems ................................................................................... 133.1 Effluent Charges ........................................................................................................... 143.2 Deposit-Refund Systems ............................................................................................... 143.3 User Charges ................................................................................................................ 183.4 Insurance Premium Taxes ............................................................................................. 193.5 Sales Taxes .................................................................................................................. 203.6 Administrative Charges ................................................................................................ 223.7 Tax Differentiation ....................................................................................................... 22
4. U.S. Experience with Reducing Market Barriers .................................................................... 244.1 Market Creation ........................................................................................................... 244.2 Liability Rules .............................................................................................................. 264.3 Information Programs ................................................................................................... 26
5. U.S. Experience with Reducing Government Subsidies ......................................................... 285.1 Below-Cost Timber Sales ............................................................................................. 285.2 Fossil-Fuel Energy Subsidies ........................................................................................ 29
6. Why Have There Been Relatively Few Applications of Market-Based Instruments? .............. 306.1 A Stock-Flow Problem ................................................................................................. 306.2 Resistance from Interest Groups ................................................................................... 316.3 Public Resistance .......................................................................................................... 31
7. Why Has the Performance Record Been Mixed? .................................................................... 327.1 Inaccurate Predictions ................................................................................................... 327.2 Design Problems .......................................................................................................... 327.3 Limitations in Firms' Structure ...................................................................................... 33
8. The Changing Politics of Market-Based Instruments ............................................................. 339. Conclusion ............................................................................................................................ 36
List of Tables
Table 1 Major Federal Tradable Permit Systems .......................................................................... 7Table 2 Deposit-Refund Systems ............................................................................................... 16Table 3 Federal User Charges .................................................................................................... 19Table 4 Federal Insurance Premium Taxes ................................................................................ 20Table 5 Federal Sales Taxes ...................................................................................................... 21Table 6 Administrative Charges ................................................................................................ 22Table 7 Federal Tax Differentiation ........................................................................................... 23Table 8 Federal Information Programs ...................................................................................... 27
1
MARKET-BASED ENVIRONMENTAL POLICIES
Robert N. Stavins*
1. WHAT ARE MARKET-BASED POLICY INSTRUMENTS?
Nearly all environmental policies consist of two components, either explicitly orimplicitly: the identification of an overall goal (such as a degree of air quality or an upper limiton emission rates) and some means to achieve that goal. In practice, these two components areoften linked within the political process, because both the choice of a goal, and the mechanismfor achieving that goal, have important political ramifications.1 This chapter focuses exclusivelyon the second component, the means--the "instruments"--of environmental policy, and considers,in particular, economic-incentive or market-based policy instruments.
1.1 A Definition
Market-based instruments are regulations that encourage behavior through marketsignals rather than through explicit directives regarding pollution control levels or methods.2
These policy instruments, such as tradable permits or pollution charges, are often described as"harnessing market forces"3 because if they are well designed and implemented, theyencourage firms (and/or individuals) to undertake pollution control efforts that both are inthose firms' (or individuals') interests and that collectively meet policy goals.
By way of contrast, conventional approaches to regulating the environment are oftenreferred to as "command-and-control" regulations since they allow relatively little flexibility
* Professor of Public Policy, and Faculty Chair, Environment and Natural Resources Program, John F. Kennedy Schoolof Government, Harvard University, and University Fellow, Resources for the Future. This paper was prepared as achapter in Public Policies for Environmental Protection, Paul R. Portney and Robert N. Stavins, eds. Quindi Francoprovided excellent research assistance, and very helpful comments on a previous version of the chapter were provided byDallas Burtraw, Robert Hahn, Paul Portney, and Tom Tietenberg. But the author alone is responsible for any errors.1 While discussion of goals typically precedes examination of alternative means for achieving goals, this is notnecessarily the case. For example, both the Bush and Clinton administrations endorsed market-based methods foraddressing global climate change before either had committed itself to specific greenhouse policy goals.2 This section draws, in part, on: Hockenstein, Jeremy B., Robert N. Stavins, and Bradley W. Whitehead. "Creatingthe Next Generation of Market-Based Environmental Tools." Environment 39, number 4 (1997), pp. 12-20, 30-33.3 See, for example: Stavins, Robert N., ed. Project 88 - Round II Incentives for Action: Designing Market-BasedEnvironmental Strategies. Sponsored by Senator Timothy E. Wirth, Colorado, and Senator John Heinz, Pennsylvania.Washington, D.C., May 1991; Stavins, Robert N., ed. Project 88: Harnessing Market Forces to Protect Our Environment.Sponsored by Senator Timothy E. Wirth, Colorado, and Senator John Heinz, Pennsylvania. Washington, D.C., December1988; U.S. Environmental Protection Agency. Economic Incentives, Options for Environmental Protection. Document P-2001. EPA, Washington, D.C. ,1991; Organization for Economic Cooperation and Development. Economic Instruments forEnvironmental Protection. Paris, 1989; and Organization for Economic Cooperation and Development. EnvironmentalPolicy: How to Apply Economic Instruments. Paris, 1991.
Robert N. Stavins RFF 98-26
2
in the means of achieving goals. Early environmental policies, such as the Clean Air Act of1970 and the Clean Water Act of 1972, relied almost exclusively on these approaches.4
In general, command-and-control regulations tend to force firms to shoulder similarshares of the pollution-control burden, regardless of the relative costs to them of this burden.5
Command-and-control regulations do this by setting uniform standards for firms, the mostprevalent of which are technology-based and performance-based standards. Technology-based standards specify the method, and sometimes the actual equipment, that firms must useto comply with a particular regulation. For example, all electric utilities might be required toemploy a specific type of scrubber to remove particulates. A performance standard sets auniform control target for firms, while allowing some latitude in how this target is met. Forexample, a regulation might limit the number of allowable units of a pollutant released in agiven time period, but might not dictate the means by which this is achieved.
Holding all firms to the same target can be expensive and, in some circumstances,counterproductive. While standards may effectively limit emissions of pollutants, theytypically exact relatively high costs in the process, by forcing some firms to resort to undulyexpensive means of controlling pollution. Because the costs of controlling emissions mayvary greatly among firms, and even among sources within the same firm, the appropriatetechnology in one situation may be inappropriate in another. Thus, control costs can varyenormously due to a firm's production design, physical configuration, age of its assets, orother factors. One survey of eight empirical studies of air pollution control found that theratio of actual, aggregate costs of the conventional, command-and-control approach to theaggregate costs of least-cost benchmarks ranged from 1.07 for sulfate emissions in the LosAngeles area to 22.0 for hydrocarbon emissions at all domestic DuPont plants.6
Furthermore, command-and-control regulations tend to freeze the development oftechnologies that might otherwise result in greater levels of control. Little or no financialincentive exists for businesses to exceed their control targets, and both technology-based andperformance-based standards discourage adoption of new technologies. A business thatadopts a new technology may be "rewarded" by being held to a higher standard ofperformance, but is not given the opportunity to benefit financially from its investment,except to the extent its competitors have even more difficulty reaching the new standard.
1.2 Characteristics of Market-Based Policy Instruments
The two most notable advantages that market-based instruments offer over traditionalcommand-and-control approaches are cost effectiveness and dynamic incentives fortechnology innovation and diffusion. 4 For descriptions of the use of command-and-control instruments for various environmental problems, see the otherchapters in this volume.5 But various command-and-control standards do this in different ways. See: Helfand, Gloria E. "Standards versusStandards: The Effects of Different Pollution Restrictions." American Economic Review 81(1991):622-634.6 See Tietenberg, Tom. Emissions Trading: An Exercise in Reforming Pollution Policy. Washington, D.C.: Resourcesfor the Future, 1985.
Robert N. Stavins RFF 98-26
3
In theory, if properly designed and implemented, market-based instruments allow anydesired level of pollution cleanup to be realized at the lowest possible overall cost to society,by providing incentives for the greatest reductions in pollution by those firms that can achievethese reductions most cheaply.7 Rather than equalizing pollution levels among firms (as withuniform emission standards), market-based instruments equalize the incremental amount thatfirms spend to reduce pollution (their marginal cost).8
It is important to recognize that command-and-control approaches could--theoretically--achieve this cost-effective solution, but this would require that different standards be set foreach pollution source, and, consequently, that policy makers obtain detailed information aboutthe compliance costs each firm faces. Such information is simply not available to government.By contrast, market-based instruments provide for a cost-effective allocation of the pollutioncontrol burden among sources without this information.
In contrast to command-and-control regulations, market-based instruments have thepotential to provide powerful incentives for companies to adopt cheaper and better pollution-control technologies. This is because with market-based instruments, it always pays firms toclean up a bit more if a sufficiently low-cost method (technology or process) of doing so canbe identified and adopted.9
7 Under certain circumstances, substituting a market-based instrument for a command-and-control instrument can lowerenvironmental quality, because command-and-control standards tend to lead to over-control. On this, see: Oates, WallaceE., Paul R. Portney, and Albert M. McGartland. "The Net Benefits of Incentive-Based Regulation: A Case Study ofEnvironmental Standard Setting." American Economic Review 79(1989):1233-1243.8 Each source's marginal costs of pollution control are the additional or incremental cost for that source to achieve anadditional unit of pollution reduction. If these marginal costs of control are not equal across sources, then the sameaggregate level of pollution control could be achieved at lower overall cost simply by reallocating the pollution controlburden among sources, so that low-cost controllers controlled more, and high-cost controllers controlledproportionately less. Additional savings could theoretically be achieved through such reallocations until marginalcosts were identical for all sources. See: Baumol, William J. and Wallace E. Oates. The Theory of EnvironmentalPolicy. Second Edition. New York: Cambridge University Press, 1988. Reference here is to marginal abatementcosts, that is, marginal costs of emission reduction. Things become more complicated, but the general point holds withnon-uniformly mixed pollutants, where the focus is on ambient concentration or exposure, not simply emissions. Onthis, see: Montgomery, David. "Markets in Licenses and Efficient Pollution Control Programs," Journal of EconomicTheory 5(1972):395-418; and Tietenberg, Tom H. "Tradable Permits for Pollution Control When Emission LocationMatters: What Have We Learned?" Environmental and Resource Economics 5(1995):95-113.9 For a theoretical analysis of the dynamic incentives of technological change under alternative policy instruments,see, for example: Downing, Paul B. and Lawrence J. White. "Innovation in Pollution Control." Journal ofEnvironmental Economics and Management 13(1986):18-27; Malueg, David. "Emission Credit Trading and theIncentive to Adopt New Pollution Abatement Technology." Journal of Environmental Economics and Management16(1989):52-57; Milliman, Scott R., and Raymond Prince. "Firm Incentives to Promote Technological Change inPollution Control." Journal of Environmental Economics and Management 17(1989):247-265; and Jung, Chulho,Kerry Krutilla, and Roy Boyd. "Incentives for Advanced Pollution Abatement Technology at the Industry Level: AnEvaluation of Policy Alternatives." Journal of Environmental Economics and Management 30(1996):95-111. Theempirical literature is considerably thinner. See: Jaffe, Adam B. and Robert N. Stavins. "Dynamic Incentives ofEnvironmental Regulations: The Effects of Alternative Policy Instruments on Technology Diffusion." Journal ofEnvironmental Economics and Management 29 (1995): S-43-S-63.
Robert N. Stavins RFF 98-26
4
1.3 Categories of Market-Based Instruments
Market-based instruments can be considered within four major categories: pollutioncharges; tradable permits; market barrier reductions; and government subsidy reductions.10
Pollution charge systems assess a fee or tax11 on the amount of pollution that a firm orsource generates.12 Consequently, it is worthwhile for the firm to reduce emissions to thepoint where its marginal abatement cost is equal to the tax rate. Firms will thus controlpollution to differing degrees, with high-cost controllers controlling less, and low-costcontrollers controlling more. A challenge with charge systems is identifying the appropriatetax rate. Ideally, it should be set equal to the benefits of cleanup at the efficient level ofcleanup, but policy makers are more likely to think in terms of a desired level of cleanup, andthey do not know beforehand how firms will respond to a given level of taxation.
A special case of pollution charges is a deposit refund system, where consumers pay asurcharge when purchasing potentially polluting products, and receive a refund whenreturning the product to an approved center (for recycling or disposal). A number of stateshave implemented this approach through "bottle bills," to control litter from beveragecontainers and to reduce the flow of solid waste to landfills, and the concept has also beenapplied to lead-acid batteries.13
Tradable permits can achieve the same cost-minimizing allocation of the controlburden as a charge system, while avoiding the problem of uncertain responses by firms.14
Under a tradable permit system, an allowable overall level of pollution is established and
10 See, generally: Organization for Economic Cooperation and Development. Evaluating Economic Incentives forEnvironmental Policy. Paris, 1994; Organization for Economic Cooperation and Development. The Distributive Effectsof Economic Instruments for Environmental Policy. Paris, 1994; and Organization for Economic Cooperation andDevelopment. Managing the Environment--The Role of Economic Instruments. Paris, 1994.11 Pigou is generally credited with developing the idea of a corrective tax to discourage activities which generateexternalities, such as environmental pollution. See Pigou, Arthur C., The Economics of Welfare 4th Ed., 1952.12 For example, a pollution charge might take the form of a charge per unit of sulfur dioxide emissions, but not acharge per unit of electricity generated. The choice of whether to tax pollution quantities, activities precedingdischarge, inputs to those activities, or actual damages will depend upon tradeoffs between costs of abatement,mitigation, damages, and program administration, including monitoring and enforcement.13 See: Bohm, Peter. Deposit-Refund Systems: Theory and Applications to Environmental, Conservation, andConsumer Policy. Washington, D.C.: Resources for the Future, 1981; and Menell, Peter. "Beyond the ThrowawaySociety: An Incentive Approach to Regulating Municipal Solid Waste." Ecology Law Quarterly 17(1990):655-739.14 Thirty years ago, Thomas Crocker and John Dales independently developed the idea of using transferable dischargepermits to allocate the pollution-control burden among firms or individuals. See: Crocker, Thomas D. "The Structuringof Atmospheric Pollution Control Systems," in The Economics of Air Pollution, (Harold Wolozin, ed.), W. W. Norton& Company, Inc., NY (1966); and Dales, John. Pollution, Property and Prices. Toronto: University Press, 1968.David Montgomery provided the first rigorous proof that a tradeable permit system could, in theory, provide a cost-effective policy instrument for pollution control (1972). A sizeable literature on tradeable permits has followed. Earlysurveys of the literature are found in: Tietenberg, Tom. "Transferable Discharge Permits and the Control of StationarySource Air Pollution: A Survey and Synthesis." Land Economics 56(1980):391-416; and Tietenberg (1985). Also see:Hahn, Robert and Roger Noll. "Designing a Market for Tradable Permits." in Reform of Environmental Regulation.W. Magat, ed, 1982. Much of the literature on tradeable permits may actually be traced to Coase's treatment ofnegotiated solutions to externality problems. See generally: Coase, Ronald. "The Problem of Social Cost." Journal ofLaw and Economics 3(1960):1-44.
Robert N. Stavins RFF 98-26
5
allocated among firms in the form of permits.15 Firms that keep their emission levels belowtheir allotted level may sell their surplus permits to other firms or use them to offset excessemissions in other parts of their facilities.
Market barrier reductions can also serve as market-based policy instruments. In suchcases, substantial gains can be made in environmental protection simply by removing existingexplicit or implicit barriers to market activity. Three types of market barrier reductions standout: (1) market creation, as with measures that facilitate the voluntary exchange of waterrights and thus promote more efficient allocation and use of scarce water supplies; (2) liabilityrules that encourage firms to consider the potential environmental damages of their decisions;and (3) information programs, such as energy-efficiency product labeling requirements.
Government subsidy reductions are the fourth and final category of market-basedinstruments. Subsidies, of course, are the mirror image of taxes and, in theory, can provideincentives to address environmental problems. In practice, however, many subsidies promoteeconomically inefficient and environmentally unsound practices. This market distortionreceived much attention in the 104th Congress under the rubric of "corporate welfare," anexample of which is the below-cost sale of timber by the U.S. Forest Service.
In the simplest models, pollution taxes and tradable permits are symmetric, but thatsymmetry begins to break down in actual implementation.16 First, permits fix the level ofpollution control while charges fix the costs of pollution control. Second, in the presence oftechnological change and without additional government intervention, permits freeze the levelof pollution control while charges increase it. Third, with permit systems as typicallyadopted, resource transfers are private-to-private, while they are private-to-public withordinary pollution charges. Fourth, while both charges and permits increase costs on industryand consumers, charge systems tend to make those costs more obvious to both groups. Fifth,permits adjust automatically for inflation, while some types of charges do not. Sixth, permitsystems may be more susceptible to strategic behavior.17 Seventh, significant transactioncosts can drive up the total costs of compliance, having a negative effect under either system,but particularly with tradable permits.18 Eighth and finally, in the presence of uncertainty,
15 Reference here is to so-called "cap-and-trade" programs, but--as we discuss later--some programs, such as EPA'sEmissions Trading Program, operate differently, as "credit programs," where permits or credits are assigned only whena source reduces emissions below what is required by existing, source-specific limits.16 See: Stavins, Robert N. and Bradley W. Whitehead. "Pollution Charges for Environmental Protection: A Policy LinkBetween Energy and Environment." Annual Review of Energy and the Environment 17(1992):187-210.17 See: Hahn, Robert W. "Market Power and Transferable Property Rights." Quarterly Journal of Economics99(1984): 753-765; Malueg, David A. "Emission Credit Trading and the Incentive to Adopt New Pollution AbatementTechnology." Journal of Environmental Economics and Management 16(1989):52-57; and Misolek, W. S. and H. W.Elder. "Exclusionary Manipulation of Markets for Pollution Rights." Journal of Environmental Economics andManagement 16(1989):156-166.18 See: Stavins, Robert N. "Transaction Costs and Tradable Permits." Journal of Environmental Economics andManagement 29(1995):133-147.
Robert N. Stavins RFF 98-26
6
either permits or charges can be more efficient, depending upon the relative slopes of themarginal benefit and marginal cost functions19 and any correlation between them.20
The degree of abatement achieved by a pollution tax and the tax's effect on theeconomy will depend--in part--on what is done with the tax revenue. There is widespreadagreement that revenue recycling (that is, using pollution tax revenues to lower other taxes)can significantly lower the costs of a pollution tax.21 Some researchers have suggested,further, that all of the abatement costs associated with a pollution tax can be eliminatedthrough revenue recycling in the form of cuts in taxes on labor.22 But pollution taxes canexacerbate distortions associated with remaining taxes on investment or labor. There is nowcommon recognition that environmental taxes impose their own distortions that are at least asgreat as those from labor taxes.23 Using revenues from an environmental tax (or from theauction of pollution permits24) to reduce labor taxes can reduce the efficiency costs of theenvironmental tax, but--in most cases--the substitution of an environmental tax for aninvestment or labor tax will reduce welfare, apart from the potentially beneficialenvironmental consequences of the tax. Thus, the primary justification for environmentaltaxes should be their environmental benefits, not reform of the tax system per se.
2. U.S. EXPERIENCE WITH TRADABLE PERMIT SYSTEMS
The most frequently employed market-based environmental instruments in the UnitedStates have been tradable permit systems.25 Among theses are the following: the U.S.
19 See: Weitzman, Martin L. "Prices vs. Quantities." Review of Economic Studies 41(1974):477-491; Adar, Z. andJ.M. Griffin, "Uncertainty and the Choice of Pollution Control Instruments," Journal of Environmental Economics andManagement 3(1976):178-188; and Tisato, P. "Pollution Standards vs Charges Under Uncertainty." Environmentaland Resource Economics 4(1994):295-304.20 See: Stavins, Robert N. "Correlated Uncertainty and Policy Instrument Choice." Journal of EnvironmentalEconomics and Management 30(1996):218-232.21 See: Jorgenson, Dale and Peter Wilcoxen. "The Economic Effects of a Carbon Tax." Paper presented to the IPCCWorkshop on Policy Instruments and their Implications, Tsukuba, Japan, January 17–20, 1994; and Goulder,Lawrence. "Effects of Carbon Taxes in an Economy with Prior Tax Distortions: An Intertemporal GeneralEquilibrium Analysis." Journal of Environmental Economics and Management 29(1995):271-297.22 See: Repetto, Robert, Roger Dower, R. Jenkins, and Jackie Geoghegan. Green Fees: How a Tax Shift Can Workfor the Environment and the Economy. World Resources Institute, Washington, D.C., 1992.23 See: Bovenberg, A. Lans and R. de Mooij. "Environmental Levies and Distortionary Taxation." AmericanEconomic Review 84(1994):1085-1089; Bovenberg, A. Lans and Lawrence H. Goulder. "Optimal EnvironmentalTaxation in the Presence of Other Taxes: General-Equilibrium Analyses." American Economic Review 86(1996):985-1000; and Goulder, Lawrence. "Environmental Taxation and the Double Dividend: A Reader's Guide." InternationalTax and Public Finance 2(1995):157-183.24 See: Goulder, Lawrence, Ian Parry, and Dallas Burtraw. "Revenue-Raising Versus Other Approaches toEnvironmental Protection: The Critical Significance of Preexisting Tax Distortions." RAND Journal of Economics28(1997):708-731; and Fullerton, Don, and Gilbert Metcalf. "Environmental Controls, Scarcity Rents, and Pre-Existing Distortions." Paper presented at the National Bureau of Economic Research workshop, "Public Policy andthe Environment," Cambridge, Massachusetts, 1996.25 See, more broadly: Tietenberg, Tom. "Tradable Permits and the Control of Air Pollution in the United States."Paper prepared for the 10th Anniversary Jubilee edition of Zeitschrift Fürangewandte Umweltforschung, 1997; and
Robert N. Stavins RFF 98-26
7
Environmental Protection Agency's (EPA) Emissions Trading Program, the leaded gasolinephasedown, water quality permit trading, CFC trading, the SO2 allowance system for acid raincontrol, the RECLAIM program in the Los Angeles metropolitan region, and tradabledevelopment rights for land use (Table 1).26
Table 1. Major Federal Tradable Permit Systems*
Program Traded CommodityPeriod ofOperation Environmental and Economic Effects
EmissionsTrading Program
Criteria air pollutants under theClean Air Act
1974-Present
Environmental performance unaffected;total savings of $5-12 billion
Lead Phasedown Rights for lead in gasoline amongrefineries
1982-1987 More rapid phaseout of leaded gasoline;$250 million annual savings
Water QualityTrading
Point-nonpoint sources ofnitrogen & phosphorous
1984-1986 No trading occurred, because ambientstandards not binding
CFC Trading forOzone Protection
Production rights for some CFCs,based on depletion potential
1987-Present
Environmental targets achieved ahead ofschedule; effect of tp system unclear
Acid RainReduction
SO2 emission reduction credits;mainly among electric utilities
1995-Present
Environmental targets achieved ahead ofschedule; annual savings of $1 billion
RECLAIMProgram
Local SO2 and NOx emissionstrading among stationary sources
1994-Present
Unknown as of 1997
* The RECLAIM program in southern California is a regional initiative intended to achieve Federal and statetargets.
U.S. Environmental Protection Agency. The United States Experience with Economic Incentives to ControlEnvironmental Pollution. EPA-230-R-92-001. Washington, D.C., 1992.26 In addition, the Energy Policy and Conservation Act of 1975 established a program of Corporate Average FuelEconomy (CAFE) standards for automobiles and light trucks. The standards require manufacturers to meet aminimum sales-weighted average fuel efficiency for their fleet of cars sold in the United States. A penalty is chargedper car sold per unit of average fuel efficiency below the standard. The program operates much like an internal-firmtradable permit system or "bubble" scheme, since manufacturers can undertake efficiency improvements wherever theyare cheapest within their fleets. Firms that do better than the standard can "bank" their surpluses and--in some cases--are permitted to borrow against their future rights. For reviews of the literature on CAFE standards, with particularattention to the program's costs relative to "equivalent" gasoline taxes, see: Crandall, Robert W., Howard K.Gruenspecht, Theodore E. Keeler, and Lester B. Lave. Regulating the Automobile. Washington, D.C.: The BrookingsInstitute, 1986; and Goldberg, Penelopi K. "The Effects of the Corporate Average Fuel Efficiency Standards."Working Paper, Department of Economics, Princeton University, 1997. Light trucks, which are defined by the Federalgovernment to include "sport utility vehicles," face significantly weaker CAFE standards. See: Bradsher, Keith."Light Trucks Increase Profits But Foul Air More than Cars." New York Times, November 30, 1997, pp. A1, A38-A39. Also, California has used a vehicle retirement program that operates much like a tradable-permit system toreduce mobile-source air emissions by removing the oldest and most polluting vehicles from the road. On this, see:Tietenberg (1997); Alberini, Anna, Winston Harrington, and Virginia McConnell. "Determinants of Participation inAccelerated Vehicle Retirement Programs." RAND Journal of Economics 26(1995):93-112; and Kling, Catherine L."Emission Trading vs. Rigid Regulations in the Control of Vehicle Emissions." Land Economics 70(1994):174-188.In addition, the Northeast and Middle Atlantic states have organized a NOx permit trading program to control regionalsmog (Tietenberg 1997).
Robert N. Stavins RFF 98-26
8
2.1 EPA's Emissions Trading Program
Beginning in 1974, EPA experimented with "emissions trading" as part of the CleanAir Act's program for improving local air quality. Firms that reduced emissions below thelevel required by law received "credits" usable against higher emissions elsewhere.Companies could employ the concepts of "netting" or "bubbles" to trade emissions reductionsamong sources within the firm, so long as total, combined emissions did not exceed anaggregate limit.27
The "offset" program, which began in 1976, goes further in allowing firms to tradeemission credits. Firms wishing to establish new sources in areas that are not in compliancewith ambient standards must offset their new emissions by reducing existing emissions. Thiscan be accomplished through internal sources or through agreements with other firms.Finally, under the "banking" program, firms may store earned emission credits for future use.Banking allows for either future internal expansion or the sale of credits to other firms.
EPA codified these programs in its Emissions Trading Program in 1986,28 but theprograms have not been widely used. States are not required to use the program, anduncertainties about its future course seem to have made firms reluctant to participate.29
Nevertheless, companies such as Armco, DuPont, USX, and 3M have traded emissionscredits, and a market for transfers has long since developed.30 Even this limited degree ofparticipation in EPA's trading programs may have saved between $5 billion and $12 billionover the life of the program.31
2.2 Lead Trading
The purpose of the lead trading program, developed in the 1980s, was to allowgasoline refiners greater flexibility in meeting emission standards at a time when the lead-content of gasoline was reduced to 10 percent of its previous level. In 1982, the EPAauthorized inter-refinery trading of lead credits.32 If refiners produced gasoline with a lower
27 The "netting" and "bubbles" concept aggregates emissions from all the components of an industrial plant andconsiders them a single source for purposes of regulation. An evaluation of EPA's Emissions Trading Program can befound in: Tietenberg, Tom. Emission Trading: An Exercise in Reforming Pollution Policy. Washington, D.C.:Resources for the Future, 1985; and Foster, Vivien and Robert W. Hahn. "Designing More Efficient Markets: Lessonsfrom Los Angeles Smog Control." Journal of Law and Economics 38(1995):19-48. For a broader assessment ofEPA's experience with tradable permit policies, see Robert W. Hahn. "Economic Prescriptions for EnvironmentalProblems: How the Patient Followed the Doctor's Orders." Journal of Economic Perspectives 3 (1989): 95-114.28U.S. Environmental Protection Agency, Emissions Trading Policy Statement, 51 Fed. Reg. 43,814 (1986) (finalpolicy statement).29 See Liroff, Richard A. Reforming Air Pollution Regulations: The Toil and Trouble of EPA's Bubble. Washington,D.C.: Conservation Foundation, 1986.30 See Main, Jeremy. "Here Comes the Big New Cleanup." Fortune (November 1988): p. 102-118.31 See Hahn, Robert W. and Gordon L. Hester. "Where Did All the Markets Go? An Analysis of EPA's EmissionsTrading Program." Yale Journal of Regulation 6 (1989): 109-153.32 U.S. Environmental Protection Agency. Regulation of Fuel and Fuel Additives. 38,078-90 (proposed rule). 49,322-24 (final rule).
Robert N. Stavins RFF 98-26
9
lead content than was required, they earned lead credits. In 1985, EPA initiated a programallowing refineries to bank lead credits, and subsequently firms made extensive use of thisprogram.33 EPA terminated the program at the end of 1987, when the lead phasedown wascompleted.
The lead program was clearly successful in meeting its environmental targets. And,although the benefits of the trading scheme are more difficult to assess, trading activitysuggests that the program was relatively cost-effective.34 The high level of trading betweenfirms far surpassed levels observed in earlier environmental markets.35 EPA estimated savingsfrom the lead trading program of approximately twenty percent over alternative programs thatdid not provide for lead banking,36 a cost savings of about $250 million per year.
2.3 Water Quality Permit Trading
The United States has had very limited experience with tradable permit programs forcontrolling water pollution, though nonpoint sources, particularly agricultural and urbanrunoff, may constitute the major, remaining American water pollution problem.37 An"experimental program" to protect the Dillon Reservoir in Colorado demonstrates howtradable permits could be used, in theory, to reduce nonpoint-source water pollution.
Dillon Reservoir is the major source of water for the city of Denver. Nitrogen andphosphorus loading threatened to turn the reservoir eutrophic, despite the fact that point sourcesfrom surrounding communities were controlled to best-available technology standards.38 Rapidpopulation growth in Denver, and the resulting increase in urban surface water runoff, furtheraggravated the problem. In response, state policy makers developed a point-nonpoint-sourcecontrol program to reduce phosphorus flows, mainly from nonpoint urban and agriculturalsources. The program was implemented in 1984;39 it allowed publicly owned sewage treatmentworks to finance the control of nonpoint sources in lieu of upgrading their own treated effluents
33 In each year of the program, more than 60 percent of the lead added to gasoline was associated with traded leadcredits. See Robert W. Hahn and Gordon L. Hester, "Marketable Permits: Lessons for Theory and Practice," EcologyLaw Quarterly 16 (1989): 361-406.34 See: Kerr, Suzi and David Maré. "Efficient Regulation Through Tradable Permit Markets: The United States LeadPhasedown." Department of Agricultural and Resource Economics, University of Maryland, College Park, WorkingPaper 96-06, January 1997.35 The program did experience some relatively minor implementation difficulties related to imported leaded fuel. It isnot clear that a comparable command-and-control approach would have done better in terms of environmental quality.See U.S. General Accounting Office, Vehicle Emissions: EPA Program to Assist Leaded-Gasoline Producers NeedsPrompt Improvement, GAO/RCED-86-182 (Washington, DC: U.S. GAO, August 1986)36 See: U.S. Environmental protection Agency, Office of Policy Analysis, Costs and Benefits of Reducing Lead inGasoline, Final Regulatory Impact Analysis. Washington, DC: February 1985.37 See: Peskin, Henry M. "Nonpoint Pollution and National Responsibility." Resources (Spring 1986): p. 10-11, 17.38 See: Office of Policy Analysis, Environmental Protection Agency. "Case Studies on the Trading of Effluent Loads,Dillon Reservoir." Final Report, 1984.39 See: Kashmanian, R. "Beyond Categorical Limits: The Case for Pollution Reduction Through Trading."Unpublished paper presented at the 59th Annual Conference of the Water Pollution Control Federation, 1986.
Robert N. Stavins RFF 98-26
10
to drinking water standards.40 EPA estimated that the plan could save over $1 million peryear,41 due to differences in the marginal costs of control between nonpoint sources and thesewage treatment facilities. However, very limited trading occurred under the program,apparently because high regional precipitation diluted concentrations in the reservoir.
2.4 CFC Trading
A market in tradable permits was used in the United States to help comply with theMontreal Protocol, an international agreement aimed at slowing the rate of stratosphericozone depletion.42 The Protocol called for reductions in the use of CFCs and halons, theprimary chemical groups thought to lead to ozone depletion. The market places limitations onboth the production and consumption of CFCs by issuing allowances that limit theseactivities. The Montreal Protocol recognizes the fact that different types of CFCs are likely tohave different effects on ozone depletion, and so each CFC is assigned a different weight onthe basis of its depletion potential. If a firm wishes to produce a given amount of CFC, itmust have an allowance to do so,43 calculated on this basis.
Through mid-1991, there were 34 participants in the market and 80 trades.44 However,the overall efficiency of the market is difficult to determine, because no studies were conductedto estimate cost savings. The timetable for the phaseout of CFCs was subsequentlyaccelerated, and a tax on CFCs was introduced.45 Indeed, the tax may have become thebinding (effective) instrument.46 Nevertheless, relatively low transaction costs associated withtrading in the CFC market suggest that the system was relatively cost-effective.
40 See: Hahn, Robert. "Economic Prescriptions for Environmental Problems: How the Patient Followed the Doctor'sOrders." Journal of Economic Perspectives 3 (1989): p. 103.41 See: Hahn, Robert and Hester, Gordon. "Marketable Permits: Lessons for Theory and Practice." Ecology LawQuarterly 16 (1989): 395.42 The Montreal Protocol called for a 50-percent reduction in the production of particular CFCs from 1986 levels by1998. In addition, the Protocol froze halon production and consumption at 1986 levels beginning in 1992.43 See Hahn, Robert W. and Albert M. McGartland. "Political Economy of Instrumental Choice: An Examination ofthe U.S. Role in Implementing the Montreal Protocol." Northwestern University Law Review 83(1989):592-611.44 Letter from Richard D. Feldman, U.S. Environmental Protection Agency, 7 January 1991. In addition, there havebeen a very small number of international trades, but such trading is limited by the Montreal Protocol.45 The CFC tax was enacted principally as a "windfall-profits tax," to prevent private industry from retaining scarcityrents created by the quantity restrictions. See: Merrill, Peter R., and Ada S. Rousso. "Federal EnvironmentalTaxation." Presented at the Eighty-third Annual Conference of the National Tax Association, San Francisco,California, November 13, 1990.46 As of 1992, no firms were producing CFCs up to their maximum allowable level and permits could not be banked(carried forward). As a result, there was an excess supply of permits. It is possible, however, that there would be anexcess supply even if there were no tax and with an effective price of zero for permits, because firms reacted to changesin regulations and new policy initiatives that called for a more rapid phaseout of CFCs and halons.
Robert N. Stavins RFF 98-26
11
2.5 SO2 Allowance System
A centerpiece of the Clean Air Act Amendments of 1990 is a tradable permit systemthat regulates sulfur dioxide (SO2) emissions, the primary precursor of acid rain.47 Title IV ofthe Act reduces sulfur dioxide and nitrous oxide emissions by 10 million tons and 2 milliontons, respectively, from 1980 levels.48 The first phase of sulfur dioxide emissions reductionswas achieved by 1995, with a second phase of reduction to be accomplished by the year 2000.
In Phase I, individual emissions limits were assigned to the 263 most SO2-emissionsintensive generating units at 110 plants operated by 61 electric utilities, and located largely atcoal-fired power plants east of the Mississippi River. After January 1, 1995, these utilitiescould emit sulfur dioxide only if they had adequate allowances to cover their emissions.49
During Phase I, the EPA allocated each affected unit, on an annual basis, a specified numberof allowances related to its share of heat input during the baseline period (1985-87), plusbonus allowances available under a variety of special provisions.50 Cost-effectiveness ispromoted by permitting allowance holders to transfer their permits among one another andbank them for later use.
Under Phase II of the program, beginning January 1, 2000, almost all electric powergenerating units are brought within the system. Certain units are excepted to compensate forpotential restrictions on growth and to reward units that are already unusually clean. Iftrading permits represent the carrot of the system, its stick is a penalty of $2,000 per ton ofemissions that exceed any year's allowances (and a requirement that such excesses be offsetthe following year).
A robust market of bilateral SO2 permit trading has emerged, resulting in cost savingson the order of $1 billion annually, compared with the costs under command-and-controlregulatory alternatives.51 Although the program had low levels of trading in its early years,52
47 See Clean Air Act Amendments of 1990, Public Law No. 101-549, 104 Statute 2399, 1990.48 For a description of the legislation, see Ferrall, Brian L. "The Clean Air Act Amendments of 1990 and the use ofMarket Forces to Control Sulfur Dioxide Emissions." Harvard Journal on Legislation 28 (1991): 235-252.49 Under specified conditions, utilities that had installed coal scrubbers to reduce emissions could receive two-yearextensions of the Phase I deadline plus additional allowances.50 Utilities that install scrubbers receive bonus allowances for early clean up. Also, specified utilities in Ohio,Indiana, and Illinois receive extra allowances during both phases of the program. All of these extra allowances areessentially compensation intended to benefit Midwestern plants which rely on high-sulfur coal. On the politicalorigins of this aspect of the program, see: Joskow, Paul L. and Richard Schmalensee. "The Political Economy ofMarket-based Environmental Policy: The U.S. Acid Rain Program." Journal of Law and Economics 41(1998), April,forthcoming.51 Cost savings are the difference between the costs experienced with the allowance trading program and what thecosts would otherwise have been. Hence, any estimate of cost savings is sensitive to the choice of counterfactual forcomparison purposes.52 See: Burtraw, Dallas. "The SO2 Emissions Trading Program: Cost Savings Without Allowance Trades."Contemporary Economic Policy 14(1996):79-94.
Robert N. Stavins RFF 98-26
12
trading levels increased significantly over time.53 Concerns have been expressed that stateregulatory authorities would hamper trading in order to protect their domestic coal industries,and some research indicates that state public utility commission cost-recovery rules haveprovided poor guidance for compliance activities.54 Other analysis suggests that this has notbeen a major problem.55 Similarly, in contrast to early assertions that the structure of EPA'ssmall permit auction market would cause problems,56 the evidence now indicates that this hashad little or no effect on the vastly more important bilateral trading market.57
2.6 The RECLAIM Program
The South Coast Air Quality Management District (SCAQMD), which is responsiblefor controlling emissions in a four-county area of southern California, launched a tradablepermit program in January, 1994, to reduce nitrogen dioxide and sulfur oxide emissions in theLos Angeles area.58 As of June 1996, 353 participants in this Regional Clean Air IncentivesMarket (RECLAIM) program, had traded more than 100,000 tons of nitrogen oxide (NOx)and SO2 emissions, at a value of over $10 million.59 The RECLAIM program, whichoperates through the issuance of permits that authorize specified decreasing levels of pollutionover time, governs stationary sources that have emitted more than four tons of NOx and SO2
53 For an assessment of the program's performance, see: Schmalensee, Richard, Paul L. Joskow, A. Denny Ellerman,Juan Pablo Montero, and Elizabeth M. Bailey. "An Interim Evaluation of Sulfur Dioxide Emissions Trading."Journal of Economic Perspectives, forthcoming, 1998; and Stavins, Robert N. "What Have We Learned from theGrand Policy Experiment: Positive and Normative Lessons from SO2 Allowance Trading." Journal of EconomicPerspectives, forthcoming, 1998.54 See: Rose, Kenneth. "Implementing an Emissions Trading Program in an Economically Regulated Industry:Lessons from the SO2 Trading Program," in Market Based Approaches to Environmental Policy: RegulatoryInnovations to the Fore, Richard F. Kosobud and Jennifer M. Zimmerman, eds. New York: Van Nostrand Reinhold,1997; and Bohi, Douglas. "Utilities and State Regulators Are Failing to Take Advantage of Emissions AllowanceTrading." The Electricity Journal 7(1994):20-27.55 See: Bailey, Elizabeth M. "Allowance Trading Activity and State Regulatory Rulings: Evidence from the U.S.Acid Rain Program." MIT-CEEPR 96-002 WP, Center for Energy and Environmental Policy Research, MassachusettsInstitute of Technology, 1996.56 See: Cason, Timothy N. "An Experimental Investigation of the Seller Incentives in EPA's Emission TradingAuction." American Economic Review 85(1995):905-922.57 See: Joskow, Paul L., Richard Schmalensee, and Elizabeth M. Bailey. "Auction Design and the Market for SulfurDioxide Emissions." American Economic Review, forthcoming, 1997.58 For a detailed case study of the evolution of the use of economic incentives in the SCAQMD, see chapter 2 in TheEnvironment Goes to Market: The Implementation of Economic Incentives for Pollution Control. National Academy ofPublic Administration, July 1994. See also: Thompson, Dale B. "The Political Economy of the RECLAIM EmissionsMarket for Southern California." Working paper, University of Virginia, March 1997.59 See Brotzman, Thomas. "Opening the Floor to Emissions Trading." Chemical Marketing Reporter (May 27, 1996):p. SR8. For an early assessment of the program, see: Johnson, Scott Lee and David M. Pekelney. "EconomicAssessment of the Regional Clean Air Incentives Market: A New Emissions Trading Program for Los Angeles." LandEconomics 72(1996):277-297. A prospective critique was provided by: Johnston, James L. "Pollution Trading in LaLa Land." Regulation, 1994, number 3, pp. 44-54.
Robert N. Stavins RFF 98-26
13
annually since 1990.60 The SCAQMD has considered expanding the program to allowtrading between stationary and mobile sources.61
2.7 Transferable Development Rights
There is a considerable history of local governments in the United States usingtransferable development rights to balance some of the attributes and amenities ordinarilyaddressed by zoning provisions with the demands of economic growth and change.62 Arelatively recent application of the same general instrument with an environmental focus hasbeen for the protection of wetlands.
Certain development activities in wetlands are regulated in the United States bySection 404 of the Clean Water Act, which establishes conditions and procedures under whichsuch activities can occur. Firms or individuals must apply for permits for activities that willhave negative impacts on wetlands. In some cases, compensating mitigation is required ofpotential developers, and applicants are allowed to purchase mitigation credits from landbanks to meet these obligations.63 These mitigation banks have been established in a numberof states, including: California, Florida, Minnesota, New Jersey, and North Carolina.
3. U.S. EXPERIENCE WITH CHARGE SYSTEMS
The conventional wisdom is that U.S. environmental policy has made increasing useof tradable permit systems, while essentially ignoring the option of taxes or charges. This isnot strictly correct, and if one defines charge systems broadly, a significant number ofapplications can be identified. These applications can be categorized as: effluent charges;deposit-refund systems; user charges; insurance premia; sales taxes; administrative charges;and tax differentiation.
Most applications of charge systems in the United States have probably not had theincentive effects associated with a Pigovian tax, either because of the structure of the systems
60 Some sources, such as equipment rental facilities and essential public services (including landfills and wastewatertreatment facilities), are excluded.61 See Fulton, William. "The Big Green Bazaar." Governing Magazine (June 1996): page 38.62 See, for example: Field, B. C. and J. M. Conrad. "Economic Issues in Programs of Transferable DevelopmentRights." Land Economics 51(1975):331-340; Bellandi, R. L. and R. B. Hennigan. "The Why and How ofTransferable Development Rights." Real Estate Review 7(1977):60-64; and Mills, D. E. "Transferable DevelopmentRights Markets." Journal of Urban Economics 7(1980):63-74.63 See: Tripp, James T. B. and Daniel J. Dudek. "Institutional Guidelines for Designing Successful TransferableRights Programs." Yale Journal of Regulation 6(1989):369-391; Voigt, Paul C., and Leon E. Danielson. "WetlandsMitigation Banking Systems: A Means of Compensating for Wetlands Impacts." Applied Resource Economics andPolicy Group Working Paper AREP96-2, Department of Agricultural and Resource Economics, North Carolina StateUniversity, 1996; and Scodari, Paul, Leonard Shabman, and D. White. "Commercial Wetland Mitigation CreditMarkets: Theory and Practice." IWR Report 95-WMB-7. Institute for Water Resources, Water Resources SupportCenter. Alexandria, Virginia: U.S. Army Corps of Engineers, 1995.
Robert N. Stavins RFF 98-26
14
or because of the low levels at which charges have been set.64 Nevertheless, it appears that alimited number of these systems may have affected behavior.
3.1 Effluent Charges
The closest that any charge system comes in the United States to operating as aPigovian tax may be the unit-charge approach to financing municipal solid waste collection,where households (and businesses) are charged the incremental costs of collection anddisposal.65 So called "pay-by-the-bag" policies, where users pay in proportion to the volumeof their waste, are now used in well over one hundred jurisdictions.66 This collectiveexperience provides evidence that unit charges have been somewhat successful in reducingthe volume of household waste generated.67
3.2 Deposit-Refund Systems
As the costs of legal disposal increase, incentives for improper (illegal) disposal alsoincrease. Hence, waste-end fees designed to cover the costs of disposal, such as unit curbsidecharges, can lead to increased incidence of illegal dumping.68 For waste that poses significanthealth or ecological impacts, ex post clean up is an unattractive option. For these waste
64 Effluent charges have been used more extensively in Europe than in the United States, although it is questionablewhether the levels have been sufficient to affect behavior in significant ways. For a discussion of the economics andpolitics surrounding taxation of sulfur dioxide, nitrous oxide, and carbon dioxide in the Scandinavian nations, theNetherlands, France, and Germany, see: Cansier, D., and R. Krumm. "Air Pollution Taxation: An Empirical Survey."Ecological Economics. Forthcoming, 1998. Also see: Organization for Economic Cooperation and Development.Taxation and the Environment, Complementary Policies. Paris, 1993; and Organization for Economic Cooperationand Development. Environmental Taxation in OECD Countries. Paris, 1995.65 See the chapter on solid waste policy in this volume.66 See: U.S. Congress, Office of Technology Assessment. Environmental Policy Tools: A Users Guide. Washington,D.C., 1995.67 See: Efaw, Fritz and William N. Lanen. "Impact of User Charges on Management of Household Solid Waste."Report prepared for the U.S. Environmental Protection Agency under Contract No. 68-3-2634. Princeton, NJ:Mathtech, Inc., 1979; McFarland, J. M. "Economics of Solid Waste Management." In Comprehensive Studies of SolidWaste Management, Final Report. Sanitary Engineering Research Laboratory, College of Engineering and School ofPublic Health, Report no. 72-3:41-106, University of California, Berkeley, CA, 1972; Skumatz, Lisa A. "Volume-Based Rates in Solid Waste: Seattle's Experience." Report for the Seattle Solid Waste Utility. Seattle: Seattle SolidWaste Utility, 1990; Stevens, B. J. "Scale, Market Structure, and the Cost of Refuse Collection." The Review ofEconomics and Statistics 40(1978):438-448; Wert, Kenneth L. "Economic Factors Influencing Households' Productionof Refuse." Journal of Environmental Economics and Management 2(1976):263-72; Lave, Lester and HowardGruenspecht. "Increasing the Efficiency and Effectiveness of Environmental Decisions: Benefit-Cost Analysis andEffluent Fees" Journal of Air and Waste Management 41:680-690 (May 1991); Repetto, Robert, Roger C. Dower,Robin Jenkins, and Jacqueline Geoghegan. Green Fees: How a Tax Shift Can Work for the Environment and theEconomy. World Resources Institute: Washington D.C., 1992; and Miranda, Marie Lynn, Jess W. Everett, DanielBlume, and Barbeau A. Roy Jr. "Market-Based Incentives and Residential Municipal Solid Waste." Journal of PolicyAnalysis and Management 13(1994):681-698.68 See: Fullerton, Don and Thomas C. Kinnarnan. "Garbage, Recycling and Illicit Burning or Dumping." Journal ofEnvironmental Economics and Management 29(1995):78-92; and Fullerton, Don and Thomas C. Kinnarnan."Household Responses to Pricing Garbage by the Bag." American Economic Review 86(1996):971-984.
Robert N. Stavins RFF 98-26
15
products, the prevention of improper disposal is particularly important. One alternative mightseem to be a front-end tax on waste precursors, since such a tax would give manufacturersincentives to find safer substitutes and to recover and recycle taxed materials. But substitutesmay not be available at reasonable costs, and once wastes are generated, incentives that affectchoices of disposal methods are still problematic.
This dilemma can be resolved with a special front-end charge (deposit) combined witha refund payable when quantities of the substance in question are turned in for recycling ordisposal. This refund can provide an incentive to follow rules for proper disposal (and toprevent losses in the process in which the substance is used). The mechanics of the systemvary by product, but the general framework is that producers or initial users of regulatedmaterials pay a deposit when those materials enter the production process. In principle, thesize of the deposit is based upon the social cost of the product being disposed of illegally. Asthe product changes hands in the production and consumption process (through wholesalersand distributors to consumers), the purchaser of the product pays a deposit to the seller. Thus,once the producer sells the product, responsibility for proper disposal is passed to the nextparty, this process continuing until the ultimate consumer of the good turns the product in to acertified collection center responsible for recycling or proper disposal.
Deposit-refund systems69 are most likely to be appropriate when the incidence and theconsequences of improper disposal are great,70 but these systems have frequently beenportrayed as mechanisms to foster greater levels of recycling. In general, properly scaleddeposit-refund systems can be attractive for three reasons. First, government's monitoringproblem is converted from the nearly impossible one of preventing illegal dumping of smallquantities of waste at diverse sites in the environment to what may be the more manageableproblem of assuring that products being returned for refund are what they are purported to be.Second, the system can provide firms with incentives to prevent losses of the material in theindustrial process in which it is used. Third, because of inevitable net losses in the productionand consumption processes, incentives exist for firms to look for less environmentallydamaging substances--that is, substances to which the deposit-refund system does not apply.71
For some products, a nationwide approach may be appropriate if: firms face national marketsand products are easily transportable; toxicity problems associated with improper disposal donot vary greatly by geographic area; and the national approach is likely to be less costly formanufacturers and recyclers than a diversity of state or local programs.
The major application of this approach in the United States has been in the form ofstate-level "bottle bills" for beverage containers (Table 2). A brief examination of these
69 See: Bohm, Peter. Deposit-Refund Systems: Theory and Applications to Environmental, Conservation, andConsumer Policy. Baltimore: Resources for the Future, Johns Hopkins University Press, 1981.70 See: Macauley, Molly K., Michael D. Bowes, and Karen L. Palmer. Using Economic Incentives to Regulate ToxicSubstances. Washington, D.C.: Resources for the Future, 1992.71 For further discussion of this point, see: Russell, Clifford S. "Economic Incentives in the Management ofHazardous Wastes." Columbia Journal of Environmental Law 13(1988):257-274.
Robert N. Stavins RFF 98-26
16
systems provides some insights into the merits and the limitations of the approach. Deposit-refund systems on beverage containers have been implemented in nine states to reducelittering and reduce the flow of solid waste to landfills, but since the initial enthusiasm in thelate 1970s, no other states have taken action.
* In California, deposits for aluminum and bi-metal beverage containers smaller than 24 ounces are 2.5¢ and5¢, respectively, and 3¢ and 6¢, respectively, for containers 24 ounces and larger.
SOURCE: U.S. General Accounting Office. Solid Waste: Trade-Offs Involved in Beverage ContainerDeposit Legislation. Report GAO/RCED-91-25. Washington, D.C., 1990; and U.S. EnvironmentalProtection Agency. States' Efforts to Promote Lead-Acid Battery Recycling. Washington, D.C., 1992.
Robert N. Stavins RFF 98-26
17
In most programs, consumers pay a deposit at the time of purchase which can berecovered by returning the empty container to a redemption center. Typically, the deposit isthe same regardless of the type of container. In some respects, these bills seem to haveaccomplished their objectives; in Michigan, for example, the return rate of containers one yearafter the program was implemented was 95 percent;72 and in Oregon, littering was reducedand long-run savings in waste management costs were achieved.73
By charging the same amount for each type of container material, however, theseprograms do not encourage consumers to choose containers with the lowest product life-cyclecosts (including those of disposal). In particular, bottle bills may encourage a shift ofconsumer purchases from metals to plastics, which are less recyclable with current technology.Furthermore, by requiring consumers to separate containers and deliver them to redemptioncenters, deposit-refund systems can foster net welfare losses, rather than gains. Additionally,by removing some of the most profitable elements from the waste stream, bottle bills mayundermine the viability of more comprehensive alternatives, such as curbside programs.
Analysis of the effectiveness, let alone the cost-effectiveness or efficiency, of beveragecontainer deposit-refund systems has been limited.A major cost of bottle bills is associated withlabor and capital required for implementation, including, for example, the area set aside andlabor employed at grocery stores for collection purposes. Also of economic significance are thepersonal inconvenience costs of returning containers to retail outlets. These inconveniencecosts may be quite significant, and the few rigorous studies that have been carried out of thebenefits and costs of bottle bills have found that the social desirability of deposit law dependscritically on the value of the time it takes consumers to return empty containers.74
Deposit-refund systems are most likely to be appropriate where: (1) the objective is one ofreducing illegal disposal, as opposed to such objectives as general reductions in the waste stream orincreased recycling; and (2) there is a significant asymmetry between ex ante and ex post clean-upcosts. For these reasons, deposit refund systems may be among the best policy options to addressdisposal problems associated with containerizable hazardous waste, such as lead.75
As a means of reducing the quantity of lead entering unsecured landfills and otherpotentially sensitive sites, several states have enacted deposit-refund programs for lead acidmotor vehicle batteries (Table 2).76 Under these systems, a deposit is collected when
72 See: Porter, Richard. "Michigan's Experience with Mandatory Deposits on Beverage Containers." LandEconomics 59(1983):177-194.73 U.S. General Accounting Office. Solid Waste: Trade-offs Involved in Beverage Container Deposit Legislation.Report #GAO/RCED-91-25. Washington, D.C., 1990.74 See, for example: Porter, Richard. "A Social Benefit-Cost Analysis of Mandatory Deposits on BeverageContainers." Journal of Environmental Economics and Management 5(1978):351-375.75 See: Sigman, Hilary A.. "A Comparison of Public Policies for Lead Recycling," RAND Journal of Economics.Vol. 26, No. 3, Autumn (1995):452-478.76 Minnesota was the first state to implement deposit refund legislation for car batteries in 1988. By 1991, there wereten states with such legislation: Arizona, Arkansas, Connecticut, Idaho, Maine, Michigan, Minnesota, New York,Rhode Island, and Washington. Deposits range from $5 to $10.
Robert N. Stavins RFF 98-26
18
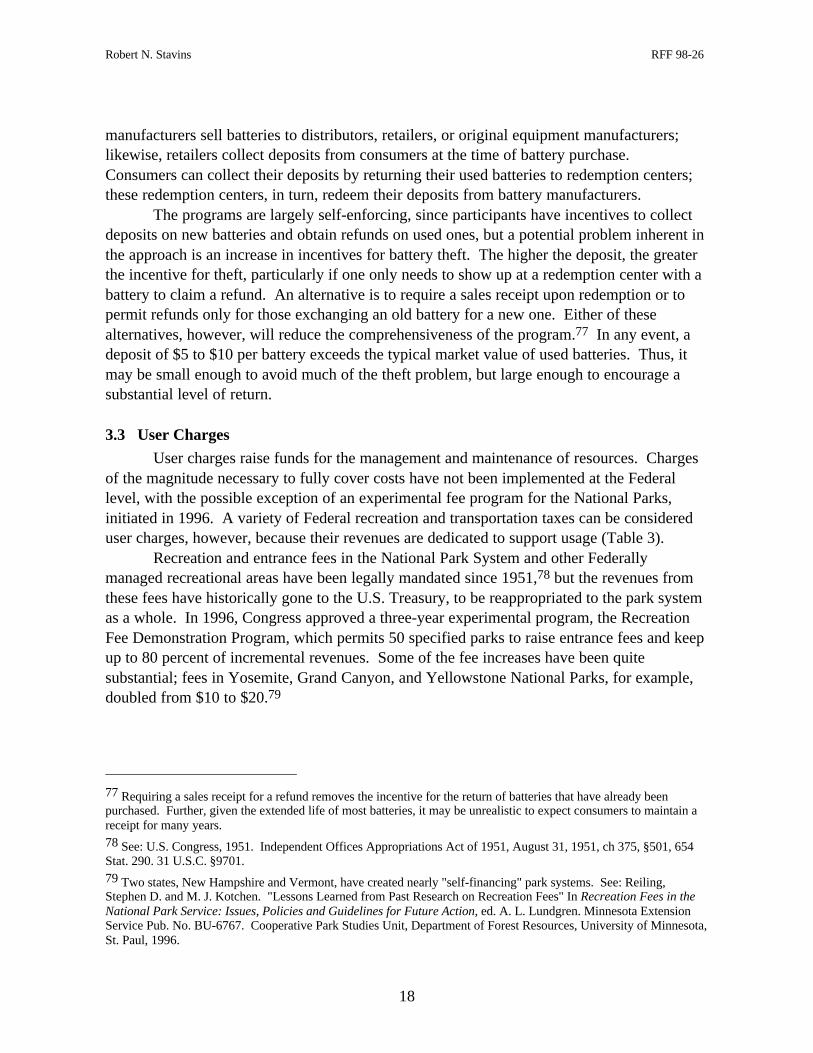
manufacturers sell batteries to distributors, retailers, or original equipment manufacturers;likewise, retailers collect deposits from consumers at the time of battery purchase.Consumers can collect their deposits by returning their used batteries to redemption centers;these redemption centers, in turn, redeem their deposits from battery manufacturers.
The programs are largely self-enforcing, since participants have incentives to collectdeposits on new batteries and obtain refunds on used ones, but a potential problem inherent inthe approach is an increase in incentives for battery theft. The higher the deposit, the greaterthe incentive for theft, particularly if one only needs to show up at a redemption center with abattery to claim a refund. An alternative is to require a sales receipt upon redemption or topermit refunds only for those exchanging an old battery for a new one. Either of thesealternatives, however, will reduce the comprehensiveness of the program.77 In any event, adeposit of $5 to $10 per battery exceeds the typical market value of used batteries. Thus, itmay be small enough to avoid much of the theft problem, but large enough to encourage asubstantial level of return.
3.3 User Charges
User charges raise funds for the management and maintenance of resources. Chargesof the magnitude necessary to fully cover costs have not been implemented at the Federallevel, with the possible exception of an experimental fee program for the National Parks,initiated in 1996. A variety of Federal recreation and transportation taxes can be considereduser charges, however, because their revenues are dedicated to support usage (Table 3).
Recreation and entrance fees in the National Park System and other Federallymanaged recreational areas have been legally mandated since 1951,78 but the revenues fromthese fees have historically gone to the U.S. Treasury, to be reappropriated to the park systemas a whole. In 1996, Congress approved a three-year experimental program, the RecreationFee Demonstration Program, which permits 50 specified parks to raise entrance fees and keepup to 80 percent of incremental revenues. Some of the fee increases have been quitesubstantial; fees in Yosemite, Grand Canyon, and Yellowstone National Parks, for example,doubled from $10 to $20.79
77 Requiring a sales receipt for a refund removes the incentive for the return of batteries that have already beenpurchased. Further, given the extended life of most batteries, it may be unrealistic to expect consumers to maintain areceipt for many years.78 See: U.S. Congress, 1951. Independent Offices Appropriations Act of 1951, August 31, 1951, ch 375, §501, 654Stat. 290. 31 U.S.C. §9701.79 Two states, New Hampshire and Vermont, have created nearly "self-financing" park systems. See: Reiling,Stephen D. and M. J. Kotchen. "Lessons Learned from Past Research on Recreation Fees" In Recreation Fees in theNational Park Service: Issues, Policies and Guidelines for Future Action, ed. A. L. Lundgren. Minnesota ExtensionService Pub. No. BU-6767. Cooperative Park Studies Unit, Department of Forest Resources, University of Minnesota,St. Paul, 1996.
Robert N. Stavins RFF 98-26
19
Table 3. Federal User Charges
Item TaxedFirst
Enacted/Modified Rate Use of Revenues
Motor fuels 1932/1993 $.183/gal
Annual use of heavy vehicles 1951/1993 $100-$500/vehicle
Non-highway recreational fuels andsmall-engine motor fuels
1932/1993 $.183/gal gasoline$.243/gal diesel
National Recreational TrailsTrust Fund and WetlandsAccount of AquaticResources Trust Fund
Sport fishing equipment 1917/198410% (except 3% for
outboard motors)Sport Fishing RestorationAccount of AquaticResources Trust Fund
Bows and arrows 1972/1984 11%
Firearms and ammunition 1918/1969 10%
Federal Aid to WildlifeProgram
SOURCE: Barthold, Thomas A. "Issues in the Design of Environmental Excise Taxes," Journal of EconomicPerspectives 8(1994), number 1, pp. 133-151.
3.4 Insurance Premium Taxes
A number of Federal taxes are levied on industries or groups to fund insurance poolsagainst potential environmental risks associated with the production or use of taxed products(Table 4). Such taxes can have the effect of encouraging firms to internalize environmentalrisks in their decision making, but, in practice, these taxes have frequently not been targeted atrespective risk-creating activities. For example, to support the Oil Spill Liability Trust Fund,all petroleum products are taxed, regardless of how they are transported, possibly creatingsmall incentives to use less petroleum, but not to use safer ships or other means of transport.
An excise tax on specified hazardous chemicals is used to fund (partially) the clean-upof hazardous waste sites through the Superfund program. The tax functions as an insurancetax to the extent that funds are used for future clean-ups.80 The Leaking UndergroundStorage Trust Fund, established in 1987, is replenished through taxes on all petroleum fuels,81
80 See: Barthold, Thomas A. "Issues in the Design of Environmental Excise Taxes." Journal of EconomicPerspectives 8(1994), number 1, pp. 133-151.81 See: Public Law 99-499, Sec. 522(a), 1986.
Robert N. Stavins RFF 98-26
20
and the Oil Spill Liability Trust Fund, established subsequent to the Exxon Valdez oil spill,receives revenue from a tax on petroleum and petroleum products. The fund can be used tomeet unrecovered claims from oil spills.82 Finally, the Black Lung Disability Trust Fund wasestablished in 1954 to pay miners who became sick and unable to work because of prolongedexposure to coal dust in mines. Since 1977, it has been financed by excise taxes on coal fromunderground and surface mines.83
Table 4. Federal Insurance Premium Taxes
Item/Action TaxedFirst
Enacted/Modified
Rate Use of Revenues
Chemical production 1980/1986 $.22 to $4.88/ton
Petroleum production 1980/1986 $.097/barrel crude
Corporate income 1986 0.12%
Superfund (CERCLA)
Petroleum and petroleum products 1989/1990 $.05/barrel Oil Spill Liability TrustFund
SOURCE: Barthold, Thomas A. "Issues in the Design of Environmental Excise Taxes," Journal of EconomicPerspectives 8 (1994), number 1, pp. 133-151.
3.5 Sales Taxes
It has been argued that only two Federal sales taxes are have affected behavior in themanner of a Pigouvian tax: the "gas guzzler tax" on new cars, and the excise tax on ozone-depleting chemicals,84 although it is far from clear that the CFC tax actually affected businessdecisions (Table 5).
82 See: Public Law 101-239, Revenue Reconciliation Act of 1989.83 See: Sect. 9501 of Internal Revenue Code of 1954.84 See: Barthold, Thomas A. "Issues in the Design of Environmental Excise Taxes." Journal of EconomicPerspectives 8(1994), number 1, pp. 133-151.
Robert N. Stavins RFF 98-26
21
Table 5. Federal Sales Taxes
Item/Action TaxedFirst
Enacted/Modified
Rate Use of Revenues
New automobiles exceeding fuelefficiency maxima
1978/1990 $1,000 - $7,700per auto
U.S. Treasury
Ozone-depleting substances 1989/1992 $4.35/pound U.S. Treasury
New tires 1918/1984 $.15 - $.50/pound U.S. Treasury
SOURCE: Barthold, Thomas A. "Issues in the Design of Environmental Excise Taxes," Journal of EconomicPerspectives 8 (1994), number 1, pp. 133-151.
The Energy Tax Act of 1978 established a "gas guzzler" tax on the sale of newvehicles that fail to meet statutory fuel efficiency levels, set at 22.5 miles per gallon. The taxranges from $1,000 to $7,700 per vehicle, based on fuel efficiency; but the tax does notdepend on actual performance or on mileage driven. The tax is intended to discourage theproduction and purchase of fuel inefficient vehicles,85 but it applies to a relatively small set ofluxury cars, and so has had limited effects.86
To meet international obligations established under the Montreal Protocol to limit therelease of chemicals that deplete stratospheric ozone, the Federal government set up a tradablepermit system and levied an excise tax on specific chlorflourocarbons in 1989. Producers arerequired to have adequate allowances, and users pay a fee (set proportional to a chemical-specific ozone depleting factor). There is considerable debate regarding which mechanismshould be credited with the successful reduction in the use of these substances.87
Additionally, several states impose taxes on fertilizers and pesticides, but at levelsbelow that required to affect behavior significantly. The taxes generate revenues that are usedto finance environmental programs. For example, the Iowa Groundwater Protection Act of1987 imposes taxes on fertilizers and pesticides (0.1 percent on pesticide sales at the retaillevel, 0.2 percent of manufacturer sales, and $.75 per ton of nitrogen fertilizer). Revenuesfund statewide programs for sustainable agriculture and for testing and research on publicwater supplies.88
85 See: U.S. Congress. 26 USC Sec. 4064, Gas Guzzler Tax. 1978.86 Light trucks, which include "sport utility vehicles," are fully exempt from the tax. See: Bradsher, Keith. "LightTrucks Increase Profits But Foul Air More than Cars." New York Times, November 30, 1997, pp. A1, A38-A39.87 See: Hahn, Robert W. and Albert M. McGartland. "Political Economy of Instrumental Choice: An Examination ofthe U.S. Role in Implementing the Montreal Protocol." Northwestern University Law Review 83(1989):592-611; U.S.Congress. The Omnibus Budget Reconciliation Act of 1989 Sect. 7506: Excise Tax on the Sale of Chemicals WhichDeplete the Ozone Layer and of Products Containing Such Chemicals. Washington, DC., 1989; and U.S. Congress,Office of Technology Assessment. Environmental Policy Tools: A Users Guide. Washington, D.C., 1995.88 See: Morandi, Larry. "An Outside Perspective on Iowa's 1987 Groundwater Protection Act," National Conferenceof State Legislatures, 1992; and International Institute for Sustainable Development. Green Budget Reform: AnInternational Casebook on Leading Practices. London: EarthScan, 1995.
Robert N. Stavins RFF 98-26
22
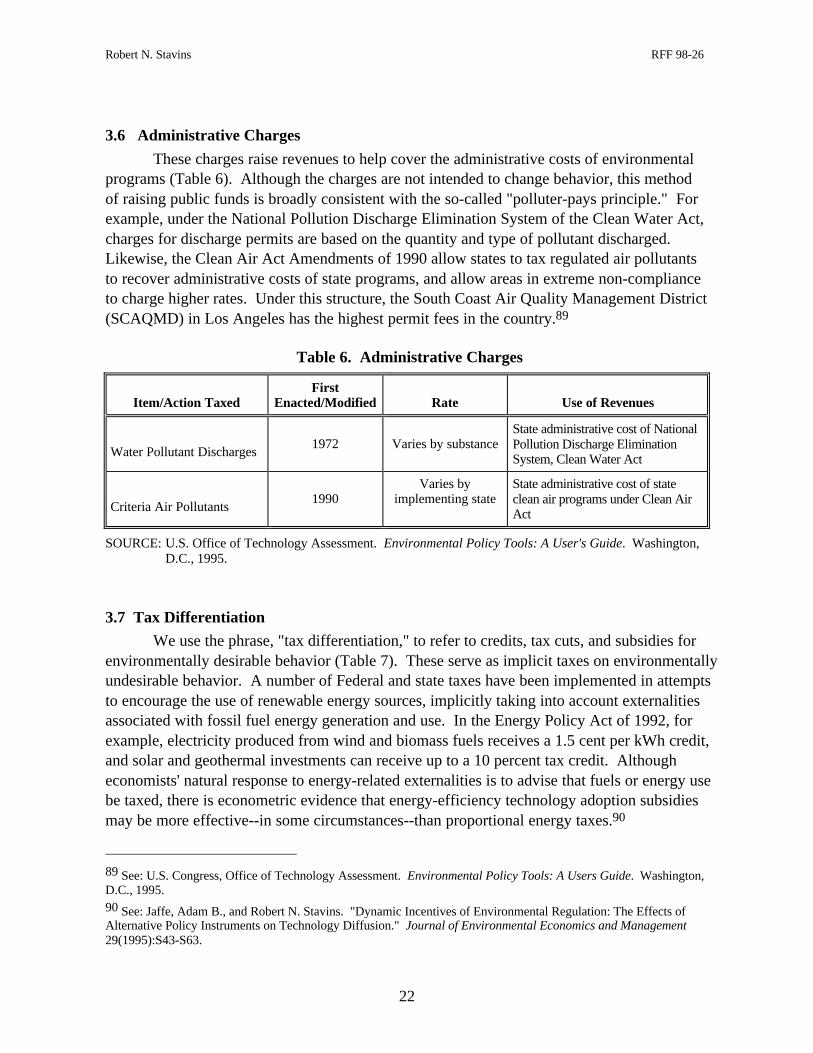
3.6 Administrative Charges
These charges raise revenues to help cover the administrative costs of environmentalprograms (Table 6). Although the charges are not intended to change behavior, this methodof raising public funds is broadly consistent with the so-called "polluter-pays principle." Forexample, under the National Pollution Discharge Elimination System of the Clean Water Act,charges for discharge permits are based on the quantity and type of pollutant discharged.Likewise, the Clean Air Act Amendments of 1990 allow states to tax regulated air pollutantsto recover administrative costs of state programs, and allow areas in extreme non-complianceto charge higher rates. Under this structure, the South Coast Air Quality Management District(SCAQMD) in Los Angeles has the highest permit fees in the country.89
Table 6. Administrative Charges
Item/Action TaxedFirst
Enacted/Modified Rate Use of Revenues
Water Pollutant Discharges1972 Varies by substance
State administrative cost of NationalPollution Discharge EliminationSystem, Clean Water Act
Criteria Air Pollutants1990
Varies byimplementing state
State administrative cost of stateclean air programs under Clean AirAct
SOURCE: U.S. Office of Technology Assessment. Environmental Policy Tools: A User's Guide. Washington,D.C., 1995.
3.7 Tax Differentiation
We use the phrase, "tax differentiation," to refer to credits, tax cuts, and subsidies forenvironmentally desirable behavior (Table 7). These serve as implicit taxes on environmentallyundesirable behavior. A number of Federal and state taxes have been implemented in attemptsto encourage the use of renewable energy sources, implicitly taking into account externalitiesassociated with fossil fuel energy generation and use. In the Energy Policy Act of 1992, forexample, electricity produced from wind and biomass fuels receives a 1.5 cent per kWh credit,and solar and geothermal investments can receive up to a 10 percent tax credit. Althougheconomists' natural response to energy-related externalities is to advise that fuels or energy usebe taxed, there is econometric evidence that energy-efficiency technology adoption subsidiesmay be more effective--in some circumstances--than proportional energy taxes.90
89 See: U.S. Congress, Office of Technology Assessment. Environmental Policy Tools: A Users Guide. Washington,D.C., 1995.90 See: Jaffe, Adam B., and Robert N. Stavins. "Dynamic Incentives of Environmental Regulation: The Effects ofAlternative Policy Instruments on Technology Diffusion." Journal of Environmental Economics and Management29(1995):S43-S63.
Robert N. Stavins RFF 98-26
23
From 1979 to 1985, employers could provide implicit subsidies to employees forcertain commuting expenses, such as free van pools and mass transit passes on a tax-freebasis. Likewise, subsidies from utilities for energy conservation investments have beenexcludable from individual income taxes. On the state and local level, many jurisdictionsoffer subsidies and various kinds of tax relief to encourage investments in technologies thatuse recycled products.91
Non-conventional Fuels 1980/1990 $3.00/Btu-barrelequivalent of oil
Wind Production 1992 1.5¢/kWh
Biomass Production 1992 1.5¢/kWh
Income Tax Credits
Electric Automobiles 1992 10% credit
Van Pools 1978
Mass Transit Passes 1984/1992
Tax-free employerprovided benefits
Other Income Tax Provisions
Utility Rebates 1992Exclusion of subsidiesfrom utilities for energyconservation measures
Mass Transit 1968/1986
Sewage Treatment 1968/1986
Solid Waste Disposal 1968/1986
Waster Treatment 1968/1986
Tax Exempt Private Activity Bonds
High Speed Rail 1988/1993
Interest exempt fromFederal taxation
SOURCE: Barthold, Thomas A. "Issues in the Design of Environmental Excise Taxes." Journal of EconomicPerspectives 8(1994), number 1, pp. 133-151.
91 See the chapter on solid waste policy in this volume.
Robert N. Stavins RFF 98-26
24
4. U.S. EXPERIENCE WITH REDUCING MARKET BARRIERS
In some situations, environmental protection can be fostered by reducing explicit orimplicit barriers to market activity. We consider three types of such market barrier reductions:(1) market creation, as with measures that facilitate the voluntary exchange of water rights andthus promote more efficient allocation and use of scarce water supplies; (2) liability rules thatencourage firms to consider the potential environmental damages of their decisions; and(3) information programs, such as energy-efficiency product labeling requirements.
4.1 Market Creation
Two examples of using market creation as an instrument of environmental policy stand out:measures that facilitate the voluntary exchange of water rights and thus promote more efficientallocation and use of scarce water supplies; and particular policies that facilitate the restructuringof electricity generation and transmission. We consider both in this section of the chapter.
First, the western United States has long been plagued by inefficient use and allocationof its scarce water supplies, largely because users do not have incentives to take actionsconsistent with economic and environmental values. Voluntary market-oriented transfers ofwater rights have begun to address this problem by encouraging rational conservation measures,better allocation of supplies among competing users, and improvement in water quality.
For more than a decade, economists have noted that Federal and state water policieshave been aggravating, not abating, these problems.92 For example, as recently as 1990, inthe Central Valley of California, some farmers were paying as little as $10 for water toirrigate an acre of cotton, while just a few hundred miles away in Los Angeles, localauthorities were paying up to $600 for the same quantity of water. This dramatic disparityprovided evidence that increasing urban demands for water could be met at relatively low costto agriculture or the environment (i.e., without constructing new, environmentally-disruptivedams and reservoirs). Subsequent reforms allowed markets in water to develop, so thatvoluntary exchanges could take place that made both parties better off. For example, anagreement was reached to transfer 100,000 acre-feet of water per year from the farmers of theImperial Irrigation District (IID) in southern California to the Metropolitan Water District(MWD) in the Los Angeles area.93 Subsequently, policy reforms spread throughout the west,
92 See: Anderson, Terry L. Water Crisis: Ending the Policy Drought. Washington, D.C.: Cato Institute, 1983;Frederick, Kenneth D., ed. Scarce Water and Institutional Change. Washington, D.C.: Resources for the Future, 1986;El-Ashry, Mohamed T. and Diana C. Gibbons. Troubled Waters: New Policies for Managing Water in the AmericanWest. Washington, D.C.: World Resources Institute, 1986; and Wahl, Richard W. Markets for Federal Water:Subsidies, Property Rights, and the Bureau of Reclamation. Washington, D.C.: Resources for the Future, 1989.93 In March of 1983, the Environmental Defense Fund (EDF) published a proposal calling for MWD to finance themodernization of IID's water system in exchange for use of conserved water. See: Stavins, Robert N. TradingConservation Investments for Water. Berkeley, California: Environmental Defense Fund, March, 1983. In November,1988, after five years of negotiation, the two water giants agreed on a $230 million water conservation and transferarrangement, much like EDF's original proposal to trade conservation investments for water. See: Morris, Willy. "IIDApproves State's First Water Swap with MWD." Imperial Valley Press, November 9, 1988.
Robert N. Stavins RFF 98-26
25
and transactions emerged elsewhere in California, and in Colorado, New Mexico, Arizona,Nevada, and Utah.94
A second example of "market creation" is the current revolution in electricityrestructuring that is motivated by economic concerns95 but may have significantenvironmental impacts. For many years, utilities--closely overseen by state public utilitycommissions (PUCs)--have provided electricity within exclusive service areas. The utilitieswere granted these monopoly markets and guaranteed a rate of return on their investments,conditional upon their setting reasonable rates and meeting various social objectives, such asuniversal access. The Energy Policy Act of 1992 took a major step toward opening theindustry up to competition by allowing independent electricity generating companies to sellpower directly to utilities, and in 1996, the Federal Energy Regulatory Commission (FERC)moved things further by issuing regulations that require utilities with transmission lines totransmit power for other parties at reasonable rates.96
The purpose of these regulatory changes was to encourage competition at the wholesale(electricity generation) level, but several states--including California, Illinois, Massachusetts, andNew Hampshire--have taken this further by facilitating competition at the retail level, so thatconsumers can contract directly for their electricity supplies. Legislation has been introduced inthe U.S. Congress to establish guidelines for retail competition throughout the nation.97
These changes have environmental implications. First, as electricity prices fall in thenew competitive environment, electricity consumption is expected to increase. This might beexpected to increase pollutant emissions, but to whatever degree electricity substitutes forother, more polluting forms of energy, the overall effect may be environmentally beneficial.Second, deregulation will unquestionably make it easier for new firms and sources to entermarkets. Since new power plants tend to be both more efficient and less polluting (relyingmore on natural gas), environmental impacts may decrease.98 Third, more flexible and robust
94 See: MacDonnell, Lawrence J. The Water Transfer Process As a Management Option For Meeting ChangingWater Demands, Volume I. Submitted to the U.S. Geological Survey, Washington, D.C., April, 1990.95 The primary arguments for restructuring are: (1) the electricity industry is no longer a natural monopoly, sincesmall generation technologies are now competitive with large centralized production; (2) consumers will benefit frombuying cheaper electricity from more efficient producers, who currently face significant barriers to entry; and (3) theold system with cost-of-service pricing provides poor incentives for utilities to reduce costs. For background on thehistory of electricity restructuring, see: Brennan, Timothy J., Karen L. Palmer, Raymond J. Kopp, Alan J. Krupnick,Vito Stagliano, and Dallas Burtraw. A Shock to the System: Restructuring America's Electricity Industry.Washington, DC. Resources for the Future, 1996.96 Federal Energy Regulatory Commission. Order 888. April 1996.97 The Electric Consumers' Power to Choose Act (104 H.R. 3790 and 105 H.R. 655) is one example of suchlegislation. For a brief overview of the politics of electricity restructuring, see: Kriz, Margaret. "A Jolt to the System"National Journal. August 3, 1996, pp. 1631-1636.98 There is considerable debate on this point, since--in the short run--more electricity may be generated from oldsurplus capacity coal plants in the Midwest, increasing pollutant emissions. In any event, in the long run, competitionwill encourage a more rapid turnover of the capital stock. See: Palmer, Karen and Dallas Burtraw. "ElectricityRestructuring and Regional Air Pollution." Resource and Energy Economics 19(1997):139-174.
Robert N. Stavins RFF 98-26
26
markets for electricity can be expected to increase the effectiveness of various market-basedincentives for pollution control, such as the SO2 allowance trading system.99
4.2 Liability Rules
Liability rules can have the effect of providing strong incentives to firms to considerthe potential environmental damages of their decisions, and thereby can have the effect ofchanging those decisions.100 In theory, a liability rule can be cost effective as a policyinstrument because technologies or practices are not specified. For example, taxinghazardous materials or their disposal creates incentives for firms to reduce their use of thosematerials, but does not provide overall incentives for firm to reduce societal risks from thosematerials. An appropriately designed liability rule can do just this.101 On the other hand,transaction costs associated with litigation may make liability rules most appropriate only foracute hazards. It is in these situations, in fact, that this approach has been employed at theFederal level: liability for toxic waste sites and for the spill of hazardous materials.102
The Comprehensive Environmental Response, Compensation, and Liability Act(CERCLA) of 1980 established retroactive liability for companies that are found responsible forthe existence of a site requiring clean up. Governments can collect cleanup costs and damagesfrom waste producers, waste transporters, handlers, and current and past owners and operators ofa site. Similarly, the Oil Pollution Act makes firms liable for cleanup costs, natural resourcedamages, and third party damages caused by oil spills onto surface waters; and the Clean WaterAct makes responsible parties liable for cleanup costs for a spill of hazardous substances.
4.3 Information Programs
Since well functioning markets depend, in part, on the existence of well-informedproducers and consumers, information programs can--in theory--help foster market-orientedsolutions to environmental problems.103 One approach to government improving the
99 Environmental advocates, however, are very concerned that state PUCs will have much less influence than previouslyover the industry. In the past, PUCs encouraged "demand side management" and supported the use of renewable forms ofelectricity generation through the investment approval process or by requiring full-cost pricing for generation. Severalpolicies have been proposed to provide these functions in the new, more competitive environment: for example, a system oftradable "renewable energy credits," wherein each generator would need to hold credits for a certain percentage of theirgeneration; and a tax on the transmission of electricity, used to subsidize renewable generation.100 These incentives are frequently neither simple nor direct, because firms and individuals may choose to reducetheir exposure to liability by taking out insurance. In this regard, see the earlier discussion in this chapter of"Insurance Premium Taxes."101 See: Revesz, Richard L., Foundations in Environmental Law and Policy. New York: Oxford University Press, 1997.102 See chapter on hazardous wastes and toxic substances in this volume.103 For a comprehensive review of information programs and their apparent efficacy, see: Tietenberg, Tom. "InformationStrategies for Pollution Control." Paper presented at the Eighth Annual Conference, European Association of Environmentaland Resource Economists, Tilburg, The Netherlands, June 26-28, 1997. For an overview of international experience with"eco-labels," see: Morris, Julian and Lynn Scarlett. "Buying Green: Consumers, Product Labels and the Environment."Policy Study No. 202. Los Angeles: The Reason Foundation, August 1996.
Robert N. Stavins RFF 98-26
27
available set of information available to consumers is a product labeling requirement (Table 8).The Energy Policy and Conservation Act of 1975 specifies that certain appliances andequipment (including air conditioners, washing machines, and water heaters) carry labels withinformation on products' energy efficiency and estimated annual energy costs.104 Morerecently, EPA and the U.S. Department of Energy (DOE) developed the Energy Star program,in which energy efficient products can display an EnergyStar label. The label does not providespecific information on the product, but signals to consumers that the product is, in general,"energy efficient." This program is much broader in its coverage than the appliance labelingprogram; by 1997, over 13,000 product models carried the Energy Star label.105 There hasbeen little rigorous economic analysis of the efficacy of such programs, but limitedeconometric evidence suggests that product labeling (specifically appliance efficiency labels)can have significant impacts on efficiency improvements, essentially by making consumers(and therefore producers) more sensitive to energy price changes.106
Table 8. Federal Information Programs
Information Program Year of Implementation Enabling Legislation
Energy EfficiencyProduct Labeling
1975 Energy Policy and Conservation Act, Title V
NJ Hazardous ChemicalEmissions
1984 New Jersey Community Right-to-Know Act
Toxic Release Inventory 1986 Emergency Planning and Community Right-to-KnowAct
CA Hazardous ChemicalEmissions
1987 California Air Toxics Hot Spots and InformationAssessment Act
CA Proposition 65 1988 California Safe Drinking Water Act and ToxicEnforcement Act
Energy Star 1993 Joint program of the U.S. EPA and the U.S. DOE
A second type of government information program is a reporting requirement. Thecountry's first such program was New Jersey's Community Right-to-Know Act, passed in 1984.Two years later, a similar program was established at the national level. The Toxics ReleaseInventory (TRI) was initiated under the Emergency Planning and Community Right-to-Know
104 See: United States Code of Federal Regulations. 16 C.F.R., Chapter 1, Federal Trade Commission, Part 305--Appliance Labeling Rule. Washington, D.C., 1995; and U.S. Congress, Office of Technology Assessment. BuildingEnergy Efficiency. Washington, D.C., 1992.105 See: U.S. Department of State. US Climate Action Report. Publication 10496. Washington, D.C., 1997.106 See: Newell, Richard G., Adam B. Jaffe, and Robert N. Stavins. "The Induced Innovation Hypothesis andEnergy-Saving Technological Change." Working paper, John F. Kennedy School of Government, Harvard University,Cambridge, Massachusetts, October 18, 1997.
Robert N. Stavins RFF 98-26
28
Act (EPCRA).107 The TRI requires firms to report (to local emergency planning agencies)information on use, storage, and release of hazardous chemicals. Such information reportingserves compliance and enforcement purposes, but may also increases public awareness ofenvironmental risks of firms' actions. This public scrutiny can encourage firms to alter theirbehavior.
The Safe Drinking Water Act and Toxic Enforcement Act were adopted in Californiaas a ballot initiative ("Proposition 65") in 1986. The law covers consumer products andfacility discharges, and requires firms to provide a "clear and reasonable warning" if theyexpose populations to certain chemicals. In 1987, California enacted its Air Toxics Hot SpotsInformation and Assessment Act, which sets up an emissions reporting system to trackemissions of over 700 toxic substances. The law requires the identification and assessment oflocalized risks of air contaminants and provides information to the public about the possibleimpact of those emissions on public health.
5. U.S. EXPERIENCE WITH REDUCING GOVERNMENT SUBSIDIES
A final category of market-based instruments is government subsidy reduction. Sincesubsidies are the mirror image of taxes, they can--in theory--provide incentives to addressenvironmental problems. But, in practice, a variety of subsidies are believed to promoteeconomically inefficient and environmentally unsound practices. Here, we consider twoexamples: the below-cost sale of timber by the U.S. Forest Service; and explicit and implicitsubsidies that are conveyed to suppliers of energy.
5.1 Below-Cost Timber Sales
The public lands of the United States, which encompass more than 25 percent of thenation's entire land base, contain valuable natural resources, such as timber, minerals, coal,oil, and natural gas, all of which are valued (and priced) in the market place. These lands alsoprovide a variety of public goods, which tend not to be fully valued and priced in the market:wilderness, fish and wildlife habitats, watersheds, and recreational opportunities. Because itis difficult for individual landowners to provide these public goods profitably, the burden forproviding such environmental amenities tends to fall on the public lands.
Subsidies that benefit selected extractive industries may impede the provision of suchamenities on public lands. Below-cost timber sales--where the U.S. Forest Service does notrecover the full cost of making timber available--constitute an important case in point. It hasbeen estimated that removal of these subsidies would foster environmental protection andcould save taxpayers up to $1.2 billion over five years.108
107 See chapter on hazardous wastes and toxic substances in this volume.108 See: U.S. Congressional Budget Office. Reducing the Deficit: Spending and Revenue Options. Washington, D.C.,February 1990.
Robert N. Stavins RFF 98-26
29
Congress has mandated that the Forest Service pursue a policy of multiple-usemanagement for timber, recreation, wildlife habitat, and watershed purposes.109 But theForest Service is not under legal or regulatory requirements to sell its timber at a price thatwill recover the government's costs of growing and marketing that timber, and a substantialamount of publicly-owned timber is sold below cost. That is, the commercial activity ofmoving timber from public lands into the marketplace frequently costs the Federalgovernment more than it gets in return. This implicit subsidy has most frequently been in theform of credits to private lumber companies for road building.
There are approximately 380,000 miles of roads in National Forests, roughly eighttimes the length of the Interstate highway system. While they do have recreational and otheruses, these roads primarily serve as access for logging companies. They have beenconstructed either directly by the Forest Service or through a "purchaser road credit" system.The road credit system began with the 1964 Forest Roads and Trails Act which allows theForest Service to credit logging companies for their expenses in constructing the loggingroads they need to access timber. Under this system, companies deduct road constructionexpenses directly from the amount they pay the Forest Service for the timber they extract. In1996, direct outlays totaled $84 million and purchaser credits were valued at nearly $50million.110
Claims have been made that the Forest Service's disregard of timber-production costshas led to excessive logging in unproductive National Forests.111 In response to suchconcerns, several administrations and Congresses have considered various initiatives to dealwith the problem, each of which would essentially direct that more attention be given toeconomic considerations when managing and selling Federal timber. But, through 1997, nosignificant action had been taken.112
5.2 Fossil-Fuel Energy Subsidies
Because of concerns about global climate change, increased attention has been givento Federal subsidies and other programs that promote the use of fossil fuels. One EPA studyindicates that eliminating these subsidies would have a significant effect on reducing carbon
109 See: Bowes, Michael D. and John V. Krutilla. Multiple-Use Management: The Economics of Public Forestlands.Washington, D.C.: Resources for the Future, 1989.110 See: Senator Richard Bryan, Statements before Senate, Oct. 28, 1997; Conference Report on InteriorAppropriations Act.111 See: Repetto, Robert and Malcolm Gillis, eds. Public Policies and the Misuse of Forest Resources. New York:Cambridge University Press, 1988; and Hyde, William F. "Timber Economics in the Rockies: Efficiency andManagement Options." Land Economics 57(1981):630-37.112 On November 11, 1997, after a prolonged debate on below-cost timber sales, President Clinton signed a spendingbill that included provisions to continue subsidies for the construction of logging roads in national forests.
Robert N. Stavins RFF 98-26
30
dioxide (CO2) emissions.113 The Federal government is involved in the energy sector throughthe tax system and through a range of individual agency programs. One other study indicatesthat these activities together cost the government $17 billion annually.114
A substantial share of these subsidies and programs were enacted during the "oilcrises" to encourage the development of domestic energy sources and reduce reliance onimported petroleum. They favor energy supply over energy efficiency.115 Although there isan economic argument for government policies that encourage new technologies that haveparticularly high risk or long term payoffs, mature and conventional technologies currentlyreceive nearly 90 percent of the subsidies. Furthermore, within fossil fuels, the mostenvironmentally benign fuel--natural gas--receives only about 20 percent of the subsidies.
On the other hand, it should also be recognized that Federal user charges (Table 3) andinsurance premium taxes (Table 4) include significant levies on fossil fuels, and that Federaltax differentiation has tended to favor renewable energy sources and non-conventional fossilfuels (Table 7). In any event, the Clinton Administration's 1997 proposal to address globalclimate change includes a program of $5 billion (over five years) worth of government-fundedresearch and development and private-industry tax credits for renewable energy sources andenergy efficiency.116
6. WHY HAVE THERE BEEN RELATIVELY FEW APPLICATIONS OF MARKET-BASED INSTRUMENTS?
Despite the great interest given to market-based instruments by politicians in recentyears and the great progress that has been made, market-based instruments have yet totransform fundamentally the landscape of U.S. environmental policy. For the most part, theseinstruments still exist only at the fringes of regulation.
6.1 A Stock-Flow Problem
Market-based instruments represent only a trivial portion of existing regulation. Thereasons for this are many. Perhaps the most obvious is that there has not been a great deal ofnew environmental regulation. Since 1990, the Clean Air Act and Safe Drinking Water Actare the only major environmental regulations to be reauthorized. Given that Title 40 of theCode of Federal Regulations, titled "Protection of the Environment," contains over 14,310pages of environmental regulations, it could take a very long time indeed for market
113 See: Shelby, Mike, Robert Shackleton, Malcolm Shealy, and Alex Cristofaro. The Climate Change Implicationsof Eliminating U.S. Energy (and Related) Subsidies. Washington, D.C.: U.S. Environmental Protection Agency,October 1997.114 See: Alliance to Save Energy. Federal Energy Subsidies: Energy, Environmental and Fiscal Impacts. Lexington,Massachusetts, 1993.115 The Alliance to Save Energy study claims that end-use efficiency receives $1 for every $35 received by energysupply.116 See: Easterbrook, Gregg. "Greenhouse Common Sense: Why Global-Warming Economics Matters More thanScience." U.S. News and World Report, December 1, 1997, pp. 58-62.
Robert N. Stavins RFF 98-26
31
instruments to become the core of environmental policy, unless Congress is willing to usethem for "old" problems as well as new ones.
6.2 Resistance from Interest Groups
Within the government environmental bureaucracy there exists a desire to seeeffective environmental regulation adopted, but traditional regulatory programs requireregulators with a technical or legal-based skill-set, while market-based instruments requiremarket-trained thinkers, including MBAs, economists, and others. Members of thegovernment bureaucracy may rationally be resisting the dissipation of their human capital.117
Although some environmental groups have increasingly welcomed the selective use ofmarket-based instruments,118 others are concerned that increased flexibility in environmentalregulation will result in the reduction of the overall degree of environmental protection. Andin parts of the environmental community, the sentiment remains that environmental quality isan inalienable right and that market-programs inappropriately condone the "right to pollute."Lastly, some environmental professionals, like their government counterparts, may beresisting the dissipation of their human capital.
The ambivalence of the regulated community itself has also served to retard the use ofmarket-based instruments. Many industries and companies have applauded market-basedinstruments in the abstract, because of the promise of flexibility and cost effectiveness. Butfew businesses have actually supported the adoption of new applications. One factor isreluctance to promote any regulation, no matter how flexible or cost effective. Businessesmay believe that political forces beyond their control might unfavorably distort the design andimplementation of these instruments. First, cost savings might be taken away from them byan increase in the stringency of standards. Second, the design of instruments may limit theirflexibility. Third, the rules may be changed over time. For businesses to optimizeenvironmental investments, regulations not only have to be flexible, but predictable. Fourth,some firms remain concerned that "buying the right to pollute" could lead to negativepublicity. Fifth and finally, private industry representatives may resist these reforms toprevent the dissipation of their human capital.
6.3 Public Resistance
The slow penetration of market-based instruments into environmental policies mayalso be due to these instruments not being well understood by the general public. The benefitsto consumers of market instruments are typically not visible, while the perceived costs can betransparent. Under traditional command-and-control policies, consumers may see prices go
117 Hahn, Robert W. And Robert N. Stavins. "Incentive-based Environmental Regulation: a New Era from an OldIdea?" Ecology Law Quarterly 18(1991): 1-42.118 During the mid-1980's, the Environmental Defense Fund (EDF) was the first environmental advocacyorganization to aggressively welcome the use of market-based instruments. See: Krupp, Frederic. "NewEnvironmentalism Factors in Economic Needs." Wall Street Journal, November 20, 1986: p. 34.
Robert N. Stavins RFF 98-26
32
up, but they clearly find it difficult to associate those price increases with environmentalregulations. For example, it is not readily apparent to consumers that gasoline and electricityprices are lower than they otherwise would have been because of the use of market-basedprograms to phase out lead or reduce SO2 emissions. At the same time, market-basedinstruments--especially charges--may suffer from making environmental costs moretransparent. While encouraging individuals to consciously link environmental costs andbenefits may be a good thing, it can certainly undermine the enthusiasm with which market-based instruments are embraced.
7. WHY HAS THE PERFORMANCE RECORD BEEN MIXED?
When market-based environmental policy instruments have been used, they have notalways performed as predicted. Why?
7.1 Inaccurate Predictions
One reason market-based instruments have sometimes fallen short in deliveringpredicted cost savings is that the predictions themselves have often been unrealistic: premisedon perfect performance under ideal conditions. That is, these predictions have assumed thatthe cost-minimizing allocation of the pollution-control burden among sources would beachieved, and that marginal abatement costs would be equated across all sources. In afrequently cited table, Tietenberg calculated the ratio of the cost of an actual command-and-control program to a least-cost benchmark,119 but others have mistakenly used this ratio as anindicator of the potential gains of adopting specific market-based instruments. The moreappropriate comparison would be between actual command-and-control programs and eitheractual or reasonably constrained theoretical market-based programs.120
In addition, predictions made during policy debates have typically ignored factors thatcan adversely affect performance: transaction costs involved in implementing market-basedprograms; uncertainty as to the property rights bestowed under programs; uncompetitivemarket conditions; a pre-existing regulatory environment that does not give firms incentivesto participate; and the inability of firms' internal decision-making capabilities to fully utilizeprogram opportunities.
7.2 Design Problems
Many of the factors cited suggest the need for changes in the design of future market-based instruments. While some program design elements reflect miscalculations of marketreactions, others were known to be problematic at the time the programs were enacted, butnevertheless were incorporated into programs to ensure adoption by the political process.
119 See: Tietenberg, Tom. Emissions Trading: An Exercise in Reforming Pollution Policy. Washington, D.C.:Resources for the Future, 1985.120 See: Hahn, Robert and Robert Stavins. "Economic Incentives for Environmental Protection: Integrating Theoryand Practice." American Economic Review 82 (May 1992): 464-468
Robert N. Stavins RFF 98-26
33
One striking example is the "20% rule" under EPA's Emission Trading Program.121 This rule,adopted at the insistence of the environmental community, stipulates that each time a permit istraded, the amount of pollution authorized thereunder must be reduced by 20%. Since permitsthat are not traded retain their full quantity value, this regulation discourages permit tradingand thereby increases regulatory costs.
7.3 Limitations in Firms' Structure
A third explanation for the mixed performance of implemented market-basedinstruments is that firms are simply not well equipped internally to make the decisionsnecessary to fully utilize these instruments. Since market-based instruments have been usedon a limited basis only, and firms are not certain that these instruments will be a lastingcomponent on the regulatory landscape, most companies have chosen not to reorganize theirinternal structure to fully exploit the cost savings these instruments offer. Rather, most firmscontinue to have organizations that are experienced in minimizing the costs of complying withcommand-and-control regulations, not in making the strategic decisions allowed by market-based instruments.122
The focus of environmental, health, and safety departments in private firms has beenprimarily on problem avoidance and risk management, rather than on the creation ofopportunities made possible by market-based instruments. This focus has developed because ofthe strict rules companies have faced under command-and-control regulation, in response towhich companies have built skills and developed processes that comply with regulations, but donot help them benefit competitively from environmental decisions. Absent significant changesin structure and personnel, the full potential of market-based instruments will not be realized.
8. THE CHANGING POLITICS OF MARKET-BASED INSTRUMENTS
Given the historical lack of receptiveness by the political process to market-basedapproaches to environmental protection, why has there been a recent rise in the use of market-based approaches?123 It would be gratifying to believe that increased understanding ofmarket-based instruments had played a large part in fostering their increased political
121 See: Hahn, Robert W. "Regulatory Constraints on Environmental Markets." Journal of Public Economics42(1990): 149-175.122 There are some exceptions. Enron, for example, has attempted to use market-based instruments for its strategicbenefit by becoming a leader in creating new markets for trading acid rain permits. Other firms have appointedenvironmental, health, and safety leaders who are familiar with a wide range of policy instruments, not solelycommand-and-control approaches, and who bring a strategic focus to their company's pollution-control efforts. See:Hockenstein, Jeremy B., Robert N. Stavins, and Bradley W. Whitehead. "Creating the Next Generation of Market-Based Environmental Tools." Environment 39, number 4 (1997), pp. 12-20, 30-33.123 For a more thorough exploration of the answers to this question, see: Keohane, Nathaniel O., Richard L. Revesz,and Robert N. Stavins. "The Positive Political Economy of Instrument Choice in Environmental Policy."Environmental Economics and Public Policy, eds. Paul Portney and Robert Schwab. London: Edward Elgar, Ltd.,forthcoming 1997; and Stavins, Robert N. "What Can We Learn from the Grand Policy Experiment? Positive andNormative Lessons from SO2 Allowance Trading." Journal of Economic Perspectives, forthcoming, 1997b.
Robert N. Stavins RFF 98-26
34
acceptance, but how important has this really been? In 1981, political scientist StevenKelman surveyed Congressional staff members, and found that support and opposition tomarket-based environmental policy instruments was based largely on ideological grounds:Republicans who supported the concept of economic-incentive approaches offered as a reasonthe assertion that "the free market works," or "less government intervention" is desirable,without any real awareness or understanding of the economic arguments for market-basedprograms. Likewise, Democratic opposition was largely based upon analogously ideologicalfactors, with little or no apparent understanding of the real advantages or disadvantages of thevarious instruments.124 What would happen if we were to replicate Kelman's survey today?My refutable hypothesis is that we would find increased support from Republicans, greatlyincreased support from Democrats, but insufficient improvements in understanding to explainthese changes.125 So what else has mattered?
First, one factor has surely been increased pollution control costs, which have led togreater demand for cost-effective instruments. By the late 1980's, even political liberals andenvironmentalists were beginning to question whether CAC regulations could produce furthergains in environmental quality. During the previous twenty years, pollution abatement costshad continually increased, as stricter standards moved the private sector up the marginal cost-of-control function. By 1990, U.S. pollution control costs had reached $125 billion annually,nearly a 300% increase in real terms from 1972 levels.126
Second, a factor that became important in the late 1980's was strong and vocal supportfrom some segments of the environmental community.127 By supporting tradable permits foracid rain control, the Environmental Defense Fund (EDF) seized a market niche in theenvironmental movement, and successfully distinguished itself from other groups.128 Relatedto this, a third factor was that the SO2 allowance trading program, the leaded gasolinephasedown, and the CFC phaseout were all designed to reduce emissions, not simply toreallocate them cost-effectively among sources. Market-based instruments are most likely to
124 See: Kelman, Steven. What Price Incentives?: Economists and the Environment. Boston: Auburn House, 1981.125 But there has been some increased understanding of market-based approaches among policy makers. This haspartly been due to increased understanding by their staffs, a function — to some degree — of the economics trainingthat is now common in law schools, and of the proliferation of schools of public policy. See: Hahn, Robert W. andRobert N. Stavins. "Incentive-based Environmental Regulation: a New Era from an Old Idea?" Ecology LawQuarterly 18(1991):1-42.126 See: U.S. Environmental Protection Agency, Environmental Investments: The Cost of a Clean Environment, reportof the administrator to Congress. Washington, D.C.: U.S. EPA, December 1990; and Jaffe, Adam B., Steven R.Peterson, Paul R. Portney, and Robert N. Stavins. "Environmental Regulation and the Competitiveness of U.S.Manufacturing: What Does the Evidence Tells Us?" Journal of Economic Literature 33(1995):132-163.127 But the environmental advocacy community is by no means unanimous in its support for market-basedinstruments. See, for example: Seligman, Daniel A. Air Pollution Emissions Trading: Opportunity or Scam? A Guidefor Activists. San Francisco: Sierra Club, 1994.128 When the memberships (and financial resources) of other environmental advocacy groups subsequently declinedwith the election of the environmentally-friendly Clinton-Gore Administration, EDF continued to prosper and grow.See: Lowry, Robert C. "The Political Economy of Environmental Citizen Groups." Unpublished Ph.D. thesis,Harvard University, 1993.
Robert N. Stavins RFF 98-26
35
be politically acceptable when proposed to achieve environmental improvements that wouldnot otherwise be feasible (politically or economically).
Fourth, deliberations regarding the SO2 allowance system, the lead system, and CFCtrading differed from previous attempts by economists to influence environmental policy in animportant way: the separation of ends from means, i.e. the separation of consideration of goalsand targets from the policy instruments used to achieve those targets. By accepting--implicitlyor otherwise--the politically identified (and potentially inefficient) goal, the ten-million tonreduction of SO2 emissions, for example, economists were able to focus successfully on theimportance of adopting a cost-effective means of achieving that goal. The risk, of course, was"designing a fast train to the wrong station."
Fifth, acid rain was an unregulated problem until the SO2 allowance trading programof 1990; and the same can be said for leaded gasoline and CFC's. Hence, there were noexisting constituencies--in the private sector, the environmental advocacy community, orgovernment--for the status quo approach, because there was no status quo approach. Weshould be more optimistic about introducing market-based instruments for "new" problems,such as global climate change, than for existing, highly regulated problems, such asabandoned hazardous waste sites.
Sixth, by the late 1980's, there had already been a perceptible shift of the politicalcenter toward a more favorable view of using markets to solve social problems. The BushAdministration, which proposed the SO2 allowance trading program and then championed itthrough an initially resistant Democratic Congress, was (at least in its first two years)"moderate Republican;" and phrases such as "fiscally responsible environmental protection"and "harnessing market forces to protect the environment" do have the sound of quintessentialmoderate Republican issues.129 But, beyond this, support for market-oriented solutions tovarious social problems had been increasing across the political spectrum for the previousfifteen years, as was evidenced by deliberations on deregulation of the airline,telecommunications, trucking, railroad, and banking industries. Indeed, by 1990, the concept(or at least the phrase), "market-based environmental policy," had evolved from beingpolitically problematic to politically attractive.
Seventh, the adoption of the SO2 allowance trading program for acid rain control--likeany major innovation in public policy--can partly be attributed to a healthy dose of chancethat placed specific persons in key positions, in this case at the White House, EPA, theCongress, and environmental organizations.130 The result was what remains the golden erafor market-based environmental strategies.
129 The Reagan Administration enthusiastically embraced a market-oriented ideology, but demonstrated no interest inemploying actual market-based policies in the environmental area.130 Within the White House, among the most active and influential enthusiasts of market-based environmentalinstruments were: Counsel Boyden Gray and his Deputy John Schmitz, Domestic Policy Adviser Roger Porter,Council of Economic Advisers (CEA) Member Richard Schmalensee, CEA Senior Staff Economist Robert Hahn, andOffice of Management and Budget Associate Director Robert Grady. At EPA, Administrator William Reilly--a "card-carrying environmentalist"--enjoyed valuable credibility with environmental advocacy groups; and Deputy
Robert N. Stavins RFF 98-26
36
9. CONCLUSION
Some eighty years ago, economists first proposed the use of corrective taxes tointernalize environmental and other externalities. Fifty years later, the portfolio of potentialeconomic-incentive instruments was expanded to include quantity-based mechanisms--tradable permits. Thus, economic-incentive approaches to environmental protection areclearly not a new policy idea. Over the past two decades, they have held varying degrees ofprominence in environmental policy discussions.
Market-based instruments have now moved center stage, and policy debates look verydifferent from the time when these ideas were characterized as "licenses to pollute" ordismissed as completely impractical. Market-based instruments are considered seriously foreach and every environmental problem that is tackled, ranging from endangered speciespreservation131 to what may be the greatest of environmental problems, the greenhouse effectand global climate change.132 It seems clear that market-based instruments--and, inparticular, tradable permit systems--will enjoy increasing acceptance in the years ahead.
No particular form of government intervention, no individual policy instrument--whether market-based or conventional--is appropriate for all environmental problems. Whichinstrument is best in any given situation depends upon a variety of characteristics of theenvironmental problem, and the social, political, and economic context in which it is beingregulated. There is no policy panacea. Indeed, the real challenge for bureaucrats, electedofficials, and other participants in the environmental policy process comes in analyzing andthen selecting the best instrument for each situation that arises.
Administrator Henry Habicht was a key, early supporter of market-based instruments. In the Congress, SenatorsTimothy Wirth and John Heinz provided high-profile, bi-partisan support for the SO2 allowance trading system and,more broadly, for a wide variety of market-based instruments for various environmental problems through their"Project 88" (Stavins 1988). And, finally, in the environmental community, EDF Executive Director Fred Krupp,Senior Economist Daniel Dudek, and Staff Attorney Joseph Goffman worked closely with the White House to developthe initial allowance trading proposal.131 See, for example: Goldstein, Jon B. "The Prospects for Using Market Incentives to Conserve BiologicalDiversity." Environmental Law 21(1991), Northwestern School of Law, Portland, Oregon; and Bean, Michael J."Shelter from the Storm: Endangered Species and Landowners Alike Deserve a Safe Harbor." The New Democrat,March/April 1997, pp. 20-21.132 See the chapter in this volume on global climate policy. Also see: Fisher, B., S. Barrett, P. Bohm, B. Fisher, M.Kuroda, J. Mubazi, A. Shah, and R. Stavins. "Policy Instruments to Combat Climate Change." Climate Change 1995:Economic and Social Dimensions of Climate Change, eds. J.P. Bruce, H. Lee, and E. F. Haites, pp. 397-439.Intergovernmental Panel on Climate Change, Working Group III. Cambridge, England: Cambridge University Press,1996; Hahn, Robert and Robert Stavins. "Trading in Greenhouse Permits: A Critical Examination of Design andImplementation Issues." Shaping National Responses to Climate Change: A Post-Rio Policy Guide, ed. Henry Lee,pp. 177-217. Cambridge: Island Press, 1995; Schmalensee, Richard. Greenhouse Policy Architecture and Institutions.Paper prepared for National Bureau of Economic Research conference, "Economics and Policy Issues in GlobalWarming: An Assessment of the Intergovernmental Panel Report," Snowmass, Colorado, July 23-24, 1996; andStavins, Robert N. "Policy Instruments for Climate Change: How Can National Governments Address a GlobalProblem?" The University of Chicago Legal Forum, forthcoming, 1997.