Market Briefing: Correlated Markets Yardeni Research, Inc. June 5, 2020 Dr. Edward Yardeni 516-972-7683 [email protected]Mali Quintana 480-664-1333 [email protected]Please visit our sites at www.yardeni.com blog.yardeni.com thinking outside the box
JP Morgan NominalBroad Effective Exchange Rate*(inverted scale)
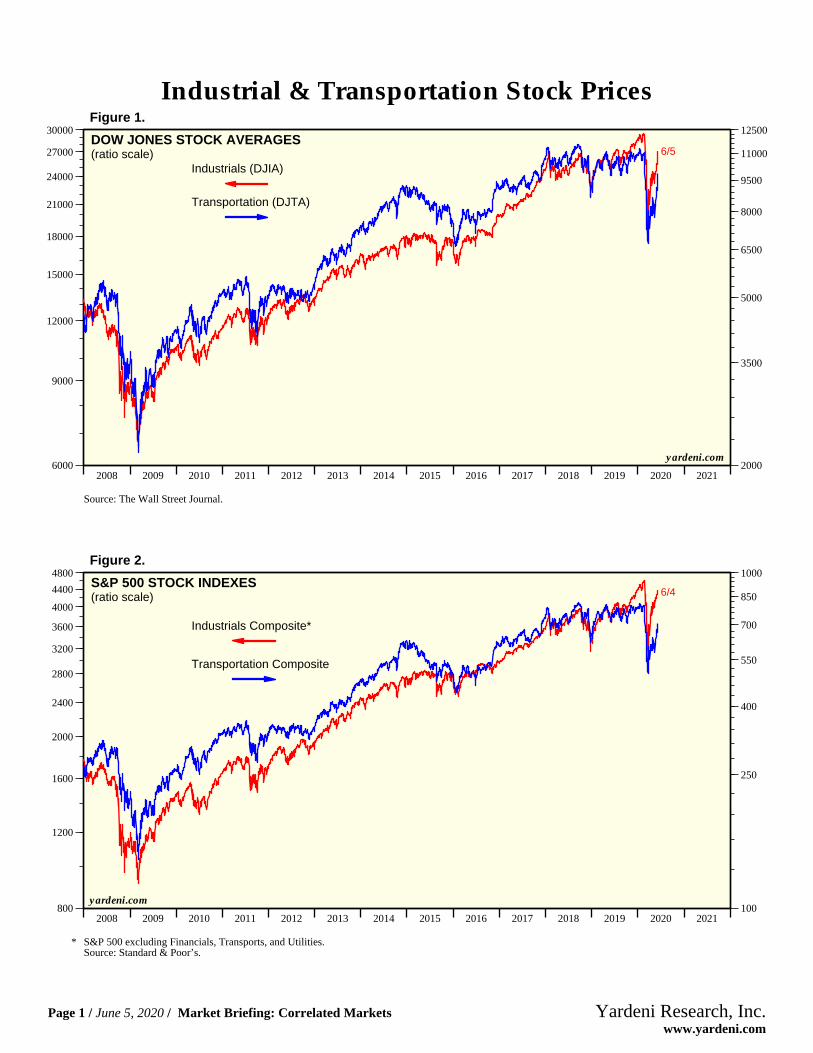
S&P 500 Index
* Argentina, Australia, Brazil, Bulgaria, Canada, Chile, China, Colombia, Croatia, Czech Republic, Denmark, Ecuador, Egypt, France, Germany, Hong Kong,Hungary, Japan, India, Indonesia, Israel, Italy, Korea, Kuwait, Malaysia, Mexico, Morocco, New Zealand, Nigeria, Norway, Pakistan, Panama, Peru,Philippines, Poland, Romania, Russia Saudi Arabia, Singapore, South Africa, Spain, Sweden, Switzerland, Taiwan, Thailand, Turkey, United Kingdom,Ukraine, Uruguay, Venezuela, Vietnam, and United States. Source: JP Morgan.Source: JP Morgan and Haver Analytics.
INDUSTRIALS COMMODITY PRICE INDEX & TRADE-WEIGHTED DOLLAR
JP Morgan NominalBroad EffectiveExchange Rate**(inverted scale)
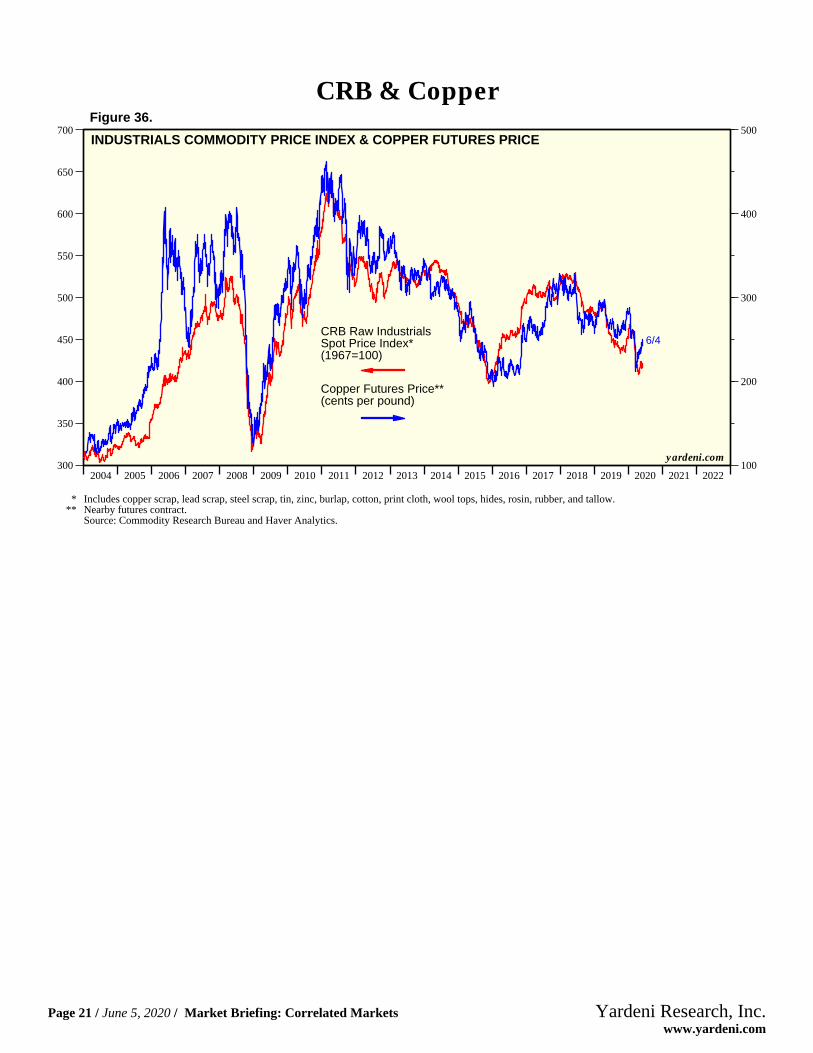
CRB Raw IndustrialsSpot Price Index*(1967=100)
* Includes copper scrap, lead scrap, steel scrap, tin, zinc, burlap, cotton, print cloth, wool tops, hides, rosin, rubber, and tallow.** Argentina, Australia, Brazil, Bulgaria, Canada, Chile, China, Colombia, Croatia, Czech Republic, Denmark, Ecuador, Egypt, France, Germany, Hong Kong,
Hungary, Japan, India, Indonesia, Israel, Italy, Korea, Kuwait, Malaysia, Mexico, Morocco, New Zealand, Nigeria, Norway, Pakistan, Panama, Peru,Philippines, Poland, Romania, Russia Saudi Arabia, Singapore, South Africa, Spain, Sweden, Switzerland, Taiwan, Thailand, Turkey, United Kingdom,Ukraine, Uruguay, Venezuela, Vietnam, and United States. Source: Commodity Research Bureau and JP Morgan.
INDUSTRIALS COMMODITY PRICE INDEX & TRADE-WEIGHTED DOLLAR(yearly percent change)
JP Morgan NominalBroad Effective Exchange Rate**(inverted scale)
CRB Raw IndustrialsSpot Price Index*
* Includes copper scrap, lead scrap, steel scrap, tin, zinc, burlap, cotton, print cloth, wool tops, hides, rosin, rubber, and tallow.** Argentina, Australia, Brazil, Bulgaria, Canada, Chile, China, Colombia, Croatia, Czech Republic, Denmark, Ecuador, Egypt, France, Germany, Hong Kong,
Hungary, Japan, India, Indonesia, Israel, Italy, Korea, Kuwait, Malaysia, Mexico, Morocco, New Zealand, Nigeria, Norway, Pakistan, Panama, Peru,Philippines, Poland, Romania, Russia Saudi Arabia, Singapore, South Africa, Spain, Sweden, Switzerland, Taiwan, Thailand, Turkey, United Kingdom,Ukraine, Uruguay, Venezuela, Vietnam, and United States. Source: Commodity Research Bureau and JP Morgan.
Hungary, Japan, India, Indonesia, Israel, Italy, Korea, Kuwait, Malaysia, Mexico, Morocco, New Zealand, Nigeria, Norway, Pakistan, Panama, Peru,Philippines, Poland, Romania, Russia Saudi Arabia, Singapore, South Africa, Spain, Sweden, Switzerland, Taiwan, Thailand, Turkey, United Kingdom,Ukraine, Uruguay, Venezuela, Vietnam, and United States. Source: JP Morgan and Haver Analytics.
EMERGING MARKETS MSCI STOCK PRICE INDEX &TRADE-WEIGHTED DOLLAR
Emerging MarketsMSCI Stock Price Index(in local currencies)
JP Morgan NominalBroad Effective Exchange Rate*(inverted scale)
* Argentina, Australia, Brazil, Bulgaria, Canada, Chile, China, Colombia, Croatia, Czech Republic, Denmark, Ecuador, Egypt, France, Germany, Hong Kong,Hungary, Japan, India, Indonesia, Israel, Italy, Korea, Kuwait, Malaysia, Mexico, Morocco, New Zealand, Nigeria, Norway, Pakistan, Panama, Peru,Philippines, Poland, Romania, Russia Saudi Arabia, Singapore, South Africa, Spain, Sweden, Switzerland, Taiwan, Thailand, Turkey, United Kingdom,Ukraine, Uruguay, Venezuela, Vietnam, and United States. Source: JP Morgan and Morgan Stanley Capital International.
* Includes copper scrap, lead scrap, steel scrap, tin, zinc, burlap, cotton, print cloth, wool tops, hides, rosin, rubber, and tallow.Source: Morgan Stanley Capital International and Commodity Research Bureau.
S&P 500 MATERIALS & INDUSTRIALS COMMODITY PRICE INDEX
S&P 500 Materials Index(as a ratio of S&P 500 Index)
CRB Raw IndustrialsSpot Price Index*(1967=100)
* Includes copper scrap, lead scrap, steel scrap, tin, zinc, burlap, cotton, print cloth, wool tops, hides, rosin, rubber, and tallow.Source: Standard & Poor’s and Commodity Research Bureau.
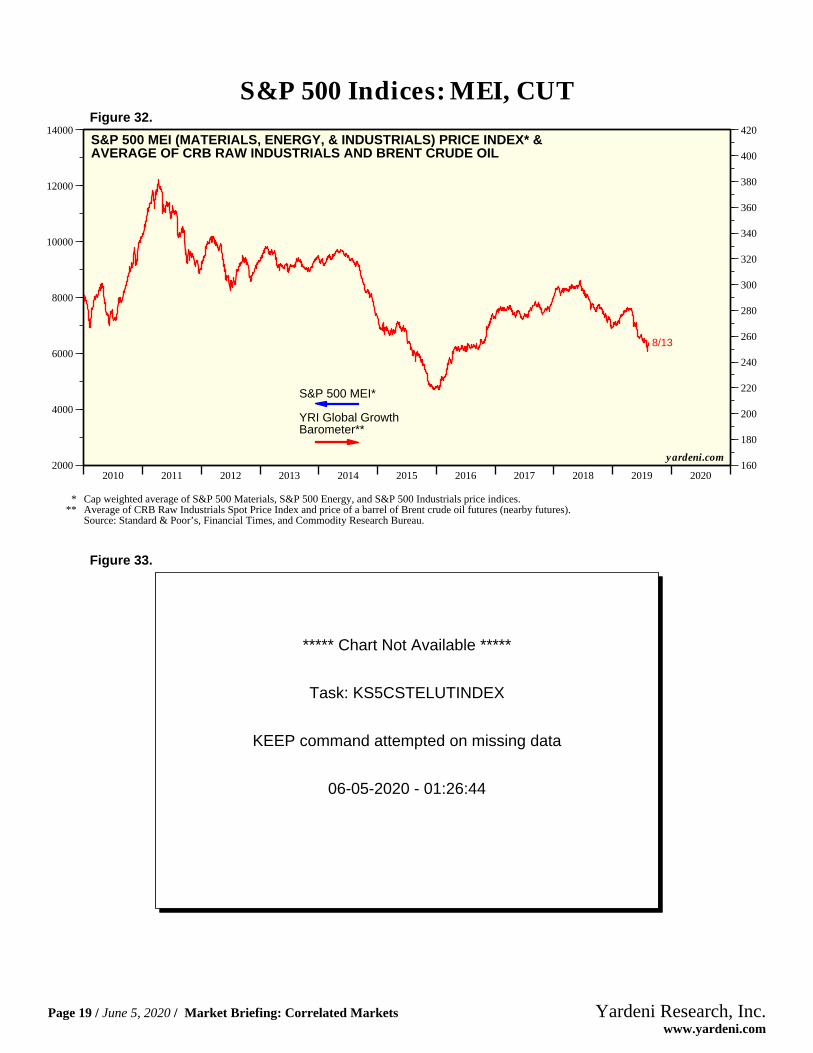
S&P 500 MEI (MATERIALS, ENERGY, & INDUSTRIALS) PRICE INDEX* &AVERAGE OF CRB RAW INDUSTRIALS AND BRENT CRUDE OIL
S&P 500 MEI*
YRI Global GrowthBarometer**
* Cap weighted average of S&P 500 Materials, S&P 500 Energy, and S&P 500 Industrials price indices.** Average of CRB Raw Industrials Spot Price Index and price of a barrel of Brent crude oil futures (nearby futures).
Source: Standard & Poor’s, Financial Times, and Commodity Research Bureau.
Copyright (c) Yardeni Research, Inc. 2020. All rights reserved. The informationcontained herein has been obtained from sources believed to be reliable, but is notnecessarily complete and its accuracy cannot be guaranteed. No representation orwarranty, express or implied, is made as to the fairness, accuracy, completeness, orcorrectness of the information and opinions contained herein. The views and the otherinformation provided are subject to change without notice. All reports and podcasts posted onwww.yardeni.com, blog.yardeni.com, and YRI’s Apps are issuedwithout regard to the specific investment objectives, financial situation, or particular needsof any specific recipient and are not to be construed as a solicitation or an offer to buy or sellany securities or related financial instruments. Past performance is not necessarily a guideto future results. Company fundamentals and earnings may be mentioned occasionally, butshould not be construed as a recommendation to buy, sell, or hold the company’s stock.Predictions, forecasts, and estimates for any and all markets should not be construed asrecommendations to buy, sell, or hold any security--including mutual funds, futurescontracts, and exchange traded funds, or any similar instruments.
The text, images, and other materials contained or displayed on any Yardeni Research, Inc.product, service, report, email or website are proprietary to Yardeni Research, Inc. andconstitute valuable intellectual property. No material from any part of www.yardeni.com, blog.yardeni.com, and YRI’s Apps may be downloaded, transmitted,broadcast, transferred, assigned, reproduced or in any other way used or otherwisedisseminated in any form to any person or entity, without the explicit written consent ofYardeni Research, Inc. All unauthorized reproduction or other use of material from YardeniResearch, Inc. shall be deemed willful infringement(s) of this copyright and other proprietaryand intellectual property rights, including but not limited to, rights of privacy. YardeniResearch, Inc. expressly reserves all rights in connection with its intellectual property,including without limitation the right to block the transfer of its products and services and/orto track usage thereof, through electronic tracking technology, and all other lawful means,now known or hereafter devised. Yardeni Research, Inc. reserves the right, without furthernotice, to pursue to the fullest extent allowed by the law any and all criminal and civilremedies for the violation of its rights.
The recipient should check any email and any attachments for the presence of viruses.Yardeni Research, Inc. accepts no liability for any damage caused by any virus transmittedby this company’s emails, website, blog and Apps. Additional information available onrequest.