90
Market for Hospital Services
| Date post: | 24-Dec-2015 |
| Category: |
Documents |
| Upload: | anabel-black |
| View: | 223 times |
| Download: | 2 times |

Market for Hospital Services

OutlineHospital Industry Structure
Hospital Conduct
Industry Performance
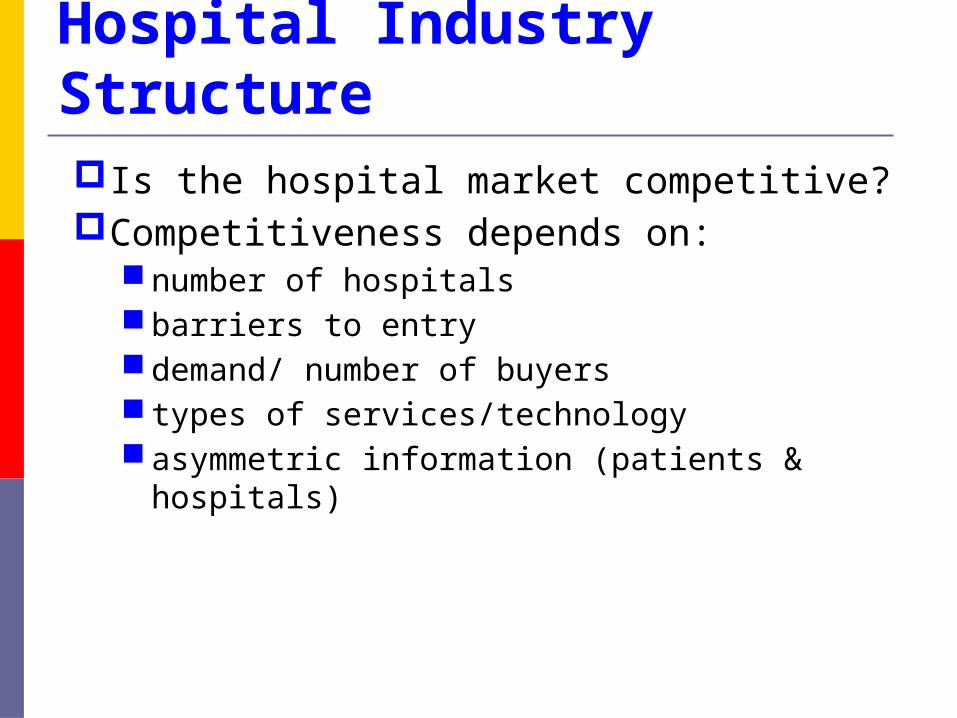
Hospital Industry StructureIs the hospital market competitive?Competitiveness depends on:
number of hospitals barriers to entry demand/ number of buyers types of services/technology asymmetric information (patients & hospitals)

U.S. Institutional SettingHospital classification
Community hospitals Physician-owned specialty hospitals Teaching hospitals Private for profit, private not-for-profit, public
not-for-profit

Community Hospital Characteristics1970-2007
Measure 1970 1980 1990 2000 2007 No. of hospitals 5,859 5,904 5,420 4,915 4,897 Beds (thousands) 848.2 992.0 929.4 823.6 800.9 Beds per 1,000 population 4.17 4.38 3.73 2.93 2.65 Admissions (thousands) 29,252 36,143 31,181 33,089 35,346 Admissions per 1,000 population
144.0 159.6 125.4 117.6 117.2
Resident U.S. Population 203.2 226.5 248.7 281.4 301.6 Average length of stay (days)
7.7 7.6 7.2 5.8 5.5
Percent occupancy 78.0 75.4 66.8 63.9 66.6 Outpatient visits (millions)
133.5 202.3 301.3 521.4 603.3
Outpatient visits per admission
4.6 5.6 9.7 15.8 17.1
Outpatient surgeries as a percent of total
- 16.3 50.5 62.7 62.7
Cost per day ($) 74 245 687 1,149 1,696 Cost per stay ($) 605 1,851 4,947 6,649 9,337 Source: Health, United States, 2009: With Chartbook on Trends in the Health of Americans, Tables 104, 117, 118 and 136.

Community Hospitals by Ownership Type
Year
Number of hospitals
For Profit
Not-for-Profit
Government
No. % No. % No. %
1975 5,875 775 13.2 3,339 56.8 1,761 30.0 1980 5,830 730 12.5 3,322 57.0 1,778 30.5 1990 5,384 749 13.9 3,191 59.3 1,444 26.8 2000 4,915 749 15.2 3,003 61.1 1,163 23.7 2007 4,897 873 17.8 2,913 59.5 1,111 22.7
Year
Number of beds (thousands)
For Profit
Not-for-Profit
Government
No. % No. % No. %
1975 941.8 73.5 7.8 658.2 69.9 210.2 22.3 1980 988.4 87.0 8.8 692.5 70.0 208.9 21.2 1990 927.4 101.4 11.0 656.8 70.8 169.2 18.2 2000 823.6 109.9 13.3 583.0 70.8 130.7 15.9 2007 800.9 115.7 14.4 553.7 69.1 131.4 16.4
Source: Health, United States, 2009: With Chartbook on the Health of Americans, Table 115, 200.

Size Distribution of Community Hospitals Percentage of Hospitals
in Each Bed Size Category Bed Size Category
1970 1980 1990 2000 2007
0-24 6.8% 4.4% 4.2% 5.9% 7.3% 25-49 22.6 17.7 17.4 18.5 21.9 50-99 25.4 5.1 23.5 21.5 19.8 100-199 21.8 23.5 24.3 25.1 22.1 200-299 10.1 12.3 13.7 13.3 12.5 300-399 6.1 7.1 7.6 6.9 7.0 400-499 3.2 4.6 4.1 3.7 3.9 500 and over 4.0 5.4 5.3 5.0 5.3 Source: Health, United States, 2009: With Chartbook on the Health of Americans, Table 115.

# of hospitals declined 17% # of beds declined 15% Median size: 150 beds
Short-term stays (< 7 days) Outpatient visits up dramatically
Nonprofit 60% For-profit 18% State & Local 22%
Hospital Industry Structure

Area HospitalsMarietta Memorial
Selby Camden-Clark
St. Joseph’s
Type NFP NFP NFP NFP
Beds 199 25 375 325
Physicians 90+ na 150+ 160+
Staff 1200+ 250+ 1300+ na

Barriers to Entry Certificate of Need (CON) laws
Required in certain states to open a hospital (designed to limit excess capacity)
Economies of scale LRAC of community hospital reach minimum around
175-200 beds Multi-hospital system
Learning By Doing Over time, higher cumulative output, more
experience leads to lower costs, higher quality.
Mergers
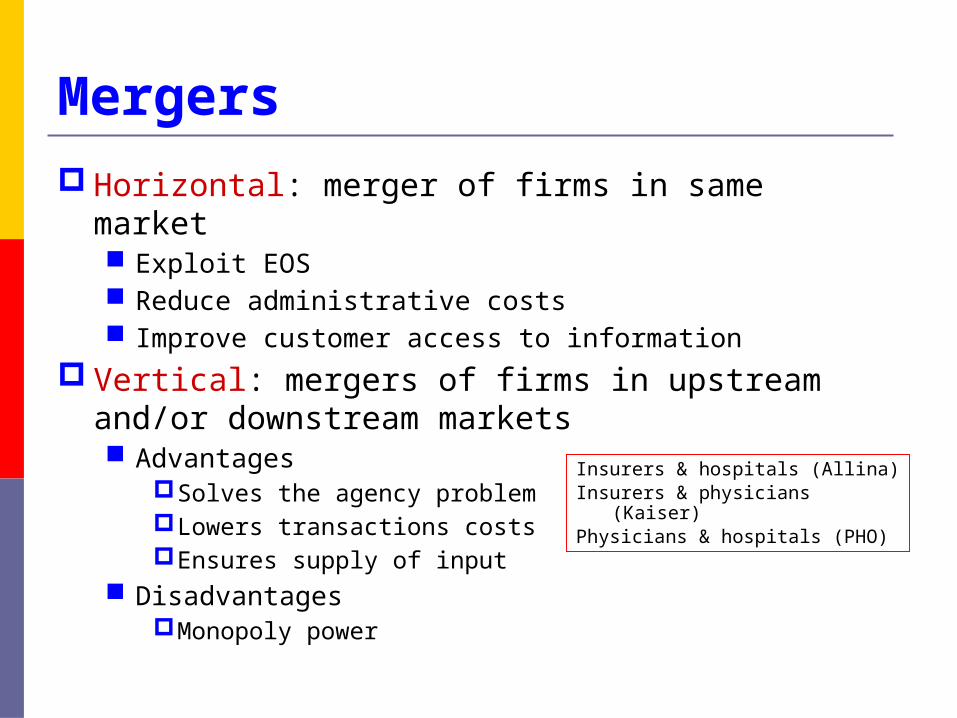
Horizontal: merger of firms in same market Exploit EOS Reduce administrative costs Improve customer access to information
Vertical: mergers of firms in upstream and/or downstream markets Advantages
Solves the agency problemLowers transactions costsEnsures supply of input
DisadvantagesMonopoly power
Insurers & hospitals (Allina)Insurers & physicians (Kaiser)Physicians & hospitals (PHO)

Hospital Conduct Large # of sellers and low entry barriers promote
competition: Higher output and quality Lower price
However, the hospital market has important differences: Hospitals don’t necessarily maximize profits
Role of Non-Profit Hospitals Government is a major payer
Prices not set competitively Consumer less likely to shop around
Insurance and asymmetric info

Empirical Evidence Studies prior to 1990 support the idea of a
“Medical Arms Race” Regions with more competition have:
More excess bed capacityLarger # of duplicate specialized services
After 1990, increased competition led to: Lower costs and improved quality

Models of Hospital BehaviorProfit MaximizationUtility maximizing modelsPhysician-control models

Hospital Income FlowsSources of Funds Uses of Funds
Patients self pay 3% Labor 53%
Private Insurance 36% Professional fees 5%
Philanthropy 5% Supplies, other 34%
Medicare 29% Depreciation and interest 8%
Medicaid 20%
Other government 7%
100% 100%
Pricing Practices in Medicine

Hospital Expenses by Ownership Type
Expenses per Inpatient Day Year For Profit Not-for-Profit Government
1980 $ 257 $ 246 $ 239 1990 752 692 634 2000 1,057 1,182 1,064 2007 1,536 1,776 1,472
Expenses per Inpatient Stay
Year For Profit Not-for-Profit Government
1980 $1,676 $1,902 $1,750 1990 4,727 5,001 4,838 2000 5,642 6,717 7,106 2007 7,823 9,593 9,523 Source: Health, United States, 2009: With Chartbook on the Health of Americans, Table 136.

Hospital Price Inflation in the US
Annual Percent Change Year CPI
Inflation Hospital Services
1990 4.7 9.9 2000 2.5 4.2 2001 2.8 6.6 2002 1.6 8.7 2003 2.3 7.3 2004 2.7 5.9 2005 3.4 5.3 2006 3.2 6.5
Source: Health, United States, 2007: With
Chartbook on the Health of Americans, Table 120.

Pricing Practices in MedicinePrice discriminationCost shifting
From Medicare patients to private patients

Charges and discounts for diagnostic bilateral mammogram
Hospital (Location) Official charge
Medicaid Medicare HMOs, Health plans
Policy on Uninsured
UCLA Medical Center (Los Angeles)
$460 $127 $90 Up to $242 Gives discounts based on individual's ability to pay, says CFO Sergio Melgar
Oregon Health & Science University (Portland)
$240 $65 $59 Average $128
Works with uninsured patients to help them find financial aid; offers sliding scales, payment plans
Jamaica Hospital (Queens, N.Y.)
$351 $50 $96 $40 to $78 Has sliding fee scales for uninsured, says CEO David Rosen
Johns Hopkins Hospital & Health System (Baltimore)
$261 $156 $173 $186 State regulation of charges reduces disparity between bills to insured and uninsured
Grinnell Regional Medical Center (Grinnell, Iowa)
$285 $73 $79 $119 to $190
Works with uninsured to set a payment schedule
Source: Lucette Lagnado, “A Young Woman, An Appendectomy, And a $19,000 Debt,” Wall Street Journal, March 17, 2003, A1.

Problem Set #6
Pricing Practices in MedicinePrice discriminationCost shifting
From Medicare patients to private patients

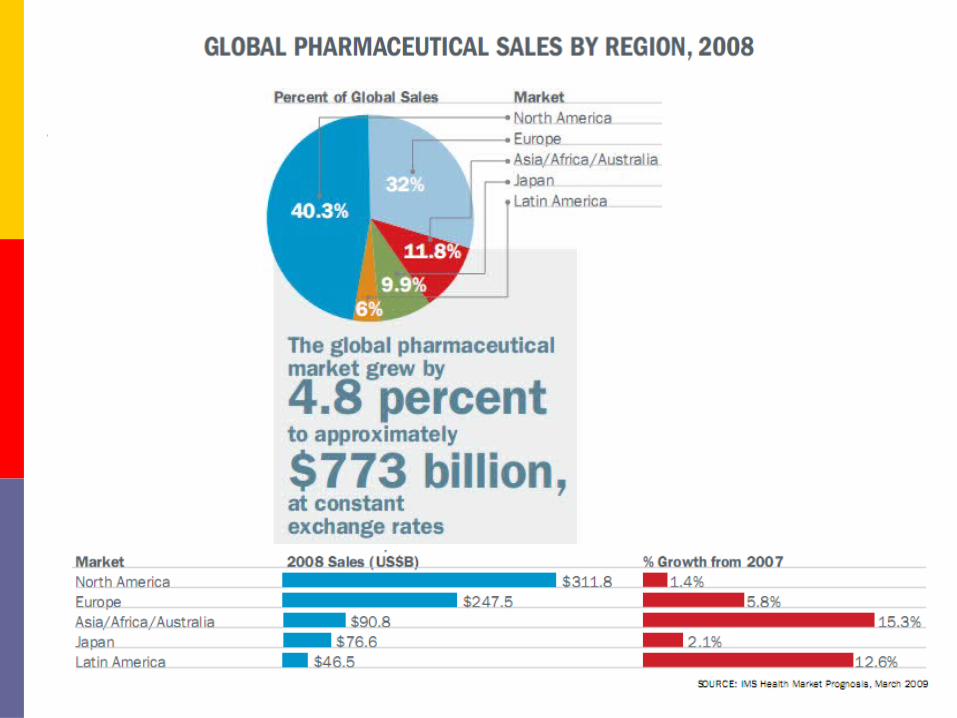
Market for Pharmaceuticals

Pharmaceutical Industry Pharmaceuticals account for 12% of healthcare spending Drug companies spend 14% of revenues on R&D Industry Structure
Basic research--supported by NIH labs and grants to universities
Applied research--development of marketable drugs 284 new drug approvals from 1990-99:
265 from industry 9 from government 10 from academia


Drug Purpose Maker Global Sales ($billions)
Annual Growth
Lipitor (2011) Lowers cholesterol Pfizer $13.7 -0.9%
Plavix (2011) Blood-thinner Bristol-Myers Squibb and Sanofi-Aventis
$ 8.6 16.9%
Nexium (2015) Treats ulcers AstraZeneca $ 7.8 7.8%
Advair (2010) Treats asthma GlaxoSmithKline $ 7.7 7.0%
Enbrel (2012) Treats arthritis Amgen/Wyeth $ 5.7 5.6%
Seroquel (2011) Anti-psychotic AstraZeneca $ 5.4 14.9%
Zyprexa (2011) Anti-psychotic Eli Lilly $ 5.0 -1.8%
Remicade (2018)Treats arthritis & Crohn’s Disease
Centocor $ 4.9 14.0%
Singulair (2012) Treats asthma Merck $ 4.7 3.1%
Lovenox (2007)Treats deep vein thrombosis
Sanofi-Aventis $ 3.8 8.9%
The World's Top-Selling Drugs, 2008
http://pharmexec.findpharma.com/pharmexec/Special+Reports/2009-PharmExec-Top-50/ArticleStandard/Article/detail/597526
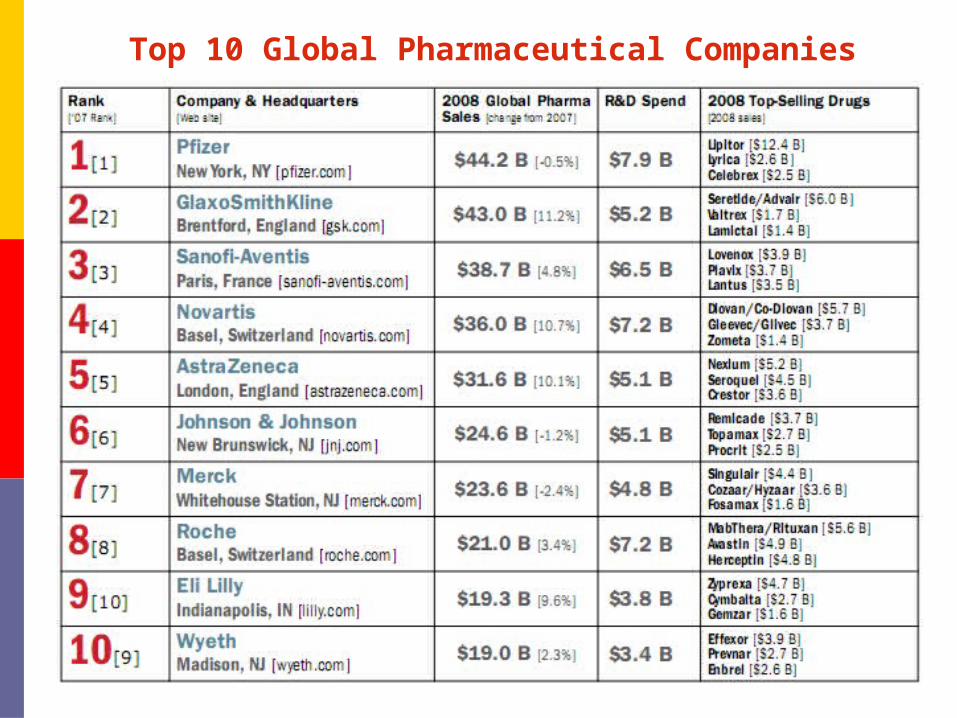
Top 10 Global Pharmaceutical Companies

R&D Process in Pharmaceuticals
Kefauver-Harris Amendment (1962) Thalidomide scare (1957-61) Established safety and efficacy standard Drug advertising must disclose side effects
R&D Process $55 billion spent by US pharma in 2006 DiMasi et al. (2003): average out-of-pocket cost for a new
approved drug is $403m (and fully capitalized cost is $802m)


R&D Process


Country of Origin Number of New Drugs Percentage
United States 764.0 60.4
Switzerland 89.0 7.0
United Kingdom 81.5 6.4
West Germany 73.0 5.8
France 39.5 3.1
Japan 26.5 2.1
Belgium 23.0 1.8
Sweden 18.5 1.5
Denmark 17.5 1.4
Holland 15.0 1.2
Italy 13.4 1.0
Mexico 10.0 0.8
Canada 5.0 0.4
Other countries 24.0 1.9
Source not ascertained 75.0 6.0
Total 1,265 100.0
Source: Weidenbaum (1993)
New Drugs Introduced into the US Market 1940-1990

Drug Is Beneficial Drug Is Harmful
FDA Allows the Drug Correct Decision
Type 1 Error:Allowing a harmful drug.
FDA Does Not Allow the Drug
Type 2 Error:Disallowing a beneficial drug.
Correct Decision
Is the FDA too Risk Averse?Two Types of Error in FDA Approval Decision
Victims are identifiable and traceable, and might appear on Oprah.Error is self-correcting
Victims are not identifiable and scarcely even acknowledged in theabstract.Error is not self-correcting
Regulating Drug Prices The economics of drug pricing
High fixed costs; low marginal costs Problem Set #12
Price controls in the U.S. and abroad Danzon (1996): role of generics
Impact of price controls on new drug development?
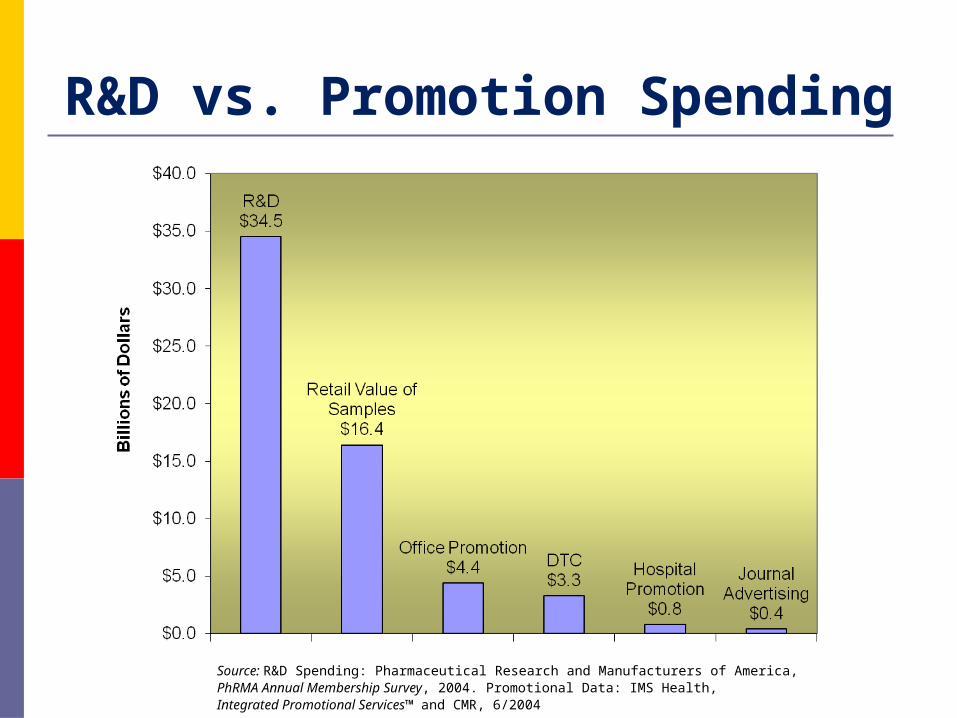
R&D vs. Promotion Spending
Source: R&D Spending: Pharmaceutical Research and Manufacturers of America,PhRMA Annual Membership Survey, 2004. Promotional Data: IMS Health,Integrated Promotional Services™ and CMR, 6/2004


Benefits of Pharmaceuticals

0.0
0.5
1.0
1.5
2.0
1988 1990 1992 1994 1996 1998 2000
Num
ber
of Y
ears
Added
to L
ongev
ity
.
New Medicines Account for 40% of Increase in Life Expectancy
Increase in Longevity due to NCE launches
Total Increase in Longevity
Source: F.R. Lichtenberg, “The Impact of New Drug Launches on Longevity: Evidence from Longitudinal, Disease-Level Data from 52 Countries, 1982-2001,” NBER: June 2003.

85%
35%
55%
30%
0%
10%
20%
30%
40%
50%
60%
70%
80%
90%
BeforeProgram
After Program BeforeProgram
After Program
ER Visits Hospitalizations
Perc
ent of P
atients
.
New Drugs Reduce Visits to Hospital and ER: Asthma Management Program Improves
Outcomes for Children with Asthma
Source: P.J. Munzenberger and R.Z. Vinuya, “Impact of an Asthma Program on the Quality of Life of Children in an Urban Setting,” Pharmacotherapy, 22 (2002).

Cost of Drug Therapy vs Surgery
DiseaseCost of Surgery
Cost of Drug Therapy
Drug Therapy as Percent of
Surgery
Ulcers $28,900 $900 3.1%
Heart Disease $43,370 $300 0.7%
Gallstones $12,000 $1,000 8.3%Source: Weidenbaum (1993)
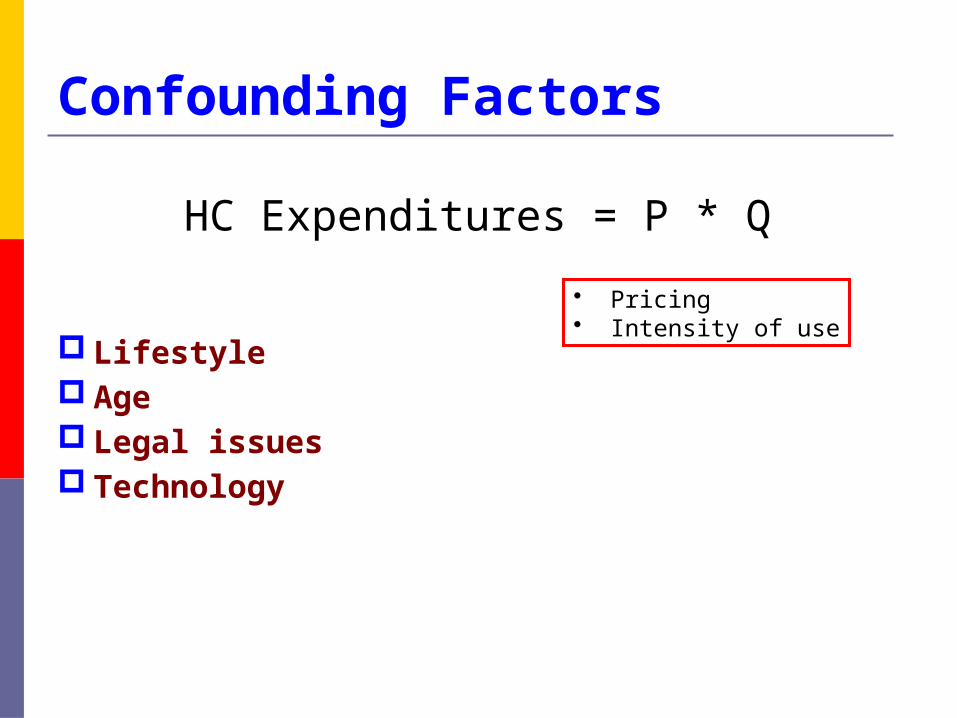
Confounding Factors
Lifestyle Age Legal issues Technology
HC Expenditures = P * Q
• Pricing• Intensity of use

Lifestyle Effects
AIDS STDs Teenage pregnancies
Alcohol abuse Cigarette smoking Drug Use Obesity
Liberal perspective: due to failure in economic system in providing sufficient income earning
opportunities
Conservative perspective:due to breakdown of traditional
family values with government as a contributor

AIDS Cases in the U.S.Year Males, 13 years
and older Females, 13 years
and older Children < 13
Years Old Total
1985 7,484 519 128 8,131 1990 36,180 4,544 725 41,449 1995 56,650 12,978 745 70,373 2000 30,387 10,763 117 41,267 2005 26,525 9,548 54 36,127 2007 26,355 9,579 28 35,962 All Years 810,676 198,544 9,209 1,018,428
Source: Health, United States, 2009: With Chartbook on Trends in the Health of Americans, Tab le 48.
Cases have stabilized at 36,000 annual cases

AIDS by Exposure CategoryNumber, by year of report
Source
1990 1995 2000 2007 Total To Date
Percent Distribution
Total To Date Total Cases
40,740 69,774 40,230 35,962 1,018,428 100.0
Homosexual/bisexual males
23,658 30,944 13,648 16,749 487,695 47.9
IV drug users
9,270 18,802 8,099 6,010 255,859 25.1
Homosexual/bisexual males and IV drug user
2,943 4,185 1,587 1,664 71,242 7.0
High-risk heterosexual contact
2,253 8,479 6,565 11,111 176,157 17.3
Hemophilia/Blood tranfusion
1,117 1,032 395 401 18,266 1.8
Source: Health, United States, 2002: With Chartbook on Trends in the Health of Americans, 2002, Table 55. And HIV Surveillance Report, 2007, Vol. 19.

AIDS in AmericaExtent of AIDS
Worldwide: 36-40m living with HIV; 22m deaths United States: 1m cases; 400,000+ deaths
Medical care issues Hellinger (1992): lifetime costs of $70,000 Cocktail
Protease inhibitors: $7400/yrAZT: $3500/yr3TC: $2800/yr
$12,000 - $16,000 pppy
$16,000 x 750,000 = $12 billion

Drug AbuseExtent of Drug UseCost to societyIntervention strategies

Use of selected substances in the past month, by age, 2007
Age Any Illicit Drug
Marijuana Alcohol Cigarettes
12-13 yrs 3.3 0.9 3.5 1.8
14-15 yrs 8.9 5.7 14.7 8.4
16-17 yrs 16.0 13.1 29.0 18.9
18-25 yrs 19.7 16.4 61.2 36.2
26-34 yrs 10.9 7.9 62.6 33.4
35 + 4.6 3.0 52.2 22.0
12 and over 8.0 5.8 51.1 24.2
Source: Health United States, 2009: With Chartbook on Trends in the Health of Americans, 2009, Table 63.

Use of selected substances among US high school seniors
Year Alcohol Cigarettes Marijuana Cocaine Inhalants MMDA
1980 72.0 30.5 33.7 5.2 1.4 --
1990 57.1 29.4 14.0 1.9 2.7 --
1995 51.3 33.5 21.2 1.8 3.2 --
2000 50.0 31.4 21.6 2.1 2.2 3.6
2003 47.5 24.4 21.2 2.1 1.5 1.3
2004 48.0 25.0 19.9 2.3 1.5 1.2
2005 47.0 23.2 19.8 2.3 2.0 1.0
2006 45.3 21.6 18.3 2.5 1.5 1.3
2007 44.4 21.6 18.8 2.0 1.2 1.6
Source: Health United States, 2009: With Chartbook on Trends in the Health of Americans, 2009, Table 64.

Prevalence of Tobacco Use25 Years and Older
Percent smokers
Year Male Female 1974 42.9 32.0 1979 37.3 29.5 1985 32.8 27.5 1990 28.2 22.9 1995 26.4 22.9 2000 24.7 20.5 2005 22.7 18.0 2006 22.9 17.9 2007 21.4 17.2
Source: Health United States, 2009: With Chartbook on Trends in the Health of Americans, 2009 Table 61.
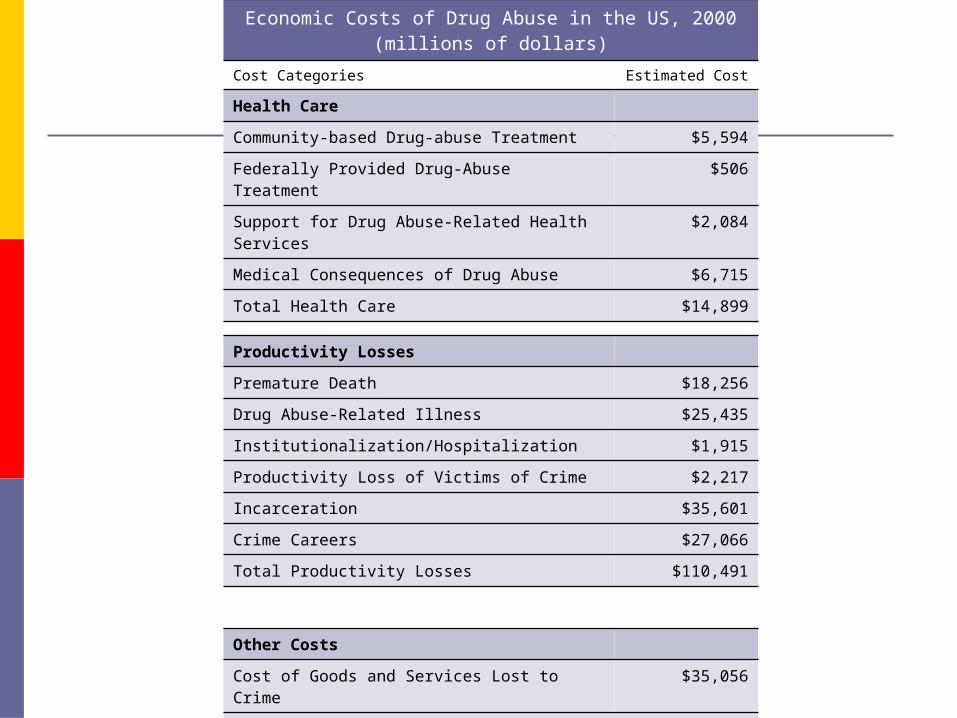
Economic Costs of Drug Abuse in the US, 2000(millions of dollars)
Cost Categories Estimated Cost
Health Care
Community-based Drug-abuse Treatment $5,594
Federally Provided Drug-Abuse Treatment $506
Support for Drug Abuse-Related Health Services
$2,084
Medical Consequences of Drug Abuse $6,715
Total Health Care $14,899
Productivity Losses
Premature Death $18,256
Drug Abuse-Related Illness $25,435
Institutionalization/Hospitalization $1,915
Productivity Loss of Victims of Crime $2,217
Incarceration $35,601
Crime Careers $27,066
Total Productivity Losses $110,491
Other Costs
Cost of Goods and Services Lost to Crime $35,056
Social Welfare Administration $218
Total Other Costs $35,274
Total Economics Costs $160,664
Source: US National Drug Control Policy, 2001

Is Addiction Rational? When does a habit become an addiction? Becker and Murphy (1988)
Past consumption increases current consumption People make forward-looking consumption plans Policy Implication: if cigarette taxes are credibly
announced to double in one year, then current consumption will decrease
Gruber and Koszegi (2001) Forward looking behavior is not consistent over time Policy should take into consideration not only
externalities of behavior, but “internalities”
Smokers die on average 6.1 years prematurely. At $100,000/year, cost per pack smoked is $30.45
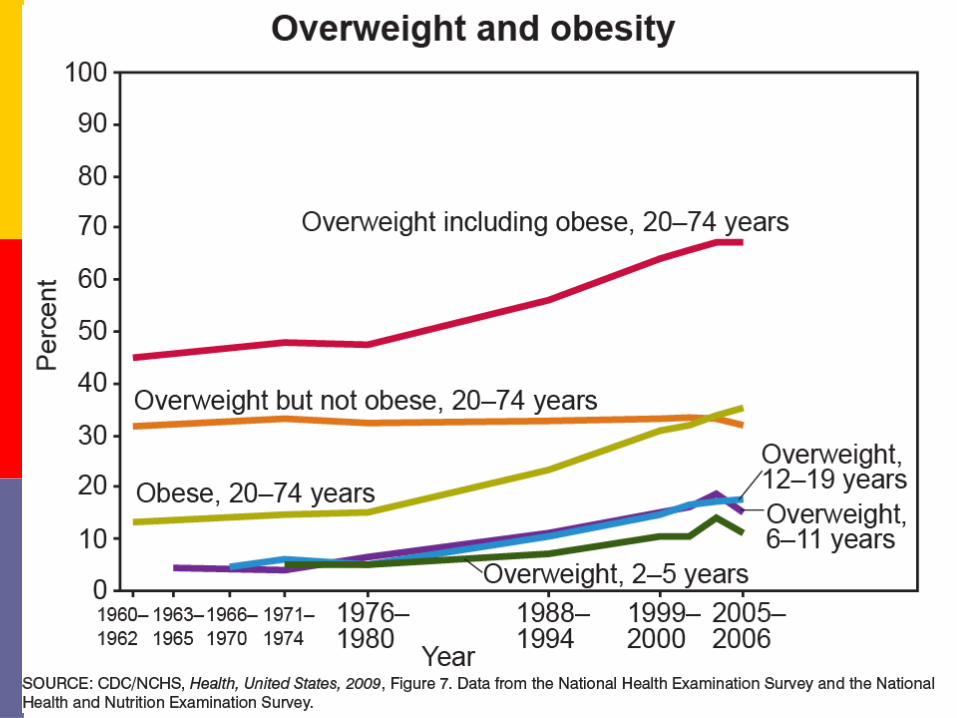
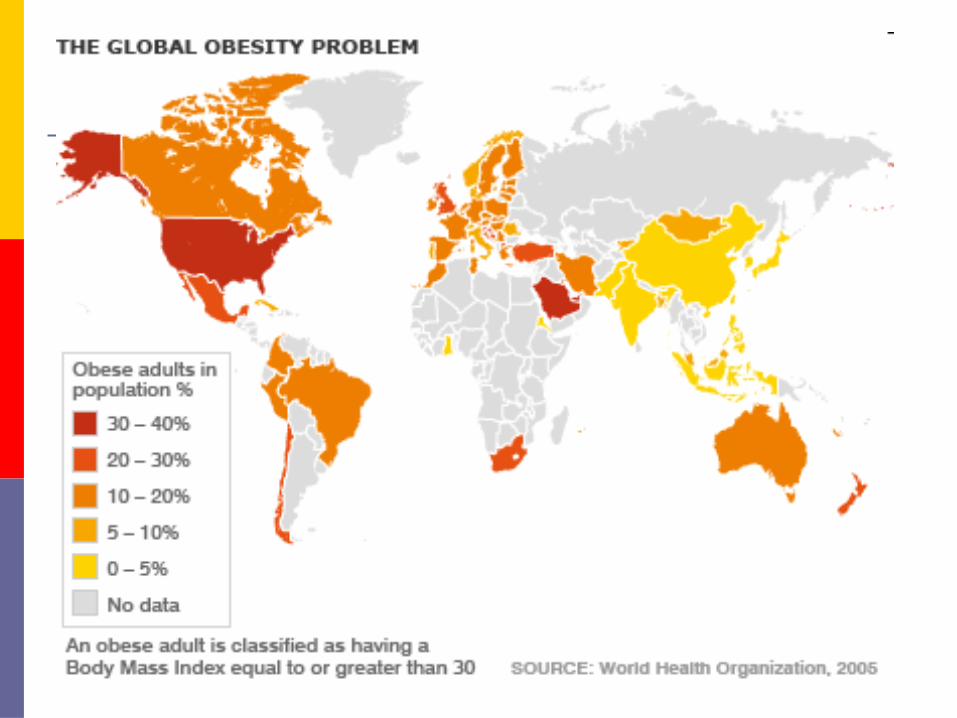

Obesity
BMI > 30 30% of Americans Health Problems
Diabetes Hypertension Cardiovascular disease Colon cancer Postmenopausal breast cancer
Finkelstein, Fiebelkorn, and Wang (2003) Direct costs of obesity ~ $90 billion 9% of total medical expenditures

Aging of the Population


Elderly in the U.S. Percent of total civilian population
Year Over 65 65-74 75-84 Over 85 1950 8.1 5.5 2.2 0.4 1960 9.2 6.1 2.6 0.5 1970 9.9 6.1 3.0 0.7 1980 11.3 6.9 3.4 1.0 1990 12.5 7.3 4.0 1.2 1995 12.8 7.2 4.2 1.4 2000 12.4 6.5 4.4 1.5 2005 12.4 6.3 4.4 1.7 2010 13.3 7.0 4.4 2.0 2020 16.4 9.5 4.8 2.1 2030 20.1 10.9 6.7 2.5 2040 20.7 9.1 7.9 3.7 2050 20.4 8.8 6.8 4.8 Source: Economic Report of the President, 1994, Table B-32, p. 305 and Health, United States, 2007 Table 1.

Personal Health Care Expenditures by Age and Type of Service (2004)
Age Group Personal Health Care
Hospital Care
Physicians’ Services
Nursing Home
Services
Other
Less than 19 $ 2,650 $ 1,000 $ 753 $ 18 $ 879
19-64 4,511 1,636 1,256 127 1,492
65 + over 14,797 5,403 3,024 2,526 3,844
65-74 10,778 4,191 2,716 809 3,062
75-84 16,389 6,178 3,463 2,623 4,125
85 + over 25,691 7,916 3,037 8,706 6,032
All ages 5,276 1,928 1,339 115.0 1,894
Source: http://www.cms.hhs.gov/NationalHealthExpendData/downloads/2004-age-tables.pdf
Per capita dollars

Utilization of Medical Care Resources, 2005
Age Group
Out-Patient Visits per
100 Population
Days of Hospital
Care per 100 Population
Inpatient Procedures
per 100 Population
(Males)*
Inpatient Procedures
per 100 Population (Females)*
Physician
Office Visits Per 100
Population Less than 18 33 19.2 4.0 3.7 253 18-44 26 33.1 5.0 19.0 224 45-64 32 59.2 16.2 15.2 391 65-74 41 139.9 37.6 33.0 647 Over 75 38 259.4 56.5 45.6 768 All persons 33 55.4 12.5 16.7 329 Source: Health, United States, 2003 and 2007. * 2001 data.
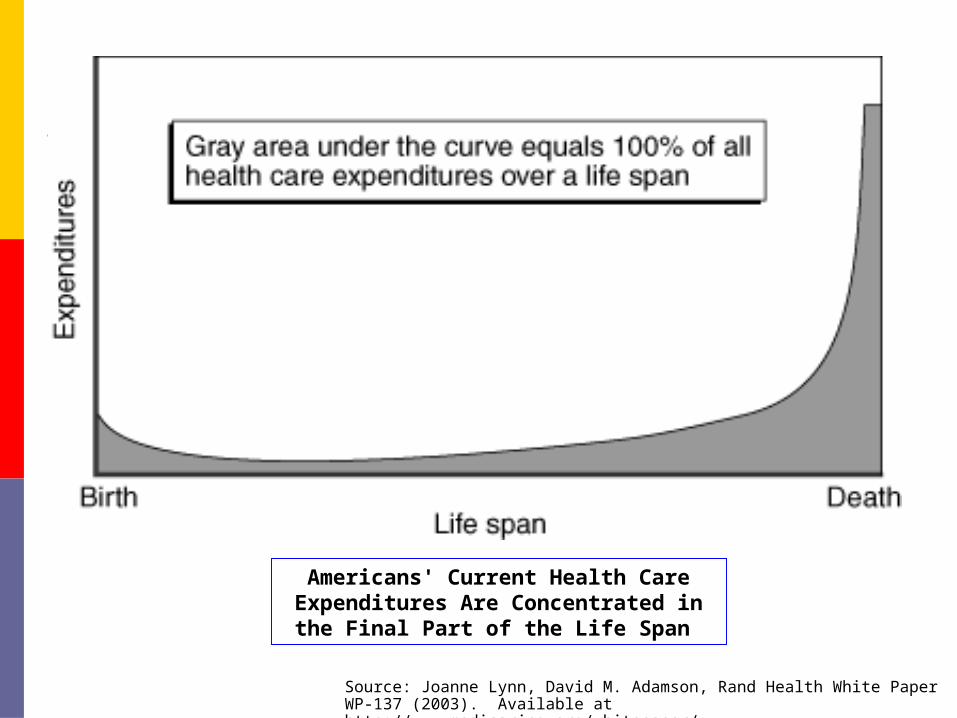
Americans' Current Health Care Expenditures Are Concentrated in
the Final Part of the Life Span
Source: Joanne Lynn, David M. Adamson, Rand Health White Paper WP-137 (2003). Available at http://www.medicaring.org/whitepaper/

Legal System and Malpractice

Medical Malpractice Tort Costs(Billions of 2008 $)
Source: 2009 Update on U.S. Tort Costs, Towers Perrin, 2009.
$0
$5
$10
$15
$20
$25
$30
$35
1975 1980 1985 1990 1995 2000 2005
Bil
lio
ns
.
0.00%
0.05%
0.10%
0.15%
0.20%
0.25%
0.30%
Sh
are
of
GD
P
.
Share of GDP
Tort Costs

Tort Law in the United StatesFour elements of a tort case
Presence of a physician-patient relationship An adverse outcome Negligence by the provider Direct causality between the negligence and
adverse outcomePurpose of tort law
Compensation Deterrence Retribution

Claims Frequency by Specialty
Date
All Physicians
General/ Family
Practice
Internal Medicine
Surgery Obstetrics/ Gynecology
1985 10.2 5.7 6.2 16.8 25.8 1986 9.2 7.6 5.5 15.8 13.0 1987 6.7 5.7 4.5 12.7 8.0 1988 6.4 6.2 4.3 10.2 15.1 1989 7.4 6.6 5.9 11.2 13.5 1990 7.7 5.9 6.2 11.5 11.9 1991 8.2 5.7 5.5 14.0 11.6 1992 9.1 6.9 7.3 15.5 15.6 1993 9.8 7.1 7.9 18.9 22.5 1994 9.5 6.7 5.7 16.9 19.2 1995 9.0 6.2 5.7 14.9 20.9 1996 9.0 6.7 5.3 14.9 13.1
Source: Martin L. Gonzalez, ed., Socioeconomic Characteristics of Medical Practice, Chicago: American Medical Association, various years.

Malpractice Premiums by Specialtyas a percentage of professional expenses
Year All
Physicians
General/ Family
Practice
Internal Medicine
Surgery
Obstetrics/ Gynecology
1985 10.2 7.0 6.4 12.2 17.8 1986 10.8 6.1 6.4 14.3 19.6 1987 12.1 7.3 7.1 14.9 20.4 1988 11.3 7.7 6.6 14.1 18.6 1989 10.4 7.0 5.9 12.7 18.7 1990 9.7 5.8 6.6 11.3 16.1 1991 8.7 5.5 5.0 10.4 14.8 1992 7.6 5.2 4.9 8.6 14.3 1993 7.9 4.9 4.9 9.2 14.2 1994 8.2 5.4 4.6 8.9 19.0 1995 7.4 5.0 4.7 8.8 14.4 1996 6.5 4.0 4.6 7.1 13.2
Source: Martin L. Gonzalez, ed., Socioeconomic Characteristics of Medical Practice, Chicago: American Medical Association, various years.

International Comparison of Malpractice Awards (2001)
United States
Australia Canada United Kingdom
Claims per 100 physicians 7.67 4.72 1.90 6.00
Claims per 100,000 population 18 12 4 12
Average claim awarded (PPP US $) $265,103 $97,014 $249,750 $411,171
Source: Anderson, Hussey, Frogner, and Walters (2005)

Causes of Increased Litigation
Increased supply of lawyers Increased litigiousness in US Increased medical cost and physicians’ salaries Breakdown of physician-patient relationship Pro-plaintiff trend in common law doctrine Size of damage awards Increased technology in medicine

Silicone Implant Litigation Silicone implants first introduced
in 1962 by Dow Corning FDA relabeled implants as class III
medical device in 1988 FDA moratorium in 1992 National class action lawsuit with
thousands of plaintiffs $4.25 billion settlement with 40%
going to attorneys Dow Corning bankruptcy
FDA removed moratorium in 2006
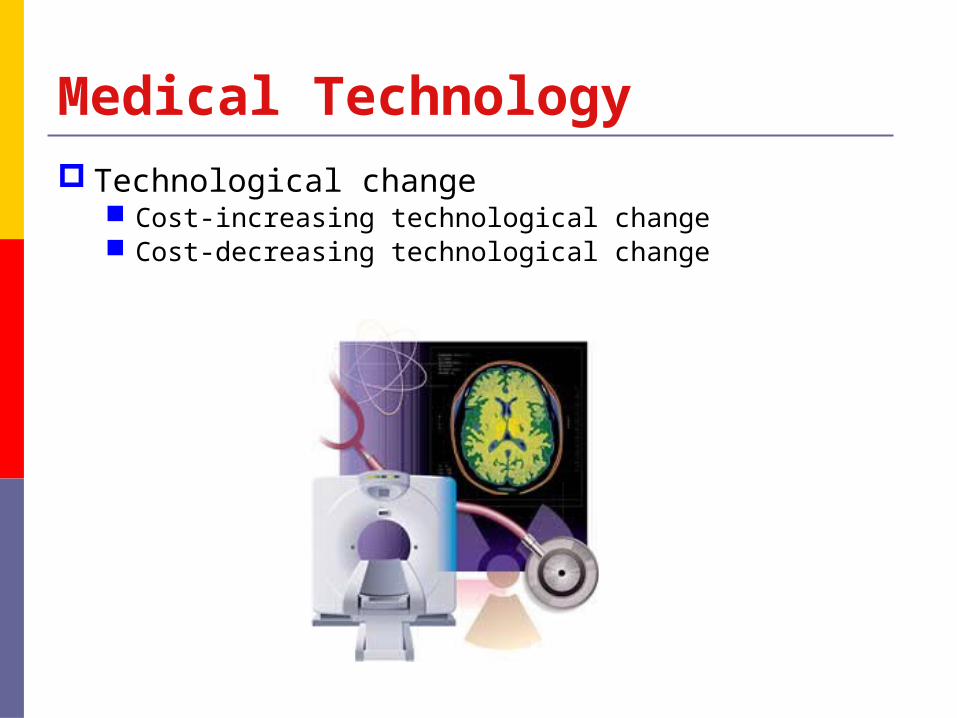
Medical Technology Technological change
Cost-increasing technological change Cost-decreasing technological change

MRI Machines, 2007
40.1
25.9
19.3
18.6
16.0
15.3
14.4
13.2
11.0
10.5
10.2
9.3
8.8
8.2
8.2
6.7
5.7
5.6
5.1
4.4
2.7
1.5
0 10 20 30 40
Japan
United States
Iceland
Italy
Korea
Finland
Switzerland
Greece
OECD
Luxembourg
Denmark
Spain
New Zealand
United Kingdom
Germany
Canada
France
Turkey
Australia
Czech Republic
Poland
Mexico
MRI (per million population)

CT Scanners, 2007
92.6
56.0
37.1
34.3
32.1
30.3
27.3
25.8
22.8
18.7
17.4
16.4
16.3
14.6
14.3
12.7
12.3
10.3
9.7
8.1
7.6
4.0
0 10 20 30 40 50 60 70 80 90 100
Japan (2002)
Australia
Korea
United States
Iceland
Italy
Luxembourg
Greece
OECD
Sw itzerland
Denmark
Finland
Germany
Spain
Ireland
Canada
New Zealand
France
Poland
Turkey
United Kingdom
Mexico
CT Scanners (per million population)

MRI Exams per 1000 population2007
0.010.020.030.040.050.060.070.080.090.0
100.0
United S
tate
s
Icela
nd
Luxe
mbo
urg
Belgium
OECDSpa
in
Canada
United K
ingdom
Hungar
y
Czech
Rep
ublic
Franc
e
Austra
lia
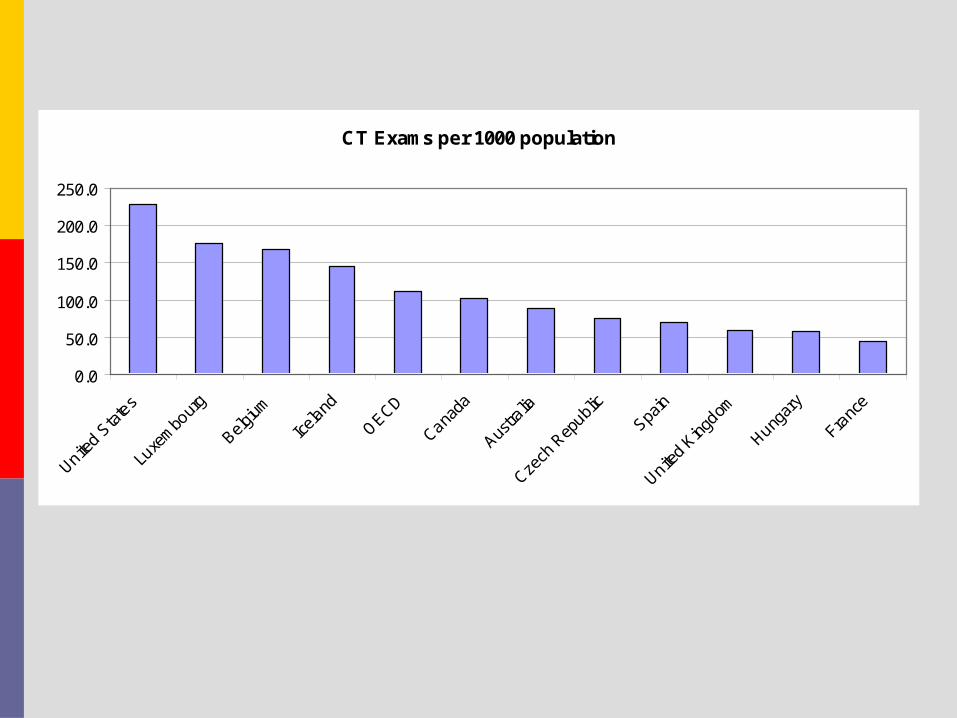
CT Exams per 1000 population
0.0
50.0
100.0
150.0
200.0
250.0
United S
tate
s
Luxe
mbo
urg
Belgium
Icela
nd
OECD
Canada
Austra
lia
Czech
Rep
ublic
Spain
United K
ingdom
Hungar
y
Franc
e

High-cost Medicine
Heart disease Angioplasty: 1 million @ $10,000 each
CABGS: 500,000 @ $50,000+ each
Heart transplantation: 2,212 @ $787,000 each
Infertility treatment IUI (intrauterine insemination): $1000-$2000 per cycle
IVF (in vitro fertilization): $10,000-$12,000 per cycle
GIFT (gamete intrafallopian transfer): $15,000-$20,000 per cycle

Organ Transplantation
History National Organ Transplant Act (1984)
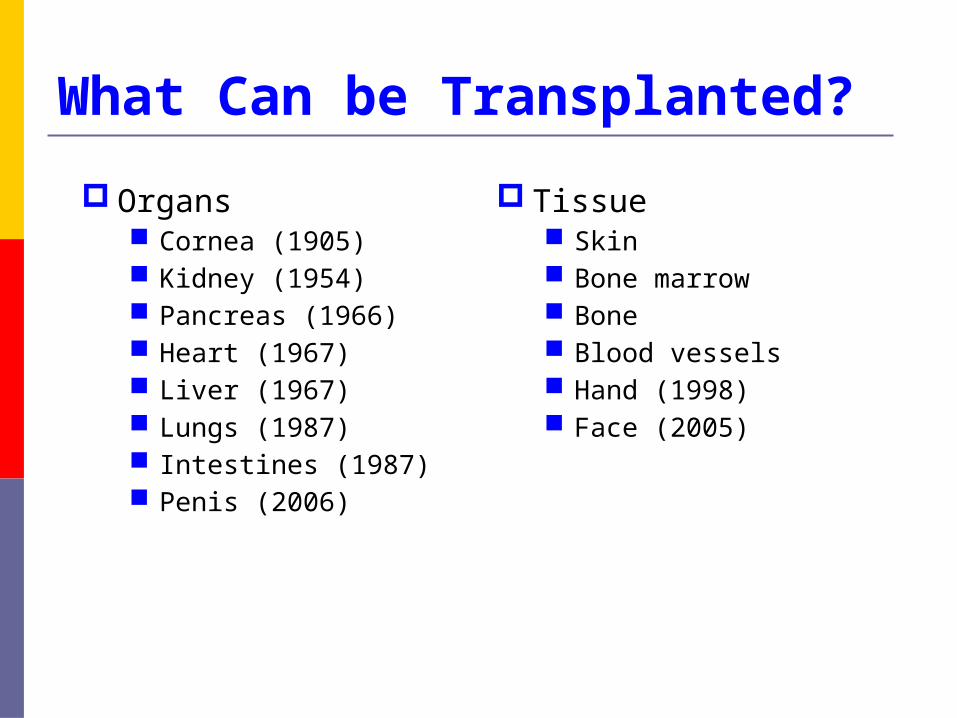
What Can be Transplanted?
Organs Cornea (1905) Kidney (1954) Pancreas (1966) Heart (1967) Liver (1967) Lungs (1987) Intestines (1987) Penis (2006)
Tissue Skin Bone marrow Bone Blood vessels Hand (1998) Face (2005)
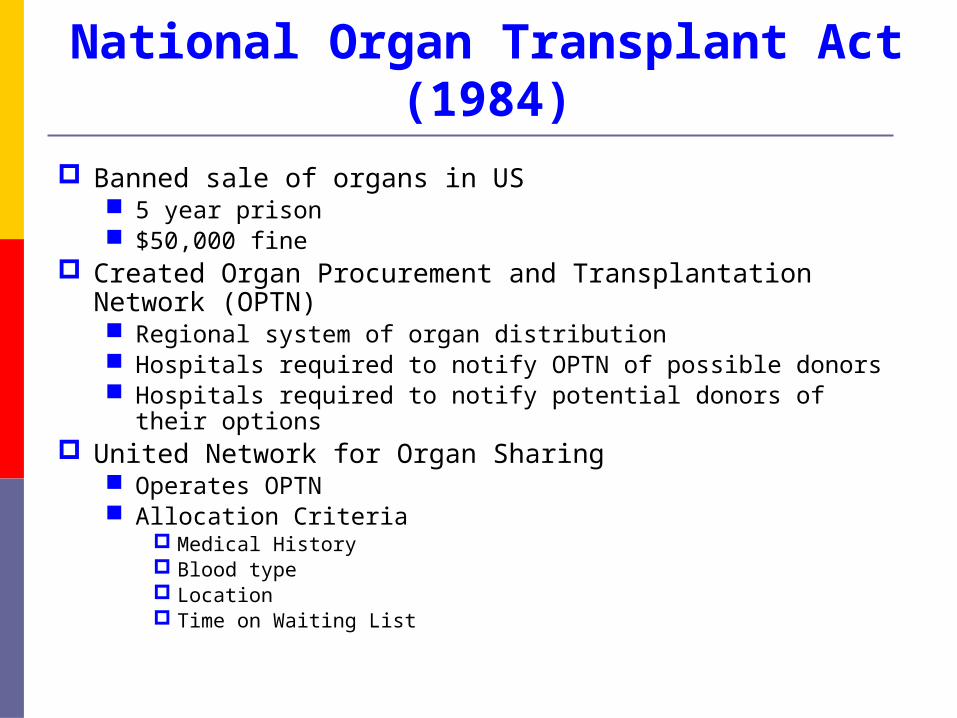
National Organ Transplant Act (1984)
Banned sale of organs in US 5 year prison $50,000 fine
Created Organ Procurement and Transplantation Network (OPTN) Regional system of organ distribution Hospitals required to notify OPTN of possible donors Hospitals required to notify potential donors of their options
United Network for Organ Sharing Operates OPTN Allocation Criteria
Medical History Blood type Location Time on Waiting List

Number of U.S. Transplants
Year Kidney Pancreas Kidney/ Liver Heart Lung Heart/ IntestinePancreas Lung
1990 9,417 69 458 2,690 2,107 203 52 51995 11,084 109 919 3,934 2,363 872 69 462000 13,619 439 915 4,997 2,199 959 48 822005 16,483 542 903 6,444 2,125 1,406 35 1782008 16,520 436 837 6,319 2,163 1,478 27 1852009 16,829 379 854 6,320 2,212 1,661 29 178
Total to date
284,156 6,530 16,710 100,784 47,487 19,775 1,021 1,884
Candidates on Waiting List
89,537 1,496 2,284 16,574 3,166 1,881 72 241
2008 Average Billed Price
$259,000 $275,200 $439,000 $523,400 $787,000 $450,400 $1,123,000 $1,121,800
Patient survival rate 1-year (%)
95.6 95 94.4 86.7 88.0 83.2 55.6 82.2
3-year 90.3 90.2 90.4 78.3 79.3 62.2 44.3 57.0
Market for Organs
Supply and demand for organs Property rights
U.S. policy—required requestRest of Europe—presumed consent
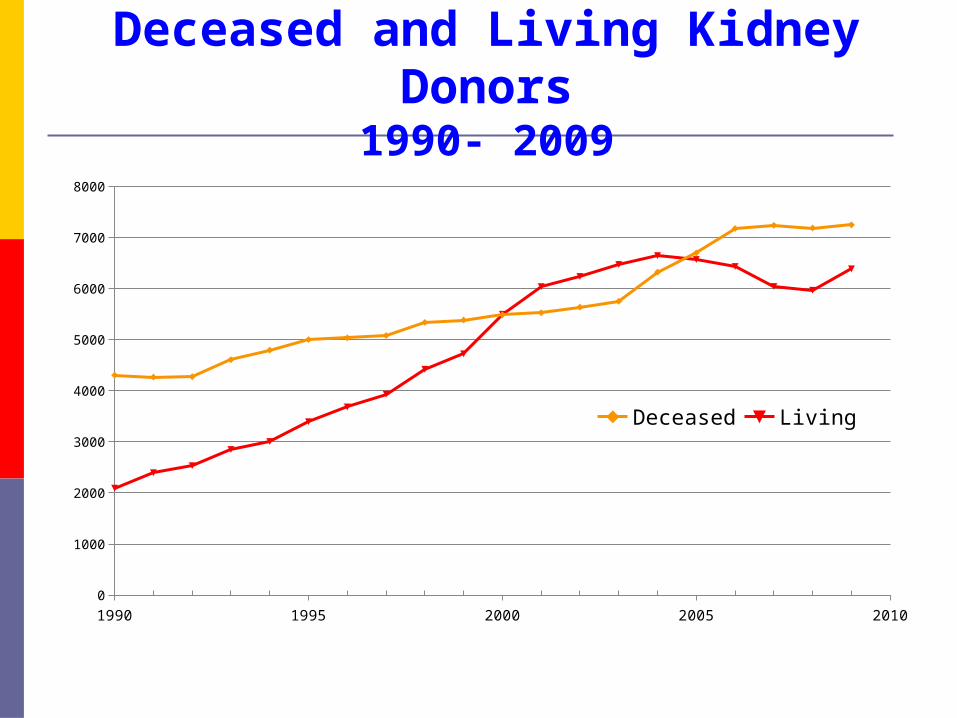
Deceased and Living Kidney Donors1990- 2009
1990 1995 2000 2005 20100
1000
2000
3000
4000
5000
6000
7000
8000
Deceased Living

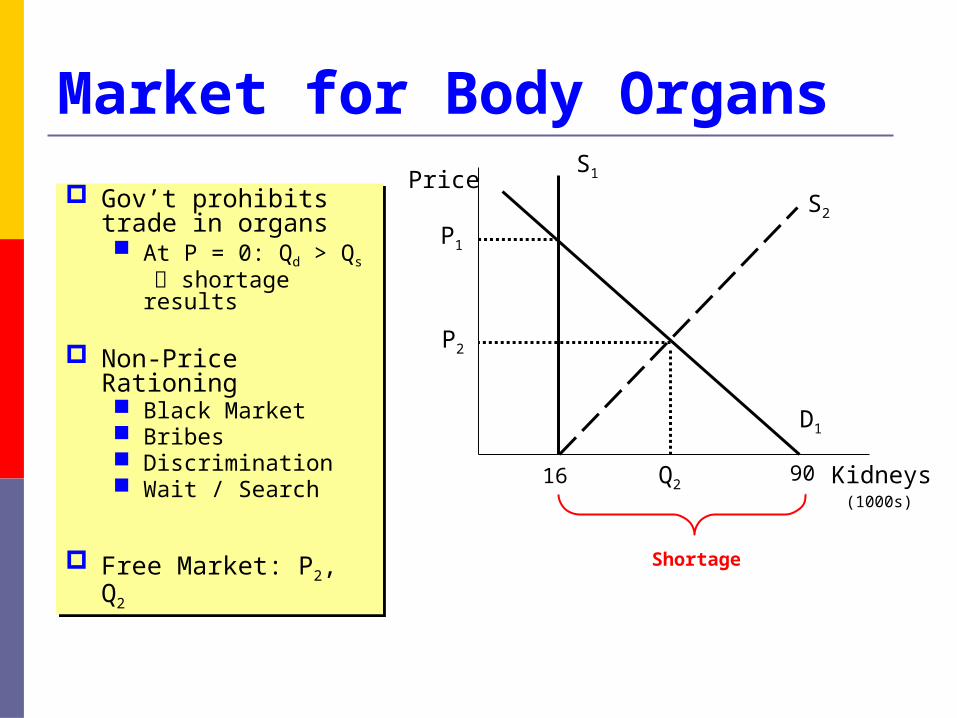
Market for Body Organs
Kidneys
Price
D1
S1
P1
Shortage
Gov’t prohibits trade in organs At P = 0: Qd > Qs shortage results
Non-Price Rationing Black Market Bribes Discrimination Wait / Search
Gov’t prohibits trade in organs At P = 0: Qd > Qs shortage results
Non-Price Rationing Black Market Bribes Discrimination Wait / Search
16 90(1000s)
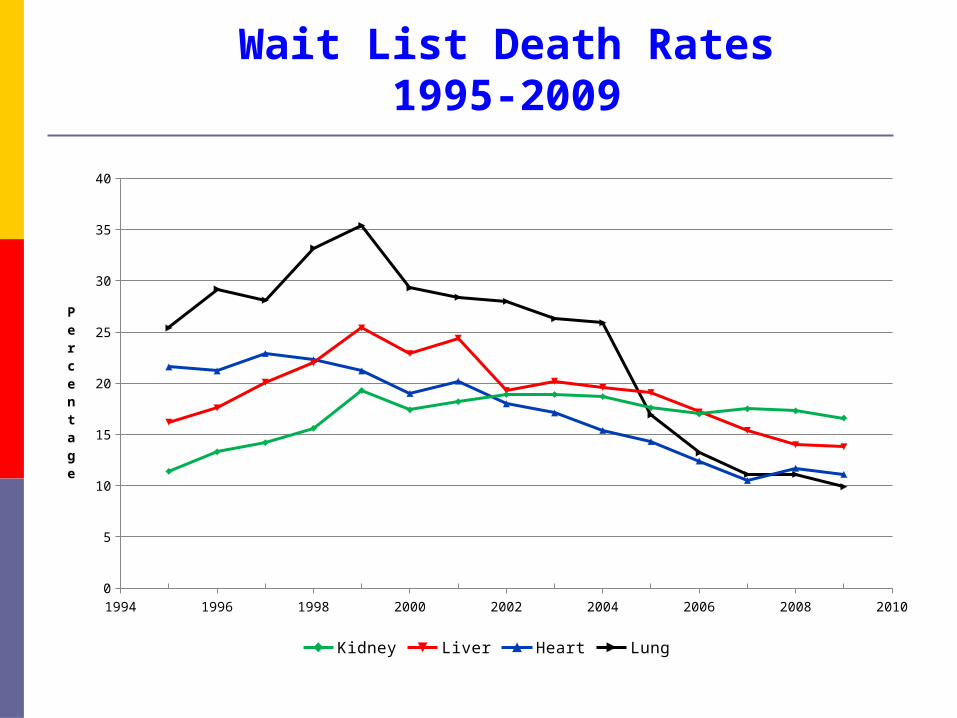
Wait List Death Rates1995-2009
1994 1996 1998 2000 2002 2004 2006 2008 20100
5
10
15
20
25
30
35
40
Kidney Liver Heart Lung
Percentage

Organ Rationing SchemesAllocation
Methods Benefits Costs
Waiting time Equitable Inappropriate matching;
organ wastage; no consideration of urgency
Priority to sickest first Equitable
Higher retransplantation and death rates; less benefit overall
Priority to sickest last
Higher overall survival; less
retransplantation Sickest patients die
Best Biological Match
Higher overall survival; less
retransplantation
Fewer transplants for certain groups, including highly sensitized patients and some minorities
Source: Charles T. Carlstrom and Christy D. Rollow, The Cato Journal (Vol. 17, #2) Fall 1997
Market for Body Organs
Kidneys
Price
D1
S1
P2
Q2
P1
Shortage
Gov’t prohibits trade in organs At P = 0: Qd > Qs shortage results
Non-Price Rationing Black Market Bribes Discrimination Wait / Search
Free Market: P2, Q2
Gov’t prohibits trade in organs At P = 0: Qd > Qs shortage results
Non-Price Rationing Black Market Bribes Discrimination Wait / Search
Free Market: P2, Q2
S2
16 90(1000s)

Iranian Model Legalized the sale of kidneys Officially approved patients’
organization oversees all transactions
Donors get $2000 - $4000 Waiting list has been eliminated
Source: The Economist, November 16, 2006, available at http://www.economist.com/world/international/displaystory.cfm?story_id=8173393

Cost of Transplant Surgery, 2008
Organ
Number
Transplanted
Estimated
Cost1 (millions)
Estimated Average Cost
per transplant
Number on
Waiting List
Estimated Cost if Donor Organs were
Available2
Total Estimated
Cost (millions)
Kidney 16,520 $ 4,278.7 $ 259,000 89,537 $ 23,190 $ 27,469 Heart 2,163 1,703.8 787,700 3,166 2,494 4,197 Liver 6,319 3,307.4 523,400 16,574 8,675 11,982 Heart/Lung 27 30.3 1,123,800 72 81 111 Pancreas 436 120.1 275,500 1,496 412 532 Lung 1,478 665.7 450,400 1,881 847 1,513 Total 26,943 $10,106.0 - 112,726 $35,699 $45,805 1. Number transplanted times average cost of the transplant procedure. 2. Number on waiting list times average cost of the transplant procedure.


