Market, government and Malaysia’s neweconomic policy
Rajah Rasiah and Ishak Shari*
Leading economic institutions such as the World Bank have argued that liberalisa-tion holds the key to growth, poverty alleviation and redistribution. Even recentefforts to model increasing returns within the framework of new growth theories havenot resulted in prescriptions for stronger roles for governments. The fast-growingSoutheast Asian economies are still being used to demonstrate causation betweenliberalisation, and growth, poverty alleviation and redistribution. Using Malaysia as an example, this paper argues that growth, poverty alleviation and redistributionin the country was achieved under circumstances of both interventionist policies aswell as market coordination. Throughout the New Economic Policy (NEP) period(1970–90), strong incentives were offered to both the import-substitution and export-oriented manufacturing sectors, and the state made strong forays into the market toredress poverty and inequality. The paper also argues that poorly coordinatedgovernment intervention generated substantial unproductive rent seeking.
Economists have long grappled with the fundamental question of how to govern eco-nomic growth. Neoliberal economists point to the invisible hand of the market as the bestallocating force to bring about systematic growth. Production and distribution areregarded as best driven by private enterprise with little or no state intervention. Since theallocative role is given to markets, governments are at most only recommended a minorrole (Little, 1982; World Bank, 1993). Even recent efforts to model increasing returnswithin the framework of new growth theories have not resulted in prescriptions forstronger roles for governments (see Krugman and Helpman, 1989; Lucas, 1988).1 Fast-growing economies are still being used to demonstrate causation between liberalisationand economic growth. Some orthodox economists have labelled the first-tier Asian NewlyIndustrialised Economies (NIEs) as liberal (Ranis and Fei, 1975; Balassa, 1982). Under-
Manuscript received 6 March 1999; final version received 30 July 1999.Address for correspondence: Professor Rajah Rasiah, UNIMAS, 94300 Kota Samarahan, Sarawak, Malaysia;
* Professor of Industrial Organisation and Professor of Economics, respectively, IKMAS, University ofKebangsaan, Malaysia. Useful comments from two anonymous referees are gratefully acknowledged. Theusual disclaimer applies.
1 New growth modellers contend that the problems of government failure far outweigh that of marketfailure and therefore discourage government intervention.
developed economies, such as India and Turkey, have often been characterised as dis-torted economies (Little, 1982).
While excessive regulation characterised a number of institutions and industries indeveloping economies, suggesting a need for liberalisation, successful developers demon-strate the need for selective intervention to overcome market failure and enhance eco-nomic performance. The evidence on selective intervention by governments in SouthKorea, Taiwan and Singapore is now clear (Luedde-Neurath, 1986; Deyo, 1987; Evans,1987; Amsden, 1989; Wade, 1991; Lall, 1996). The World Bank (1993) recognised thesignificance of state intervention in the above-mentioned first-tier NIEs, but consideredthe second-tier NIEs of Malaysia, Thailand and Indonesia as better demonstrationmodels, on account of their supposed amenability to global liberalising currents.
Malaysia has been one of these second-tier NIEs, classified as liberal, and with itsexport-oriented industries governed by markets (Sheperd, 1980, pp. 186–7). Salleh andMeyanathan (1993) and the World Bank (1993) have argued that growth and inter-national competitiveness in Malaysia has been achieved as a result of liberalisation fromthe mid-1980s.
A similar explication is also apparent on Malaysia’s redistributive policies. The 20-yearperiod of Malaysia’s New Economic Policy (NEP) ended in 1990. Despite not quiteachieving 30% Bumiputera1 corporate equity participation in the economy, it heralded anera of rapid growth and redistribution. Poverty and inequality have declined since 1971and 1976, respectively. The unemployment rate, too, fell to just 2·5% by 1996, from8·0% in 1970. The improved performance evident from the late 1980s occasioned areinterpretation of the NEP. Salleh and Meyanathan (1993) and the World Bank (1993)argue that the improved conditions were the result of non-distortionary market-orientedpolicies. The NEP’s distribution goals are now considered to be internally consistent andmarket friendly, and hence non-distortionary. In short, neo-liberal orthodoxy has por-trayed Malaysian economic fundamentals as having been fortified by market-friendlypolicies.
This paper, however, argues that Malaysia’s growth and restructuring policies through-out the NEP period were interventionist, with strong roles for both market and govern-ment. A blend of government intervention and markets helped make export-orientedindustrialisation a success, which, along with specific distributive policies, helped reducepoverty and inequality in the country. Ineffective planning and misguided deregulation insome areas also resulted in the growth of unproductive cronyism.
The second section of this paper examines the NEP, followed by its impact on economicgrowth. The third section looks at its impact on redistribution and Section 4 concludes.Given that the NEP was terminated in 1990, the paper avoids discussion of the financialcrisis that has gripped the country since 1997.
2. The New Economic Policy
Manufacturing was earmarked as the engine of growth to spearhead restructuring in theSecond Malaysia Plan, launched alongside the NEP in 1971. The post-colonial stateadopted an interventionist strategy, but one designed to attract foreign capital, as early as1958, following the Pioneer Industry Ordinance. Early intervention was, however, limited
1 The word Bumiputera literally means sons of the soil, but for official considerations it is generally taken torefer to the indigenous peoples of Malaysia.
03 57-78 Rasiah 29/11/0 10:03 am Page 58
Market, government and Malaysia’s new economic policy 59
to incentives (financial and non-financial) and tariffs on final goods. The non-financialincentives included severe controls on labour organisation: unions were not allowed inpioneering industries such as textiles and electrical goods. These incentives were offeredto all pioneering firms irrespective of ownership. The lack of technological and perform-ance conditions led to the proliferation of ‘screw-driver’ operations behind high tariffwalls (see Edwards, 1975). There was also no strategy for supporting financial research,training and market promotion. It is little wonder that manufacturing’s contribution togross domestic product (GDP) stagnated at 9% in 1960 and 1965 (World Bank, 1980).When growth fizzled out in the mid-1960s, the government switched emphasis towardsexports. The non-discretionary use of protection ran against the infant industry argu-ment, which was premised on sheltering infant firms for eventual international competi-tion (see Lewis, 1955; Kaldor, 1957; Myrdal, 1957). However, this never happened;rather, foreign transnationals in Malaysia slowed down production once the small internalmarket became saturated (see Rasiah, 1993).
Outward orientation began with the enactment of the Investment Incentives Act (IIA)in 1968 but expanded only after the opening of the free trade zones in 1972. Given the lowstarting base, the annual real growth in GDP of 6·3% in the period 1961–70 (Hasan,1980, Table 2.1) was not impressive. Employment on average grew at only 3·6% annuallyin the period 1961–72 (Rasiah, 1993A, Table 4.9). The unemployment rate had risenfrom 6·0% in 1962 to 6·5% in 1965 and 8·0% in 1970 (Wong, 1979, Table 5.6; Malaysia,1976). Ethnic inequality, too, had increased in this period. The ratio of Chinese to Malaymedian incomes rose from 1·99:1 in 1957/58 to 2·20:1 in 1967/68. The ratio of Malay tonon-Malay median incomes rose from 1·83:1 to 1·88:1 in the same period (Jomo andIshak, 1986; Snodgrass, 1980). This worsening economic situation coupled with frustra-tion, especially amongst the Malay élites and recent graduates, and the subsequent ethnicbloodshed of 1969, formed the basis for the promulgation of the NEP in 1971.
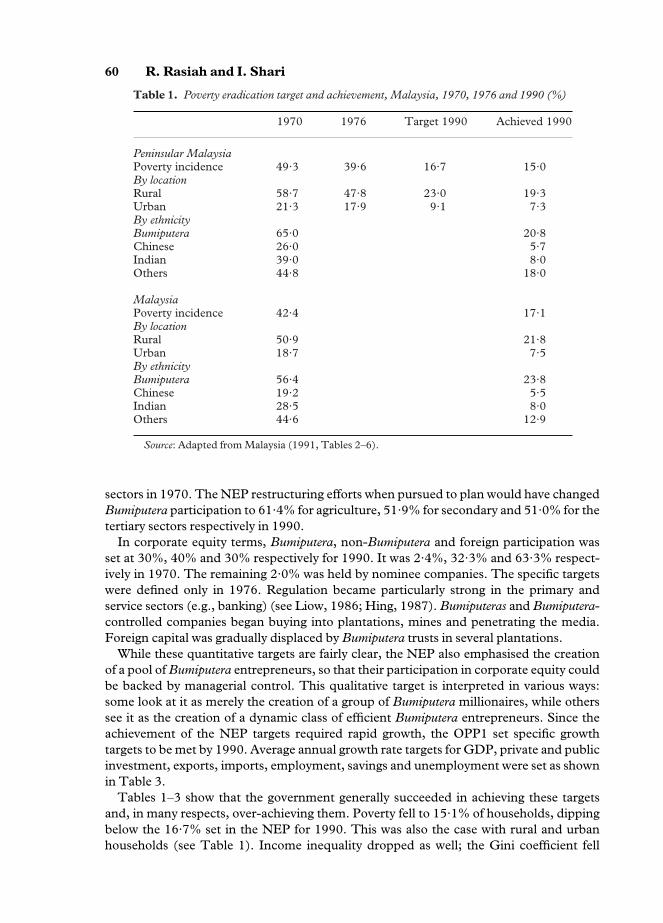
The NEP aimed at fostering national unity and nation-building through eradicatingpoverty and economic restructuring so as to eliminate the identification of ethnicity witheconomic function (Malaysia, 1991, p. 31). These dual objectives were to be achievedthrough rapid growth. The First Outline Perspective Plan (OPP1) set the broad socio-economic framework for the achievement of NEP targets. The first prong was to reducepoverty irrespective of ethnicity. The target set was a reduction of poverty from 49·3% of households in 1970 to 16·7% of households in 1990 for Peninsular Malaysia (see Table 1).1 The target for rural–urban breakdown was a reduction from 58·7% and 21·3%respectively in 1970 to 23·0% and 9·1% respectively by 1990. Ethnically, the incidence ofpoverty in 1970 was 74% for Malays, 26% for the Chinese, 39% for the Indians and 45%for other ethnic groups.
The second prong was to be achieved through the restructuring of employment, owner-ship of share capital in the corporate sector and the creation of a Bumiputera Commercialand Industrial Community (BCIC). The achievement of the second objective inevitablymeant expanding Bumiputera participation in the formal sectors. Bumiputera employmentin agriculture, secondary2 and tertiary sectors were 66·2%, 12·1% and 21·7% respectivelyin 1970 (see Table 2). The NEP aimed at restructuring these figures to 37·4% in agri-culture, 26·8% in secondary and 35·8% in tertiary sectors respectively in 1990.
When examined across ethnic groups, Bumiputeras contributed 67·6%, 30·8% and37·9% respectively to overall employment in agriculture and the secondary and tertiary
1 When launched in 1971, the NEP set targets only for Peninsular Malaysa.2 Includes mining, manufacturing, construction and utilities.
03 57-78 Rasiah 29/11/0 10:03 am Page 59
60 R. Rasiah and I. Shari
sectors in 1970. The NEP restructuring efforts when pursued to plan would have changedBumiputera participation to 61·4% for agriculture, 51·9% for secondary and 51·0% for thetertiary sectors respectively in 1990.
In corporate equity terms, Bumiputera, non-Bumiputera and foreign participation wasset at 30%, 40% and 30% respectively for 1990. It was 2·4%, 32·3% and 63·3% respect-ively in 1970. The remaining 2·0% was held by nominee companies. The specific targetswere defined only in 1976. Regulation became particularly strong in the primary andservice sectors (e.g., banking) (see Liow, 1986; Hing, 1987). Bumiputeras and Bumiputera-controlled companies began buying into plantations, mines and penetrating the media.Foreign capital was gradually displaced by Bumiputera trusts in several plantations.
While these quantitative targets are fairly clear, the NEP also emphasised the creationof a pool of Bumiputera entrepreneurs, so that their participation in corporate equity couldbe backed by managerial control. This qualitative target is interpreted in various ways:some look at it as merely the creation of a group of Bumiputera millionaires, while otherssee it as the creation of a dynamic class of efficient Bumiputera entrepreneurs. Since theachievement of the NEP targets required rapid growth, the OPP1 set specific growthtargets to be met by 1990. Average annual growth rate targets for GDP, private and publicinvestment, exports, imports, employment, savings and unemployment were set as shownin Table 3.
Tables 1–3 show that the government generally succeeded in achieving these targetsand, in many respects, over-achieving them. Poverty fell to 15·1% of households, dippingbelow the 16·7% set in the NEP for 1990. This was also the case with rural and urbanhouseholds (see Table 1). Income inequality dropped as well; the Gini coefficient fell
Table 1. Poverty eradication target and achievement, Malaysia, 1970, 1976 and 1990 (%)
Market, government and Malaysia’s new economic policy 61
from 0·513 in 1970 to 0·446 in 1990 (Malaysia, 1991, p. 9).1 Bumiputera participation inthe secondary and tertiary sectors expanded rapidly, reaching 30·5% and 40·5% respec-tively in 1990, compared with its target of 26·8% and 35·8% respectively. Bumiputeracorporate equity of 20·3% in 1990 is one of the rare cases that fell well below the target.Here again, the 46·2% figure for non-Bumiputeras out-achieved its target of 40% (seeTable 2). In addition, the savings and investment shares in GNP achieved in 1990 werewell above the targets. To explain these successes, the following section examines the roleplayed by the government in promoting growth and redistribution.
2.1 Growth promotionEconomic growth is characterised by a series of complex structural changes supported bydynamic and complementary investments (see Gerschenkron, 1962; Kaldor, 1979;Kornai, 1979; Pasinetti, 1981). Recent new growth theorists recognise the importance ofincreasing returns in the creation of dynamic comparative advantage (see Krugman,1980; Romer, 1986; Lucas, 1988). Hence, even if problems of information asymmetry,rigidities in resource mobility, specific attributes of learning experience and government-generated distortions are overcome, very risky investments (often associated with inno-vation and lumpiness) require some form of subsidy or protection. To use Schumpeter’s
1 The Gini coefficient as an indicator of income inequality shows higher inequality with figures closer to 1and lower inequality with figures closer to 0.
Table 2. Restructuring targets and achievements, Malaysia, 1970 and 1990
Note: aPeninsular Malaysia.bIncludes mining, manufacturing, construction, utilities and transport.cIncludes trust agencies and other related institutionsSource: Malaysia (1991, Tables 2–7).
03 57-78 Rasiah 29/11/0 10:03 am Page 61
62 R. Rasiah and I. Shari
(1987, ch. 8) words, under perfectly free trade conditions, there will be little incentive forinnovation as the ‘entrepreneurial profits’ or monopoly rent will vanish instantly.Investors will obviously expect higher returns if they are to be attracted to risky invest-ments, which require longer gestation periods.1 Participation in such ventures requiresdistorting relative prices. The history of industrial expansion in Germany, the US, Japan,South Korea and Taiwan lends support to this view (see Gerschenkron, 1962; Kaldor,1989; Amsden, 1989; Wade, 1991). However, Schumpeter (1987) also emphasised theneed for competition, which opens firms to the ‘gales of creative destruction’ to forcetechnical change. Hence, the market has a role to play but one that shares the allocativerole with other institutions and government.
The evidence does not support Sheperd’s (1980) claim that the import-substitution(IS) sector was distorted and hence sluggish, while the export-oriented (EO) sector waslargely market driven and therefore productive. If IS was prescribed by structural econo-mists such as Lewis (1955), Myrdal (1957) and Kaldor (1957) to spawn and develop localinfant industries for eventual international competition, the Malaysian government con-fined the use of incentives primarily to attracting foreign firms. The Malaysian experiencealso did not see IS as a means for export promotion.2 Foreign firms, from Singapore andBritain in particular, relocated ‘screwdriver’ operations to benefit from the high tariffsimposed on finished goods (see Edwards, 1975; Saham, 1980). As raw materials and
1 Schumpeter (1987, pp. 88–90) argued that new things need returns higher than the prevailing marketrates necessary to induce investment, which he referred to as entrepreneurial profits to attract capital tountried trials.
2 See Krugman (1980, 1989) for an analytical account of neoclassical tools used to demonstrate gains fromIS as a strategy for promoting exports.
Table 3. OPP1 Sectoral targets and achievements, Malaysia, 1970 and 1990 (%)
1970 Target 1990 Achieved 1990
Share in GDP (%)Agriculture 29·0 19·7 18·7Mining 13·7 2·6 9·7Manufacturing 13·9 26·2 27·0Construction 3·8 4·7 3·5Services 36·2 48·3 42·3Import duties less bank service charges 3·4 –1·5 –1·2Share in total employment (%)Agriculture 53·5 35·1 27·8Mining 2·6 1·5 0·6Manufacturing 8·7 16·8 19·5Construction 2·7 3·6 6·4Services 32·5 43·0 45·7Average annual real output Target AchievedGrowth rate 1971–90 (%) OPP1 OPP1Agriculture 5·4 4·4Mining 3·8 4·9Manufacturing 12·2 10·3Construction 8·3 6·4Services 8·5 7·6
Source: Malaysia (1991: Tables 2 and 3).
03 57-78 Rasiah 29/11/0 10:03 am Page 62
1 See Amsden (1989) for an account of the South Korean experience.2 See Jomo (1986) for a class account of the political economy of the ethnic redistribution-oriented NEP
introduced in 1971.3 The sugar processing industry with an effective rate of protection rate of around 600% in 1987 (see
Edwards, 1991) is one example where there appears no dynamic reasoning behind tariffs. The producersenjoyed a huge monopoly rent for over a decade.
Market, government and Malaysia’s new economic policy 63
intermediate goods generally faced low tariffs, IS firms enjoyed high effective protection.Most foreign firms that expanded operations during this phase had productive operationsabroad, which generally discouraged exports from Malaysia. Besides, pioneer statusincentives during the IS phase were only offered to IS firms. Thus, when the small domesticmarket became saturated by the mid-1960s, there appeared little demand-pull to stimu-late export expansion. Manufacturing’s contribution to gross domestic product (GDP) in1960 and 1965 thus stagnated at 9% (World Bank, 1980).
Although the high protection levels reduced competition in the IS phase, it was causedby misguided IS, rather than simply lack of competition. If the South Korean andTaiwanese states offered IS rents to infant firms in return for stringent performancestandards (Amsden, 1989; Wade, 1990; Chang, 1991), the Malaysian state offeredmonopoly rents to foreign and local firms irrespective of their productive capabilities andwithout performance conditions, i.e., the carrots were indiscriminately given without anystick.1 The state assumed a complementary role with the market and other intermediaryinstitutions to force technical change and efficiency improvements in Taiwan and SouthKorea. The South Korean and Taiwanese governments succeeded in creating dynamiccomparative advantage initially through IS, and later through a dual strategy of IS forexport promotion. The Malaysian state used none of these progressive tools, which couldhave been a consequence of the absence of economic nationalism, with the state being ledby the economically weak Malays as opposed to the Chinese or Indians.2
It is the lack of efficiency-enhancing intervention that plagued the IS sector in Malaysia.The general discouragement of domestic sales and purchases for firms enjoying FreeTrade Zone (FTZ) and Licensed Manufacturing Warehouse (LMW) status in the 1970sand much of the 1980s largely accounted for the lack of integration between the twosectors (see Rasiah, 1992). When rents associated with tariffs and incentives fell followingderegulation in the 1990s, local firms gradually shifted operations to the unproductiveproperty and real estate sectors (see Rasiah, 1998A). Hence, unlike South Korea andTaiwan, where the state intervened to promote dynamic comparative advantage, oftenintroducing IS for gradual EO, the Malaysian state appears to have launched misguidedIS policies.3
Following the shift to EO after 1968, IS gradually lost its significance in terms of outputand employment generation, although it continued to coexist alongside the former. TheIS sector fell in significance as tariffs on several IS industries also gradually fell, therebyreducing the distortionary rents enjoyed by these industries. For example, between 1969and 1987, the effective rate of protection (ERP) of basic industrial chemicals fell from160% to 16%, tobacco from 125% to –26%, fertilisers and insecticides from 300% to 8%,and structural metal products from 35% to 1% respectively (Edwards, 1991; see alsoTable 4). Hence, while EO firms continued to enjoy generous financial incentives, mostIS firms gradually lost tariff protection. However, some IS industries, especially thosesponsored by the government, experienced an increase in ERP; e.g., the ERP of basic ironand steel rose from 28% in 1969 to 131% in 1987. Although the nominal rate of protec-tion on several IS industries were gradually reduced in the 1980s, locally controlled
03 57-78 Rasiah 29/11/0 10:03 am Page 63
64R
. Rasiah
and
I. Sh
ari
Table 4. Protection and subsidies in manufacturing, Malaysia
ERP (%) Xi/Yi (%) % Projects approved with Incentives (1990)a Government special export incentives ownership
1987b 1990 (1986–90) Training R&D PS and ITA
Food 13c 21·7 57·5 W W M NBeverage and tobacco 5·1 31·3 W W W NTextiles and garments 10 85·7 74·2 M W S NWood 233 25·4 71·1 M M M NChemicals 57 19·6 45·4 M M M NRubber 20 9·4 95·5 M M S NNot-metal mineral products 86 24·6 46·6 M M M YIron and steel 131d 15·0 n.a. S M W YMetal 22e 60·4 54·9 W M M NMachinery 18 81·9 59·6 M M M NElectric/electronics –5 94·0 88·5 S M S NTransport equipment 230 41·9 22·9 S M W Y
Note: aFrom interviews with with MIDA officials in 1990; n.a., not available.bFrom Edwards (1991).cIncludes food, beverages and tobacco.dOf basic industries only (ERP of primary iron and steel was 447%).eOf wire and wire products; Xi, export of industry I; Yi, gross output of industry I; W, weak; M, moderate; S, strong; N, no; Y, yes.Source: Complied from MIDA, unpublished data; Edwards (1991); Malaysia, Industrial Surveys, various issues; Malaysia, External Trade Statistics, various years.
03 57-78 Rasiah 29/11/0 10:03 am Page 64
Market, government and Malaysia’s new economic policy 65
industries were still generally inward looking. Of the 12 industries shown in Table 4, morethan half the output demand of seven was still generated from the domestic economy.Only five were outward-oriented, with electrical goods and electronics, and textiles andgarments, being the most export-oriented.
The government launched the Heavy Industries Corporation of Malaysia (HICOM) in1981, and since then has intervened strongly to promote heavy industry in Malaysia.Government ownership became important in heavy industries from the 1980s as a con-sequence (see Table 4). The government offered subsidised capital, imposed stringentcontrols on competitors in the domestic market and introduced other promotional toolsto encourage the manufacture of cement (Kedah Cement and Perak Hanjoong), steel(Perwaja Steel) and cars (Proton). The government’s objectives here, inter alia, includedthe development of a strong capital goods sector and linkages with the domestic economy,especially involving Bumiputera enterprises. These industries remain strongly subsidisedand protected. Indeed, by controlling Proton’s purchases, the government has beengradually enforcing domestication of supply and Bumiputera participation through theumbrella concept of vendor development. However, the lack of performance standards,and of monitoring and appraisal mechanisms, has undermined the capacity of heavyindustries to compete in international markets. Rent dissipation has generated high costsfor downstream industries and consumers. Steel, clinker and its end-user product cement,and cars are still priced substantially higher than world prices, and maintained throughthe use of both quotas and duties (see Rasiah, 1998C).
Industrial policy focus shifted from IS to EO manufacturing in the late 1960s and 1970sand again from the mid-1980s periods.1 A costly IS sector that burdened the economyand the Plaza Accord of 1985 which pushed up the currencies of Japan, South Korea andTaiwan as well as the withdrawal of the Generalised System of Preferences from the AsianNIEs in 1988 influenced the shift. The Investment Incentives Act of 1968 first triggeredEO industrialisation in Malaysia. After 1972, the government opened FTZs2 and LMWs3
to ensure better police protection, coordination and control of export processing activitiesand incentives. Incentives were critical at least in the initial stages to match the risksinvolved in redeploying production in unproven and unstable foreign sites (see Table 4).Malaysia had faced serious ethnic bloodshed in 1969, which aggravated the risks ofrelocating production there. Lucrative incentives such as pioneer status (PS) and invest-ment tax credit (ITC) for a period of between five and ten years, became the main induce-ments for attracting EO firms. Whenever PS expired, firms were easily approved for ITCsfor additional periods of five years. Other firms still enjoyed accelerated depreciationallowances. Firms often opened new plants to enjoy a new round of incentives (seeRasiah, 1993C), and foreign firms have been allowed to retain total ownership. Also, thegovernment completely blocked unionisation in the electronics industry until 1989, and
1 EO was originally promoted by the World Bank, United Nations Industrial Development Organisation(UNIDO) and other international agencies, and the success of other East Asian export processing zones wereimportant external factors that influenced the switch (see Jomo, 1990).
2 Free Trade Zones (FTZs) (renamed as Industrial Free Zones since 1992) lie outside the principalcustoms area (PCA), thus goods imported to and exported from them are not liable for customs duty. Goodsimported from, and exported to the PCA are liable for customs duty unless exemptions have been granted bythe Treasury (Malaysia, 1988, p. 55). Generally, firms producing not less than 80% for export can apply tolocate in FTZs. Until the 1990s, FTZ firms were expected to import most of their inputs.
3 Licensed Manufacturing Warehouses (LMWs) were introduced to encourage industrial dispersal and toenable the location of factories producing generally entirely, but not less than 80%, for export. LMW status isgranted to firms sited in places where the location of FTZs are neither practical nor desirable (Malaysia, 1988,p. 56). Until the 1990s, LMW firms too were expected to import most of their inputs.
03 57-78 Rasiah 29/11/0 10:03 am Page 65
66 R. Rasiah and I. Shari
since then only allowed in-house unions under very restrictive conditions (Rasiah, 1996).Hence, though IS industries continued to enjoy high tariffs until the 1990s, financialincentives shifted towards EO firms from the late 1960s. Only state-sponsored heavyindustries continued to enjoy high tariffs and financial incentives from the 1980s in the ISsector.
As the aggregated industries data in Table 4 show, EO industries have enjoyed variousother government subsidies in training, exporting and R&D support activities. Althoughexport incentives that offer double deduction benefits on corporate tax are given to allexporting firms, the prime beneficiaries, given their scale of exports, have been EO indus-tries. Furthermore, EO firms also tended to make most use of the double deductionbenefits given for training, as well as for process and design research and development.Apart from resource-based industries (e.g., wood and rubber) and government controlledcar, steel and cement production firms, foreign firms were the major beneficiaries of train-ing and R&D incentives. In general, with the exception of state-sponsored heavy indus-tries, EO firms have gradually become more subsidised than IS firms.
It is small wonder that EO industries have expanded rapidly since the early 1970s. Theelectric/electronics industry, in particular, has become the most important manufacturingindustry in terms of fixed assets, employment, output and exports (see Table 5). EOindustries easily dominated exports, with electric/electronics and textile/garments togethercontributing more than 63% of overall manufacturing exports in 1990 (see Table 6). Withthe exception of wood, which faces heavy import tariffs and export restrictions on timber,and rubber, whose prime inputs are sourced mainly domestically, EO industries havedemonstrated greater improvement in trade balances. However, EO industries have alsoshowed higher import penetration ratios with no trend decline, reflecting fairly weak back-ward pecuniary linkages.
Since the introduction of the Industrial Master Plan (IMP) and the Promotion ofInvestment Act in 1986, efforts to deepen domestic participation and localisation took ona new dimension. As shown in Table 4, incentives for exports, training, and R&D wereoffered (see also Malaysia, 1992). Pioneer status and investment tax allowances wereextended to strategic firms. A 30% domestic content condition was added in 1991. If thegovernment merely tied EO incentives until the mid-1980s to firms meeting static employ-ment and investment targets, it has assumed a more pro-active stance since the secondhalf of the 1980s by adding technological and domestic content conditions. This strategyhas, inter alia, influenced EO transnationals, especially Japanese firms, to relocate theirsuppliers, including their own subsidiaries in Malaysia (see Rasiah, 1993A). In addition,apart from incentives to strategic industries, the 1990s also experienced a reduction in taxexemptions from 100% to 70%.
While it is true that global markets were the prime growth stimulant of manufacturing,subsidies through financial incentives raised returns sufficiently to at least offset theadditional risks involved in relocating in a more risky site. Incentives became less impor-tant over the later years, when Malaysia became a safe haven for export-processing activi-ties. Without denying the comparative advantage of foreign transnationals in accountingfor rapid export expansion, their efforts to redeploy production in Malaysia cannot beexplained just by cheap wages. Given the risks involved in large-scale production, firmsrelocating in Malaysia would have looked for returns significantly exceeding prevailinginterest rates. Thus, the subsidy element in infrastructural support services and tax exemp-tions cannot be written off as negligible, as suggested by Sheperd (1980, pp. 186–7). Theoffer of such subsidies distorted relative prices facing competing interests domestically
03 57-78 Rasiah 29/11/0 10:03 am Page 66
1 Apart from a handful of in-house unions, unions are still effectively banned in the electronics industry (seeRasiah, 1993C).
2 It is indeed strange for Sheperd (1980) to regard a 40% tax exemption (in addition to tariffless trade) asnot overwhelming.
3 See Wade (1991) and Chang (1993) for a critique of neoclassical arguments on using average incentivesin explaining policy neutrality.
Market, government and Malaysia’s new economic policy 67
and competing sites internationally. A strong state not only ensured political stability, andcollaboration in solving theft and other problems, but also bulldozed through policies thatwere clearly resented by workers’ representatives. Curbs on unions involving electronicsfirms obviously meant that capital enjoyed a significantly distorted hold on relative pricesfacing the factor market.1 Besides, tax exemptions in relative terms not only meant adirect subsidy (or monopoly rent) to firms enjoying them, 2 but also offered them thepotential for practising transfer pricing. Informal interviews with eight out of the 30 firmswho responded to a survey (enjoying such tax exemption) show that firms preferredrecording profits in tax havens to reducing tax at taxable sites. For example, a Germanfirm paid a 14% value added tax in Germany for profits recorded in Malaysia when itwould have paid a 56% corporate tax if the profits had been generated in the former. Suchan international distortion not only stimulates firms to locate production in low or no taxzones, but also to practise transfer pricing so that the tricks of under-pricing and over-pricing enable firms to record profits in low or no tax and tariff zones. FTZ firms alonegenerated more than 50% of manufactured exports for much of the 1970s and 1980s (seeRasiah, 1993C).
In addition, Sheperd (1980) and the World Bank (1993) imply that EO, being morecompetitive, is also more market oriented, and therefore less distortionary. The implicitassumption here seems to link competitiveness and efficiency with relative prices andpolicy neutrality.3 The structure of incentives used in Malaysia—EO or IS—has clearlybeen interventionist and has distorted relative prices. As has been argued above, both EOand IS have strong links with government policy. Given the significance of scale and com-petition, it is true that export-orientation tended to breed greater competitiveness thandoes import-substitution. Competitiveness depended not only on endogenous factorssuch as innovative ability, but also on exogenous factors such as the size of market, barriersto entry and the number of firms in the industry. Transnationals’ access to frontiertechnological and marketing support from their parent and subsidiary plants embedded indeveloped national innovation systems easily supported processing, assembly and testactivities in Malaysia. However, transnational firms had to be attracted to relocate pro-duction in Malaysia which, given the risks associated with underdeveloped sites, wasmade possible through the additional use of financial incentives and a pro-capital indus-trial relations environment.
Thus, it can be seen that both the IS and EO sectors faced considerable governmentintervention. The latter appeared more successful than the former, owing to the techno-logical capabilities and market access of transnational corporations. Misguided policiesrestricted efficiency improvements in the IS sector.
3. Redistribution efforts
This section examines the World Bank (1993) and Salleh and Meyanathan (1993) argu-ment that liberalisation from the mid-1980s helped improve distribution in Malaysia. Asthe World Bank (1993) noted, there is little correlation between higher growth and higher
03 57-78 Rasiah 29/11/0 10:03 am Page 67
68R
. Rasiah
and
I. Sh
ari
Table 5. Growth and composition of manufacturing industries, Malaysia, 1968–90 (%)
Note: Includes primary processing; excludes leather, furniture and fixtures, paper, printing, publishing, plastics, petroleum and coal products and othermanufactures; composition figures are for all manufacturing.
Source: Computed from Malaysia, Industrial Surveys, various issues.
03 57-78 Rasiah 29/11/0 10:03 am Page 69
70R
. Rasiah
and
I. Sh
ari
Table 6. Manufacturing trade indicators, Malaysia, 1968–90
Note: Manufacturing trade includes simple processing; Xi, exports of industry i; Mi, imports of industry i; Yi, output of industry i.Source: Rasiah (1995, ch. 5).
03 57-78 Rasiah 29/11/0 10:03 am Page 70
Market, government and Malaysia’s new economic policy 71
inequality and both the relationships differ with individual economies. However, what theWorld Bank failed to examine is the specific measures the state undertook to redresspoverty and inequality in the high-performing economies of Asia (see Rasiah et al., 1996).Why, for example, has income inequality in Latin America continued to widen when thatof East and Southeast Asia generally narrowed until liberalisation increased from the mid-1980s and 1990s. It is the specific forms of state intervention under specificconjunctural forces rather than the extent of liberalisation or regulation that explain sucha divergence.
As noted by the World Bank (1993), rapid manufacturing growth helped absorb womenand Malays into the modern labour market and in that way helped alleviate poverty andinequality. Increasing integration into the wage-based capitalist system has graduallyundermined the traditional sector, thereby reducing inter-ethnic labour market fragment-ation, as is clearly seen from the occupational restructuring that has occurred since 1970.Such an account, however, fails to recognise the forms of regulation the state adopted toensure this greater restructuring.
As part of the OPP1 plan, the government spent heavily in developing agriculturethrough irrigation and drainage systems from 1970. Clearly, world rice prices were signifi-cantly below domestic prices. Tariffs and quotas, and various farm subsidies were intro-duced to protect and subsidise rice farmers who traditionally supported the ruling UnitedMalays National Organisation (UMNO) party within the National Front. Against themore established estates (Salleh, 1989), the government launched smallholder cultivationof rubber and oil palm to expand Bumiputera participation. As in rice farming, inter alia,intervention in smallholder-based cash-crop farming took the form of price controls, andfarm and land subsidies. Government expenditure on poverty eradication and ruraldevelopment also rose substantially under the first three Malaysia Plans (see Table 7).This is important, as it had a direct bearing on the improvement of rural Malay incomes,thereby reducing overall poverty and inequality (see Table 8). Rubber acreage underspecial land schemes rose from 1,079 hectares in 1983 to 1,247 in 1987 (Ishak, 1998, p. Table 5). Oil palm output per hectare in special land schemes, which was substantiallylower than in the estates in the initial years, became roughly equal by the end of the 1980s.One land scheme even outperformed the estates in 1990. For example, the Federal LandDevelopment Authority (FELDA) and the Rural Industry and Smallholder DevelopmentAuthority (RISDA) achieved output per acre of 10·9 and 12·7 kilograms respectively in1983, compared with 15·9 kilograms achieved by estates. The average for special state-supported land schemes was only 8·7 kilograms in 1983. The comparable figures forFELDA, RISDA and estates in 1988 were 16·8, 16·0 and 18·1 kilograms, respectively.The overall average for special state-supported land schemes in 1988 was 17·7 kilograms.FELDA’s per acre output of 18·7 kilograms in 1990 exceeded the 18·5 kilograms recordedby estates.
The government also drew substantial participation from Bumiputeras into thebureaucracy, thereby expanding sharply their participation in services. As shown in Table9, public sector employment grew strongest in the 1970–81 period.1 The slower growthand hence, relative fall after 1981 is accounted for by both rationalisation and privatisa-tion. The absorption of large numbers of Bumiputeras into administration helped raisetheir urban employment and incomes. In addition, through regulation, the governmentalso helped raise Bumiputera participation in services and manufacturing. Although
1 This point is noted by the World Bank (1993, p. 269).
03 57-78 Rasiah 29/11/0 10:03 am Page 71
72 R. Rasiah and I. Shari
generally not enforced, the labour ministry (renamed as the human resource ministry)provides guidelines encouraging the employment of Bumiputeras, and firms enjoyingfinancial incentives tended to view this requirement quite seriously.1 Hence, though rapidgrowth offered the avenue for employment creation, the state visibly encroached into themarket to meet its NEP targets. Indeed, this role as the ‘Bumiputera protector’ seems tohave strengthened intra-ethnic solidarity amongst the Chinese (see Khong, 1991). It isbelieved that the Chinese, fearing increased ethnic encroachment into the market by thestate, started ethnic networks to protect their interests in the private sector, thus unitingeven the once clannishly divided Chinese. Inter-ethnic divisions seem more apparent atthe level of employees. Even in foreign multinationals, where the extent of governmentregulation has varied with its relative bargaining position vis-à-vis firms, the upper rungsof employment (e.g., professional and technical) are still dominated by the Chinese.
1 Based on interviews with 126 firms operating in the manufacturing sector.
Table 7. Allocation of development expenditure, Malaysia, 1971–90 (RM million)
Market, government and Malaysia’s new economic policy 73
Nevertheless, the trend towards absorbing Bumiputeras at least to recommended levels isevident. Interviews with 126 firms undertaken between 1986a d 1993 show that firms haveoffered special incentives to retain Bumiputera professionals.
Special institutions were also started to help expand Malay participation in the economy.The Majlis Amanah Rakyat (MARA), Bank Bumiputera Malaysia Berhad (BBMB) andPerbadanan Nasional (PERNAS) were given wider roles and access to capital to raise theposition of the Malays. Indeed, PERNAS attempted to wrest control of several foreign-owned plantations in the early 1970s, and MARA boosted Malay businesses and educa-tional achievement. In addition, the Industrial Coordination Act (ICA), promulgated in1975, imposed regulation for firms meeting a registration scale, which was RM250,000paid-up capital and 25-employee workforce initially (Hing, 1984).1 The Minister of Tradeand Industry generally required a 30% Bumiputera equity condition to be met for registra-tion. Foreign firms exporting over 80% of output were exempted from such conditions.Paid-up capital for registration was gradually raised to RM2·5 million in 1986.
The government also launched the Bumiputera Investment Foundation in 1978. Thisfoundation introduced the Permodalan Nasional Berhad (PNB) in the same year to helpexpand Bumiputera participation in business directly (Malaysia, 1981, 1991). A policy fortransferring equity from Bumiputera trustees to individuals and companies was launchedin 1981. Hence, institutions such as MARA, PERNAS and the State Economic Develop-ment Corporations (SEDCs) which had acted as trustees had their corporate equityownership gradually acquired by PNB and other Bumiputera enterprises and individuals.In 1985 alone, PNB spent RM6200 million on purchasing 158 firms. PNB shares in turnhave been sold to individual Bumiputeras through the Skim Amanah Negara unit and theAmanah Saham Nasional (ASN). By the end of 1988, PNB had successfully transferredfrom its ownership RM632 million worth of shares to ASN (see Seaward, 1986). UntilOctober 1988, 2·35 million of Bumiputeras had investments in ASN which comprised44·7% of the Bumiputeras eligible to invest (Malaysia, 1991). The distribution of sharesthrough the ASN in particular helped raise Bumiputera incomes, including the poor: house-holds (17·1%), farmers (16·5%) and labourers (16·2%) were the prime beneficiaries ofthis scheme in October 1988.
Another significant government instrument that enabled equity redistribution ethnicallywas the privatisation policy launched in 1983 (see Kassim, 1991). Apart from reducingthe government’s financial burden following the introduction of the austerity drive toovercome the burgeoning foreign debt, this policy also acted as an important platform forBumiputeras to extend their participation in business. Eight of the 14 projects privatised in the 1986–89 period went to Bumiputeras (Malaysia, 1991). The government not onlyoffered largely Bumiputeras ownership of businesses with monopolistic markets, but alsoallowed the participation of previously public employees as private employees. With regu-lations to control their operations, the government also ensured that Bumiputeras con-tinued to dominate their workforce after privatisation. Such transfers, inter alia, alsoaccounted for the sharp fall of public sector employment in total employment in the1980s. While it can be argued that a significant slice of privatisation initiatives dissipatedrents through unproductive crony relationships, it did not appear conspicuous, as therapid growth generated from export-manufacturing masked losses in consumer welfare.
Regulation to promote Bumiputera businesses also received a strong boost from thelaunching of government-sponsored heavy industries, i.e., cement (Kedah Cement and
1 The ICA was subsequently amended in 1979, 1985 and 1986; the ceiling for compulsory registration wasraised to RM2·5mn and a workforce of 75 employees in 1986.
03 57-78 Rasiah 29/11/0 10:03 am Page 73
74 R. Rasiah and I. Shari
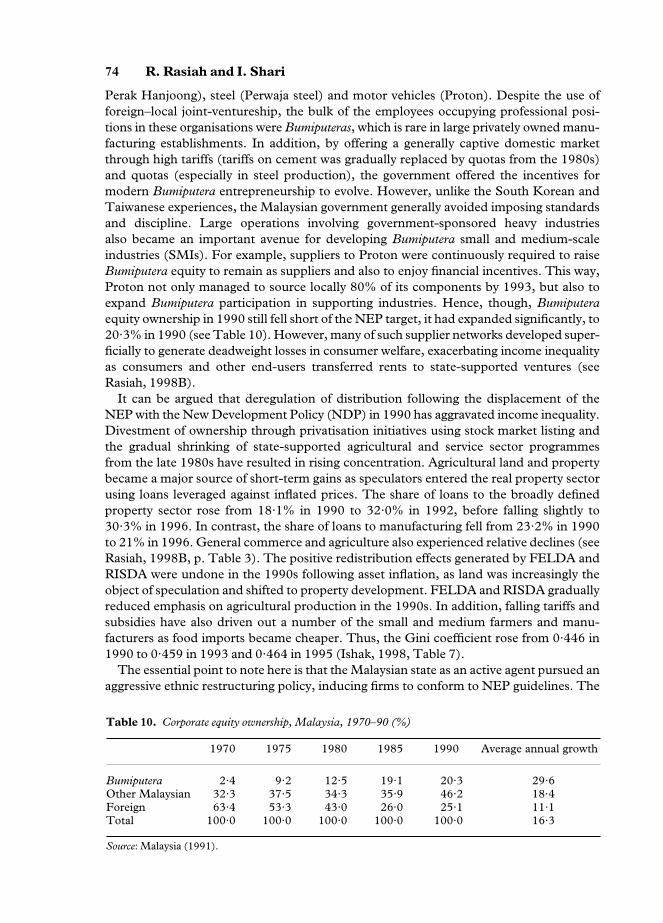
Perak Hanjoong), steel (Perwaja steel) and motor vehicles (Proton). Despite the use offoreign–local joint-ventureship, the bulk of the employees occupying professional posi-tions in these organisations were Bumiputeras, which is rare in large privately owned manu-facturing establishments. In addition, by offering a generally captive domestic marketthrough high tariffs (tariffs on cement was gradually replaced by quotas from the 1980s)and quotas (especially in steel production), the government offered the incentives formodern Bumiputera entrepreneurship to evolve. However, unlike the South Korean andTaiwanese experiences, the Malaysian government generally avoided imposing standardsand discipline. Large operations involving government-sponsored heavy industries also became an important avenue for developing Bumiputera small and medium-scaleindustries (SMIs). For example, suppliers to Proton were continuously required to raiseBumiputera equity to remain as suppliers and also to enjoy financial incentives. This way,Proton not only managed to source locally 80% of its components by 1993, but also toexpand Bumiputera participation in supporting industries. Hence, though, Bumiputeraequity ownership in 1990 still fell short of the NEP target, it had expanded significantly, to20·3% in 1990 (see Table 10). However, many of such supplier networks developed super-ficially to generate deadweight losses in consumer welfare, exacerbating income inequalityas consumers and other end-users transferred rents to state-supported ventures (seeRasiah, 1998B).
It can be argued that deregulation of distribution following the displacement of theNEP with the New Development Policy (NDP) in 1990 has aggravated income inequality.Divestment of ownership through privatisation initiatives using stock market listing andthe gradual shrinking of state-supported agricultural and service sector programmes from the late 1980s have resulted in rising concentration. Agricultural land and propertybecame a major source of short-term gains as speculators entered the real property sectorusing loans leveraged against inflated prices. The share of loans to the broadly definedproperty sector rose from 18·1% in 1990 to 32·0% in 1992, before falling slightly to30·3% in 1996. In contrast, the share of loans to manufacturing fell from 23·2% in 1990to 21% in 1996. General commerce and agriculture also experienced relative declines (seeRasiah, 1998B, p. Table 3). The positive redistribution effects generated by FELDA andRISDA were undone in the 1990s following asset inflation, as land was increasingly theobject of speculation and shifted to property development. FELDA and RISDA graduallyreduced emphasis on agricultural production in the 1990s. In addition, falling tariffs andsubsidies have also driven out a number of the small and medium farmers and manu-facturers as food imports became cheaper. Thus, the Gini coefficient rose from 0·446 in1990 to 0·459 in 1993 and 0·464 in 1995 (Ishak, 1998, Table 7).
The essential point to note here is that the Malaysian state as an active agent pursued anaggressive ethnic restructuring policy, inducing firms to conform to NEP guidelines. The
Table 10. Corporate equity ownership, Malaysia, 1970–90 (%)
Market, government and Malaysia’s new economic policy 75
latter were also achieved through direct state regulation of business contracts and employ-ment in public service. There was hardly any economic contest generated in the distri-bution of business contracts and employment of Bumiputera employees. The governmentmanaged to achieve a significant decrease in poverty and inequality during the NEP periodas a consequence of policies that targeted Bumiputeras specifically. Infrastructure, landschemes, farm subsidies, price controls employment policies helped improve Bumiputeraincomes during the period. However, eclectic and unproductive crony alliances alsosapped the economy. The politically well-connected from all ethnic groups have contin-ued to enjoy rents for long periods. Deregulation, which started from the mid 1980s,added to the worsening of distribution from the 1990s.
4. Conclusions
The Malaysian experience offers important lessons for policy. The NEP, however distres-sing it was to certain groups, was a conjunctural result of the socio-political and economicevents of the 1960s. Its implementation required the state to be actively involved in theeconomy. The IS sector which emerged prior to the NEP remained largely unproductive,as a consequence of misguided policies (see also Rasiah, 1998A). If IS was interventionist,so was the EO sector. The state distorted relative prices by exempting FTZ/LMW firmsfrom taxes and tariffs, and offered subsidised infrastructural support services. As produc-tion in the EO sector was geared towards the global market, foreign firms accessing theirinnovative resources from parent plants located in developed economies and facingalready established markets undertook large-scale export processing. Export expansioninevitably became the main growth stimulant in the manufacturing sector.
While ethnic-based distribution policies, especially those involving the promotion ofcrony interests, sapped the economy of rents, many critical instruments assisted povertyalleviation and distribution, which helped enhance political stability. The mixed experi-ence of Malaysia demonstrates the need to formulate effective industrial policies, takingcognisance of the market and the institutions necessary to ensure effective coordinationbetween firms, factor markets and product markets. Through preferential policies, thestate expanded Bumiputera employment in public services, and stimulated their greaterparticipation in manufacturing, thereby succeeding in its efforts to restructure the occu-pational identification of ethnicity, which was complemented by land schemes and thedistribution of shares among poor Bumiputera households. Thus, when intervention indistribution began to fall and divestment of privatised companies increased from the late1980s, distribution started to worsen. Its negative effects began to be felt a few years lateras income inequality has continued to rise since 1990.
While a mixed framework involving interventionist policies and market coordinationhad a bearing on growth, poverty alleviation and distribution, poorly coordinated plan-ning also generated substantial unproductive rent seeking. Access to carrots was hardlycountered by the discipline of the stick. The Malaysian state lacked the right institutionalframework to monitor and coordinate such rents to ensure their effective use. The presentframework supported by strong resource rents managed to attract foreign firms andspawn domestic firms through fairly good infrastructural support services and politicalstability. The lack of dynamic technology-deepening potential from such a framework hasblocked the country’s capacity to move beyond simple and original equipment manu-facturing activities to original design and brand activities. Rising production costs along-
03 57-78 Rasiah 29/11/0 10:03 am Page 75
76 R. Rasiah and I. Shari
side the emergence of more attractive cheap cost sites, such as China, and overheatingthreaten to stall further expansion.
References
Amsden, A. 1989. Asia’s Next Giant: South Korea and Late Industrialization, New York, OxfordUniversity Press
Balassa. B. 1982. Development Strategies in Semi-Industrial Economies, Baltimore, MD, Johns Hop-kins Press
Bhagwati. J. 1988. Protectionism, Cambridge, MA, MIT PressChandra, M. P. 1993. Political marginalization in Malaysia, pp. 211–36 in Sandhu, K. S. and Mani,
V. (eds), Indian Communities in Southeast Asia, Institute of East Asian StudiesChang, H. J. 1991. ‘Political Economy of Industrial Policy: Reflections on the Role of State Inter-
vention’, PhD Thesis, University of CambridgeChang, H. J. 1993. The political economy of industrial policy in Korea, Cambridge Journal of
Economics, vol. 17, 131–57Dervis, K, De Melo, J. and Robinson, S. 1982. General Equilibrium Models for Development Policy,
Cambridge, Cambridge University PressDeyo, F. (ed.) 1987. The Political Economy of the New Asian Industrialism, Ithaca, NY, Cornell
University PressEdwards, C. 1975. ‘Protection, Profits and Policy: Industrialisation in Malaysia’, PhD Thesis,
University of East Anglia, NorwichEdwards, C. 1991. ‘Protection in Malaysia’, mimeoEvans, P. 1987. Class, state and dependence in East Asia: lessons for Latin Americanists, in
Deyo, F. (ed.) 1987Gerschenkron, A. 1962. Economic Backwardness in Historical Perspective, Cambridge MA, HarvardHasan, P. 1980. Growth, structural change and social progress, in Young, K, Bussink, W. C. and
Hasan, P. (eds), Malaysia: Growth and Equity in a Multiracial Society, Baltimore, MD, WorldBank/Johns Hopkins University Press
Hing, A. Y. 1987. Financial system and industrial development in West Malaysia, Journal of Con-temporary Asia, vol. 17, no. 4, 409–35
Ishak, S. 1998. Economic growth and income inequality in malaysia, IKMAS Working Paper no. 16,Bangi, Universiti Kebangsaan Malaysia
Jomo, K. S. and Ishak, S. 1986. Development policies and income inequality in Peninsula Malaysia,Institute of Advanced Studies Monograph 1, Kuala Lumpur, Universiti Malaya
Jomo, K. S. 1986. A Question of Class, Singapore, Oxford University PressJomo, K. S. 1990. Growth and Structural Change in the Malaysian Economy, London, MacmillanKaldor, N. 1957. A model of economic growth, Economic Journal, vol. 67, 591–624Kaldor, N. 1979. Equilibrium theory and growth theory, pp. 273–91 in Boskin, M. J. (ed.), Economics
and Human Welfare: Essays in Honour of Tibor Scitovsky, New York, Academic PressKhong, H. L. 1991. ‘Service Sector in Malaysia: Structure and Change’, PhD Thesis, University of
CambridgeKornai, J. 1979. Appraisal of project appraisal, pp. 75–99 in Boskin, M. J. (ed.), Economics and Human
Welfare: Essays in Honour of Tibor Scitovsky, New York, Academic PressKrueger, A. 1974. The political economy of the rent-seeking society, American Economic Review, vol.
64, 291–303, JuneKrugman, P. 1980. Scale economies, product differentiation and the pattern of trade, American
Economic Review, vol. 70, 750–9Krugman, P. 1989. Import-protection as export promotion: international competition in the presence
of oligopoly and economies of scale, pp. 180–93 in Kierzkowski, H. (ed.), Monopolistic Com-petition and International Trade, Oxford, Clarendon Press
Krugman, P. and Helpman, E. 1989. Trade Policy and Market Structure, Cambridge, MA, MIT PressLall, S. 1996. Learning from the Tigers, London, MacmillanLewis, A. 1955. The Theory of Economic Growth, London, Allen & UnwinLim, D. 1992. The dynamics of economic policy-making: a study of Malaysian trade policies and
performance, pp. 94–114 in McIntyre, A. J. and Jayasuriya, K. (eds), The Dynamics of EconomicPolicy Reform in South-east Asia and the Southwest Pacific
03 57-78 Rasiah 29/11/0 10:03 am Page 76
Market, government and Malaysia’s new economic policy 77
Lim, M. H. 1975. Multinational corporations and development in Malaysia, Southeast Asian Journalof Social Sciences, vol. 4, no. 1, 22–45
Liow, W. K. 1986. Malaysia new economic policy and restructuring of commercial banks, KajianMalaysia, vol. 4, no. 1, 1–32
Luedde-Neurath, R. 1986. State Intervention and Export-oriented Development: A Reassessment of theSouth Korean Case, Boulder, CO, Westview Press
Little, I. 1982. Economic Development: Theory, Policy and International Relations, New York, BasicBooks
Lucas, R. E. 1988. On the mechanics of economic development, Journal of Monetary Economics, vol.22, 3–22
Malaysia 1968–90. Industrial Surveys, various years, Kuala Lumpur, Department of StatisticsMalaysia 1988. Investment in the Manufacturing Sector: Policies, Incentives and Procedures, Kuala
Lumpur, Malaysian Industrial Development AuthorityMalaysia 1991. The Second Outline Perspective Plan, 1991–2000, Kuala Lumpur, National Printing
DepartmentMalaysia 1992. Incentives and Guidelines for Malaysian Manufacturing, Kuala Lumpur, Malaysian
Industrial Development AuthorityMyrdal, G. 1957. Economic Theory and Underdeveloped Regions, New York, MethuenPassinetti, L. 1981. Structural Change and Economic Growth, Cambridge, Cambridge University
PressRanis, G. and Fei, J. C. H. 1975. A model of growth and employment in the open dualistic economy:
the cases of Korea and Taiwan, in Stewart, F. (ed.), Employment, Income Distribution and Develop-ment, London, Frank Cass
Rasiah, R. 1992. Foreign manufacturing investment in Malaysia, Economic Bulletin for Asia andPacific, vol. 63, no. 1, 63–77
Rasiah, R. 1993A. Competition and work in the textile and garment industries in Malaysia, Journalof Contemporary Asia, vol. 23, no. 1, 3–23
Rasiah, R. 1993B. Transnational Corporations and Backward Sourcing in the Electronics Industry: AStudy of Subcontracting Links with Local Suppliers in Malaysia, Bangkok, United Nations Economicand Social Commission for Asia and Pacific
Rasiah, R. 1993C. Free Trade Zones and industrial development in Malaysia, in Jomo, K. S. (ed.)Industrializing Malaysia: Policy, Performance and Prospects, London, Routledge
Rasiah, R. 1995. Foreign Capital and Industrialisation in Malaysia, London, MacmillanRasiah, R. 1996. Changing organisation of work in Malaysia’s electronics industry, Asia Pacific
Viewpoint, vol. 37, no. 1, 21–38Rasiah, R. 1998A. Export manufacturing experience of Indonesia, Malaysia and Thailand,
UNCTAD Discussion Paper no. 137, GenevaRasiah, R. 1998B. The Malaysian financial crisis: capital expansion, cronyism and contraction,
Journal of Asia Pacific Economy, vol. 3, no. 3, 358–78Rasiah, R. 1998C. Malaysia’s national innovation system, in Jomo, K. S. and Felker, G. (eds),
Industrial Technology Development in Malaysia: Policy Issues, London, RoutledgeRasiah, R. and Ishak, S. 1997. Malaysia’s New Economic Policy in retrospect, in Dahlan, H. M,
Hamzah, J., Hing, A. Y. and Ong, J. H. (eds), ASEAN in the Global System, Bangi, UniversitiKebangsaan Malaysia Press
Rasiah, R., Ishak, S. and Jomo, K. S. 1996. Globalization and liberalization and its implications forgrowth, poverty and inequality in East and Southeast Asia, in Woodfield, A. (ed.), Globalizationand Liberalization: Implications for Growth Poverty and Inequality, Geneva, UNCTAD
Romer, P. 1986. Increasing returns and long-run growth, Journal of Political Economy, vol. 94,1002–37
Saham, J. 1980. British Industrial Investment in Malaysia, 1963–71, Kuala Lumpur, Oxford Uni-versity Press
Salleh, H. 1989. Politik Pengeluaran Felda, Kajian Malaysia, vol. 7, no. 1/2, 1777–219Salleh, I. and Meyanathan, S. 1993. Malaysia: Growth, Equity and Structural Transformation,
Occasional Paper Series, Washington, DC, World BankSalleh, I. and Osman Rani, H. 1991. The Growth of the Public Sector in Malaysia, Kuala Lumpur,
Institute of Strategic and International StudiesSchumpeter, J. 1934. The Theory of Economic Development, Cambridge, MA, MIT PressSchumpeter, J. 1980. Capitalism, Socialism and Democracy, London, Unwin
03 57-78 Rasiah 29/11/0 10:03 am Page 77
78 R. Rasiah and I. Shari
Sheperd, G. 1980. Policies to promote industrial development, in Young, K., Bussink, W. C. andHasan, P. (eds), Malaysia, Growth and Equity in a Multiracial Society, Baltimore, MD, WorldBank/Johns Hopkins University Press
Snodgrass, D. 1980. Inequality and Economic Development in Malaysia, Kuala Lumpur, OxfordUniversity Press
UNIDO 1968–91. Industrial Statistics Yearbook, various years, Vienna: United Nations IndustrialDevelopment Organization
United Nations 1968–91. Yearbook of International Trade Statistics, various years, New York, UnitedNations
United Nations 1968–1991. National Accounts Statistics, various years, New York, United NationsWade, R. 1991. Governing the Market: Economic Theory and Role of Governments in East Asian Indus-
trialization, Princeton, NJ, Princeton University PressWorld Bank 1980. World Development Report, New York, World BankWorld Bank 1993. The East Asian Miracle: Economic Growth and Public Policy, New York, Oxford