www.angelbroking.com Market Outlook May 31, 2017 www.angelbroking.com Market Cues Indian markets are likely to open on Flat to negative note tracking the SGX Nifty and Global markets. U.S. stocks fell, snapping a long win streak as weakness emerged in the energy and banking sectors. Markets were in a cautious mood after data showed U.S. consumer confidence unexpectedly fell in May, the second consecutive monthly decline. The Conference Board's Consumer Confidence Index slipped to 117.9, down from 119.4 in April. Economists expected a reading in the neighborhood of 119.5. The Dow Jones Industrial Average lost 0.2%, at 21,029, as banks struggled. The S&P 500 index finished down 0.1%, at 2,413, and the Nasdaq Composite Index closed down 0.1%, at 6,203. U.K. stocks closed in the red, led lower in part by a slide for British Airways-parent International Consolidated Airlines Group SA following a computer glitch at the carrier over the holiday weekend. The FTSE 100 dropped 0.3% to end at 7,527. The Indian Equity benchmark hit record closing highs for the fourth day in a row on Tuesday, with hopes of timely arrival of monsoon rains and continued optimism on the GST front supporting underlying sentiment. The benchmark BSE Sensex closed higher 0.16% at 31,159 while the broader Nifty index rose 0.20% to 9,625. News Analysis Alkem Laboratories 4QFY17 result review Detailed analysis on Pg2 Investor’s Ready Reckoner Key Domestic & Global Indicators Stock Watch: Latest investment recommendations on 150+ stocks Refer Pg6 onwards Top Picks Company Sector Rating CMP (`) Target (`) Upside (%) Blue Star Capital Goods Buy 630 760 20.6 Dewan Housing Fin. Financials Buy 412 520 26.2 Mahindra Lifespace Real Estate Buy 427 522 22.3 Navkar Corporation Others Buy 207 265 27.8 KEI Industries Capital Goods Accumulate 211 239 12.8 More Top Picks on Pg4 Key Upcoming Events Date Region Event Description Previous Reading Consensus Expectations May 31, 2017 China PMI Manufacturing 51.20 51.00 May 31, 2017 Germany Unemployment change (000's) (15.00) (14.50) Jun 01, 2017 US Initial Jobless claims 234.00 238.00 Jun 01, 2017 US Change in Nonfarm payrolls 211.00 182.00 Jun 01, 2017 Germany PMI Manufacturing 59.40 59.40 Jun 02, 2017 UK PMI Manufacturing 57.30 56.50 More Events on Pg5 Domestic Indices Chg (%) (Pts) (Close) BSE Sensex 0.2 50 31,159 Nifty 0.2 20 9,625 Mid Cap 0.8 120 14,490 Small Cap 0.5 69 14,924 Bankex 0.6 156 26,403 Global Indices Chg (%) (Pts) (Close) Dow Jones (0.2) (51) 21,029 Nasdaq (0.1) (7) 6,203 FTSE (0.3) (21) 7,527 Nikkei (0.0) (5) 19,678 Hang Seng 0.2 62 25,702 Shanghai Com 0.1 2 3,110 Advances / Declines BSE NSE Advances 1,209 768 Declines 1,483 894 Unchanged 163 84 Volumes (` Cr) BSE 3,473 NSE 24,189 #Net Inflows (` Cr) Net Mtd Ytd FII (808) 8,997 51,009 MFs 449 8,960 29,642 Top Gainers Price (`) Chg (%) Auropharma 580 12.9 Indiacem 205 8.7 Sparc 294 7.0 Jpassociat 12 6.7 Jubilant 731 6.5 Top Losers Price (`) Chg (%) Bhel 140 (8.7) Mmtc 56 (5.6) Videoind 43 (4.9) Hexaware 236 (4.6) Aban 181 (4.6) #As on 30 th May 2017
Transcript
www.angelbroking.com
Market Outlook May 31, 2017
www.angelbroking.com
Market Cues
Indian markets are likely to open on Flat to negative note tracking the SGX Nifty and Global markets.
U.S. stocks fell, snapping a long win streak as weakness emerged in the energy and banking sectors. Markets were in a cautious mood after data showed U.S. consumer confidence unexpectedly fell in May, the second consecutive monthly decline. The Conference Board's Consumer Confidence Index slipped to 117.9, down from 119.4 in April. Economists expected a reading in the neighborhood of 119.5.
The Dow Jones Industrial Average lost 0.2%, at 21,029, as banks struggled. The S&P 500 index finished down 0.1%, at 2,413, and the Nasdaq Composite Index closed down 0.1%, at 6,203.
U.K. stocks closed in the red, led lower in part by a slide for British Airways-parent International Consolidated Airlines Group SA following a computer glitch at the carrier over the holiday weekend. The FTSE 100 dropped 0.3% to end at 7,527.
The Indian Equity benchmark hit record closing highs for the fourth day in a row on Tuesday, with hopes of timely arrival of monsoon rains and continued optimism on the GST front supporting underlying sentiment.
The benchmark BSE Sensex closed higher 0.16% at 31,159 while the broader Nifty index rose 0.20% to 9,625.
News Analysis Alkem Laboratories 4QFY17 result review Detailed analysis on Pg2
Investor’s Ready Reckoner
Key Domestic & Global Indicators
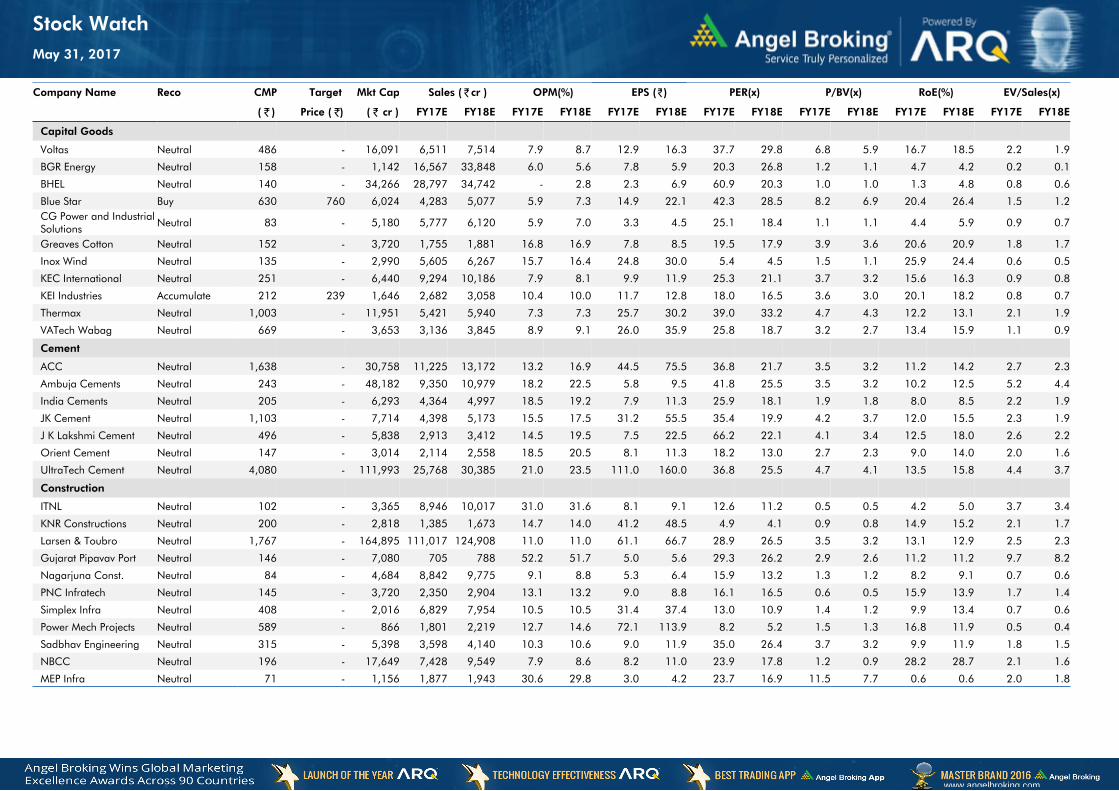
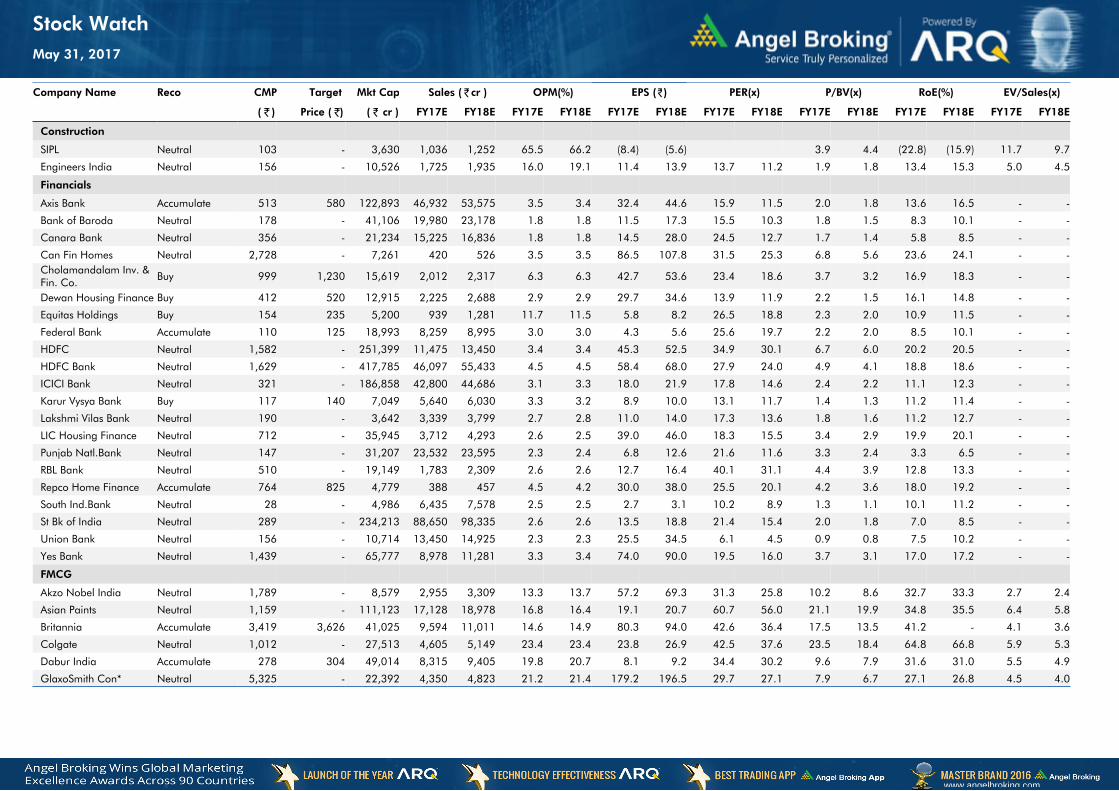
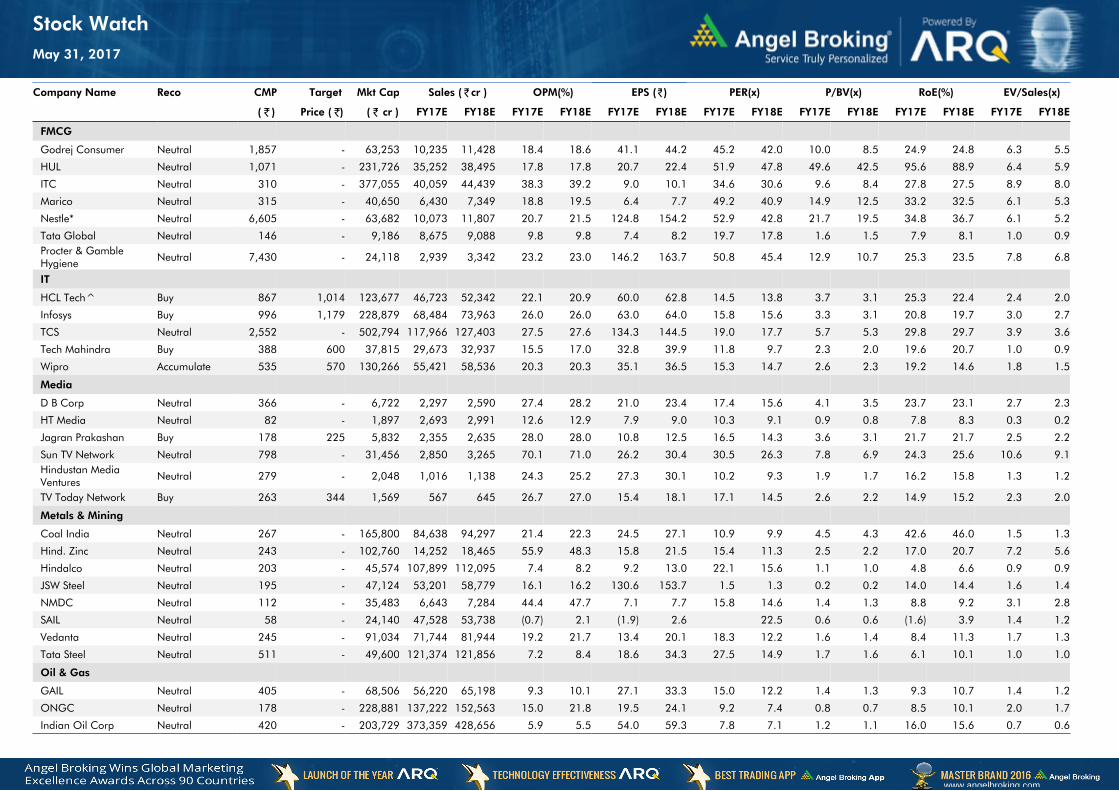
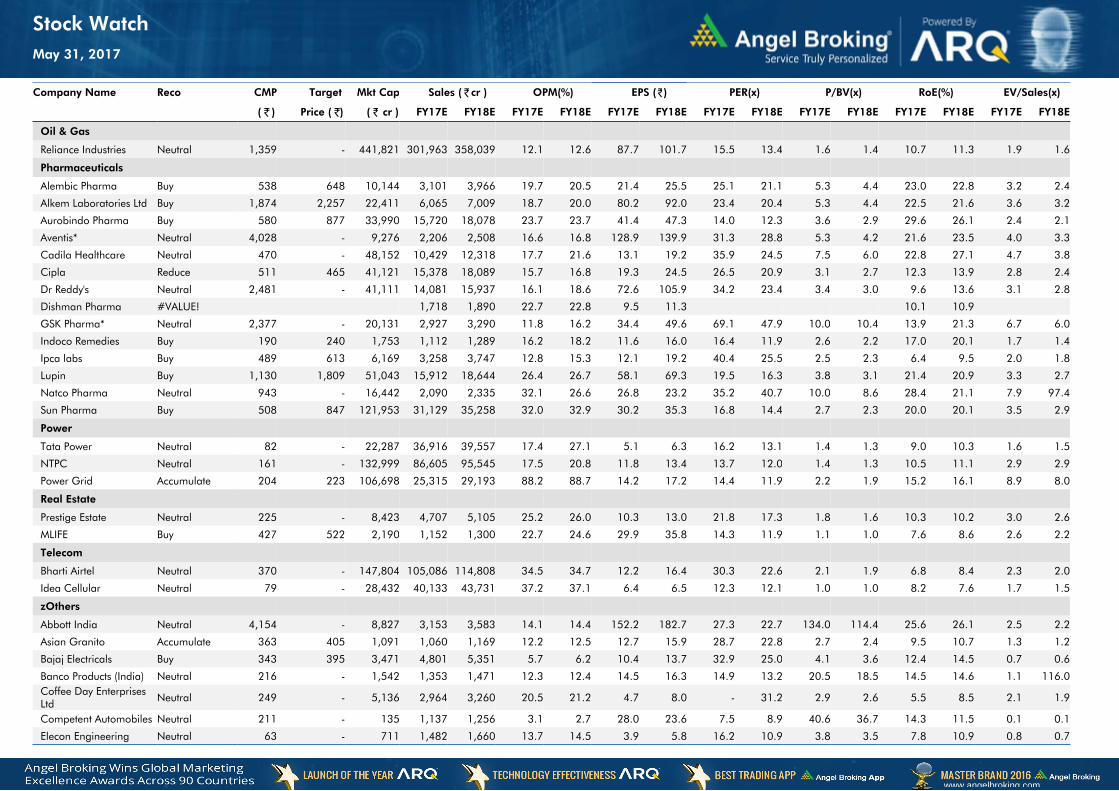
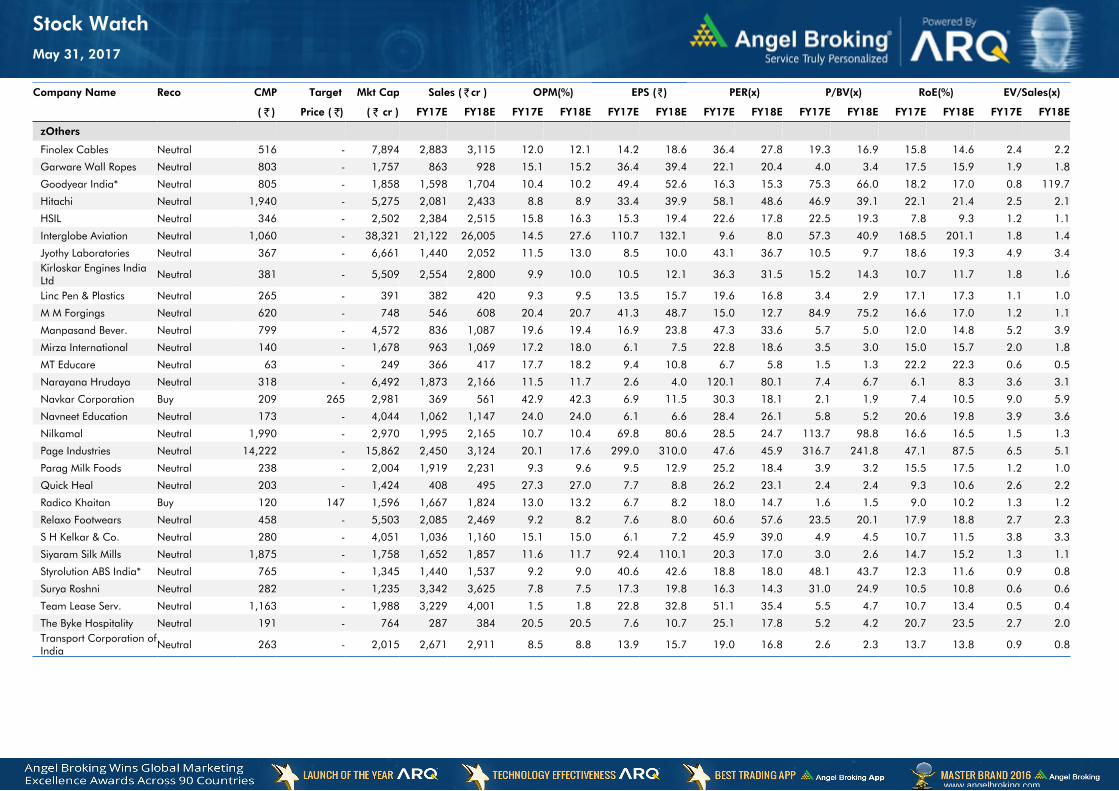
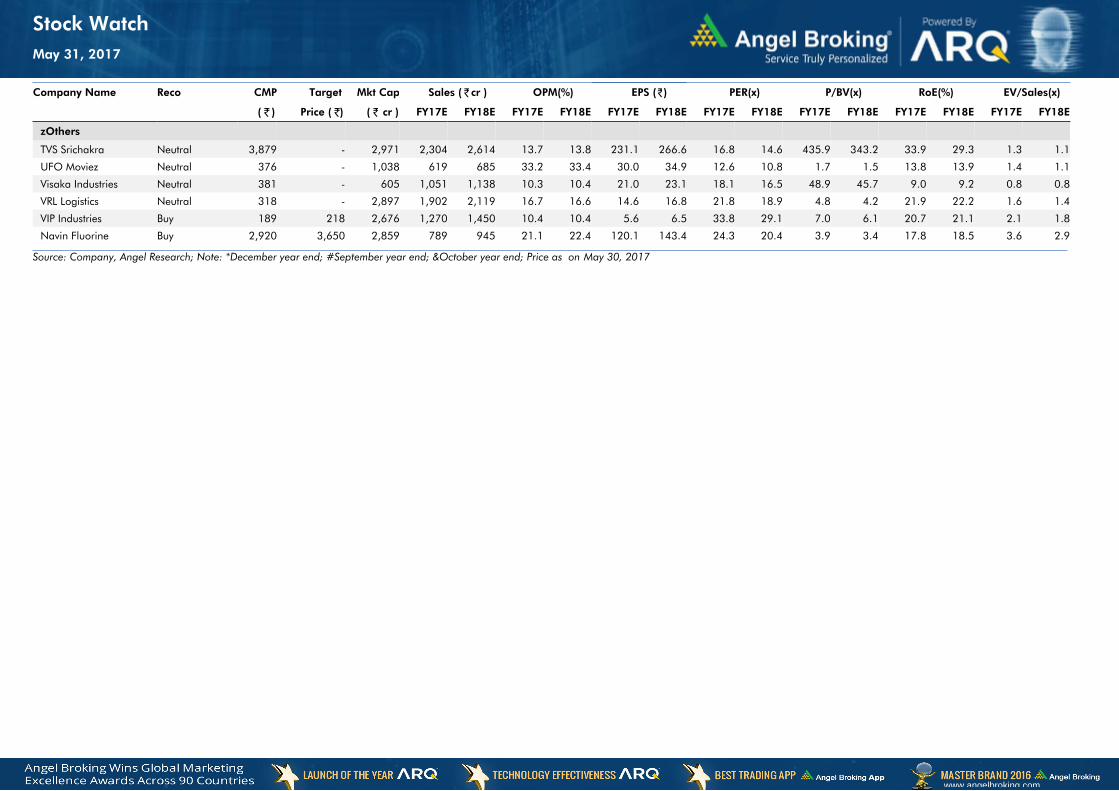
Stock Watch: Latest investment recommendations on 150+ stocks
Refer Pg6 onwards
Top Picks Company Sector Rating
CMP(`)
Target(`)
Upside (%)
Blue Star Capital Goods Buy 630 760 20.6
Dewan Housing Fin. Financials Buy 412 520 26.2
Mahindra Lifespace Real Estate Buy 427 522 22.3
Navkar Corporation Others Buy 207 265 27.8
KEI Industries Capital Goods Accumulate 211 239 12.8 More Top Picks on Pg4
Key Upcoming Events Date Region Event Description
PreviousReading
Consensus Expectations
May 31, 2017 China PMI Manufacturing 51.20 51.00
May 31, 2017 Germany Unemployment change (000's) (15.00) (14.50)
Jun 01, 2017 US Initial Jobless claims 234.00 238.00
Jun 01, 2017 US Change in Nonfarm payrolls 211.00 182.00
Jun 01, 2017 Germany PMI Manufacturing 59.40 59.40
Jun 02, 2017 UK PMI Manufacturing 57.30 56.50 More Events on Pg5
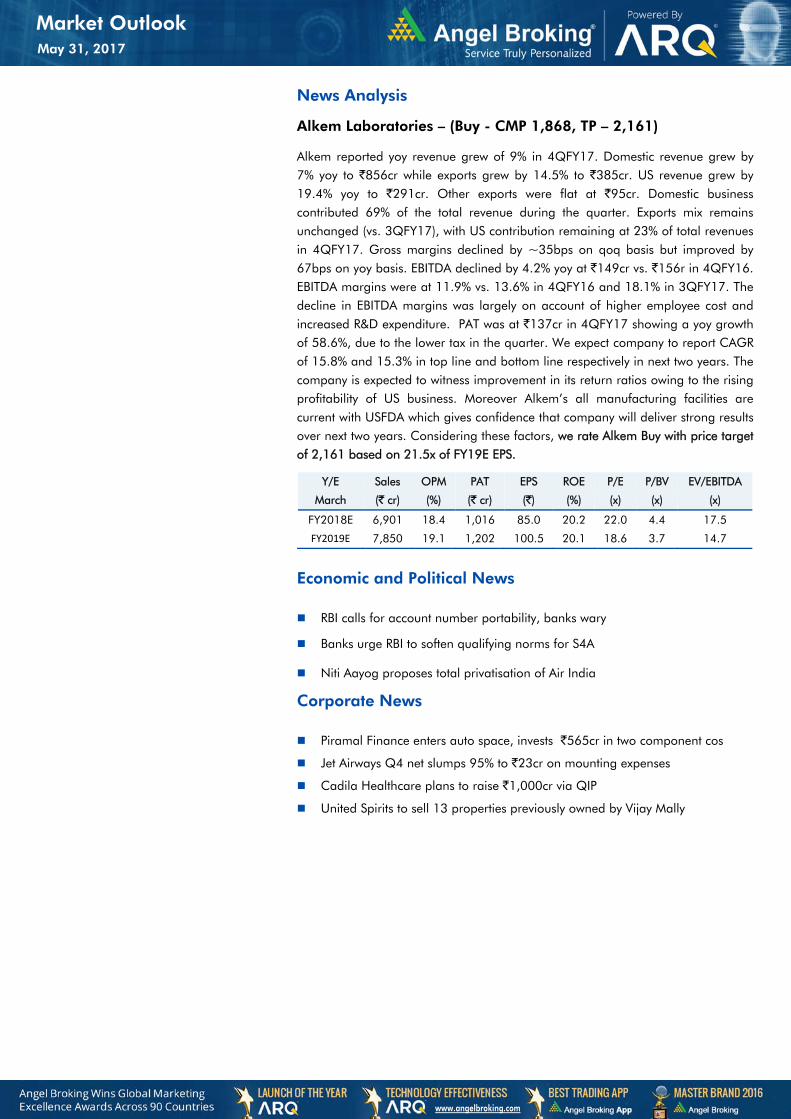
Alkem reported yoy revenue grew of 9% in 4QFY17. Domestic revenue grew by 7% yoy to `856cr while exports grew by 14.5% to `385cr. US revenue grew by 19.4% yoy to `291cr. Other exports were flat at `95cr. Domestic business contributed 69% of the total revenue during the quarter. Exports mix remains unchanged (vs. 3QFY17), with US contribution remaining at 23% of total revenues in 4QFY17. Gross margins declined by ~35bps on qoq basis but improved by 67bps on yoy basis. EBITDA declined by 4.2% yoy at `149cr vs. `156r in 4QFY16. EBITDA margins were at 11.9% vs. 13.6% in 4QFY16 and 18.1% in 3QFY17. The decline in EBITDA margins was largely on account of higher employee cost and increased R&D expenditure. PAT was at `137cr in 4QFY17 showing a yoy growth of 58.6%, due to the lower tax in the quarter. We expect company to report CAGR of 15.8% and 15.3% in top line and bottom line respectively in next two years. The company is expected to witness improvement in its return ratios owing to the rising profitability of US business. Moreover Alkem’s all manufacturing facilities are current with USFDA which gives confidence that company will deliver strong results over next two years. Considering these factors, we rate Alkem Buy with price target of 2,161 based on 21.5x of FY19E EPS.
Y/E Sales OPM PAT EPS ROE P/E P/BV EV/EBITDA
March (` cr) (%) (` cr) (`) (%) (x) (x) (x)
FY2018E 6,901 18.4 1,016 85.0 20.2 22.0 4.4 17.5
FY2019E 7,850 19.1 1,202 100.5 20.1 18.6 3.7 14.7
Economic and Political News
RBI calls for account number portability, banks wary
Banks urge RBI to soften qualifying norms for S4A
Niti Aayog proposes total privatisation of Air India
Corporate News Piramal Finance enters auto space, invests `565cr in two component cos
Jet Airways Q4 net slumps 95% to `23cr on mounting expenses
Cadila Healthcare plans to raise `1,000cr via QIP
United Spirits to sell 13 properties previously owned by Vijay Mally
www.angelbroking.com
Market Outlook May 31, 2017
www.angelbroking.com
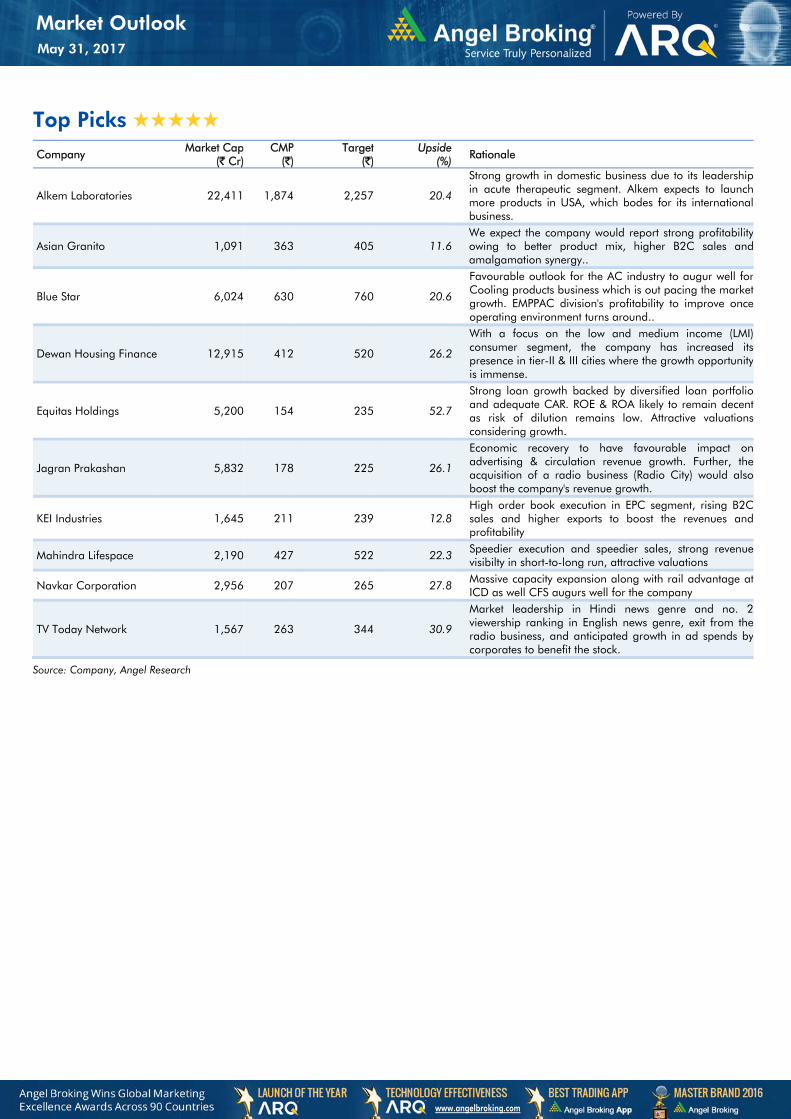
Top Picks ★★★★★ Company
Market Cap(` Cr)
CMP (`)
Target(`)
Upside (%)
Rationale
Alkem Laboratories 22,411 1,874 2,257 20.4
Strong growth in domestic business due to its leadershipin acute therapeutic segment. Alkem expects to launch more products in USA, which bodes for its international business.
Asian Granito 1,091 363 405 11.6 We expect the company would report strong profitabilityowing to better product mix, higher B2C sales and amalgamation synergy..
Blue Star 6,024 630 760 20.6
Favourable outlook for the AC industry to augur well forCooling products business which is out pacing the marketgrowth. EMPPAC division's profitability to improve onceoperating environment turns around..
Dewan Housing Finance 12,915 412 520 26.2
With a focus on the low and medium income (LMI)consumer segment, the company has increased itspresence in tier-II & III cities where the growth opportunityis immense.
Equitas Holdings 5,200 154 235 52.7
Strong loan growth backed by diversified loan portfolioand adequate CAR. ROE & ROA likely to remain decentas risk of dilution remains low. Attractive valuationsconsidering growth.
Jagran Prakashan 5,832 178 225 26.1
Economic recovery to have favourable impact onadvertising & circulation revenue growth. Further, theacquisition of a radio business (Radio City) would alsoboost the company's revenue growth.
KEI Industries 1,645 211 239 12.8 High order book execution in EPC segment, rising B2Csales and higher exports to boost the revenues andprofitability
Mahindra Lifespace 2,190 427 522 22.3 Speedier execution and speedier sales, strong revenuevisibilty in short-to-long run, attractive valuations
Navkar Corporation 2,956 207 265 27.8 Massive capacity expansion along with rail advantage atICD as well CFS augurs well for the company
TV Today Network 1,567 263 344 30.9
Market leadership in Hindi news genre and no. 2viewership ranking in English news genre, exit from theradio business, and anticipated growth in ad spends bycorporates to benefit the stock.
Source: Company, Angel Research
www.angelbroking.com
Market Outlook May 31, 2017
www.angelbroking.com
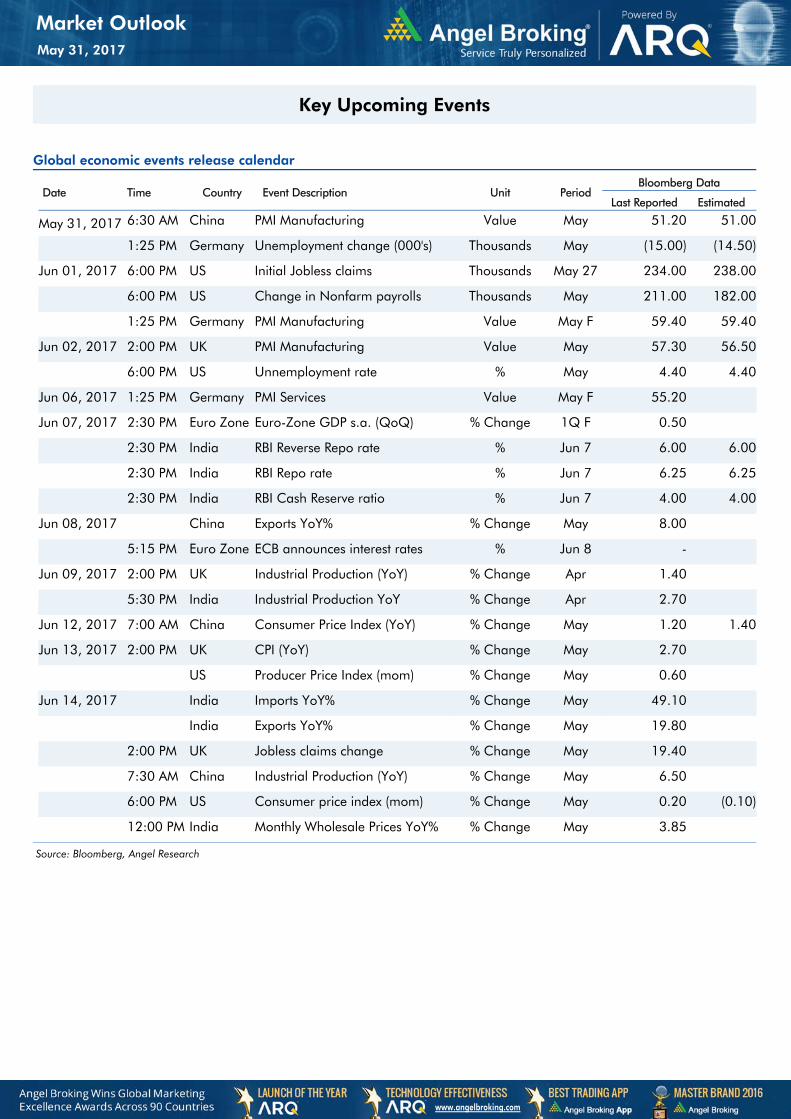
Key Upcoming Events
Global economic events release calendar
Date Time Country Event Description Unit Period Bloomberg Data
Last Reported Estimated
May 31, 2017 6:30 AM China PMI Manufacturing Value May 51.20 51.00
1:25 PM Germany Unemployment change (000's) Thousands May (15.00) (14.50)
Jun 01, 2017 6:00 PM US Initial Jobless claims Thousands May 27 234.00 238.00
6:00 PM US Change in Nonfarm payrolls Thousands May 211.00 182.00
1:25 PM Germany PMI Manufacturing Value May F 59.40 59.40
Jun 02, 2017 2:00 PM UK PMI Manufacturing Value May 57.30 56.50
6:00 PM US Unnemployment rate % May 4.40 4.40
Jun 06, 2017 1:25 PM Germany PMI Services Value May F 55.20
Jun 07, 2017 2:30 PM Euro Zone Euro-Zone GDP s.a. (QoQ) % Change 1Q F 0.50
2:30 PM India RBI Reverse Repo rate % Jun 7 6.00 6.00
2:30 PM India RBI Repo rate % Jun 7 6.25 6.25
2:30 PM India RBI Cash Reserve ratio % Jun 7 4.00 4.00
Jun 08, 2017
China Exports YoY% % Change May 8.00
5:15 PM Euro Zone ECB announces interest rates % Jun 8 -
Jun 09, 2017 2:00 PM UK Industrial Production (YoY) % Change Apr 1.40
5:30 PM India Industrial Production YoY % Change Apr 2.70
Jun 12, 2017 7:00 AM China Consumer Price Index (YoY) % Change May 1.20 1.40
Jun 13, 2017 2:00 PM UK CPI (YoY) % Change May 2.70
US Producer Price Index (mom) % Change May 0.60
Jun 14, 2017
India Imports YoY% % Change May 49.10
India Exports YoY% % Change May 19.80
2:00 PM UK Jobless claims change % Change May 19.40
7:30 AM China Industrial Production (YoY) % Change May 6.50
6:00 PM US Consumer price index (mom) % Change May 0.20 (0.10)
12:00 PM India Monthly Wholesale Prices YoY% % Change May 3.85
Source: Company, Angel Research; Note: *December year end; #September year end; &October year end; Price as on May 30, 2017
www.angelbroking.com
Stock WatchMay 31, 2017
Research Team Tel: 022 - 39357800 E-mail: [email protected] Website: www.angelbroking.com
DISCLAIMER
Angel Broking Private Limited (hereinafter referred to as “Angel”) is a registered Member of National Stock Exchange of India Limited,Bombay Stock Exchange Limited and Metropolitan Stock Exchange Limited. It is also registered as a Depository Participant with CDSL and Portfolio Manager with SEBI. It also has registration with AMFI as a Mutual Fund Distributor. Angel Broking Private Limited is a registered entity with SEBI for Research Analyst in terms of SEBI (Research Analyst) Regulations, 2014 vide registration number INH000000164. Angel or its associates has not been debarred/ suspended by SEBI or any other regulatory authority for accessing /dealing in securities Market. Angel or its associates/analyst has not received any compensation / managed or co-managed public offering of securities of the company covered by Analyst during the past twelve months.
This document is solely for the personal information of the recipient, and must not be singularly used as the basis of any investmentdecision. Nothing in this document should be construed as investment or financial advice. Each recipient of this document should make such investigations as they deem necessary to arrive at an independent evaluation of an investment in the securities of the companies referred to in this document (including the merits and risks involved), and should consult their own advisors to determine the merits and risks of such an investment.
Reports based on technical and derivative analysis center on studying charts of a stock's price movement, outstanding positions andtrading volume, as opposed to focusing on a company's fundamentals and, as such, may not match with a report on a company'sfundamentals. Investors are advised to refer the Fundamental and Technical Research Reports available on our website to evaluate the contrary view, if any.
The information in this document has been printed on the basis of publicly available information, internal data and other reliablesources believed to be true, but we do not represent that it is accurate or complete and it should not be relied on as such, as thisdocument is for general guidance only. Angel Broking Pvt. Limited or any of its affiliates/ group companies shall not be in any wayresponsible for any loss or damage that may arise to any person from any inadvertent error in the information contained in this report.Angel Broking Pvt. Limited has not independently verified all the information contained within this document. Accordingly, we cannottestify, nor make any representation or warranty, express or implied, to the accuracy, contents or data contained within this document.While Angel Broking Pvt. Limited endeavors to update on a reasonable basis the information discussed in this material, there may beregulatory, compliance, or other reasons that prevent us from doing so.
This document is being supplied to you solely for your information, and its contents, information or data may not be reproduced,redistributed or passed on, directly or indirectly.
Neither Angel Broking Pvt. Limited, nor its directors, employees or affiliates shall be liable for any loss or damage that may arise fromor in connection with the use of this information.