www.theicct.org MAY 2017 WHITE PAPER [email protected]MARKET PENETRATION OF FUEL- EFFICIENCY TECHNOLOGIES FOR HEAVY-DUTY VEHICLES IN THE EUROPEAN UNION, THE UNITED STATES, AND CHINA Felipe Rodríguez, Rachel Muncrief, Oscar Delgado, and Chelsea Baldino BEIJING | BERLIN | BRUSSELS | SAN FRANCISCO | WASHINGTON
MARKET PENETRATION OF FUEL-EFFICIENCY TECHNOLOGIES FOR HEAVY-DUTY VEHICLES IN THE EUROPEAN UNION, THE UNITED STATES, AND CHINAFelipe Rodríguez, Rachel Muncrief, Oscar Delgado, and Chelsea Baldino
BEIJING | BERLIN | BRUSSELS | SAN FRANCISCO | WASHINGTON
ACKNOWLEDGMENTS
This work was generously funded by the European Climate Foundation. The authors are grateful for this and other funding sources, which allow us to fulfill our mission of improving the environmental performance of vehicles in the transport sector. The authors thank Alex Woodrow (KGP) and Peter Mock (ICCT) for their constructive feedback and contributions during the reviewing process of this report.
International Council on Clean Transportation EuropeNeue Promenade 6, 10178 Berlin+49 (30) 847129-102
As the global demand for freight transport continues to grow, improving the efficiency of on-road freight vehicles is an increasingly important step to mitigate the resulting climate impacts, reduce energy dependence, and improve industry competitiveness. The fuel efficiency of new vehicles can be improved by using advanced technologies that work to reduce the load on the engine and more effectively convert fuel energy to power. Globally, there are many efficiency technologies designed for on-road freight vehicles at various stages of development and commercialization. For those technologies offered commercially in one or more markets, there is a wide range of market adoption rates.
This study investigates the market adoption trends of 27 heavy-duty vehicle technologies in the European Union (EU), the United States, and China. This study presents 20 years of technology market penetration data obtained from Knibb, Gormezano & Partners (KGP), supplemented with data from other sources, and analyzes the trends in selected technology adoption on tractor-trailers and rigid trucks in the world’s three largest automotive markets. The individual potential for each technology to improve fuel efficiency in those markets is also determined through a combination of literature review and vehicle simulation modeling. Finally, a handful of near-commercial technologies are summarized and discussed.
Figure ES-1 illustrates the market penetration of the technologies considered in this study for the EU, U.S., and Chinese markets and for the tractor-trailer and rigid truck vehicle segments. Not all technologies are equally applicable to both vehicle segments and all three markets. Technologies have been grouped into six categories: engine, transmission, road load, auxiliaries, aftertreatment, and energy management. For 10 of the technologies considered in this study, the European Union has the highest penetration rate of the three markets, followed by the United States, which has the highest penetration rate in nine of the technologies. China has the highest penetration rate of only one of the technologies evaluated in this study, natural gas engines for tractor-trailers. Of the technologies considered, the highest market penetration rates were found for those related to pollutant emissions control regulation, including selective catalytic reduction systems, diesel particulate filters, common rail injection, and advanced turbocharging. For the tractor-trailer market in the European Union, 11 of the 17 relevant technologies included in this study give 1% or greater fuel consumption reduction and have a market adoption rate at or below 50%. On average, these technologies have been available on the market for more than nine years. For the United States and China, there are 14 and 13 such technologies, respectively.
The findings from this work indicate that there is potential for short-term improvement of the overall efficiency of the heavy-duty vehicle fleet in the European Union, the United States, and China, by increasing the market adoption of existing, commercialized technologies. The findings also suggest that, in general, market forces on their own are not enough to facilitate rapid and full market adoption of efficiency technologies. In addition, the study identifies near-commercialized technologies that will be available in select markets in the 2025–2030 time frame.
III
MARKET PENETRATION OF FUEL-EFFICIENCY TECHNOLOGIES FOR HDVS
Figure ES-1. Penetration of selected heavy-duty vehicle technologies in 2015 in the EU, U.S., and China.
Tractor-trailers
Technology penetration in new vehicles 2015 (%)
Rigid trucks
USEU China
Common rail< 1995 < 1995
< 1995< 1995
< 1995
< 1995
1995
1995
< 1995
< 1995
2004
2005
2004
2015 20152002
20042002
2010
2010
2006
0 20 40 60 80 100 0 20 40 60 80 100
0 20 40 60 80 100 0 20 40 60 80 100
Automatedmanual transmission
Dual-clutchtransmission
Automatictransmission
Active grilleshutter
Side skirts
Clutched aircompressor
Single wide tires
Variable speed fan
On-demand pumps
Selectivecatalytic reduction (SCR)
Stop/start
Adaptive cruisecontrol
Predictive cruisecontrol
Diesel particulate filter (DPF)
High efficiency SCR
Tire pressuremonitoring
Engine
Transmission
Road load
Auxiliaries
Aftertreatment
Energymanagement
Advancedturbocharger
Turbocompound
Variable valveactuation
< 1995
2002
2000
20002000
2007
20062011
2013
2006
2009
20092009
2006
2008
20122013
2006
20132013
2012
2010
2013
2014
2014
20142014
2011
20142014
2008
Number next to bar corresponds to the year the technology was introduced to the market.
2006
2013
2013
N/A
N/A
N/A
N/A
N/A
N/A
20102004
20052010
20112010
2012
2009
2012
2011
IV
ICCT WHITE PAPER
LIST OF FIGURES
Figure ES-1. Penetration of selected heavy-duty vehicle technologies in 2015 in the EU, U.S., and China ................................................................................................................................................ III
Figure 1. Common rail market penetration in HDVs for the EU, U.S., and China (high confidence) ............................................................................................................................................4
Figure 2. Advanced turbocharging market penetration in HDVs for the EU, U.S., and China (high confidence) ......................................................................................................................6
Figure 3. Turbocompounding penetration in the tractor-trailer segment in the EU, U.S., and China (high confidence) ............................................................................................................ 8
Figure 4. Market penetration of HD natural gas powertrains for the EU, U.S., and China (high confidence) .................................................................................................................... 10
Figure 5. Market penetration of different transmission types in the EU (high confidence) ...........................................................................................................................................12
Figure 6. Market penetration of different transmission types in the U.S. (high confidence) ...........................................................................................................................................12
Figure 7. Market penetration of different transmission types in China (high confidence) ...........................................................................................................................................13
Figure 8. Active grille shutter penetration in HDVs for the EU, U.S., and China (medium confidence) ...................................................................................................................................15
Figure 9. Trailer side skirts penetration for the EU, U.S., and China (medium confidence) ...................................................................................................................................17
Figure 10. Single wide tire penetration in tractor trucks for the EU, U.S., and China (medium confidence) ...................................................................................................................................18
Figure 11. Tire pressure monitoring penetration in HDVs for the EU, U.S., and China (low confidence) ............................................................................................................................................19
Figure 12. Clutched air compressors market penetration in the EU, U.S., and China (medium confidence) ...................................................................................................................................21
Figure 13. Variable speed fans market penetration in HDVs in the EU, U.S., and China (low confidence) ...........................................................................................................................................22
Figure 14. NOx and PM emission limits for new type approvals in the EU, U.S., and China .........................................................................................................................................................24
Figure 15. Selective catalytic reduction market penetration in HDVs in the EU, U.S., and China (high confidence) ....................................................................................................................25
Figure 16. Diesel particulate filter market penetration in HDVs in the EU, U.S., and China (high confidence) ....................................................................................................................27
Figure 17. Stop/start market penetration in rigid trucks in the EU, U.S., and China (high confidence) ..........................................................................................................................................29
Figure 18. APU market penetration in tractor-trailers in the EU, U.S., and China (medium confidence) ................................................................................................................................. 30
V
MARKET PENETRATION OF FUEL-EFFICIENCY TECHNOLOGIES FOR HDVS
Figure 19. Off-board power market penetration in tractor-trailers in the EU, U.S., and China (medium confidence) ..............................................................................................................31
Figure 20. Adaptive and predictive cruise control market penetration in tractor-trailers in the EU, U.S., and China (medium confidence) ................................................32
Figure 22. Schematic of waste heat recovery system using an organic Rankine cycle ....38
Figure 23. Penetration rate and potential of tractor-trailer technologies in the EU ...........41
Figure 24. Penetration rate and potential of rigid truck technologies in the EU .................41
Figure 25. Penetration rate and potential of HDV technologies in the United States .......42
Figure 26. Penetration rate and potential of HDV technologies in China ............................. 43
LIST OF TABLES
Table 1. Overview of the main energy loss mechanisms .................................................................. 1
Table 2. Summary of road load forces ................................................................................................. 14
Table 3. Predictive cruise control systems by manufacturer .......................................................33
Table 4. Hybrid trucks offered by OEMs in the past 10 years .....................................................36
VI
ICCT WHITE PAPER
ABBREVIATIONS
ACC Adaptive cruise control
AMT Automated manual transmission
APU Auxiliary power unit
AT Automatic transmission
ATIS Automatic tire inflation system
Cd Aerodynamic drag coefficient
CdA Aerodynamic drag area
CNG Compressed natural gas
CO Carbon monoxide
CO2 Carbon dioxide
DCT Dual-clutch transmission
DOC Diesel oxidation catalyst
DPF Diesel particulate filter
ECU Engine control unit
EGR Exhaust gas recirculation
EPA U.S. Environmental Protection Agency
GEM Greenhouse gas emissions model
GFEI Global Fuel Economy Initiative
GHG Greenhouse gas
GVW Gross vehicle weight
HDV Heavy-duty vehicle
HEV Hybrid electric vehicle
HHDDT65 Heavy heavy-duty diesel truck schedule at 65 mph
HPDI High pressure direct injection
ICE Internal combustion engine
LDV Light-duty vehicle
LNG Liquefied natural gas
MT Manual transmission
NACFE North American Council for Freight Efficiency
NG Natural gas
NHTSA US National Highway Traffic Safety Administration
NOx Nitrogen oxides
OEM Original equipment manufacturer
PCC Predictive cruise control
PM Particulate matter
VII
MARKET PENETRATION OF FUEL-EFFICIENCY TECHNOLOGIES FOR HDVS
PWM Pulse-width modulated
RIA Regulatory impact analysis
SCR Selective catalytic reduction
SI Spark ignited
TCU Transmission control unit
TEG Thermo-electric generator
TPMS Tire pressure monitoring system
UDDS Urban dynamometer driving schedule
UI/UP Unit injector/unit pump
VGT Variable geometry turbine
VVA Variable valve actuation
WHR Waste heat recovery
WHTC World Harmonized Transient Cycle
WHVC World Harmonized Vehicle Cycle
1
ICCT WHITE PAPER
1. INTRODUCTION
The transportation of goods is a major and growing source of global greenhouse gas (GHG) emissions. The modal split of freight transport is largely dominated by on-road transport, that is, by heavy-duty vehicles (HDVs). As freight demand increases under the constraints imposed by climate change and energy security, improving the fuel efficiency of HDVs has become an increasing concern for policy makers. There are currently only four countries – the United States, Japan, China, and Canada – with fuel efficiency standards for HDVs, but numerous other countries and regions currently are considering the implementation of such standards. Fuel efficiency standards set mandated fuel consumption targets for new vehicle sales. The targets are met by manufacturers producing and selling vehicles with a higher adoption level of fuel efficiency technologies in place. In practice, well-designed and implemented standards increase the market penetration of efficiency technologies at a faster rate than would occur from relying on market forces alone. Furthermore, strong technology forcing standards1 provide incentives for the development and implementation of new technologies, beyond those that are commercially available (Delgado & Lutsey, 2015).
There are a number of mechanisms by which the fuel energy is lost in long-haul tractor-trailers and regional delivery rigid trucks. Efficiency technologies target one or more of these loss mechanisms and thereby, improve the overall fuel efficiency of the vehicle. Table 1 shows an overview of the loss areas targeted by the technologies discussed in this report. The strong dependence of the loss mechanism on the duty cycle, payload and vehicle type results in wide-ranging estimates for the respective typical losses.
Table 1. Overview of the main energy loss mechanisms
*Typical loss data from Delgado and Muncrief (2016). Aftertreatment system data from Singh, Rutland, Foster, Narayanaswamy, and He (2009).
To understand the potential for efficiency standards to affect the market penetration of fuel saving technologies into the fleet, it is helpful to understand the baseline or the current state of technology penetration in the market. In this report, we compare and discuss the market penetration of some key mature and incipient technologies that may be applied to the fuel energy loss categories listed in Table 1.
1 A technology forcing regulation is one that requires the development and commercialization of technologies that would otherwise be highly unlikely to be brought into the market. In contrast, “technology tracking” standards accelerate the market adoption of current off-the-shelf technologies with low adoption rates.
System Description Typical loss* Mechanisms
Engine Fuel energy is lost in the conversion process to engine out torque 56%–61%
Combustion process, Engine friction,Exhaust energy, Gas exchange
Heat transfer
Transmission and driveline
Fuel energy is lost during the process of converting engine out torque to torque
Road-load Fuel energy is lost overcoming aerodynamic drag and rolling resistance 12%–34% Chassis and trailer air drag
Tire rolling resistance
Accessories/ auxiliaries
Fuel energy is lost through powering of non-drive related auxiliaries and accessories. 2%–4% Pumps, Compressors, Fans
Aftertreatment system
Fuel energy losses associated with the emission control system 2%–8% Back pressure, Regeneration events
Thermal management
Energy management
Fuel energy is lost through poor energy management 5%–20% Unnecessary idling
Sub-optimal driving Braking
2
MARKET PENETRATION OF FUEL-EFFICIENCY TECHNOLOGIES FOR HDVS
METHODOLOGYThe majority of the data presented in this report were obtained from Knibb, Gormezano & Partners (KGP), a U.K.-based consulting firm specializing in the international automotive industry. KGP obtains its data from a variety of sources including government registrations, published databases, automotive suppliers, expert consultations, and in-house experts. For certain technologies, additional information was used to supplement the KGP data and gain a deeper understanding of the driving forces for technology adoption. In these cases, the source of the supplemental information is described in the relevant section. The scope of the analysis encompasses the world’s three largest automotive markets: the European Union, the United States and China.
Two different gross vehicle weight (GVW) ranges are considered in this analysis, medium (6–16 tonnes) and heavy trucks (heavier than 16 tonnes). The medium truck segment is dominated by straight rigid trucks in all three markets. The heavy truck segment consists mostly of articulated tractor-trailers in the EU, the United States and China (Muncrief & Sharpe, 2015; Sharpe & Muncrief, 2015), although a non-negligible number of rigid trucks are also included in the segment. Tractor-trailers are typically used for long-haul freight operations while rigid trucks are mostly used for urban or regional freight movement. Heavy trucks – mostly tractor-trailers – contribute disproportionately to the HDV fuel consumption in all three markets (Sharpe & Muncrief, 2015). Due to their typical duty cycle and higher payload, the set of technologies applicable to this segment differs from that of medium rigid trucks. To highlight this fact, medium trucks will be referred to as rigid trucks and heavy trucks will be labeled as tractor-trailers throughout this report.
The European data include the EU member state countries plus the European Free Trade Area (EFTA) countries. The data labeled as U.S. in this report include both the United States and Canada. The data labeled as China include only the Chinese market. Throughout this report, data may be referred to as having high, medium, or low confidence. This is based on whether the data were obtained from a specific reliable database (e.g., official registration data) or whether they were based on a less quantitative estimation (e.g., expert consultation on low penetration technologies). Unless otherwise stated, the data used in the individual sections of this report have high confidence.
A literature review was done to assess of the potential for fuel consumption reduction of the different individual technologies. Based on a recent Global Fuel Efficiency Initiative/ICCT report (Delgado, Miller, Sharpe, & Muncrief, 2016), this report considers the vehicle baseline and the characteristic duty cycle of each market during the assessment of the potential of the individual technologies. For some technologies, the information found in the literature refers only to the improvement of a certain parameter (e.g., drag coefficient). Vehicle simulation was used to translate these values into changes in fuel consumption. For the EU and China, the simulation tool VECTO, developed by the European Commission, was used. For the United States, the EPA Phase 2 Greenhouse Gas Emissions Model (GEM) was used.
This report does not aim to provide an extensive analysis of all the possibilities for HDV efficiency improvement. Technologies not included in the KGP data set were not considered. Furthermore, the continuous and incremental improvement of the different HDV components cannot be assessed with the data sources available for this report. For example, fuel efficiency improvements are still possible through improved engine calibration, combustion optimization, or improved tractor-trailer aerodynamic design. Because these are not discrete technologies, their evaluation is outside of the scope of this report.
3
ICCT WHITE PAPER
2. CURRENTLY AVAILABLE TECHNOLOGIES
The technologies discussed in this section are readily available from the original equipment manufacturer (OEM), that is, the vehicle, engine or trailer manufacturer, or from Tier 1 suppliers in one or more of the markets evaluated. The technologies are grouped according to the main energy loss area that they are affecting as presented in Table 1.
ENGINE TECHNOLOGIESInternal combustion engines (ICEs) are currently the only power source for on-road freight transportation. The conversion of the fuel’s chemical energy into thermal energy through combustion and its subsequent conversion into mechanical energy result in large unavoidable losses. Modern diesel engines are able to convert between 40% and 46% of the fuel’s energy into crankshaft work (Delgado & Lutsey, 2015). The remaining energy is lost to the environment as heat through the exhaust gases and the cooling system. This section deals with technologies for optimizing the combustion process. The technologies discussed in this section include common rail systems, advanced turbochargers, turbocompounding, variable valve actuation, and natural gas powertrains.
Common rail injectionUnlike unit injector and unit pump systems (UI/UP) where the fuel pressure is generated individually for each cylinder immediately before the injection event, in common rail injection systems a high-pressure reservoir supplies the pressurized fuel to all cylinders. The availability of fuel at a freely controllable high pressure provides flexibility to optimize the injection timing, injection rate and number of injections as functions of engine speed and load.
In the United States, the change in the market penetration of common rail injection has followed similar paths from 1995 to 2009 in tractor-trailers and rigid trucks, starting at 30% for both sectors in 1995 and peaking at 80% for tractor-trailers and 85% for rigid trucks from 2000 to 2009. From 2009 to 2015, the share of rigid trucks with common rail injection systems rose to 100%. In the same period, the new registrations of tractor-trailers with this technology fell to 70%, partly driven by the larger market share of the Volvo Group, including Mack Trucks and Volvo Trucks, which has traditionally used UI/UP instead on common rail injection for its tractor-trailer engine portfolio. The market share of the Volvo Group in the U.S. HDV sector grew from 16% in 2008 to 20% in 2014, according to the company’s annual reports (Volvo Group, 2017). With the release of the new generation of Volvo engines D11 and D13 featuring common rail in 2017, the market penetration of common rail in U.S. tractor-trailers is expected to increase (Volvo Group, 2016).
In Europe, this technology was in 20% of both new tractor-trailers and rigid trucks that were sold in 1995 (see Figure 1). For tractor-trailers in Europe, the market adoption of common rail systems grew from 1996 to 2001, plateaued from 2001 to 2011, and continued growing from 2011 to 2015. The share of new tractor-trailers with common rail diesel injection in 2015 was 80%. As is the case in the United States, the market penetration of common rail in tractor-trailers is expected to increase as the engine
4
MARKET PENETRATION OF FUEL-EFFICIENCY TECHNOLOGIES FOR HDVS
portfolio of Volvo Trucks and its sister company Renault Trucks2 gets updated in 2017. As shown in Figure 1, the market penetration of common rail systems in EU rigid trucks plateaued at 50% from 1998 to 2003, and then experienced an accelerated uptake, reaching full market penetration in 2005.
Common rail, tractor-trailersNew sales market penetration (%)
Common rail, rigid trucksNew sales market penetration (%)
100
0
20
40
60
80
100
0
20
40
60
80
1995 2000 2005 2010 20151995 2000 2005 2010 2015
USUS
EU
EU
China China
Figure 1. Common rail market penetration in HDVs for the EU, U.S., and China (high confidence).
In China, the change in market penetration of vehicles with this technology has followed similar paths in tractor-trailers and rigid trucks from 1995 to 2015. In China, no new vehicles had this technology until 2005. From 2006 to 2015, market penetration rose rapidly with an average annual growth rate of 24%. In 2015, the technology penetration reached 55% and 65% of rigid trucks and tractor-trailers, respectively. Because of the benefits of common rail systems for emissions control explained in the next paragraph, the inflection points in the penetration curve at 2005, 2008, and 2013 coincide with the implementation dates of the China II, III, and IV emission standards, respectively. The implementation of China V in 2017 will continue to drive the market penetration of common rail fuel injection upward.
Common rail diesel injection systems have seen a steady increase in the fuel injection pressure over the last 20 years. The fuel injection pressure has a direct influence on the fuel spray geometry, fuel mixing and, consequently, combustion characteristics. In general, higher fuel injection pressures reduce soot formation, allow for more aggressive exhaust gas recirculation (EGR) rates for reducing nitrogen oxides (NOX) formation and provide flexibility for optimizing the injection pattern (Ehleskog, Gjirja, & Denbratt, 2009). Typical injection pressures required to comply with Euro VI equivalent emission standards oscillate around 2000 bar (Morgan, Banks, Auld, Heikal, & Lenartowicz, 2015). Data provided by KGP for the HDV fleets in the United States, EU, and China show with medium confidence that the fleet penetration for fuel systems with over 2000 bar injection pressure is 60% in the United States, 23% in the EU, and 5% in China. The higher penetration of high pressure injection systems in the United States
2 Volvo Trucks and Renault Trucks had a combined market share of 23% in the EU for the tractor trucks segment in 2015, per data supplied by IHS Global SA.
5
ICCT WHITE PAPER
is a consequence of the early application of high EGR rates instead of selective catalytic reduction (SCR) for NOX control. High EGR rates result in an increased tendency to form soot during combustion. This trend can be partially corrected by improving the fuel mixing process through higher injection pressures. Further details are provided in the Aftertreatment Systems section.
The benefits of common rail systems on fuel economy are difficult to quantify because the fuel savings are strongly tied to the engine calibration. Nevertheless, common rail is a prerequisite for combustion optimization and thermal management through strategies such as higher injection pressures, multiple injections, or injection rate shaping. The EPA/NHTSA GHG HDV Phase 2 regulatory impact analysis (RIA) estimates the fuel consumption reduction from a 2017 baseline of combustion optimization at 1.1% for tractor-trailers and 1% for rigid trucks (U.S. Environmental Protection Agency and National Highway Traffic Safety Administration [U.S. EPA & NHTSA], 2016b).
Advanced turbocharging A turbocharger is a combination of an exhaust flow driven turbine mechanically connected to a compressor in the air intake stream. The compressor increases the charge density of the intake gases and the volumetric efficiency of the engine, while using some of the exhaust energy that would otherwise be wasted. Turbocharging has become a standard technology in heavy-duty (HD) diesel engines as a means to increase the specific power output and has reached full new sales penetration in the EU, the United States, and China. Turbocharging, in its most basic form, does not provide any degree of freedom to adjust the intake pressure, or boost, as the turbine/compressor rotational speed is completely determined by the exhaust flow conditions. The use of a wastegate, a valve that allows bypassing of the exhaust gases around the turbine, provides an additional degree of freedom for boost control. Fixed and wastegated turbochargers will be referred to as basic turbocharging in this report.
The technology penetration of advanced turbocharging responds to the need for simultaneously improving conflicting targets such as low-speed torque, high-speed power, transient response, high boosting levels, and large EGR rates for emissions control. Improved transient performance can be achieved either through the use of smaller impellers with a lower moment of inertia or by optimizing the exhaust gas entry to the turbine; however, the high-load, high-speed operation regimes will be negatively affected by either approach. On the other hand, effective in-cylinder NOX control requires increased EGR rates that must be delivered across a pressure differential into the boosted intake manifold.
OEMs and Tier 1 suppliers have developed different approaches for advanced turbocharging such as variable geometry turbines (VGT), multi-stage turbocharging, and asymmetric twin-scroll housings. VGT offers the possibility of adjusting the cross-sectional area of the inlet plane and modifying the angle of incidence of the exhaust gases on the turbine blades as a function of speed and load. As a result, the exhaust gas velocity and pressure at the inlet of the turbine can be adjusted as a function of speed, load, and EGR rate. The second approach, multi-stage turbocharging, consists of using two or more turbochargers connected in series. The different sizes of the individual turbochargers and the regulation of the flow streams through bypass valves provide additional degrees of freedom to optimize the boost and back pressure levels. Lastly, asymmetric twin-scroll turbochargers consist of a double scroll turbine
6
MARKET PENETRATION OF FUEL-EFFICIENCY TECHNOLOGIES FOR HDVS
housing that separates the exhaust gases of six-cylinder engines; each scroll in the turbine housing serves a group of three cylinders. The smaller cross-sectional area of one of the scrolls provides the back-pressure necessary to drive the EGR flow, while the exhaust gases of the remaining three cylinders flow into the larger scroll and are not used for EGR. The end result is a lower overall back-pressure of the engine as a whole, which reduces pumping losses and improves fuel efficiency. Daimler measurements of the fuel consumption performance of engines matched with an asymmetric turbocharger show a 4% benefit (Chebli, Müller, Leweux, & Gorbach, 2013).
In the United States, the implementation of tighter NOX emission standards by the EPA in 2004 led to the widespread adoption of EGR for NOX control and resulted in a step change in advanced turbocharging market penetration from 0% to 100%, as seen in Figure 2. In Europe, the use of SCR for NOX control resulted in more gradual adoption rates of advanced turbocharging because lower EGR rates are required. The Euro VI regulation mandates maximum NOX emissions similar to the US 2010 standard. However, the allowable NOX level in Euro VI is 0.4 g/kWh, as opposed to 0.27 g/kWh in US 2010. Assuming an SCR conversion efficiency of 95%, the NOX mandate difference means that EU engines can operate at approximately 32% higher engine-out NOX compared to a US 2010-compliant engine. Furthermore, because of packaging constraints in EU trucks, the space available for radiators is smaller than in the United States, and it is desirable to run lower rates of EGR to reduce the amount of heat rejection into the engine coolant (Henry, 2014). Thus, EU truck manufacturers have followed different approaches to comply with the regulatory requirements. MAN has opted mainly for high EGR rates with limited use of SCR with the aid of two-stage turbochargers. DAF and Daimler Trucks mostly use the same approach as U.S. truck manufacturers, which is cooled EGR with moderate use of SCR, coupled with advanced turbochargers – VGT in the case of DAF and asymmetric twin-scroll turbocharging in the case of Daimler trucks. Renault Trucks and Volvo Trucks, in most of their engines, restrict the use of hot EGR to cold start and low-load operation, and rely more strongly on SCR for the rest of the operating points; advanced turbocharging is not used (wastegate only). Lastly, some Scania engines and most Iveco engines use low rates of EGR and use either wastegated turbocharging or VGT (Jääskeläinen & Khair, 2016; Jiao, 2015; Reinhart, 2016).
Figure 2. Advanced turbocharging market penetration in HDVs for the EU, U.S., and China (high confidence).
7
ICCT WHITE PAPER
The technology adoption of advanced turbochargers in the EU in 2015 was 70% in tractor-trailers and 60% in rigid trucks. The debut of advanced turbocharging in the Chinese tractor-trailer and rigid truck market occurred in 2010; as of 2015, the market penetration was at 5% in tractor-trailers and 10% in rigid trucks. The push for more fuel efficient engines together with developments in aftertreatment systems have resulted in technology packages that forgo high EGR rates, favoring fuel consumption, and rely on advanced SCR for NOX control (Cloudt, Baert, Willems, & Vergouwe, 2009). Therefore, the future market penetration of advanced turbocharging for EGR control is not expected to follow the same path in the EU and China as in the United States. Nevertheless, continuous improvements on the turbine and compressor efficiencies, as well as a reduction on the turbocharger back-pressure, are expected.
Based on estimations by the U.S. National Highway Traffic Safety Administration (Reinhart, 2015), an improvement of 5% in the turbocharger efficiency would result in 1.6% fuel consumption reduction for rigid trucks3 and 2.9% for tractor trailers.4 Because in the EU the HDV speed limit is lower, the advanced turbocharger potential in EU tractor-trailers is estimated from the U.S. 55-mph cycle at 2.5%. The technology potential in EU rigid trucks is assumed to be the same as in the U.S. For China, the potential is estimated from the same NHTSA study, but using the World Harmonized Vehicle Cycle (WHVC) as the representative duty cycle (Delgado, Miller, et al., 2016). The technology potential of advanced turbochargers in China is estimated as 1.7% and 2.2% for rigid trucks and tractor-trailers respectively.
TurbocompoundingTurbocompounding refers to the recovery of exhaust energy by means of a turbine. The work extracted by the turbine can be transmitted directly to the crankshaft or can be used to power an electric generator that charges a battery for storing the energy. These devices are used in addition to a turbocharger, and are placed downstream of it. In mechanical turbocompound systems, the mechanical coupling results in a fixed ratio between the speeds of the turbine and the engine; this can lead to power losses at the low exhaust flows characteristic of low engine speed (He & Xie, 2015). Electric turbocompounding provides greater flexibility as the recovered electric energy can be used to power electrical accessories, provide direct assistance to the powertrain or improve the boosting transient response through an electric compressor. Until now, only mechanical turbocompounding systems have been commercialized.
The technology penetration of turbocompounding has responded to individual efforts of tractor truck manufacturers to achieve better fuel economy. In the absence of regulatory technology forcing, the technology adoption has been short-lived. In the United States from 2009 to 2013, the technology was offered by Detroit Diesel on its DD15 engine (Detroit Diesel, 2009). Similarly, in Europe the 1%–2% market penetration in the early 2000s shown in Figure 3 was driven by Scania’s Euro III and Euro IV compliant DT12 engine (Scania, 2001) and by Volvo’s Euro III compliant D12D-500 engine (Volvo Trucks, 2001). Currently in Europe, the technology is only offered by Daimler Trucks on its largest engine, the 15.6-liter OM 473 (Daimler AG, 2014), which in 2015 only accounted for 0.24% of the total new sales.5 The future market penetration
3 Multipurpose vehicle, GEM weighting of CARB, 55 mph and 65 mph cycles. 4 Class 8 combination, sleeper cab, GEM weighting of CARB, 55 mph and 65 mph cycles. 5 New sales data supplied by IHS Global SA.
8
MARKET PENETRATION OF FUEL-EFFICIENCY TECHNOLOGIES FOR HDVS
of turbocompound powertrains in the United States is expected to increase with the market launch in 2017 of Volvo Trucks’ D13TC engine (Volvo Trucks, 2016), which features the technology. The EPA/NHTSA GHG HDV Phase 2 rule assumes a 10% market penetration of turbocompounding by 2027 (EPA & NHTSA, 2016a).
Figure 3. Turbocompounding penetration in the tractor-trailer segment in the EU, U.S., and China (high confidence).
Turbocompounding systems increase the exhaust back-pressure, and therefore, the engine pumping losses, offsetting a portion of the fuel consumption benefits. As a rule of thumb, only half of the energy recovered by the turbine will translate into fuel efficiency improvements (Greszler, 2008). Different studies estimate the fuel consumption reduction of heavy-duty turbocompounding systems between 1.8% and 4% (Callahan, Branyon, Forster, Ross, & Simpson, 2012; EPA & NHTSA, 2016b; Greszler, 2008; Kant, Romagnoli, Mamat, & Martinez-Botas, 2014). The technology potential of turbocompounding for the three markets is assumed to be the same and is estimated as the average from the values found in the literature at 2.8% in long- haul operation. Because of the transient duty cycles characteristic of rigid trucks, turbocompounding is not cost-effective in this segment.
Variable valve actuationThe timing, duration, and lift profile of the intake and exhaust valve trains have a direct impact on the fuel consumption and emissions performance of internal combustion engines. Variable valve actuation (VVA) is the generic term for a group of technologies that allow the valve train to adjust as a function of speed and load. VVA is a widespread technology for gasoline engines, providing them with benefits in volumetric efficiency across a wide speed range, reducing throttling losses and improving the low-end torque of gasoline direct-injection engines. On the other hand, diesel engines have a narrower speed range, operate with excess air, use advanced turbocharging technologies to improve the low-end torque, and have a smaller clearance at top-dead center due to the higher compression ratio. Consequently, VVA offers limited benefits in diesel engines (Deng & Stobart, 2009). Nevertheless, VVA cannot be ruled out as a future technology
9
ICCT WHITE PAPER
for HD diesel engines, as it provides flexibility for charge motion control, cylinder deactivation, internal EGR control, extended expansion ratio, ignition delay control, and thermal management of the exhaust aftertreatment system (De Ojeda, 2010; Schneider & Naujoks, 2016; Sjöblom, 2014). In practice, HD VVA systems can target the intake valve closing time to enable Miller cycle operation (Engström, 2016) or the exhaust valve opening time to minimize blow down losses (EPA & NHTSA, 2016b). VVA systems have been demonstrated to reduce fuel consumption of HD engines by 1%, with an estimated potential of 2% in further developments (De Ojeda, 2013). The technology potential of VVA for both vehicle segments and the three markets is assumed to be the same.
VVA systems have not yet been introduced in tractor-trailers. In the rigid truck segment, the technology has been present in the EU only since 2013, when Daimler introduced the Euro VI-compliant OM934 and OM936 engines. The OM93x platform uses variable exhaust cam phasing for advancing the exhaust valve opening. As a result, the exhaust temperature can be increased on demand and the thermal regeneration of the diesel particulate filter (DPF) can be initiated at lower engine loads (Herrmann, Nielsen, Gropp, & Lehmann, 2012). The resulting market penetration of VVA in the EU rigid truck market, corresponding to the market share of the OM93x engine platform,6 was 15% in 2015.
Natural gas powertrainsThe primary incentive for the adoption of natural gas (NG) as an alternative fuel in HDV is its price advantage in comparison to diesel fuel. Furthermore, the lower carbon-to-energy ratio of methane provides advantages regarding GHG emissions. On the other hand, the attractiveness of natural gas as a diesel substitute is negatively affected by the incipient fueling infrastructure, the increased cost and weight of NG fuel tanks, and the high global warming potential of methane, should NG leaks occur in the fuel’s supply chain, fueling process, or during engine operation. Two natural gas engine concepts are available in the market: stoichiometric, spark ignited (SI) and lean-burn, compression-ignited, high-pressure direct injection (HPDI). Natural gas SI concepts do not differ significantly from their gasoline counterparts in terms of efficiency and aftertreatment systems. HPDI-NG engines, on the other hand, use a fuel lean mixture, which is ignited by the injection of a small quantity of diesel fuel at the end of compression. The potential of NG HD engines for reducing CO2 emissions is the result of the fuel’s lower carbon intensity combined with the lower thermal efficiency of the engine (Camuzeaux, Alvarez, Brooks, Browne, & Sterner, 2015). However, methane leakage reduces the effectiveness of NG powertrains in reducing GHG emissions. Estimates for the United States, under a low leakage scenario of 1.1% leakage, show that a 20% market penetration of NG powertrains with diesel-like efficiency can result in a 7% reduction in GHG emissions (Delgado & Muncrief, 2015).
Tractor-trailers powered with natural gas are more popular in China, where the market penetration reached 10% in 2015 as shown in Figure 4. A recent analysis by KGP7 indicates that the share of NG powertrains in China fell significantly in 2016, to less than 6% due to the low oil prices, affecting the payback period of NG powered trucks. In the EU and United States, natural gas powered tractor-trailers represent only 1.5% and 0.5% of new vehicle sales, respectively (Figure 4). In the rigid truck segment, the United States has the largest penetration of NG trucks with 3%, followed by the EU with 0.5%.
6 New sales data supplied by IHS Global SA.7 KGP (internal communication, January 9, 2017)
10
MARKET PENETRATION OF FUEL-EFFICIENCY TECHNOLOGIES FOR HDVS
NG powertrains are not present in the rigid truck market in China. The future market penetration of NG as an alternative HDV fuel is still uncertain; as an example, estimates for the U.S. share of NG powertrains in new trucks by 2025 vary significantly from 1% to 20% (Delgado & Muncrief, 2015).
Figure 4. Market penetration of HD natural gas powertrains for the EU, U.S., and China (high confidence).
TRANSMISSION TECHNOLOGIESThe brake power produced at the crankshaft of the engine by the combustion process needs to be transferred to the driving axles to ultimately produce tractive work at the wheels. The transmission and driveline systems are responsible for this process. The transmission consists of a gearbox and a coupling device between the gearbox and the engine. The driveline connects the gearbox and the driving axle(s), with one or more differentials transferring the power to the tractive wheels. The mechanical efficiency of the transmission depends on the operating speed, the losses in the coupling device, the selected gear, and the lubricant viscosity, among other factors. Values as low as 85% are typical in automatic transmissions operating at low vehicle speeds, as a result of the losses in the torque converter. Conversely, peak efficiency values of 98% are possible in the cruising gear of tractor-trailer transmissions (Busdiecker, 2013). In addition to the direct energy losses arising from friction forces, the transmission affects the fuel efficiency of the vehicle as it determines the engine operating point for a given road load.
Manual transmissions (MT) historically have dominated the market in the HDV segments. In this type of transmission, the gear shifting process and speed selection are driver-operated through a clutch pedal and a gear shifter. During shifting, the driver uncouples the dry clutch. Then, as the gear shifter is moved to the new speed, a series of synchronizers match the speed of the gearbox to that of the driving axle. Finally, the driver closes the clutch, and the engine, gearbox, and driving axles are coupled. Because the speed selection and shifting process are driver dependent, the fuel consumption of HDVs equipped with MTs is strongly tied to the driving style.
11
ICCT WHITE PAPER
Transmissions that automate the speed selection and gear shifting processes can provide significant fuel consumption benefits, which are subsequently covered in more detail. The transmission control unit (TCU) is able to optimize the engine operation to satisfy the road load power demand. This is usually achieved by reducing the engine speed and increasing its torque output. Downspeeding reduces engine friction and pumping losses. However, the reduction in torque reserve associated with downspeeding can result in increased shifting frequency as the road load changes, leading to an increased number of torque-interruption and excursion events. This increase in transient operation diminishes the fuel saving benefits of downspeeding (Ivarsson, Åslund, & Nielsen, 2010). In addition to the benefits of downspeeding, automated transmissions enable downhill vehicle coasting, thus diminishing the engine friction losses (Delorme, Robert, Hollowell, Strobel, & Krajewski, 2014). The increased complexity of the integration between engine, transmission, and vehicle has led to industrial partnerships between engine and transmission manufacturers, such as SmartAdvantage from Cummins and Eaton, as well as the shift to in-house development and production of transmissions (e.g., Daimler and Volvo).
This section discusses the market penetration of three transmission technologies that replace the traditional MT. These are the automated manual transmission (AMT), dual-clutch transmission (DCT), and automatic transmission (AT).
Automated manual transmissionThe operating principle is similar for AMTs and MTs. However, in AMTs the operation of the clutch and gear selection are performed by an automated system. Based on the information collected by the vehicle’s sensors, the TCU decides the optimum gear selection and carries out the gear shifting process through a series of actuators.
AMT penetration in the EU has been on the rise for the past 15 years, being present in 70% of new tractor trucks and 50% of new rigid trucks in 2015 (Figure 5). In the United States, AMTs have been increasingly displacing MTs since 2006, reaching a market penetration of 28% in tractor trucks and 9% in rigid trucks by 2015 (Figure 6). EPA and NHTSA estimate a 50% adoption of AMT in Class 7 and Class 8 trucks by 2027 in the United States (EPA & NHTSA, 2016b). In China, the vast majority of new HDV sales continues to be MTs, with currently only 3% of new tractor-trailers and 2% of new rigid trucks equipped with AMTs (Figure 7).
The fuel saving potential of AMTs is strongly dependent on the driver and the driving style over the same route. However, the fuel consumption benefit of switching to AMTs from MT is higher for rigid trucks than for tractor-trailers, as the latter operate most of the time at constant speed. U.S. EPA and NHTSA estimate the fuel economy benefit of shifting from MT to AMTs as 2% for tractor-trailers (EPA & NHTSA, 2016b). Similar reductions can be expected for tractor-trailers in long-haul operation in the EU and China. The fuel savings potential of AMTs in rigid trucks is drawn from the work done by Southwest Research Institute (Reinhart, 2015). In U.S. rigid trucks, shifting to AMTs would result in a 3.8% improvement in fuel consumption.8 For EU rigid trucks, the fuel saving potential is estimated to be 3.9%.9 Over the WHVC, representative for China, AMTs can bring up to 6.4% fuel consumption benefit.
8 Multipurpose vehicle, GEM weighting of CARB, 55 mph and 65 mph cycles.9 Surrogate regional cycle made from CARB and 55 mph cycles and equal weighting.
12
MARKET PENETRATION OF FUEL-EFFICIENCY TECHNOLOGIES FOR HDVS
Figure 6. Market penetration of different transmission types in the U.S. (high confidence).
Automatic transmissionAutomatic transmissions differ substantially from MTs in their design and operation. First, and in contrast with MTs, AMTs, and DCTs, the gearbox of ATs is based on a set of epicyclic gear trains. Several clutches and brakes, controlled by a hydraulic unit, allow for the speed selection. Second, the coupling between the engine and the gearbox takes place through a hydraulic torque converter. The coupling relies on the motion of a viscous fluid inside two hydraulic chambers, the turbine and the impeller. During acceleration from standstill and gear shifting, the speed differences between the engine and the gearbox are absorbed and dampened by the relative motion of the hydraulic fluid between the turbine and the impeller. This process results in viscous losses that are
13
ICCT WHITE PAPER
dissipated as heat. During light acceleration and cruising, the inherent slip in the torque converter would have a significant fuel consumption penalty. These viscous losses are eliminated by means of a lock-up clutch between the turbine and impeller that prevents this slippage.
The United States is the only significant market for heavy-duty ATs, with Allison Transmission being the dominant manufacturer. As shown in Figure 6, the HDV market share of ATs in the United States has remained approximately constant in the past 20 years; the increase in market penetration of AMTs in the United States has not had an impact on the market share of ATs. Approximately 5% of tractor-trailers and 50% of rigid trucks are equipped with ATs in the United States. EPA and NHTSA estimate the 2027 market adoption of ATs in Class 7 and 8 vehicles at 30% (EPA & NHTSA, 2016b). On the other hand, ATs represent less than 0.5% of the EU market (Figure 5) and are present in China in 1% of the rigid trucks, mostly in vehicles used for refuse collection (Figure 7).
Figure 7. Market penetration of different transmission types in China (high confidence).
In long-haul and steady-state operation, the fuel consumption benefits of ATs and AMTs with the same number of gears are similar, because there are no slippage losses at steady state. However, during low-speed transient cycles, typical of urban driving, the fuel consumption penalty of torque converter slippage is between 1 and 5% (EPA & DOT, 2016b). Rigid truck simulations performed with GEM10 (VECTO currently does not have a predefined AT model for HD trucks) show a fuel consumption improvement of 2.7% over the MT option.
Dual-clutch transmissionDCTs are automated manual transmissions that enable gear shifting without power interruption. As the name indicates, two separate clutches are housed within the transmission, one for odd gears and one for even. This enables the simultaneous selection of two consecutive gears with the clutch operation determining the
10 Predefined medium duty truck, multi-purpose, 10-speed AT and MT transmissions.
14
MARKET PENETRATION OF FUEL-EFFICIENCY TECHNOLOGIES FOR HDVS
power-transmitting gear set. The absence of torque interruption during gear shifting reduces the number of transient events and extends the limits of downspeeding as a fuel saving strategy (Härdtle & Wallner, 2015). Volvo estimates that the fuel consumption of its DCT (I-shift dual clutch) is the same as its I-shift AMT (Volvo Trucks, 2014). EPA and NHTSA also estimate the fuel consumption benefits between AMTs and DCTs to be the same (EPA & NHTSA, 2016b). Nevertheless, DCTs provide advantages for powertrain deep integration, where improved communication between the engine and transmission control units results in a relocation of the engine operating points to regions with higher brake thermal efficiency. The absence of torque interruption during shifting eliminates the disadvantages of the higher shifting frequency.
DCT is a mature technology in light-duty vehicles and is now being offered for HDVs in the United States and the EU. Since 2014, several DCTs have been introduced into the HDV market, including products from OEMs, such as Mitsubishi Fuso (Mitsubishi Fuso Truck and Bus Corporation, 2012) and Volvo Trucks (Volvo Trucks, 2014), as well as from Tier 1 suppliers such as Eaton (Eaton, 2015) and ZF (Härdtle & Wallner, 2015). DCTs accounted for approximately 0.5% of new HDVs in the EU for both tractor trucks and rigid trucks, and approximately 1% of rigid trucks in the United States. The technology is not present in tractor trucks in the U.S. or in China. EPA and NHTSA estimate the 2027 market adoption of DCTs in Class 7 and 8 vehicles at 10% (EPA & NHTSA, 2016b).
ROAD LOAD REDUCTION TECHNOLOGIESThis section discusses the penetration of technologies aimed at the reduction of the forces opposing the movement of the vehicle, namely the road load. The fuel economy of tractor-trailers operating in line-haul has a strong dependence on the road load. This is a result of the higher vehicle speed and the reduced share of braking losses. In contrast, rigid trucks operating in urban and regional delivery operate at lower vehicle speeds and, due to the transient nature of the duty cycle, have higher braking losses. For this reason, this section focuses on road load reduction technologies for tractor-trailers. The three main components of the road load are shown in Table 2.
Table 2. Summary of road load forces
Road load component Origins Main dependence Dissipation mode
Aerodynamic drag
Uneven front-back pressure distribution due to turbulence Frontal area
Square of speedDrag coefficient
Energy is lost by inducing motion (kinetic energy) in the
surrounding airSkin friction between the air and the body work
Rolling resistance
Asymmetric distribution of forces at the tires’ contact
patch, called hysteresisVehicle weight
Rolling resistance coefficient
Energy is lost as heat in the tires and in the lubricant oil of the
drivelineFrictional losses in the axle differentials
Non-dissipative force, energy used climbing can be recovered
during downhill operation
15
ICCT WHITE PAPER
Aerodynamic featuresAerodynamic drag originates at different locations in the tractor truck and trailer. The drag improvements can be achieved through better aerodynamic design of the vehicle or through the aid of aerodynamic attachments. The list of such add-on devices for tractor trucks includes bumper, hood, and roof fairings; wheel and hub covers; vented mud-flaps; deturbulators; cabin underbody devices; and variable flaps for intake of cooling air (Patten, McAuliffe, Mayda, & Tanguay, 2012). On the trailer side, the aerodynamic devices include tractor-trailer gap reducers, wheel and hub covers, trailer end fairings (also called boat-tails), and trailer side skirts (Sharpe, Clark, & Lowell, 2013).
The market penetration of these technologies is hard to measure because many of them are only available in the after-sales market and are not offered as an option by the vehicle manufacturers. The data provided by KGP include, with a medium confidence, the market penetration of tractor truck active grille shutters and trailer side skirts.
Active grille shutterThe thermal management of the engine and transmission fluids and cooling the EGR require a flow of fresh air into the engine compartment. The necessary airflow is a function of the vehicle speed and the intake area of the front grille. The flow through the cooling system is driven by a pressure differential, entering at a high stagnating pressure at the front of the vehicle and exiting at low pressure regions, like the underfloor. The energy losses of the airflow originating from turbulence and friction across the heat exchangers, as well as the momentum losses caused by redirecting the flow downward, create aerodynamic drag (Kuthada & Wiedemann, 2008).
Because the cooling requirement of the vehicle varies according to the operating point, there is a potential for the cooling air drag to be reduced if the airflow through the cabin is adjusted to the vehicle’s needs. This can be achieved by controlling the intake area of the front grille using variable air flaps, also called active grille shutters. Figure 8 shows the market penetration of active grille shutters. In the EU, after the technology was introduced in 2012, it penetrated rapidly and became a standard-fit for Daimler’s Actros truck in 2014 (Daimler AG, 2015a). The current market penetration of active grille shutters in the EU is 25%. The technology is not present in the United States or China.
Active grille shutter, tractor-trailersNew sales market penetration (%)
30
25
0
5
10
15
20
1995 2000 2005 2010 2015
US
EU
China
Figure 8. Active grille shutter penetration in HDVs for the EU, U.S., and China (medium confidence).
16
MARKET PENETRATION OF FUEL-EFFICIENCY TECHNOLOGIES FOR HDVS
A computational fluid dynamics (CFD) study from Chalmers University calculated the aerodynamic improvement from a fully covered grill as resulting in a 7% reduction in the drag coefficient (Larsson & Martini, 2009). VECTO was used to simulate the fuel consumption reduction from the reduction in drag of a closed grille. The simulations show 1.6% and 2.6% improvement for EU tractor-trailers and rigid trucks, respectively.11 Using the WHVC and vehicle characteristics from China, the fuel economy improvements are 0.9% and 1.9% for tractor-trailers and rigid trucks respectively. These estimations are, however, an upper boundary, as the grille shutter cannot be closed 100% of the time. Assuming a 50% duty cycle for the active grille shutter, the technology effectiveness is estimated to be half of the those results. Insight gained from the U.S. SuperTruck program through CFD simulations shows that closing the grille results in approximately 1% improvement in overall fuel economy under the constraint of the current design of tractor cabins (Quinnell, 2015). Assuming similar aerodynamic improvements in U.S. rigid trucks and using GEM to simulate the fuel economy, a 0.9% reduction in fuel consumption is estimated.12 The expected technology transfer from the SuperTruck program provides arguments to expect that active grille shutters will gain market presence in the United States.
Trailer side skirtsSide skirts are the most common add-on devices for trailers. They extend below the trailer on each side between the rear of the tractor and the trailer axles. The side skirts prevent air from entering the upper half of the underbody, reducing the momentum transfer between the fast-moving vehicle and the stationary surrounding air. The result is a lower aerodynamic drag coefficient.
In the United States, EPA’s SmartWay program and California’s tractor-trailer GHG regulations have accelerated the adoption of technologies that enhance trailer aerodynamics. Consequently, the cost of trailer side skirts has seen a sharp decrease over the past decade (Sharpe & Roeth, 2014), leading to shorter payback times and an increase in market penetration. Similarly, it is expected that the cost of other trailer aerodynamic devices (e.g., boat tails) would also decrease in the future as a consequence of the U.S. EPA/NHTSA Phase 2 GHG standard. The higher speed limit and average annual mileage of tractor-trailers in the United States result in greater effectiveness of the aerodynamic devices and lead to faster technology uptake as shown in Figure 9. In 2015, 40% of new U.S. trailers and 10% of EU trailers were equipped with side skirts. This technology is not present in China aside from a small number of pilot programs.
EPA evaluated the aerodynamic performance of side skirts using coastdown testing, wind tunnel scale models and CFD. The results showed that side skirts reduce the aerodynamic drag area (CdA) by approximately 0.5 m2 for tractor trailers (EPA & NHTSA, 2016b) and by 0.2 m2 for rigid trucks (EPA & NHTSA, 2016a). The resulting fuel consumption was modeled in VECTO for the EU and China, and in GEM for the United States. In the EU, side skirts can provide a fuel economy benefit of 2% and 1.5% for tractor-trailers and rigid trucks, respectively.13 Using the WHVC and vehicle characteristics from China, the fuel economy improvements are 1.2% and 1.1% for
11 VECTO’s generic tractor-trailer over the long-haul cycle and generic rigid truck over the regional delivery cycle.
12 Medium-heavy duty, regional; 0.1 m2 improvement in the aerodynamic drag area (CdA)13 VECTO’s generic tractor-trailer over the long-haul cycle and generic rigid truck
over the regional delivery cycle.
17
ICCT WHITE PAPER
tractor-trailers and rigid trucks, respectively. In the United States, GEM simulations show a benefit of 3.7% for tractor-trailers and 1.8% for rigid trucks. This is in line with the 3% fleet improvements estimated by the North American Council for Freight Efficiency (NACFE, 2016b). It is worth pointing out that the effectiveness of trailer side skirts increases under crosswind conditions, as they prevent the cross flow from entering the underbody (Stephens & Babinsky, 2016).
Trailer side skirts, tractor-trailersNew sales market penetration (%)
50
0
10
20
30
40
1995 2000 2005 2010 2015
US
EU
China
Figure 9. Trailer side skirts penetration for the EU, U.S., and China (medium confidence).
Rolling resistanceThe tires’ rolling resistance is a consequence of the deformation hysteresis of the sidewalls and contact patch at the interface between the tire and the road. Some of the energy required to deform the tire is dissipated as heat as the tire recovers behind the contact line. The result is an uneven pressure distribution in the contact patch giving rise to a resistive torque. The tire pressure, material, and design have a direct influence on the area and force distribution of the contact patch, and consequently, on the rolling resistance.
The technologies available for reducing the rolling resistance include low rolling resistance (LRR) dual tires, single wide tires, nitrogen tire inflation, dual tire pressure equalizers, automatic tire inflation systems (ATIS) and tire pressure monitoring systems (TPMS). However, only limited data are available on these technologies. This report presents, with a medium confidence, the market penetration of single wide tires, and with a low confidence, tire pressure–monitoring systems in new vehicles.
Single-wide tiresWide-base single tires provide two key advantages over conventional dual tires. First, the lower sidewall count (two sidewalls instead of four) results in reduced energy dissipation in the deformation process and thus in lower rolling resistance (NACFE, 2015); second, single-wide wheels weight less than their double counterparts. Some of the disadvantages include the upfront cost of single-wide aluminum rims and the inability to limp home in case of tire failure. However, experience in U.S. fleets with satisfaction ratings of over 68% shows that the benefits of single-wide tires outweigh the disadvantages (NACFE, 2015).
18
MARKET PENETRATION OF FUEL-EFFICIENCY TECHNOLOGIES FOR HDVS
As shown in Figure 10, single-wide tires appeared in the U.S. tractor truck market in the early 2000s and were introduced in China in 2011 and in the EU in 2013. Their market penetration has steadily increased over the past decade. The United States has a higher percentage of new tractor-trailers with single wide tires, at about 11%, compared to the EU and China, where the current penetration is approximately 2%.
Figure 10. Single-wide tire penetration in tractor trucks for the EU, U.S., and China (medium confidence).
Single-wide tires have rolling resistance coefficients that are similar to their low rolling resistance dual counterparts. Single-wide tires offer fuel economy benefits of approximately 3% to 5%, according to the North American Council for Freight Efficiency (NACFE, 2015). To examine the fuel consumption reduction potential of single-wide tires in greater detail, the rolling resistance of the single-wide drive tires was estimated at 5.1 kg/tonne. This estimate is in line with the US Phase 2 standards estimates and corresponds, in the EU, to the lower bound of class C tires. In the EU, modern trailers with three axles already use single tires, rather than double tires, as was the case a decade ago. To have a comparable metric across the three regions, the fuel economy benefit analysis of single-wide tires focuses only on the drive tires. The resulting fuel consumption was modeled in VECTO for the EU and China, and in GEM for the United States. In the EU, single-wide tires on the drive axle can provide a fuel economy benefit of 1.7% and 2.2% for tractor trucks and rigid trucks, respectively.14 Using the WHVC and vehicle characteristics from China, the fuel economy improvements are 2.8% and 2% for tractor-trailers and rigid trucks, respectively. In the United States, GEM simulations show a benefit of 3.8% for tractor-trailers and 1.8% for rigid trucks.
Tire-pressure monitoring and inflation systemsThe rolling resistance coefficient of tires depends directly on the contact patch of the tire and the road. At constant tire pressure, the geometry of the contact area of the tire is mainly a function of the vehicle load; that is, at higher loads, the tire pressure needs to be increased to preserve its geometry. On the other hand, the tire pressure is a function of time, temperature, rotational speed, and, to a lesser degree, vehicle load.
14 VECTO’s generic rigid truck over the regional delivery cycle and generic tractor-trailer over the long-haul cycle.
19
ICCT WHITE PAPER
The optimal tire inflation pressure for a given load is decided by fleet operators seeking a balance between tire wear, fuel consumption, and maintenance intervals. A TPMS can provide real time feedback to the driver on the inflation condition of the truck and trailer tires; furthermore, with inflation capabilities, an ATIS enables the automatic compensation of pressure changes from air leakage, temperature difference, and vehicle operating conditions.
The available data show that TPMS and ATIS are more prevalent in trailers than in tractor trucks. The market penetration of TPMS in trailers was approximately 10% in the United States by 2012 (NACFE, 2013) and between 20% and 30% by 2015 in the EU.15 For ATIS, the market adoption in U.S. trailers was over 30% in 2012 (NACFE, 2013); there are no data available on trailer ATIS for the EU.
Figure 11 shows the market adoption of TPMS in tractor trucks and rigid trucks; it does not include trailer data. The available data suggest that the EU has a higher amount of TPMS available in new tractor trucks; however, the market penetration of this technology is still very low. For rigid trucks, the United States is the only market where this technology is available. Because in many cases retrofits represent a large share of the market volume (van Zyl et al., 2013), the uncertainty of the market penetration of the technology is high and the market penetration data are offered at a low confidence.
Figure 11. Tire pressure monitoring penetration in HDVs for the EU, U.S., and China (low confidence).
The GHG HDV Phase 2 rule in the United States assumes a market penetration in tractors of 70% for TPMS and 30% for ATIS in 2027. For trailers, the rule assumes 100% penetration of ATIS by 2018. Similarly, the expected 2027 penetration of TPMS is 90% in rigid trucks operating in regional delivery and 80% for multipurpose rigid trucks (EPA & NHTSA, 2016b).
According to estimates by the U.S. EPA, TPMS have the potential for reducing fuel consumption by 1% and 0.9% for tractor-trailers and rigid trucks, respectively (EPA & NHTSA, 2016b).
15 Data provided by KGP
20
MARKET PENETRATION OF FUEL-EFFICIENCY TECHNOLOGIES FOR HDVS
AUXILIARY LOADSA number of supporting systems are necessary for the correct functioning of the engine and vehicle. These include several pumps for generating the pressure necessary for fuel injection, power steering, and the circulation of the coolant fluid and engine oil. Energy also is required to drive the cooling fans and alternator, as well as the air conditioning and brake air compressors. The power necessary to drive these auxiliary loads traditionally is taken directly from the engine. Because the duty cycles of the different systems vary, the decoupling of the auxiliaries from the engine has the potential to reduce fuel consumption by optimizing the moment when the auxiliaries are engaged. This is achieved, in practice, by engaging the auxiliary loads when the engine is operating at high thermal efficiency, or when the vehicle inertia can be used to drive the loads. Optimizing the auxiliaries’ management can lead to fuel consumption improvements between 0.5% to 4% in line-haul applications (Delgado & Lutsey, 2015).
Potential technologies include clutches to engage/disengage the accessories, variable speed electric motors, and variable flow pumps. This section presents the market penetration of three technologies: clutched air compressors, variable speed fans, and on-demand pumps.
Clutched air compressorsCompressors are used to generate air pressure for the actuation of the air brake system and pneumatic suspension. The air compressor is responsible for maintaining the target pressure, around 10 bar (145 psi), in the system’s reservoirs. Air compressors are reciprocating machines that, as a result of thermal constraints, cannot be operated continuously. The maximum duty cycle, that is the ratio of time spent building pressure, relative to the total engine running time, of a single piston compressor is around 25% (Bendix, 2009), whereas the actual duty cycle is around 5% (Cummins, 2010). The remaining 95% of the time, the air compressor is generating parasitic friction losses that increase linearly with engine speed (Thiruvengadam et al., 2014). Two-stage intercooled air compressors reduce the outlet temperature of the air, increasing the maximum duty cycle. Although this allows for the use of smaller compressors, the use of a second compression stage also increases the frictional losses.
The frictional losses originated in the off period of the duty cycle can be eliminated by the on-demand coupling of the compressor to the engine. Further fuel economy benefits are gained by engaging the compressor as much as possible during vehicle deceleration or downhill operation. The on-demand coupling is controlled by the ECU and executed though an electromagnetic or pneumatic clutch at the input shaft of the compressor.
This technology is not yet available in the market for rigid trucks, but, for tractor-trailers, it has been available in the EU and U.S. markets since 2009. As shown in Figure 12, the technology adoption followed similar paths in both regions from 2009 to 2013. In 2014, the EU market experienced a sharp uptake reaching 80% market penetration. In the EU, most OEMs opted for clutched air compressors in their latest engine lineup, the exception being Daimler’s trucks that use unclutched two-stage compressors from Voith Turbo (2014). In the United States, the adoption of clutched air compressors is expected to increase, as Wabco, one of the largest manufacturers of clutched air compressors, has recently become Cummins’ exclusive air compressor supplier (Wabco, 2016). The technology has not yet been adopted in China.
21
ICCT WHITE PAPER
Clutched air compressors, tractor-trailersNew sales market penetration (%)
100
80
0
20
40
60
1995 2000 2005 2010 2015
US
EU
China
Figure 12. Clutched air compressors market penetration in the EU, U.S., and China (medium confidence).
Using vehicle duty cycle data, the compressor idling periods can be determined and the fuel-economy benefits estimated. NHTSA estimates that clutched air compressors lead to a small but measurable fuel consumption reduction of 0.2% (Reinhart, 2015).
Variable speed fansThe cooling requirements of the engine and vehicle systems vary widely during vehicle operation. Traditionally, the cooling fan is driven directly by the engine with a fixed transmission ratio, that is, its speed is directly proportional to that of the engine. To avoid unnecessary power losses when cooling is not required, the industry widely adopted on/off clutches for the fan drive. The clutch actuation can be achieved passively by the thermal deformation of a bimetallic spring that controls the opening of a valve for the passage of a silicon fluid into a viscous clutch (Phapale, Kommareddy, Sindgikar, & Jadhav, 2015). Active systems use pneumatic or electromagnetic clutches controlled by the ECU. As the cooling needs of modern engines increase due to turbocharging and EGR systems, the duty cycle of on/off fans has increased to an estimated 60% (Lockridge, 2011).
Systems equipped with variable speed fans allow power consumption adjustment during the active part of the duty cycle. Variable speed fans exist in different forms and degrees of complexity. Two-speed systems use a combination of permanent magnets, generating eddy currents for low fan speeds, with an on/off frictional clutch for synchronous high speed. Variable speed viscous fans work similarly to their passive counterparts, but regulate the passage of the silicon fluid thorough an electrovalve actuated by a pulse-width modulated (PWM) signal (Wright, 2015). Growing in complexity are fully variable hydraulic systems that decouple the fan operation from the engine; a hydraulic motor provides power for the system and allows for high cooling power even at low engine speed. These systems, however, are expensive and have a lower transmission efficiency than direct drive systems (X. Zhang et al., 2016). Although the cycle averaged power consumption of cooling fans is relatively
22
MARKET PENETRATION OF FUEL-EFFICIENCY TECHNOLOGIES FOR HDVS
low at approximately 2 kW (Badain, Reinhart, Cooper, MacIsaac, & Whitefoot, 2015), the use of electric drives on low voltage (12–24 V) architectures presents technical challenges due to the instantaneous high-power requirements, which can be as high as 50 kW at high engine loads and speeds (Cummins, 2010).
The market penetration of variable speed fans is shown in Figure 13. The data suggest that, for tractor-trailers, the market penetration rate in the EU and United States is at 20%. For rigid trucks, variable speed fans are only available in the United States, also at a rate of 20%. Market penetration of this technology progressed at a gradual rate in the EU, beginning in the late 1990s. The technology is not known to be present in China. However, the confidence of the market penetration data available is low.
According to one viscous fan drive manufacturer, possible fuel savings of 3.5% are possible (Paterra, 2014); however, this may be referring to a single operating point and may not be representative of a complete duty cycle. The fuel-economy improvement is then estimated using vehicle simulation, by reducing the cooling fan related power consumption, resulting in a reduction equivalent to 10% lower auxiliary loads. The resulting fuel consumption was modeled in VECTO for the EU and China. Values from the Phase 2 RIA were used for the United States. In the EU, variable speed fans can provide a fuel economy benefit of 0.3% and 1% for tractor trucks and rigid trucks, respectively.16 Using the WHVC and vehicle characteristics from China, the fuel economy improvements are 1.7% and 0.8% for tractor-trailers and rigid trucks, respectively. In the United States, EPA/NHTSA estimates a 0.3% benefit for tractor-trailers and 0.5% for rigid trucks.
Figure 13. Variable speed fans market penetration in HDVs in the EU, U.S., and China (low confidence).
16 VECTO’s generic tractor-trailer over the long-haul cycle and generic rigid truck over the urban cycle.
23
ICCT WHITE PAPER
On-demand coolant and oil pumpsAs is the case for variable speed fans, the requirements for the discharge flow and pressure of the engine fluids vary with engine operation. Fuel efficiency can be improved by decoupling the pumps from the engine when they are not needed and operating them at optimal speeds (i.e., on-demand) when they are. Because the power consumption of the coolant pump can be as high as 4 kW (Schultheiss, Edwards, Banzhaf, & Mersch, 2012), pure electrical drives operating at 12 or 24 volts present technical challenges. The solutions for on-demand operation are similar to those found in variable speed fans; that is, electronically controlled viscous couplings or on/off friction clutches. On-demand pumps only exist in the tractor-trailer market of the EU and the United States. The technology was introduced in 2014 and has a current market penetration of 5% (medium confidence) in both regions.
Effectiveness values consolidated by US NHTSA show that the optimization of water and oil pumps and their on-demand operation have an approximate benefit of 0.8% on fuel consumption; 0.5% from the coolant pump and 0.3% for the oil pump (Reinhart, 2015).
AFTERTREATMENT SYSTEMSThe excess of air in diesel combustion enables the in-cylinder control of carbon monoxide (CO) and hydrocarbon (HC) emissions of HDVs. Although the diesel oxidation catalyst (DOC) was historically used to reduce CO and HC emissions, it has more recently become a key element for the preconditioning of the exhaust gases for other more complex emission control devices (Johnson, 2016). Because the DOC has lost its relevance as a stand-alone device and has no direct impact on fuel efficiency, it will not be discussed in this report.
This section focuses on two aftertreatment technologies: diesel particulate filter (DPF) for soot control and selective catalytic reduction (SCR) for NOX control. The physicochemical principles behind the formation of ultra-fine particulate matter (PM) and NOX result in a tradeoff between the two. Soot particles are formed during the early combustion of rich regions within the fuel-air plume and are later oxidized in regions with enough temperature and oxygen concentration. NOX is produced in high temperature regions with high oxygen availability. As a result, measures that aim to lower the combustion flame temperature and oxygen concentration to reduce NOX formation also result in increased engine-out PM emissions because of the lower soot oxidation rates (Idicheria & Pickett, 2005). In practice, the addition of EGR lowers the combustion temperature, lowering NOX formation, but increases the engine-out PM emissions. Conversely, lowering EGR rates improves the in-cylinder PM oxidation, but increases engine-out NOX emissions.
The implementation of strict emission limits (Figure 14) across the world has driven the development and adoption of aftertreatment systems for the reduction of pollutant emissions. The impact of regulation on the market penetration of SCRs and DPFs is evident in Figure 15 and Figure 16 as stepwise increases in the technology adoption. One example is the first round of HDV registrations complying with Euro IV in 2006, Euro V in 2009, and Euro VI in 2014. The NOX-PM tradeoff and the differences in regulatory pollutant limits in the EU and the United States led to distinct technological pathways in these two regions.
24
MARKET PENETRATION OF FUEL-EFFICIENCY TECHNOLOGIES FOR HDVS
NOX standards for heavy-duty enginesNOX limit (g/kWh)
PM standards for heavy-duty enginesPM limit (mg/kWh)
7
0
1
2
3
4
5
6
160
0
20
40
60
80
100
120
140
2005 2010 20152005 2010 2015
US
US
EU
EU
Euro III
US 2004 US 2007 US 2010
Euro IV Euro V Euro VI
ChinaChina
China II China III China IV
Euro III
US 2004 US 2007 US 2010
Euro IV Euro V Euro VI
China II China III China IV
Figure 14. NOX and PM emission limits for new type approvals in the EU, U.S., and China.*
In comparison to the Euro IV standard, the US 2004 regulation mandated lower NOX emissions but had a higher PM allowance. As a result, and somewhat counterintuitively, the emission control system for compliance with US 2004 consisted of a combination of cooled EGR for NOX control and DPF to deal with the higher engine-out PM emissions. The emission limits in Euro IV allowed for low PM/high NOX engine-out tuning without EGR; the tailpipe NOX emissions were then brought down to compliance levels by an SCR system. The high NOX and PM allowance in the China II emission standards did not require aftertreatment systems. In the transition from Euro IV to Euro V, the NOX levels were adjusted downward and the PM limit was kept at the same level. In the United States, the shift from US 2004 to US 2007 resulted in a NOX reduction similar to that in the EU and a significant reduction in the PM limit. The resulting aftertreatment systems used to comply with the emission standards continued the same technological pathway established by the previous regulation, that is, cooled EGR plus DPF in the United States and high engine-out NOX calibration plus SCR in the EU. As was the case for the previous regulation, China III emission levels did not require aftertreatment systems and were achieved with in-cylinder measures. The implementation of Euro VI and US 2010 resulted in converging strategies for the emission control systems; the tighter NOX and PM levels required the combined use of DPF and SCR systems in both markets. However, the slightly higher NOX limit in Euro VI allows for SCR-only strategies, that is without EGR, in the EU. In China, the emissions levels set by China IV are equivalent to those of Euro IV and resulted in a similar emission control strategy.
This section presents an overview of the impact on fuel efficiency of DPF and SCR systems and discusses the market penetration of both technologies on the diesel powered HDV new vehicle fleet.
*Corrected from a previous version.
25
ICCT WHITE PAPER
Selective catalytic reductionThe control of NOX emissions in SCR systems is achieved by a chemical reaction between ammonia and NOX. The required ammonia is provided by the chemical decomposition of a urea solution injected directly into the exhaust stream. The ammonia is absorbed on the surface of the SCR catalyst where the chemical reactions take place. The NOX conversion efficiency is highly dependent on the temperature and composition of the SCR catalyst. Two possibilities are available for the selection the catalyst material: vanadium oxides and metal-exchanged zeolites. Vanadium-based SCR systems have a high resistance to sulfur poisoning but lower thermal stability. On the other hand, metal-exchanged zeolites, especially with copper, have better thermal stability and low temperature efficiency but are more sensitive to poisoning. Peak conversion efficiencies for both chemistries are above 95% (Maunula, Viitanen, Kinnunen, & Kanniainen, 2013; Ottinger, Veele, Xi, & Liu, 2016).
The large-scale adoption of SCR for HD applications first took place in the EU with the implementation of the emissions standard Euro IV. In 2005, the market penetration rose to approximately 70% and full market penetration was reached in 2010 after Euro V came into force for new all new vehicle sales. The market incursion of SCR systems occurred 5 years later in the United States, as the NOX limit phase-in period of the US 2007 standard ended in 2009; this emissions level is also known as US 2010. Current market penetration of SCR in the United States is 100% for diesel tractor- trailers and 95% for diesel rigid trucks. The remaining 5% of the U.S. diesel rigid truck market corresponds to the use of EPA credits by some manufacturers, allowing them to commercialize diesel powered stock without SCR systems. SCR is expected to have reached full adoption in the United States for new diesel-powered vehicles by 2016. In China, SCR systems entered the market in 2010 for tractor-trailers and 2011 for rigid trucks, and have recently increased their market penetration rate to 55% and 70% for rigid trucks and tractor-trailers, respectively, as the China IV regulation has come into force. SCR adoption is expected to increase with the implementation of China V in 2017.
Figure 15. Selective catalytic reduction market penetration in HDVs in the EU, U.S., and China (high confidence).
26
MARKET PENETRATION OF FUEL-EFFICIENCY TECHNOLOGIES FOR HDVS
High efficiency SCR systems aim to extend the temperature window for high NOX conversion, achieving SCR conversion rates of approximately 96%–99% (Jiao, 2015). The use of SCR systems with higher conversion rates allows for higher engine-out NOX emissions, reducing the need for EGR and lowering soot production. As a result, the injection and combustion timings can be shifted to earlier points and the engine back pressure originating from the EGR loop and the DPF loading is reduced. Consequently, fuel consumption is reduced. Iveco estimates that a 3% fuel consumption benefit can be achieved through high-efficiency SCR systems with no EGR (Maritati, 2013).
Some of the challenges for achieving high SCR efficiencies include cold-start NOX storage, optimized NO2/NOX ratio, and low-temperature NOX conversion. Furthermore, the urea spray distribution and mixing, SCR thermal management, urea decomposition and crystallization control, NH3 storage estimation for model-based control, and SCR system durability also play an important role (Jiao, 2015; Liu, 2013). Scania (2014) and Iveco (2016) both have introduced to the market Euro VI concepts with high-efficiency SCR systems, no EGR, and passive DPF regeneration. High-efficiency SCR systems are only available in the EU for tractor-trailers and rigid trucks; having appeared in 2012, this technology has now reached a market penetration rate of 10% for both tractor-trailers and rigid trucks.
Diesel particulate filtersThe separation of solid phases from gases can be achieved through myriad methods. However, for mobile applications, the packaging constraints reduce the palette of solutions to regenerative filters. Because of their high filtration efficiency – over 99% –most DPFs are of the wall-flow type (Bosteels et al., 2007). In wall-flow filters, a pressure gradient forces the exhaust gas through the porous walls of a channel. The channels are plugged alternately at their opposite ends to prevent the through flow of the gases. The accumulation of PM and ash in the DPF results in an increase in the pressure necessary to drive the flow across the walls, increasing the pumping losses of the engine. Two methods exist for reducing the filter loading: active and passive regeneration.
In active regeneration systems, when the filter loading crosses a threshold as measured by the pressure drop, the DPF is regenerated by oxidizing the PM with oxygen to convert it into CO2. The temperature needed for oxidation of PM, over 550°C, is seldom reached during normal vehicle operation, so active regeneration is required. During active regeneration, the exhaust gas temperature is increased by purposefully achieving incomplete combustion through late injection timing or by an additional fuel injector in the exhaust line. The exothermal oxidation of the unburned hydrocarbons and CO in an oxidation catalyst provides the high temperature necessary for soot oxidation (Dimopoulos, Eggenschwiler, & Schreiber, 2015). The combination of increased pumping work in the filtration phase and the energy required for the regeneration phase decreases the fuel economy. Depending on the regeneration strategy, the fuel consumption penalty associated with DPFs is between 2% and 8% (Singh, Rutland, Foster, Narayanaswamy, & He, 2009). The lower boundary represents only the back-pressure effect from DPF systems with passive regeneration, whereas the higher boundary corresponds to the fuel penalty from frequent regeneration events to maintain the back-pressure at its minimum. Current R&D efforts in DPF substrates are focused on reducing the back pressure from the soot and ash loading in the filter and minimizing the number of active DPF regeneration events. During the work of a collaborative
27
ICCT WHITE PAPER
research project in the EU, Johnson Matthey developed a DPF with a 30% higher soot burn rate and an approximately 4% lower back pressure due to the substrate’s higher porosity. The DPF improvements translated in a reduction in fuel consumption of 0.2% over the WHTC in comparison to a medium porosity Euro VI DPF (Engström, 2016).
Passive regeneration systems must ensure that the filter cleanup occurs at a lower exhaust temperature. Passive regeneration can use the NO2 produced from the oxidation of engine-out NO inside of a DOC to oxidize the soot content at approximately 250°C (Dimopoulos, Eggenschwiler, & Schreiber, 2015). Additionally, the use of a catalyst on the filter substrate can also reduce the temperature required for PM oxidation in the presence of oxygen. Because of the low oxidation rates achieved with passive regeneration, it is only applicable for systems with low engine-out PM emissions. These conditions are satisfied by systems with low EGR rates and SCR systems with higher conversion efficiency capable of reducing the excess NOX. The lower filter loading and regeneration temperatures translate into fuel economy benefits when compared to active regeneration systems.
As shown in Figure 16, DPFs have been included on 100% of diesel tractor-trailers and rigid trucks sold in the United States since 2003. The market penetration of this technology was below 10% in the EU for tractor-trailers and rigid trucks until 2013, when the implementation of the Euro VI standard drove the market penetration of DPFs to over 98% in diesel powered HDVs. The remaining 2% corresponds to special vehicles from low volume manufacturers.17 Currently, DPFs have low market penetration in China and the adoption is not expected to increase much in the near future because the PM limits were not tightened between China IV and China V standards, and the technology pathway for compliance is based on SCR systems with low or no EGR. Currently, the China VI emission standards, which would limit NOX, PM and particulate number (PN) to the same levels as Euro VI, are in the proposal stage and their implementation is expected in 2020.
Figure 16. Diesel particulate filter market penetration in HDVs in the EU, U.S., and China (high confidence).
17 KGP (internal communication, December 21, 2016)
28
MARKET PENETRATION OF FUEL-EFFICIENCY TECHNOLOGIES FOR HDVS
ENERGY MANAGEMENTA common straightforward analysis of the energy flow in HDVs starts with the chemical energy contained in the fuel and ends with the fraction of it converted to tractive work. However, real-world truck operation involves energy sinks that are not included in this simplified approach. This section discusses energy management technologies aimed at optimizing the energy flow into two of these sinks: engine idling and vehicle braking.
During idling, fuel energy is converted into just enough mechanical work to drive the truck’s accessories and auxiliary systems. Idling events can be of short duration, as they occur in urban traffic, or extended for the thermal and electric management of the HDVs during longer stops such as overnight hoteling. The idle-reduction technologies that are discussed in this section are stop/start systems, auxiliary power units (APU), and shore power.
During vehicle braking, the kinetic energy of the vehicle is converted into heat by either the wheel brakes, the retarder, or the engine brake. Cruise control systems are effective tools for reducing the energy wasted in braking. Two technologies are discussed in this section: adaptive cruise control and predictive cruise control.
Stop/start systemsStop/start systems reduce fuel consumption by reducing the amount of engine idling during short vehicle stops, such as those occurring in urban traffic. Stop/start systems have gained significant market penetration in LDVs during the past decade in the EU (Mock, 2016). On the other hand, the HDV market has not seen a similar market adoption. In HDVs, stop/start systems provide little to no advantage for long-haul trucks, which do not operate for the most part in urban traffic, and are primarily applicable to rigid trucks operating in local delivery service. Additionally, the increased number of start cycles could lead to premature failure of the starter motor or battery (Windover, Owens, Levinson, & Laughlin, 2015). The real-world benefits of stop/start systems are highly dependent on the environmental conditions, route selection and driver behavior. Reducing engine idling during short stops also is beneficial for aftertreatment thermal management; the cooldown rates of the insulated catalysts are slower when the low-temperature exhaust stream from idling is stopped. Nevertheless, in some cases idling is desirable to maintain engine temperature, cabin temperature or the battery’s state of charge.
The technology is only available in the EU market for rigid trucks, where stop/start systems exhibited a sharp incursion and retreat from the market within 5 years. As shown in Figure 17, the technology entered this market in 2008 at 10%, reached its maximum adoption in 2012 at 15%, and by 2015 was down to 7%. The technology adoption was driven by the sales of two particular rigid truck models from Daimler Trucks, the Atego and the Axor, that offered stop/start as a standard technology in combination with manual transmission (Daimler AG, 2009). Daimler estimates the benefits of the engine stop/start system in up to 3%. The increasing adoption of AMTs, combined with lower market shares of the Atego and Axor in the rigid truck market,18 drove down the technology adoption of stop/start systems. The GHG HDV Phase 2 rule in the United States estimates that the market penetration of stop/start systems in rigid trucks will be 30% by 2027. The corresponding estimation for the fuel efficiency improvements ranges from 1% to 14%, depending on the vocational vehicle subcategory and the characteristic duty cycle (EPA & NHTSA, 2016b).
Figure 17. Stop/start market penetration in rigid trucks in the EU, U.S., and China (high confidence).
The benefits of stop/start systems are very sensitive to the driving cycle, specifically to the stop time share over the cycle. The fuel consumption was simulated for rigid trucks for the EU and China in VECTO, and in GEM for the United States. The fuel consumption reduction potential of stop/start systems was estimated from the time fraction that the vehicle was at standstill over the cycle and the curb-idle fuel consumption from the engine fuel map. Given that this estimation corresponds to an upper boundary of the fuel consumption reduction, the effectiveness value is adjusted by a correction factor of 90% to account for the real-world behavior of stop/start systems, mirroring what was implemented in the certification simulation tool (GEM) of the US Phase 2 regulation (EPA & NHTSA, 2016b). In the EU, stop/start systems over the urban cycle can provide a fuel economy benefit of 3.7%. In China, idling losses over the WHVC represent 1.9%. In the United States, GEM simulates a fuel consumption benefit of 5% over the multipurpose driving mission. In long-haul operation of tractor-trailers, stop/start systems do not provide relevant fuel economy benefits.
Auxiliary power unitsIn long-haul transportation, the energy demands of drivers during resting periods must be met. Traditionally, the energy required for heating or cooling the cabin and the electricity used by on-board appliances and personal electronics is supplied by idling the engine. During idling, which may last several hours, the engine efficiency is significantly reduced, resulting in more than 8 kg of CO2 emissions per hour (Lim, 2003). APUs are power generation units used in addition to a prime mover to support power demands not related to propulsion. Conventional APUs are diesel-powered units. Advanced APUs are mostly battery-powered, although fuel cells also are being considered (Kshirsagar, 2015).
APUs are not present in the EU market because of the lower fraction of trips requiring overnight stops and the more widespread use of auxiliary diesel burners for cabin heating. They also are not present in China. In the U.S. market, best estimates signal that currently about 9% of new tractor-trailers sold are equipped with diesel APUs, as shown
30
MARKET PENETRATION OF FUEL-EFFICIENCY TECHNOLOGIES FOR HDVS
in Figure 18. However, because APUs commonly are sold as retrofits, the new vehicle sales data underestimate the overall fleet penetration of APUs. Compared to engine idling, diesel APUs reduce the fuel consumption in idling conditions by 60%–85% (Storey et al., 2003). When considering the whole duty cycle, EPA and NHTSA (2016) estimate that diesel powered APUs provide a 3.3% benefit in fuel consumption. The estimated 2027 penetration of diesel APUs in tractor trucks is 40%.
According to a study conducted by the North American Council for Freight Efficiency, the rapid market penetration of diesel APUs in 2008, resulting in over 30% adoption in 2008 and 2009, led to some quality issues that later translated into a decrease in the adoption of diesel APUs and an uptake of advanced APUs and diesel burners for heating (NACFE, 2014). Advanced APUs appeared in the market for tractor-trailers in 2007 and now are present in approximately 7% of new tractor-trailers (Figure 18).19 EPA and NHTSA (2016b) estimate that advanced APUs reduce the fuel consumption of tractor trucks by more than 5% and will have a market adoption of 15% by 2027.
Figure 18. APU market penetration in tractor-trailers in the EU, U.S., and China (medium confidence).
Off-board powerOff-board power, also known as shore power, is a technology aiming to eliminate fuel consumption during extended standstill periods. In the United States, HDVs burn approximately 2 billion gallons of fuel per year while idling (Leibrock, 2015); this represent approximately 5% of the total diesel fuel consumption. The electrification of truck stops and rest areas has the potential of reducing fuel consumption by using the local electricity grid to meet vehicle energy demands that would otherwise be supplied by engine idling or APUs. The use of off-board power, and the corresponding potential fuel savings, are highly dependent on the coverage of the infrastructure and the number of electrified parking spaces where the technology is available. Furthermore, the vehicle’s electrical architecture must accommodate the use of off-board AC power. This discussion focuses on the vehicle aspects.
19 NACFE (2016a) estimates the 2015 technology adoption of advanced APUs in 9%.
31
ICCT WHITE PAPER
Although AC ports exist in many trucks, the use of the electricity within vehicles can differ. According to the North American Council for Freight Efficiency (NACFE, 2014), AC power ports can be used for four different ends.
1. %Block heater: The AC port is used exclusively to keep the engine block warm in cold weather. Other electric power demands must be met by an APU.
2. %Extension cord: AC power from the electric grid is used directly to provide electricity to on-board appliances. There is no interaction between the electrical architecture of the vehicle and the off-board AC power. This mode is equivalent to running an extension cord into the vehicle.
3. %Inverted AC power: The AC current runs through an inverter and is transformed into DC at a lower voltage, providing charging power to the truck’s batteries. Alternatively, the inverter can be bypassed to supply electric power directly to the cabin, as in the previous example.
4. %Integrated AC power: In addition to charging the batteries and providing AC power to the cabin, the AC port supplies electricity to air conditioning, heaters and/or cargo refrigeration systems.
Off-board power ports are present only in tractor-trailers in the U.S. market. Challenges faced by this technology include the lack of coverage, uncertainty on the future infrastructure development at truck stops, and the fact that many fleets do not reimburse drivers for their off-board electricity consumption but do for the diesel used. Nevertheless, the number of new tractor-trailers with off-board power capabilities has increased rapidly over the years. As shown in Figure 19, current estimates place the technology adoption at 29% of new tractor-trailer sales in the United States.20
Figure 19. Off-board power market penetration in tractor-trailers in the EU, U.S., and China (medium confidence).
20 Technology adoption data from NACFE (2016a).
32
MARKET PENETRATION OF FUEL-EFFICIENCY TECHNOLOGIES FOR HDVS
Adaptive cruise controlAdaptive cruise control (ACC) is an extension of traditional cruise control systems, but instead of maintaining a constant vehicle speed, the speed is adjusted to preserve the headway to the vehicle ahead. When following a skilled driver, the reduction in unnecessary acceleration and deceleration events translates in fuel-economy benefits. The impact of unfavorable acceleration patterns of the preceding vehicle can be minimized through dynamic headway control (Zhenhai & Wei, 2016) and through the use of nonlinear filtering algorithms to generate smooth speed targets (Zhang & Ioannou, 2004). As part of the euroFOT project, the truck fuel-economy benefits of ACC in highway operation were calculated at 1.9% (Faber et al., 2012).
Figure 20 shows the market penetration of ACC technology in tractor-trailers. Best estimates indicate that the ACC systems entered the EU and U.S. markets in 2009 and 2011, respectively. In the EU, the current adoption is 50%, whereas in the United States, 10% of new tractor-trailers are equipped with ACC. The technology has not yet been introduced in China. ACC systems are both a stepping stone and a prerequisite for vehicle platooning, an advanced multivehicle driving support system where one vehicle closely follows another to reduce aerodynamic losses on highway operation (Tsugawa, Jeschke, & Shladover, 2016). Therefore, the market penetration of ACC systems is expected to continue increasing in the future.
Figure 20. Adaptive and predictive cruise control market penetration in tractor-trailers in the EU, U.S., and China (medium confidence).
33
ICCT WHITE PAPER
Predictive cruise controlPredictive cruise control (PCC) systems incorporate advanced telematics and digital road maps as further inputs for the cruise control algorithm and the shifting logic of the automated manual and automatic transmissions. By using GPS technology to determine the vehicle location and driving conditions, and combining them with the upcoming road grade and curve radius information from the digital road maps, the PCC determines the ideal vehicle speed and shifting pattern for lowest fuel consumption (Kock, Ordys, Collier, & Weller, 2013).
Table 3 presents an overview of the PCC systems offered by OEMs in the EU and the United States. In the EU, PCC systems are offered as an option by all major tractor-trailer manufacturers and the technology has seen an accelerated market adoption since 2012 when PCC was introduced commercially. The current new sales penetration in the EU is 20%. In the United States, the market adoption remains at 2% but is expected to increase in the coming years as all major U.S. truck manufacturers have begun offering PCC systems as shown in Table 3. The GHG HDV Phase 2 rule estimates the 2027 market adoption of PCC systems in tractor-trailers at 40%. PCC systems are currently not present in China.
The CO2 benefit of PCC in tractor trucks is estimated at 1.5% in the EU (Impact Assessment Institute, 2016) and 2% in the United States (EPA & NHTSA, 2016b). Nevertheless, these estimates are rather conservative, given that truck manufacturers’ estimates of the fuel consumption benefits of their PCC systems are between 4% and 5% (Daimler AG, 2015; Renault Trucks, 2016; Scania, 2013; Volvo Trucks, 2013).
Table 3. Predictive cruise control systems by manufacturer
Manufacturer PCC name Introduction year Market
Daimler Predictive Powertrain Control 2012 EU
Volvo I-See 2013 EU
Scania Opticruise 2014 EU
DAF – 2015 EU
MAN EfficientCruise 2015 EU
Iveco Hi-Cruise 2016 EU
Renault Optivision 2016 EU
Freightliner RunSmart 2009 US
Kenworth – 2015 US
Peterbilt – 2015 US
Volvo I-See 2016 US
International – 2016 US
Mack mDRIVE 2016 US
34
MARKET PENETRATION OF FUEL-EFFICIENCY TECHNOLOGIES FOR HDVS
3. FUTURE TECHNOLOGIES
This section presents three emerging technologies that are expected to play an important role in the improvement of the fuel efficiency of HDVs. These technologies have either very low market penetration rates or are not yet commercially available in production vehicles, but are expected to reach the market in the 2025–2030 time frame. The technologies discussed are hybrid powertrains, waste heat recovery, and high voltage architectures. The future adoption of other advanced technologies, such as fuel cell powertrains, fully electric HDVs, and hydraulic hybrids, is still uncertain. Because of the lack of available data, they will not be discussed in this section.
Hybrid electric powertrainsPowertrain electrification is one of the main levers to enable a transition to carbon-neutral transportation. Hybrid electric vehicles’ (HEV) powertrains combine a conventional internal combustion engine (ICE) with one or more electric motors. Different HEV powertrain architectures – serial, parallel and power-split – are used to couple the combustion engine with the electric drive.
In serial HEVs, also known as range-extended electric vehicles, the ICE powers an electric generator, which in turn supplies energy to the battery or the electric motors; no mechanical connection exists between the ICE and the rest of the powertrain. The main advantage of serial HEVs is that the combustion engine can be operated completely independent from the load and speed of the vehicle, and therefore can be tuned to achieve better efficiencies in a narrower operating range. However, the power demand of the vehicle needs to be satisfied completely by the electric powertrain, resulting in larger and more expensive electrical systems.
In parallel hybrids, both energy converters are coupled mechanically. Both the electric motor and the ICE contribute to power the wheels in parallel. This has the advantage of reducing the power requirement on the electric motor and battery, allowing for smaller electrical systems. On the other hand, because the engine and motor speed are uniquely determined by the vehicle speed and the transmission ratio, the engine operation point cannot be adjusted freely.
In power-split hybrids, the serial and parallel concepts are combined. In this configuration, two electric machines are necessary, which can function both as a motor or a generator. An epicyclic gear is used to mechanically couple the ICE and the electric machines, allowing the engine and motor speeds to vary independent of the vehicle speed. In this way, the vehicle speed is directly determined by the motor speed, whereas the load and speed of the combustion engine can be adjusted independently, as in the serial hybrid. Furthermore, if necessary, the ICE can provide mechanical power directly to the wheels via the epicyclic gear, as in the parallel hybrid. Despite the added versatility of power-split hybrids, the added complexity of the two electric machines, the epicyclic gear, the corresponding control algorithm, and the powertrain calibration, constrain the applicability of this hybrid configuration.
Although all three of these architectures have been applied in hybrid powertrains for LDVs, the power and torque requirements of HDVs are best served by the parallel hybrid architecture. Parallel hybrids are classified based on the location of the electric machine; Figure 21 shows the different types of parallel hybrids. P0 micro-hybrids use
35
ICCT WHITE PAPER
a belt driven starter/generator and are suitable for light commercial vehicles. P1 hybrids provide torque boosting to the engine and have a simple architecture; however, they do not allow for electric vehicle launching from standstill, do not eliminate traction interruption during shifting, and some of the energy available for regenerative braking is wasted by the engine’s friction. The decoupling of the engine and the motor by a clutch in P2 systems corrects most of the P1 disadvantages, however it does not eliminate traction interruption during shifting. In P3 systems, the electric drive is placed after the transmission. As a result, the torque conversion of the electric motor is eliminated and the electric launch and climbing capabilities are reduced; however, the traction interruption during shifting is reduced. In P4 hybrids, the electric motors are connected directly to the wheels and have advantages similar to P3 hybrids but at the cost of added system complexity. Daimler’s evaluation of the different parallel hybrid architectures favors P2 as the better fit for HDVs (Treusch, 2013).
Electric motor
ClutchGearboxDifferential ICE
P0P1P2P3
P4
Figure 21. Parallel hybrid powertrain types.
In the LDV sector, HEVs have captured a small, but measurable, share of the market accounting in 2014 for approximately 3% of new sales in the United States and 1.4% in the EU (Mock, 2015). In comparison, the hybridization efforts in trucks have been limited, in most cases, to a few short-lived small batches by different manufacturers. Table 4 presents a summary of the hybrid rigid trucks offered by OEMs in the different markets in the last decade. The first available models were introduced by Japanese manufacturers for their local market; of these, the Fuso Canter Eco-Hybrid is being commercialized in the EU and the Hino Hybrid in the United States. The hybrid portfolio of the European OEMs has been, on the other hand, more ephemeral.
36
MARKET PENETRATION OF FUEL-EFFICIENCY TECHNOLOGIES FOR HDVS
Table 4. Hybrid trucks offered by OEMs in the past 10 years
Truck Market GVW(tonne)
Engine/Motor(kW)
Battery(kWh)
Type Introduction
year
In production
Isuzu, Elf Hybrid JP*, 2005 6–9 95%/%25.5 NA P3 No
The layout and dimensioning of the electric drive components of the HD-HEVs shown in Table 4 have been optimized for taking advantage of regenerative braking and low speed electric assist. A P2 parallel configuration with a motor power rating of around 40 kW and a battery capacity of approximately 2 kWh is sufficient to capture these benefits in rigid trucks up to 12 tonnes. For vehicles with gross combination weights (including trailer) of up to 44 tonnes, the motor and battery capacities are approximately 120 kW and 5 kWh, respectively.
In long-haul operation, the fuel economy benefit of hybrid line-haul tractor-trailers is highly dependent on the grade profile of the cycle due to the low share of braking losses. A simulation based analysis of different hybrid long-haul configurations shows a potential of up to 6% improvement in fuel economy, even if the driving speed is almost constant (Lajunen, 2014). In more transient operation over the Heavy Heavy-Duty Diesel Truck (HHDDT) transient schedule, Argonne National Laboratory estimates the fuel savings of tractor-trailers at 10.3% for a P1 configuration and in 39.5% for a hybrid architecture combining the P2 and P3 parallel configurations (Delorme, Karbowski, Vijayagopal, & Sharer, 2009).
Rigid trucks in urban and regional operation have higher braking losses that can be recovered by the hybrid system. Transmission manufacturer Aisin quantifies the potential of hybridization over several city cycles as approximately 7% (Rahim, 2016). A simulation based analysis at Oak Ridge National Laboratory estimates the potential of a 16-tonne hybrid truck in comparison to its conventional counterpart in 36% over the Urban Dynamometer Driving Schedule (UDDS). In highway operation21 the fuel-consumption
21 Over the heavy heavy-duty diesel truck schedule at 65 mph (HHDDT65)
37
ICCT WHITE PAPER
benefits of hybridization are reduced to approximately 3.5% (Daw et al., 2013). On-road investigations by FPInnovations on three 12-tonne hybrid vehicles showed a reduction in fuel consumption between 14.7% and 34.4% during specific pickup and delivery cycles (Proust & Surcel, 2012). EPA and NHTSA considered hybridization within the Phase 2 HDV GHG regulation. A technology effectiveness between 23% and 26% and a technology penetration rate of 12% were estimated for vocational rigid trucks by 2027 (EPA & NHTSA, 2016b).
In this study, the fuel consumption reduction of hybrid powertrains was estimated by quantifying the amount of energy dissipated in braking over the region-specific duty cycles using vehicle simulation. By analyzing the second-by-second braking-power-dissipation rate, the post-processing algorithm calculates the share of the braking losses that can be recovered through regenerative braking based on the motor/generator nominal power, the characteristic motor/generator efficiency curve, the battery capacity, battery round-trip efficiency (charging–discharging), and state of charge boundaries. The hybrid powertrain characteristics for the rigid and tractor trucks were taken from the system specifications shown in Table 4. For tractor-trailers, hybridization could reduce fuel consumption in up to 7.3% in the EU and 4.6% in the United States over the respective long-haul cycles. For rigid trucks, the calculated potential is 14.7% over the urban delivery cycle in the EU and 25.6% over the ARB transient cycle in the United States. In China, the potential is estimated to be between 7.3% and 17.6% over the WHVC, the lower value corresponding to the rigid truck because of its lower payload.
Waste heat recoveryLarge diesel engines have a peak brake thermal efficiency between 40% and 50%. In other words, more than 50 to 60% of fuel energy is wasted, mostly in the form of heat. The hot exhaust gases and the cooling circuit carry the largest share of this wasted thermal energy with approximately 35% and 10% of the total fuel energy input, respectively (Thiruvengadam et al., 2014). Waste heat recovery (WHR) systems convert the thermal energy from the exhaust and engine coolant flows back into usable mechanical or electric energy. WHR systems use either thermo-electric generators (TEG) or a closed Rankine cycle for power generation. TEGs make use of the Seebeck effect to generate electricity from temperature differentials. The Rankine cycle, on the other hand, uses the waste thermal energy to evaporate a high-pressure liquid. The high-pressure vapor is then expanded in a mechanical device to generate work. A schematic of the working principle is shown in Figure 22.
WHR systems currently are not offered on any production vehicle. Nevertheless, Tier 1 suppliers such as Mahle (2015), BorgWarner (2016), and Eaton (2016) are developing production-ready concepts that can be integrated by OEMs within the next 5 years. In the United States, WHR systems were researched and developed by the four SuperTruck teams including OEMs such as Peterbilt/Cummins, Daimler, Navistar, and Volvo. The WHR systems proved useful to achieve the program objective of 50% brake thermal efficiency (Delgado & Lutsey, 2014).
EPA and NHTSA considered this technology within the Phase 2 HDV GHG regulation. A literature review of the fuel consumption savings of WHR systems in tractor-trailers shows a potential of between 3% and 6% (Reinhart, 2015). In the Phase 2 HDV GHG regulation, the forecast technology penetration rate in tractor trucks by 2027 is 25% (EPA & NHTSA, 2016b).
38
MARKET PENETRATION OF FUEL-EFFICIENCY TECHNOLOGIES FOR HDVS
Generator
Expander
Recuperator
Pump
Exhaustout
Air in
ICE Condenser
Evaporator
Organic working fluid
Coolant
Figure 22. Schematic of waste heat recovery system using an organic Rankine cycle.
High-voltage electric architecturesEngine and vehicle accessories consume a significant share of the work output of the engine. The accessories include the engine oil, coolant, and fuel pumps as well as the cooling fan, air compressor, and power steering. The energy demands of these systems vary significantly as a function of the duty cycle and operating point. In most cases, accessories are coupled mechanically to the output shaft of the engine and energy management is achieved through viscous clutches that engage and disengage the accessories as needed.
In passenger vehicles, many of the aforementioned accessories have been electrified in the past years. The decoupling of the engine from the accessories has resulted in fuel consumption benefits. This approach, however, is not easily translatable to HDVs due to the higher power consumption of larger accessories. The voltage of the current electric architecture of HDVs (12V or 24V) limits its applicability to systems with high power demand. Increasing the electric tension to 48V or higher would remove some of the barriers for auxiliary and accessory electrification.
High-voltage architectures currently are not offered on any production vehicle. The barriers for the technology adoption are the cost increase resulting from having two coexisting electric architectures, one at 48V and the other at 12V or 24V (TMC, 2015). Nevertheless, in the past few years, manufacturers in the automotive industry have announced efforts to integrate 48V technologies into HDVs. As an example, Volvo Trucks plans the implementation of a test vehicle in 2016 to validate the fuel consumption improvements they have measured on engine tests, up to 2.5%, and on vehicle simulations, up to 5% (Boëté, 2015).
39
ICCT WHITE PAPER
4. CONCLUSIONS
The ever-increasing amount of freight movement and the GHG emissions associated with it require a swift response from policymakers if the objectives set to curb CO2 emissions and mitigate climate impacts are to be achieved. The dominant share of on-road goods transportation in the freight modal split calls for improvements in the efficiency of heavy-duty vehicles. This report investigated individual technologies suited for this end.
The primary objective of this study was to analyze the penetration rates of fuel-saving technologies in the three biggest automotive markets: the EU, the United States, and China. The results provide better insight into the driving forces for technology adoption and their impact on fuel consumption reduction. The technologies covered in this report are not meant to represent an exhaustive list of the technological palette for fuel consumption reduction of heavy-duty vehicles. Selection of the technologies addressed in this study was based on the availability of technology penetration rates from the data provider, KGP.
Figure 23 shows the technologies applicable to EU tractor-trailers divided in four quadrants according to their 2015 market penetration and their fuel consumption reduction potential. While acknowledging that the technology potential values are a function of vehicle type, payload and duty cycle, among other parameters, the potential values presented in the following technology matrices represent either the results obtained through vehicle simulation, or the midpoint of the values found in the literature. The upper left quadrant contains the technologies that have less than 50% adoption in new vehicles and that provide more than 1% fuel economy improvements; this is the quadrant most relevant for future efficiency improvements. The upper right quadrant contains the technologies that have over 1% effectiveness, and whose potential has been partially exploited through adoption rates of more than 50% in the new vehicle fleet. Similarly, the lower left and lower right quadrants encompass technologies with less than 1% technology potential and with low and high market penetration, respectively. As can be seen in this technology matrix, most of the technologies applicable to EU tractor-trailers are in the upper left quadrant, that is, high potential and low penetration. Technologies for the reduction of the road load resistances, such as single-wide tires, side skirts, tire-pressure monitoring, and active grille shutters, have been gaining market adoption at a slow pace during the past 10 years, and gradually moving to the right of the matrix. Engine technologies for recovering unused energy in the exhaust, such as turbocompounding and waste-heat recovery, have negligible or no market presence, despite providing significant fuel economy improvements. Turbocharging technologies are strongly linked to the emission control system, such as the EGR and SCR systems. Despite the high penetration of advanced turbochargers, their potential has not yet been fully tapped, and improvements in compressor and turbine efficiencies, as well as in the turbo back pressure, are expected. It must be noted that some of the technologies presented in Figure 23 are not expected to reach full market penetration, given their strong dependence on the duty cycle. Nevertheless, most of the technologies presented in this study could be fitted to the majority of the new vehicle fleet.
40
MARKET PENETRATION OF FUEL-EFFICIENCY TECHNOLOGIES FOR HDVS
The EU rigid truck technology matrix in Figure 24 has some commonalities with its tractor-trailer counterpart, such as high the penetration rates of automated manual transmissions and advanced turbochargers. In contrast to tractor-trailers, energy management technologies such as adaptive and predictive cruise controls are not applicable due to the different duty cycles. However, other technologies that thrive in urban transient conditions, like stop/start and hybrid powertrains, gain in significance. Aerodynamic devices provide improvements when analyzed over the regional delivery cycle, but provide only negligible improvements over urban delivery mission cycles.
Compared to the EU, some key differences can be identified with the U.S. tractor-trailer technology matrix shown in Figure 25. Most notably, the market adoption of automated manual transmissions remains under the 50% threshold, whereas the penetration of trailer side skirts approximates the 50% threshold, driven by California GHG regulations and EPA’s SmartWay program. Furthermore, new technologies aimed at idle reduction during prolonged vehicle stops, such as diesel APUs, advanced APUs and off-board power, provide significant fuel economy improvements. Because of the emission control systems required to comply with U.S. regulations, high-efficiency SCR systems with low EGR rates have not yet been brought to the market. Regarding rigid trucks, the technology matrix of the United States resembles that of the EU. The two key differences are the lower adoption rate of automated manual transmissions, due to the higher uptake of automatic transmissions, and the higher potential of hybrid powertrains, due to the differences in the representative duty cycles (ARB transient in the United States, in comparison to the VECTO regional delivery in the EU).
The technology matrices for tractor-trailers and rigid trucks in China are presented in Figure 26. All the technologies considered in this study have either low market penetration or are not present at all in China. Nevertheless, the evidence points toward the initial adoption of key technologies that have been deployed largely in the EU, such as automated manual transmissions and advanced turbochargers, due to the regulatory pull of pollutant and fuel consumption standards.
41
ICCT WHITE PAPER
EU, tractor-trailer technologies
Market penetration in 2015 (%)
Variable speed fan
On-demandpumps
Active grille shutterTire pressuremonitoring
Advanced turbocharger
Hybrid powertrain
Waste heat recovery
TurbocompoundHigh efficiency SCR
High voltage architecture
Side skirtsSingle wide tires
Variable valveactuation
Predictive cruise control
Automated manualtransmission
Adaptivecruise control
Clutched aircompressor
Fue
l con
sum
pti
on r
educ
tion
pot
enti
al (
%)
(log
arit
hmic
sca
le)
10
00 50 100
1
Figure 23. Penetration rate and potential of tractor-trailer technologies in the EU.
Figure 24. Penetration rate and potential of rigid truck technologies in the EU.
42
MARKET PENETRATION OF FUEL-EFFICIENCY TECHNOLOGIES FOR HDVS
US, tractor-trailer technologies
Market penetration in 2015 (%)
Fue
l con
sum
pti
on r
educ
tion
pot
enti
al (
%)
(log
arit
hmic
sca
le)
10
00 50 100
1
US, rigid truck technologies
Market penetration in 2015 (%)
Fue
l con
sum
pti
on r
educ
tion
pot
enti
al (
%)
(log
arit
hmic
sca
le)
10
00 50 100
1
Hybrid powertrain
Hybrid powertrain (25.6%)
Advanced APU Off-board power
Advanced turbocharger
Advanced turbocharger
High efficiency SCR
High efficiency SCR
Single wide tiresDiesel APU
TurbocompoundHigh voltage architecture
High voltage architecture
Automated manualtransmission
Automated manual transmission
Predictive cruise controlVariable valve actuation
Variable valve actuation
Adaptivecruise control
Side skirts
Waste heat recovery
On-demand pumps
Variable speed fan
Variable speed fan
Clutched aircompressor
Clutched air compressor
Active grille shutter
Tire pressure monitoring
Tire pressure monitoring
Stop/start
Single wide tires
Side skirts
Active grille shutter
On-demandpumps
Figure 25. Penetration rate and potential of HDV technologies in the United States.
43
ICCT WHITE PAPER
China, tractor-trailer technologies
Market penetration in 2015 (%)
Fue
l con
sum
pti
on r
educ
tion
pot
enti
al (
%)
(log
arit
hmic
sca
le)
10
00 50 100
1
China, rigid truck technologies
Market penetration in 2015 (%)
Fue
l con
sum
pti
on r
educ
tion
pot
enti
al (
%)
(log
arit
hmic
sca
le)
10
00 50 100
1
Stop/start
Side skirts
Tire pressure monitoringActive grille shutter
Hybrid powertrain
Automated manual transmission
Advanced turbocharger
Clutched air compressor
Variable speed fan
On-demand pumps
Single wide tires
Variable valve actuation
High efficiency SCR
High voltage architecture
Hybrid powertrain (17.6%)
Predictive cruise control
Variable speed fan
Clutched air compressor
Waste heat recovery
High efficiency SCR
High voltage architectureTurbocompound
Advanced turbocharger
On-demand pumps
Active grille shutter
Tire pressure monitoring
Single wide tires
Variable valve actuation / Side skirtsAutomated manual transmission
Adaptive cruise control
Figure 26. Penetration rate and potential of HDV technologies in China.
44
MARKET PENETRATION OF FUEL-EFFICIENCY TECHNOLOGIES FOR HDVS
Policy discussionThe data presented in this paper reveal a wide range of adoption trends for efficiency technologies by the on-road freight sector in the EU, United States and China. As discussed in Section 2, certain policy drivers have affected some of the observed market penetration trends of specific technologies, mostly those related to pollutant emissions. However, market forces are likely responsible for driving the adoption of the majority of the efficiency technologies presented here.
In a perfect market, those technologies with positive payback would be rapidly taken up by all applicable commercial fleets upon introduction to the market. As shown in Figures 23–26, there are a number of available efficiency technologies with market penetration rates well below 50%. In addition, and as can be seen in the adoption curves presented in Section 2, there are technologies that have been on the market for more than 2 decades that have not reached full adoption by the relevant fleets. These trends indicate that there are market imperfections – or barriers – preventing these technologies from reaching full adoption levels within a short time frame after commercial introduction. In general, these market barriers, which have been reported on previously, fall into four main categories: technology uncertainties, split incentives, capital cost of technology, and lack of availability (Aarnink, Faber, & Boer, 2012; Roeth, Swim, Kircher, & Smith, 2013).
Technology uncertainties exist when fleet operators have doubts about the performance of a new technology. This might include uncertainty about the effectiveness, payback time, or the reliability and maintenance requirements of the new technology. This is further complicated by the fact that many fleets have different methodologies for payback time and total cost of ownership calculations, which can be influenced by fuel price volatility, first owner lifetime, and the projected resale value. Split incentives exist in cases where the technology investor is not the beneficiary of the fuel savings. This includes certain contract structures (e.g., in cases when the haulers’ savings are passed directly to the shippers) as well as ownership structures (e.g., in cases where trailers are leased). The upfront capital cost of the technology becomes a barrier when the fleet is not willing or not able to invest the initial capital to purchase the technology, even in cases when the technology has a calculated positive payback time. The capital cost barrier is especially relevant for smaller fleets that might have less access to the initial capital required. In addition, lending institutions do not normally take fuel efficiency into account when determining a loan amount. The lack of availability barrier occurs when the technology is only offered from third parties or the technology is not offered as optional or standard by all OEMs. In many cases, technologies entering the market may take a decade or more until they are offered by all OEMs and even longer until they are offered as standard equipment.
As discussed previously, numerous countries are in the process of proposing and implementing mandatory new vehicle efficiency standards to overcome these market barriers. Although most efficiency standards are technology neutral, meaning the technologies used to comply with the regulation are not prescribed, the standards mandate annual improvements in vehicle efficiency, which translates to increased market penetration of efficiency technologies. Although some of this uptake would occur without the standards in place, efficiency standards can add a level of certainty that is necessary for meeting climate and fuel consumption targets. Tracking the market penetration of key efficiency technologies can give policymakers insight into the potential that existing technologies may have to improve the new vehicle fleet in the short term.
45
ICCT WHITE PAPER
REFERENCES
Aarnink, S., Faber, J., & Boer, E. den. (2012). Market barriers to increased efficiency in the European on-road freight sector. Retrieved from http://www.theicct.org/market-barriers-increased-efficiency-european-road-freight-sector
Badain, N., Reinhart, T., Cooper, C., MacIsaac, J., & Whitefoot, J. (2015). Heavy-duty vehicle fuel saving technology analysis to support phase 2 regulations. SAE International Journal of Commercial Vehicles, 8(2), 419–432. https://doi.org/ 10.4271/2015-01-2775
Bendix. (2009). Air Brake Handbook. Elyria, OH: Bendix Commercial Vehicle Systems LLC.
Boëté, Y. (2015). 48V in Commercial Vehicles [Presentation]. Retrieved from https://www.48v-vehicles.com/volvo-on-48v-in-commercial-vehicles-mc
BorgWarner. (2016). BorgWarner’s innovative technologies drive electrification for commercial vehicle segment. Retrieved from https://www.borgwarner.com/docs/default-source/press-release-downloads/borgwarner_at_iaa_commercial_vehicles_2016_eu.pdf?sfvrsn=2
Bosteels, D., May, J., Nicol, A. J., Such, C. H., Andersson, J. D., & Sellers, R. D. (2007). Investigation of the feasibility of achieving Euro VI heavy-duty diesel emissions limits by advanced emissions controls [Presentation]. Association for Emissions Control by Catalyst and Ricardo UK Ltd. Retrieved from http://www.aecc.eu/wp-content/uploads/2016/08/070831-slides-on-the-AECC-HD-Euro-VI-engine-test-programme.pdf
Busdiecker, M. (2013). Technology potential of commercial vehicle transmissions. Presented at the Heavy Duty Vehicle Efficiency Technical Workshop: Aligning Standards Internationally, Integration of Engines and Powertrains, San Francisco, CA. Retrieved from http://www.theicct.org/sites/default/files/ICCTSlidesEatonpublic.pdf
Callahan, T., Branyon, D., Forster, A., Ross, M., & Simpson, D. (2012). Effectiveness of mechanical turbo compounding in a modern heavy-duty diesel engine. International Journal of Automotive Engineering, 3(2), 69–73. https://doi.org/ 10.20485/jsaeijae.3.2_69
Camuzeaux, J. R., Alvarez, R. A., Brooks, S. A., Browne, J. B., & Sterner, T. (2015). Influence of methane emissions and vehicle efficiency on the climate implications of heavy-duty natural gas trucks. Environmental Science & Technology, 49(11), 6402–6410. https://doi.org/10.1021/acs.est.5b00412
Chebli, E., Müller, M., Leweux, J., & Gorbach, A. (2013). Development of an exhaust-gas turbocharger for HD Daimler CV engines. Auto Tech Review, 2(3), 34–39. https://doi.org/10.1365/s40112-013-0256-4
Cloudt, R., Baert, R., Willems, F., & Vergouwe, M. (2009). SCR-only concept for heavy-duty Euro VI applications. MTZ Worldwide, 70(9), 58–63. https://doi.org/10.1007/BF03226980
Cummins. (n.d.). Secrets of Better Fuel Economy. The Physics of MPG. Retrieved from https://cumminsengines.com/uploads/docs/cummins_secrets_of_better_fuel_economy.pdf
MARKET PENETRATION OF FUEL-EFFICIENCY TECHNOLOGIES FOR HDVS
Daimler AG. (2009). Verkooprecord voor Mercedes-Benz Atego met start/stop systeem [Record sales for Mercedes-Benz Atego with start/stop system]. Retrieved from http://mediasite.daimler.com/dcmedia-belu/0-1036-1017249-31- [email protected]_3842-0-0-0-0.html
Daimler AG. (2014). The new Mercedes-Benz SLT heavy-haulage vehicle – the pinnacle of the Mercedes-Benz trucks range: High tech for heavy operations: the fascinating Actros SLT and Arocs SLT heavy-haulage vehicles. Retrieved from http://media.daimler.com/marsMediaSite/en/instance/ko/The-new-Mercedes-Benz-SLT-heavy-haulage-vehicle---the-pinnac.xhtml?oid=9918227
Daimler AG. (2015a). Mercedes-Benz Actros in the fuel duel: 1000 fuel-consumption comparison tests in Europe: more than ten percent consumption advantage over the competition. Retrieved from http://media.daimler.com/marsMediaSite/en/instance/ko.xhtml?oid=9919871
Daimler AG. (2015b). Efficiently improving efficiency: Predictive powertrain control can now be retrofitted for Mercedes-Benz trucks. Retrieved from http://media.daimler.com/marsMediaSite/en/instance/ko.xhtml?oid=9918730
Daw, C. S., Gao, Z., Smith, D. E., Laclair, T. J., Pihl, J. A., & Edwards, K. D. (2013). Simulated fuel economy and emissions performance during city and interstate driving for a heavy-duty hybrid truck. SAE International Journal of Commercial Vehicles, 6(1), 161–182. https://doi.org/10.4271/2013-01-1033
De Ojeda, W. (2010). Effect of variable valve timing on diesel combustion characteristics (SAE Technical Paper 2010-01-1124). https://doi.org/10.4271/2010-01-1124
De Ojeda, W. (2013). SuperTruck – development and demonstration of a fuel-efficient class 8 tractor & trailer (DOE merit review). Retrieved from https://energy.gov/sites/prod/files/2014/03/f13/ace059_deojeda_2013_o.pdf
Delgado, O., & Lutsey, N. (2014). The U.S. SuperTruck program: Expediting development of advanced HDV efficiency technologies. Retrieved from http://www.theicct.org/us-supertruck-program-expediting-development-advanced-hdv-efficiency-technologies
Delgado, O., & Lutsey, N. (2015). Advanced tractor-trailer efficiency technology potential in the 2020–2030 timeframe. Retrieved from http://www.theicct.org/us-tractor- trailer-efficiency-technology
Delgado, O., Miller, J., Sharpe, B., & Muncrief, R. (2016). Estimating the fuel efficiency technology potential of heavy-duty trucks in major markets around the world. Retrieved from http://www.globalfueleconomy.org/media/404893/gfei-wp14.pdf
Delgado, O., & Muncrief, R. (2015). Assessment of heavy-duty natural gas vehicle emissions: Implications and policy recommendations. Retrieved from http://www.theicct.org/assessment-heavy-duty-natural-gas-vehicle-emissions-implications-and-policy-recommendations
Delgado, O., & Muncrief, R. (2016). New study on technology potential for EU tractor trailers. Presented at the Road to Efficiency Workshop, Brussels, June 9, 2016. Retrieved from https://www.transportenvironment.org/sites/te/files/2016_06_ICCT_tech_potential_EU_Tractor-Trailer_FINAL.pdf
Delorme, A., Karbowski, D., Vijayagopal, R., & Sharer, P. (2009). Evaluation of fuel consumption potential of medium and heavy duty vehicles through modeling and simulation. Report to National Academy of Sciences, Argonne National Laboratory, Washington, DC. Retrieved from http://www.ipd.anl.gov/anlpubs/2010/05/66884.pdf
Delorme, A., Robert, J. L., Hollowell, W. E., Strobel, A. M., & Krajewski, J. T. (2014). Fuel economy potential of advanced AMT ecoast feature in long-haul applications (SAE Technical Paper 2014-01-2324). https://doi.org/10.4271/2014-01-2324
Deng, J., & Stobart, R. (2009). BSFC investigation using variable valve timing in a heavy duty diesel engine (SAE Technical Paper 2009-01-1525). https://doi.org/10.4271/ 2009-01-1525
Detroit Diesel. (2009). Detroit Diesel DD15 wins TWNA technical achievement award. Retrieved from https://demanddetroit.com/our-company/media/press-releases/detroit-diesel-dd15-wins-twna-technical-2009-05-14
Dimopoulos Eggenschwiler, P., & Schreiber, D. (2015). Investigation of the oxidation behavior of soot in diesel particle filter structures (SAE Technical Paper 2015-24-2516). https://doi.org/10.4271/2015-24-2516
Eaton. (2014). Eaton launches new line of medium duty dual clutch transmissions with industry-leading fuel efficiency, performance and driveability features. Retrieved from http://m.eaton.com/Eaton/OurCompany/NewsEvents/NewsReleases/PCT_1134820
Eaton. (2016). Eaton showcasing waste heat recovery system concepts to improve fuel economy, reduce emissions. Retrieved from http://www.roadranger.com/Eaton/OurCompany/NewsEvents/NewsReleases/PCT_2841913?ssSourceSiteId=rr
Ehleskog, M., Gjirja, S., & Denbratt, I. (2009). Effects of high injection pressure, EGR and charge air pressure on combustion and emissions in an HD single cylinder diesel engine. SAE International Journal of Engines, 2(2), 341–354. https://doi.org/ 10.4271/2009-01-2815
Engström, J. (2016). CO2 reduction for long distance transport – Final report. Retrieved from http://cordis.europa.eu/result/rcn/187904_en.html
Faber, F., Jonkers, E., van Noort, M., Benmimoun, M., Pütz, A., Metz, B., … & Malta, L. (2012). SP6 D6.5 D6.6 Final results: Impacts on traffic efficiency and environment. Retrieved from https://www.chalmers.se/safer/EN/publications/traffic-safety-analysis/2012/sp6-d6-5-d6-6-final
Greszler, A. (2008). Diesel turbo-compound technology. Presented at the ICCT/NESCCAF Workshop Improving the Fuel Economy of Heavy-Duty Fleets II, February 20, 2008, San Diego, CA. Retrieved from http://www.nescaum.org/documents/improving-the-fuel-economy-of-heavy-duty-fleets-1/greszler_volvo_session3.pdf
Härdtle, W., & Wallner, S. (2015). Truck dual clutch transmission Traxon Dual from ZF. MTZ Worldwide, 76(4), 14–17. https://doi.org/10.1007/s38313-014-1026-7
He, G., & Xie, H. (2015). Fuel saving potential of different turbo-compounding systems under steady and driving cycles. (SAE Technical Paper 2015-01-0878). https://doi.org/10.4271/2015-01-0878
MARKET PENETRATION OF FUEL-EFFICIENCY TECHNOLOGIES FOR HDVS
Henry, M. (2014). Euro VI product experience. Cummins Emission Solutions Journal, (2). Retrieved from http://ces.cumminsnewsletters.com/2014-09/euro-vi-product-experience
Impact Assessment Institute. (2016). Study on the European Commission impact assessment on CO2 emissions from heavy-duty vehicles (No. IAI-HDCO2-160118f). Retrieved from http://www.impactassessmentinstitute.org/hdv-co2-study
Idicheria, C. A., & Pickett, L. M. (2005). Soot formation in diesel combustion under high-EGR conditions (SAE Technical Paper 2001-051-3834). https://doi.org/10.4271/2005-01-3834
Ivarsson, M., Åslund, J., & Nielsen, L. (2010). Impacts of AMT gear-shifting on fuel optimal look ahead control (SAE Technical Paper 2010-01-0370). https://doi.org/10.4271/2010-01-0370
Iveco. (2016). Iveco HI-SCR system – the most efficient Euro VI technology. Retrieved from http://www.iveco.com/uk/press-room/release/Pages/Iveco-HI-SCR-system---the-most-efficient-Euro-VI-technology.aspx
Jääskeläinen, H., & Khair, M. K. (2016). Exhaust gas recirculation. Retrieved from https://www.dieselnet.com/tech/engine_egr.php
Jiao, Y. (2015). Euro VI HDD engine technology overview (Presentation). Retrieved from https://www.scribd.com/document/303142063/HD-ENGINE-Euro-VI-Technology-RoadMap
Johnson, T. (2016). Vehicular emissions in review. SAE International Journal of Engines, 9(2), 1258-1275. https://doi.org/10.4271/2016-01-0919
Kant, M., Romagnoli, A., Mamat, A. M., & Martinez-Botas, R. F. (2014). Heavy-duty engine electric turbocompounding. Proceedings of the Institution of Mechanical Engineers, Part D: Journal of Automobile Engineering. https://doi.org/10.1177/0954407014547237
Kock, P., Ordys, A., Collier, G., & Weller, R. (2013). Intelligent predictive cruise control application analysis for commercial vehicles based on a commercial vehicles usage study. SAE International Journal of Commercial Vehicles, 6(2), 598–603. https://doi.org/10.4271/2013-01-9022
Kshirsagar, C. (2015). System level modeling and optimization of fuel cell powered auxiliary power unit (APU) to be used in commercial vehicles (SAE Technical Paper 2015-26-0116). https://doi.org/10.4271/2015-26-0116
Kuthada, T., & Wiedemann, J. (2008). Investigations in a cooling air flow system under the influence of road simulation (SAE Technical Paper 2008-01-0796). https://doi.org/10.4271/2008-01-0796
Lajunen, A. (2014). Fuel economy analysis of conventional and hybrid heavy vehicle combinations over real-world operating routes. Transportation Research Part D: Transport and Environment, 31, 70–84. https://doi.org/10.1016/j.trd.2014.05.023
Larsson, L., & Martini, H. (2009). Aerodynamic drag reduction of a heavy truck with variable cooling air intake area. Chalmers University of Technology. Retrieved from http://studentarbeten.chalmers.se/publication/133663-aerodynamic-drag-reduction-of-a-heavy-truck-with-variable-cooling-air-intake-area
Leibrock, A. (2015). How the trucking industry can save billions of gallons of fuel per year. Retrieved from http://www.sustainableamerica.org/blog/tse
Lim, H. (2003). Study of exhaust emissions from idling heavy duty diesel trucks and commercially available idle reducing devices (SAE Technical Paper 2003-01-0288). https://doi.org/10.4271/2003-01-0288
Liu, J. (2013). High efficiency SCR for new technology diesel engines. Presented at the ERC 2013 Engine Symposium, 5-6 June, 2013, Madison, WI. Retrieved from https://www.erc.wisc.edu/documents/symp13-Liu.pdf
Lockridge, D. (2011). Fans and fuel. HDT Truckinginfo. Retrieved from http://www.truckinginfo.com/blog/all-thats-trucking/story/2011/10/fans-and-fuel.aspx
Mahle. (2015). Mahle invests in future technologies to reduce CO2: Acquisition of Amovis GmbH. Retrieved from http://www.mahle.com/mahle/en/news-and-press/press-releases/mahle-invests-in-future-technologies-to-reduce-co2--acquisition-of-amovis-gmbh-19648
Maritati, M. (2013). EURO VI technologies & strategies (Presentation). IVECO. Retrieved from http://ibb.iveco.com/Lists/Markets/Attachments/59/EURO%20VI.pdf
Maunula, T., Viitanen, A., Kinnunen, T., & Kanniainen, K. (2013). Design of durable vanadium-SCR catalyst systems for heavy-duty diesel applications (SAE Technical Paper 2013-26-0049). https://doi.org/10.4271/2013-26-0049
Mitsubishi Fuso Truck and Bus Corporation. (2012). Duonic dual-clutch transmission wins technical development award in 62nd JSAE Awards. Retrieved from http://www.mitsubishi-fuso.com/en/press/120419/120419.html
Mock, P. (2015). European vehicle market statistics, 2015/2016. Retrieved from http://www.theicct.org/european-vehicle-market-statistics-2015-2016
Mock, P. (2016). European vehicle market statistics, 2016/2017. Retrieved from http://www.theicct.org/european-vehicle-market-statistics-2016-2017
Morgan, R., Banks, A., Auld, A., Heikal, M., & Lenartowicz, C. (2015). The benefits of high injection pressure on future heavy duty engine performance (SAE Technical Paper 2015-24-2441). https://doi.org/10.4271/2015-24-2441
Muncrief, R., & Sharpe, B. (2015). Overview of the heavy-duty vehicle market and CO2 emissions in the European Union. Retrieved from http://www.theicct.org/overview-heavy-duty-vehicle-market-and-co2-emissions-european-union
North American Council for Freight Efficiency. (2013). Tire pressure systems – Confidence report. Retrieved from http://nacfe.org/wp-content/uploads/2014/01/TPS-Detailed-Confidence-Report1.pdf
North American Council for Freight Efficiency. (2014). Confidence report: Idle-reduction solutions. Retrieved from http://carbonwarroom.com/sites/default/files/reports/Idle-Reduction_Confidence_Report.pdf
MARKET PENETRATION OF FUEL-EFFICIENCY TECHNOLOGIES FOR HDVS
North American Council for Freight Efficiency. (2015). Confidence report: Low rolling resistance tires. Retrieved from http://www.truckingefficiency.org/sites/truckingefficiency.org/files/reports/TE.org_LRRD_full_report-.pdf
North American Council for Freight Efficiency. (2016a). 2016 annual fleet fuel study. Retrieved from http://www.truckingefficiency.org/sites/truckingefficiency.org/files/reports/NACFE%202016%20Annual%20Fleet%20Fuel%20Study%20FINAL%20Report%20082316_0.pdf
North American Council for Freight Efficiency. (2016b). Confidence report on trailer aerodynamic device solutions. Retrieved from http://truckingefficiency.org/sites/truckingefficiency.org/files/reports/TE_Trailer_Aero_CR_FINALFINAL.pdf
Ottinger, N., Veele, R., Xi, Y., & Liu, Z. G. (2016). Conversion of short-chain alkanes by vanadium-based and Cu/zeolite SCR catalysts. SAE International Journal of Engines, 9(2), 1241-1246. https://doi.org/10.4271/2016-01-0913
Paterra, D. (2014). Optimizing cooling and air systems for increased efficiencies. Retrieved from http://articles.sae.org/13066
Patten, J., McAuliffe, B., Mayda, W., & Tanguay, B. (2012). Review of aerodynamic drag reduction devices for heavy trucks and buses. National Research Council of Canada. Retrieved from http://www.tc.gc.ca/media/documents/programs/AERODYNAMICS_REPORT-MAY_2012.pdf
Phapale, S., Kommareddy, P., Sindgikar, P., & Jadhav, N. (2015). Optimization of commercial vehicle cooling package for improvement of vehicle fuel economy (SAE Technical Paper 2015-01-1349). https://doi.org/10.4271/2015-01-1349
Proust, A., & Surcel, M.-D. (2012). Evaluation of class 7 diesel-electric hybrid trucks (SAE Technical Paper 2012-01-1987). https://doi.org/10.4271/2012-01-1987
Quinnell, C. (2015). Advanced simulation aids heavy-truck aerodynamics. SAE Off-Highway Engineering. Retrieved from http://articles.sae.org/14305
Rahim, N. S. (2016). North American market experiences for class 5 hybrid box truck (SAE Technical Paper 2016-01-0414). https://doi.org/10.4271/2016-01-0414
Reinhart, T. (2015). Commercial medium- and heavy-duty truck fuel efficiency technology study – Report #1 (Report No. DOT HS 812 146). National Highway Traffic Safety Administration. Retrieved from https://www.nhtsa.gov/sites/nhtsa.dot.gov/files/812146-commercialmdhd-truckfuelefficiencytechstudy-v2.pdf
Reinhart, T. (2016). EGR technology for heavy-duty China VI. Presented at the China Diesel Summit, November 17–18, 2016.
Renault Trucks. (2016). New Renaut trucks T: Lower consumption, higher payload. Retrieved from http://corporate.renault-trucks.com/en/press-releases/2016-03-16_new_renault_trucks_t_range.html
Roeth, M., Swim, R., Kircher, D., & Smith, J. (2013). Barriers to adoption of fuel-efficiency technologies in the North American on-road freight sector. Retrieved from http://www.theicct.org/hdv-technology-market-barriers-north-america
Scania. (2001). Scania reinforces its market position. Retrieved from https://www.scania.com/group/en/scania-reinforces-its-market-position
Scania. (2013). Spectacular fuel savings – Scania Opticruise with performance modes. Retrieved from https://www.scania.com/group/en/spectacular-fuel-savings-scania-opticruise-with-performance-modes
Scania. (2014). New 450 hp engine with SCR only. Retrieved from https://www.scania.com/group/en/new-450-hp-engine-with-scr-only
Schneider, S., & Naujoks, S. (2016). Variable valve timing of intake valves of a heavy-duty diesel engine as a way to improve fuel consumption. In M. Bargende, H.-C. Reuss, & J. Wiedemann (Eds.), 16. Internationales Stuttgarter Symposium (pp. 705–720). Springer Fachmedien, Wiesbaden. https://doi.org/10.1007/978-3-658-13255-2_52
Schultheiss, G., Edwards, S., Banzhaf, M., & Mersch, T. (2012). Visco coolant pump – Demand-based flow rate control (SAE Technical Paper 2012-01-1043). https://doi.org/10.4271/2012-01-1043
Sharpe, B., Clark, N., & Lowell, D. (2013). Trailer technologies for increased HDV efficiency. Retrieved from http://www.theicct.org/trailer-technologies-increased-hdv-efficiency
Sharpe, B., & Muncrief, R. (2015). Literature review: Real-world fuel consumption of heavy-duty vehicles in the United States, China, and the European Union. Retrieved from http://www.theicct.org/literature-review-real-world-fuel-consumption-heavy-duty-vehicles-united-states-china-and-european
Sharpe, B., & Roeth, M. (2014). Costs and adoption rates of fuel-saving technologies for trailers in the North American on-road freight sector. Retrieved from http://www.theicct.org/costs-and-adoption-rates-fuel-saving-trailer-technologies
Singh, N., Rutland, C. J., Foster, D. E., Narayanaswamy, K., & He, Y. (2009). Investigation into different DPF regeneration strategies based on fuel economy using integrated system simulation (SAE Technical Paper 2009-01-1275). https://doi.org/10.4271/2009-01-1275
Sjöblom, J. (2014). Combined effects of late IVC and EGR on low-load diesel combustion. SAE International Journal of Engines, 8(1), 60–67. https://doi.org/10.4271/2014-01-2878
Stephens, R. G., & Babinsky, H. (2016). An experimental study on truck side-skirt flow. SAE International Journal of Passenger Cars – Mechanical Systems, 9(2), 625–637. https://doi.org/10.4271/2016-01-1593
Storey, J. M. E., Thomas, J. F., Lewis, S. A., Dam, T. Q., Edwards, K. D., DeVault, G. L., & Retrossa, D. J. (2003). Particulate matter and aldehyde emissions from idling heavy-duty diesel trucks (SAE Technical Paper 2003-01-0289). https://doi.org/10.4271/2003-01-0289
Thiruvengadam, A., Pradhan, S., Thiruvengadam, P., Besch, M., Carder, D., & Delgado, O. (2014). Heavy-duty vehicle diesel engine efficiency evaluation and energy audit. Retrieved from http://www.theicct.org/heavy-duty-vehicle-diesel-engine-efficiency-evaluation-and-energy-audit
Technology & Maintenance Council. (2015). Exploring the potential for 48-volt commercial vehicle electrical systems: Changing the electrical/electronic face of trucking (Future Truck Committee Information Report: 2015-3). Retrieved from http://www.trucking.org/ATA%20Docs/About/Organization/TMC/Documents/Position%20Papers/Future%20Truck%20Information%20Reports/TMC_IR_2015_3.pdf
MARKET PENETRATION OF FUEL-EFFICIENCY TECHNOLOGIES FOR HDVS
Treusch, S. C. (2013). Hybrid at Daimler Trucks – Technology for the world. Presented at 4. Fachtagung Hybridantriebe für mobile Antriebmaschinen, Karlsruhe, 20 February 2013. Retrieved from https://www.fast.kit.edu/download/DownloadsMobima/Veroeffentlichung_Hybridtagung_Daimler_Treusch_22022013.pdf
Tsugawa, S., Jeschke, S., & Shladover, S. E. (2016). A review of truck platooning projects for energy savings. IEEE Transactions on Intelligent Vehicles, 1(1), 68–77. https://doi.org/10.1109/TIV.2016.2577499
U.S. Environmental Protection Agency and National Highway Traffic Safety Administration. (2016a). Final rule: Greenhouse gas emissions and fuel efficiency standards for medium- and heavy-duty engines and vehicles-Phase 2. Retrieved from https://www.epa.gov/regulations-emissions-vehicles-and-engines/ final-rule-greenhouse-gas-emissions-and-fuel-efficiency
U.S. Environmental Protection Agency and National Highway Traffic Safety Administration. (2016b). Final rule: Greenhouse gas emissions and fuel efficiency standards for medium- and heavy-duty engines and vehicles-Phase 2. Regulatory impact analysis. Retrieved from https://www.epa.gov/regulations-emissions-vehicles-and-engines/final-rule-greenhouse-gas-emissions-and-fuel-efficiency
van Zyl, S., van Goethem, S., Kanarachos, S., Rexeis, M., Hausberger, S., & Smokers, R. (2013). Study on tyre pressure monitoring systems (TPMS) as a means to reduce light commercial and heavy-duty vehicles fuel consumption and CO2 emissions (Report No. TNO 2013 R10986). Retrieved from http://advantagepressurepro.com/FileDownload.asp?PageDetailId=214
Voith Turbo. (2014). Voith’s two-stage air compressors – increased power and reduced fuel consumption. Retrieved from http://www.prnewswire.com/news-releases/ voiths-two-stage-air-compressors---increased-power-and-reduced-fuel-consumption- 278793471.html
Volvo Group. (2016). Volvo uses knowledge gained from SuperTruck to increase efficiency, performance in 2017 powertrain lineup. Retrieved from http://www.volvogroup.com/en-en/news/2016/apr/news-151760.html
Volvo Group. (2017). [Annual reports]. Retrieved from http://www.volvogroup.com/ en-en/investors/reports-and-presentations/annual-reports.html
Volvo Trucks. (2001). Volvo Trucks invests SEK 5.5 billion in new heavy truck range. Retrieved from http://www.volvotrucks.com/en-en/news-stories/press-release.html?pubid=20
Volvo Trucks. (2013). New I-See gives faster fuel saving. Retrieved from http://www.volvogroup.com/en-en/news/2013/feb/news-139723.html
Volvo Trucks. (2014). Volvo Trucks launches a unique gearbox for heavy vehicles. Retrieved from http://www.volvotrucks.com/en-en/news-stories/press-release.html?pubid=17839
Volvo Trucks. (2016). Volvo uses knowledge gained from SuperTruck to increase efficiency, performance in 2017 powertrain lineup. Retrieved from http://www.volvotrucks.us/about-volvo/news-and-events/knowledge-gained-from-supertruck-to-increase-efficiency-performance-in-2017-powertrain-lineup
Wabco. (2016). WABCO and Cummins enter into new long-term agreement to manufacture and supply air compressors for markets globally; Contract expands scope of existing joint venture based in United States. Retrieved from http://www.wabco-auto.com/media/media-center/press-releases/press-releases-single-view/news-article/wabco-and-cummins-enter-into-new-long-term-agreement-to-manufacture-and-supply-air-compressors-for-m
Windover, P. R., Owens, R. J., Levinson, T. M., & Laughlin, M. D. (2015). Stop and restart effects on modern vehicle starting system components: Longevity and economic factors. Retrieved from https://anl.app.box.com/s/sfwulyouom8cllqwzqhg07ecc99y5m7z
Wright, G. (2015). Fundamentals of medium/heavy duty diesel engines. Burlington, MA: Jones & Bartlett Learning.
Zhang, J., & Ioannou, P. (2004). Control of heavy-duty trucks: Environmental and fuel economy considerations (California PATH Research Report UCB-ITS-PRR-2004-15). Retrieved from http://escholarship.org/uc/item/3qt9440g
Zhang, X., Yang, B., Tan, G., Mei, B., Li, Z., Yang, Z., & Wang, C. (2016). Modeling and analyzing for hydraulic-driven cooling system of heavy duty truck (SAE Technical Paper 2016-01-0222). https://doi.org/10.4271/2016-01-0222
Zhenhai, G., & Wei, Y. (2016). A headway control algorithm for ACC vehicles with the compensation of the preceding vehicle acceleration. Procedia Engineering, 137, 669–679. https://doi.org/10.1016/j.proeng.2016.01.304


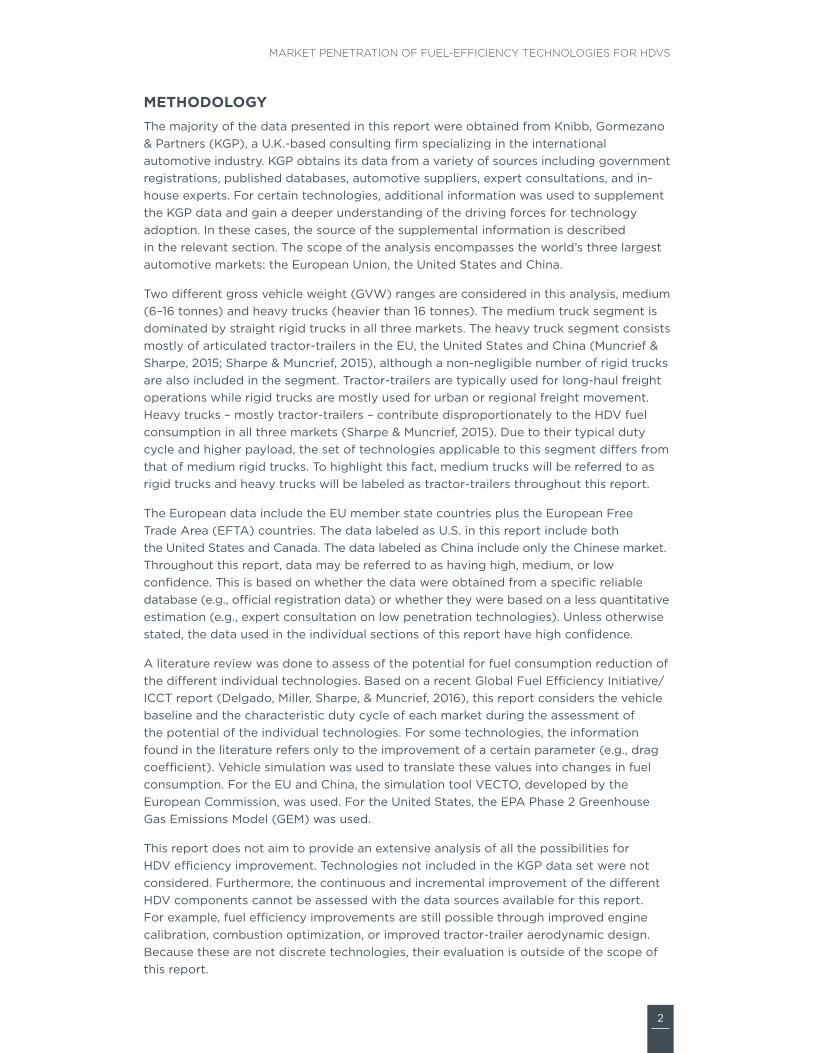
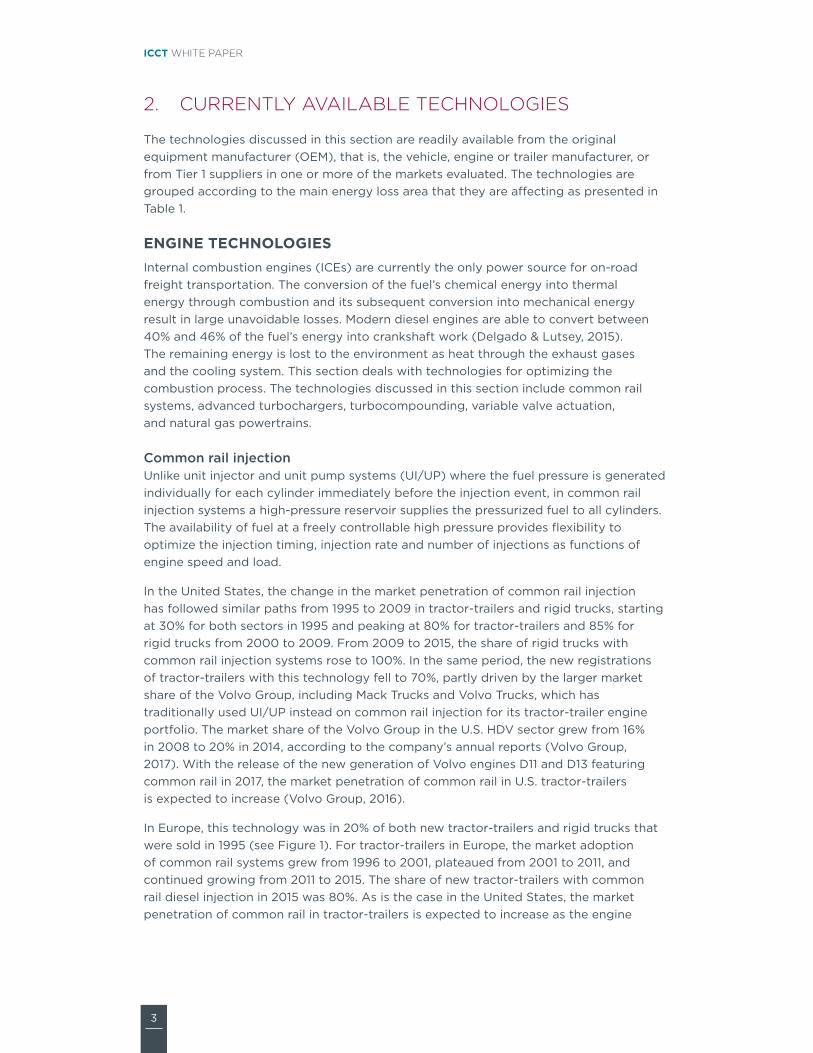
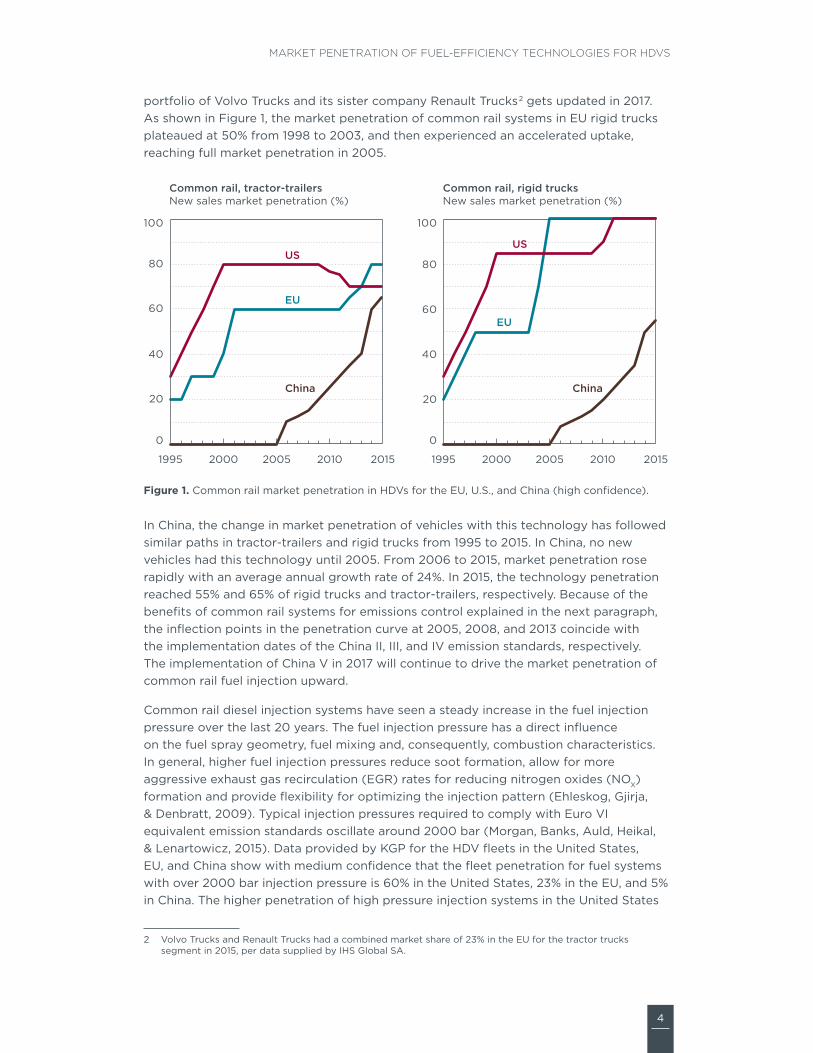

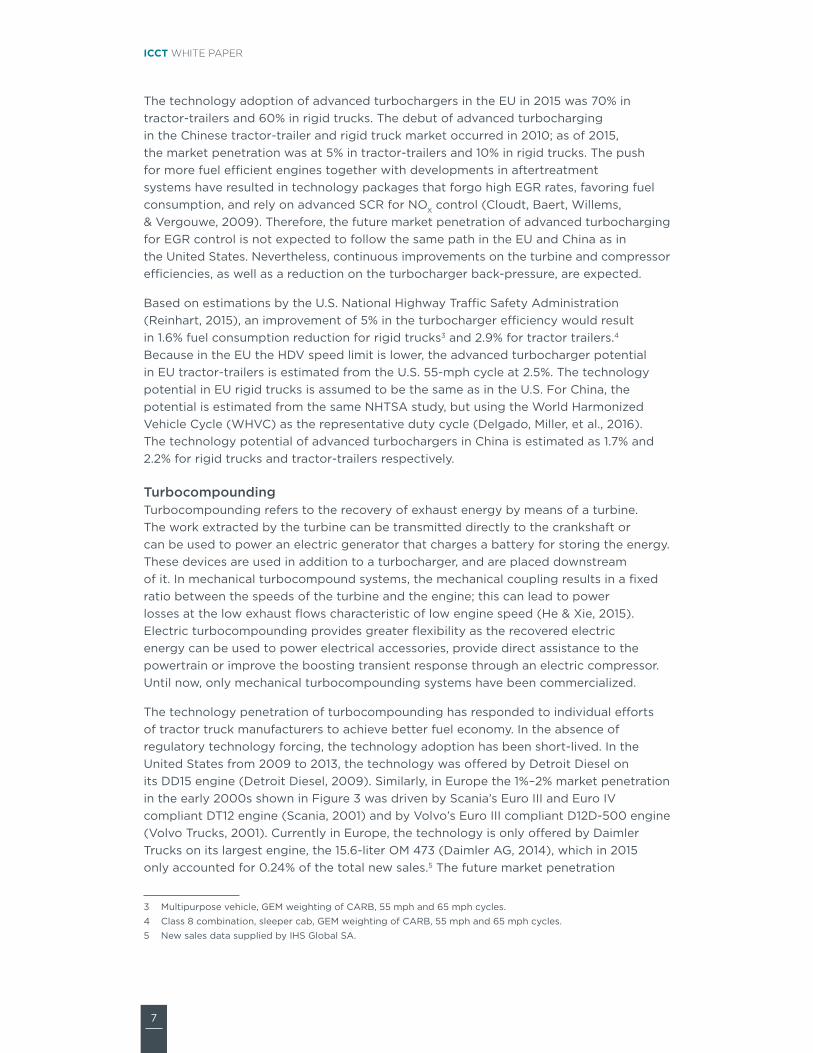


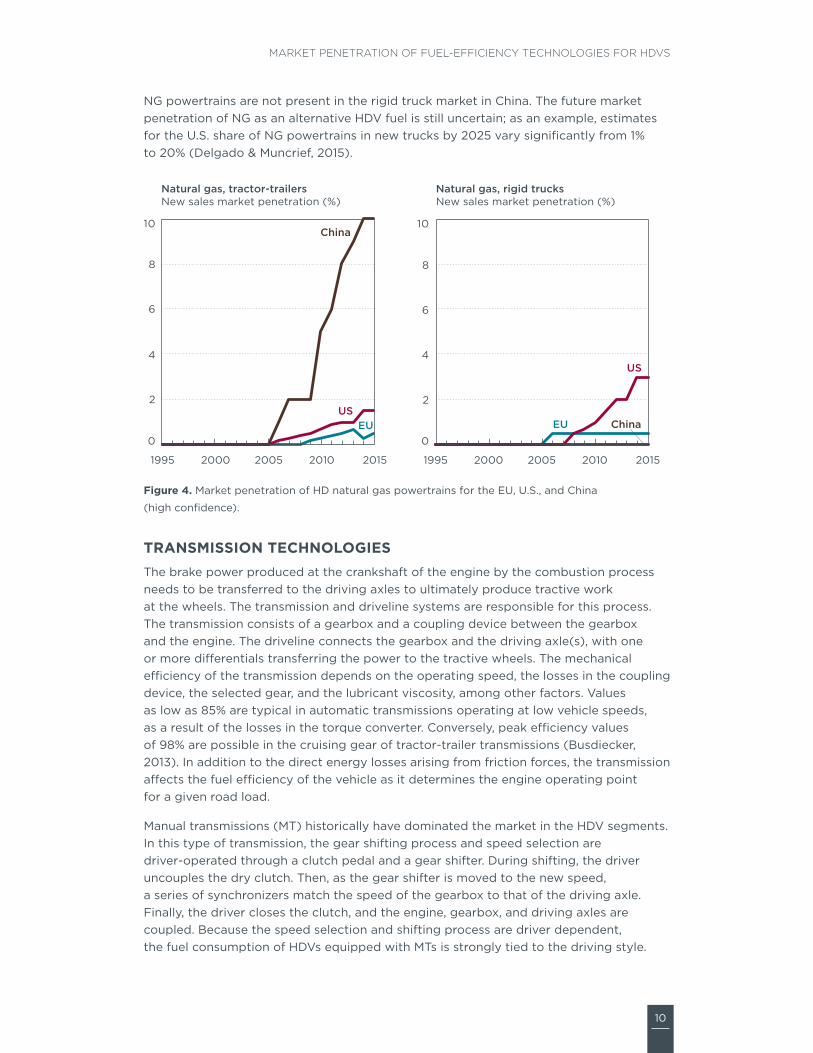
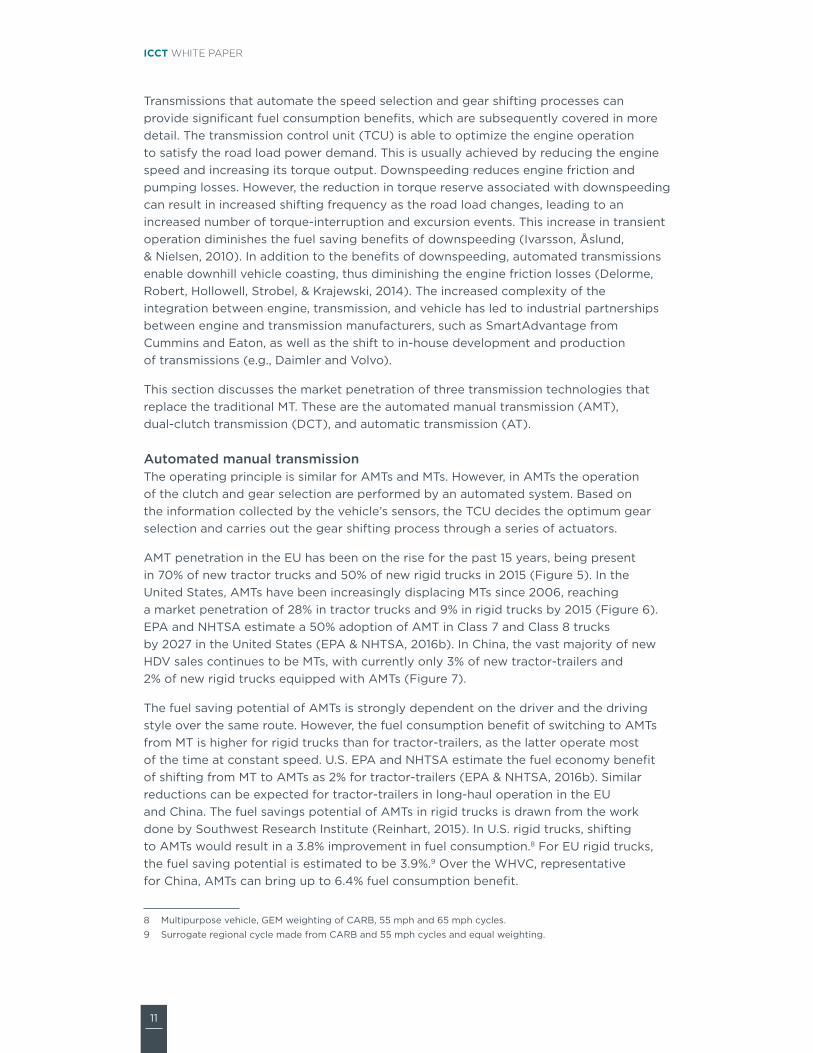
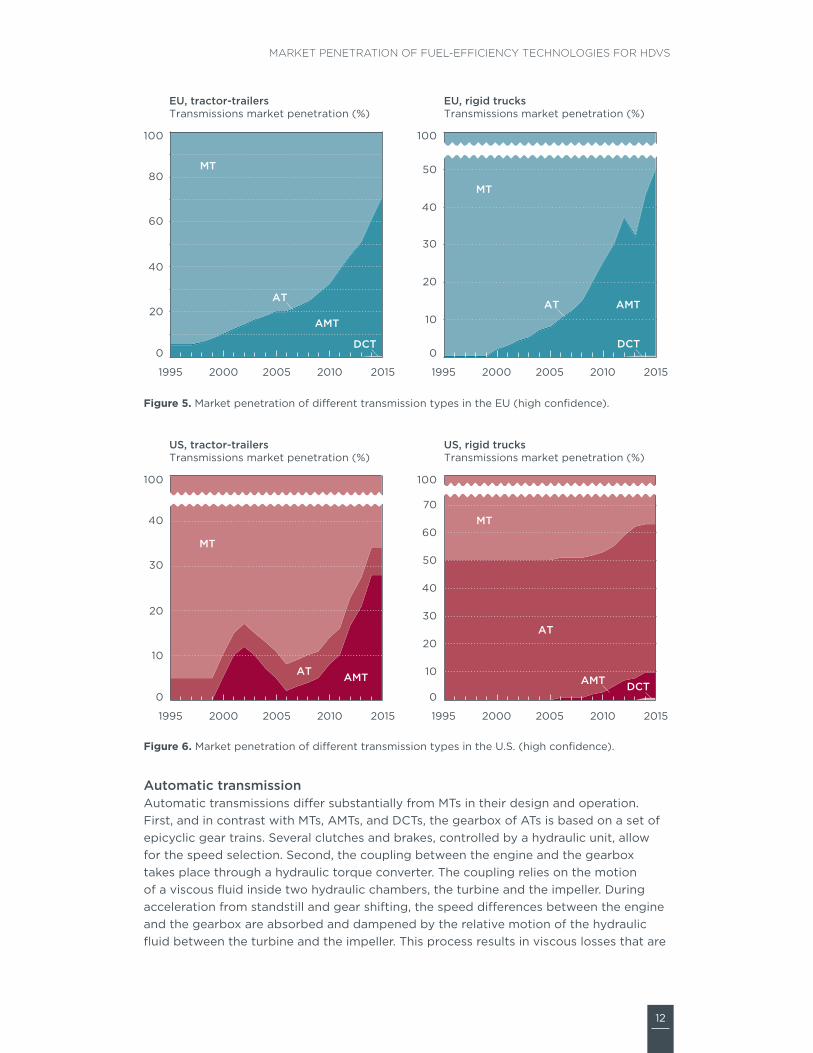
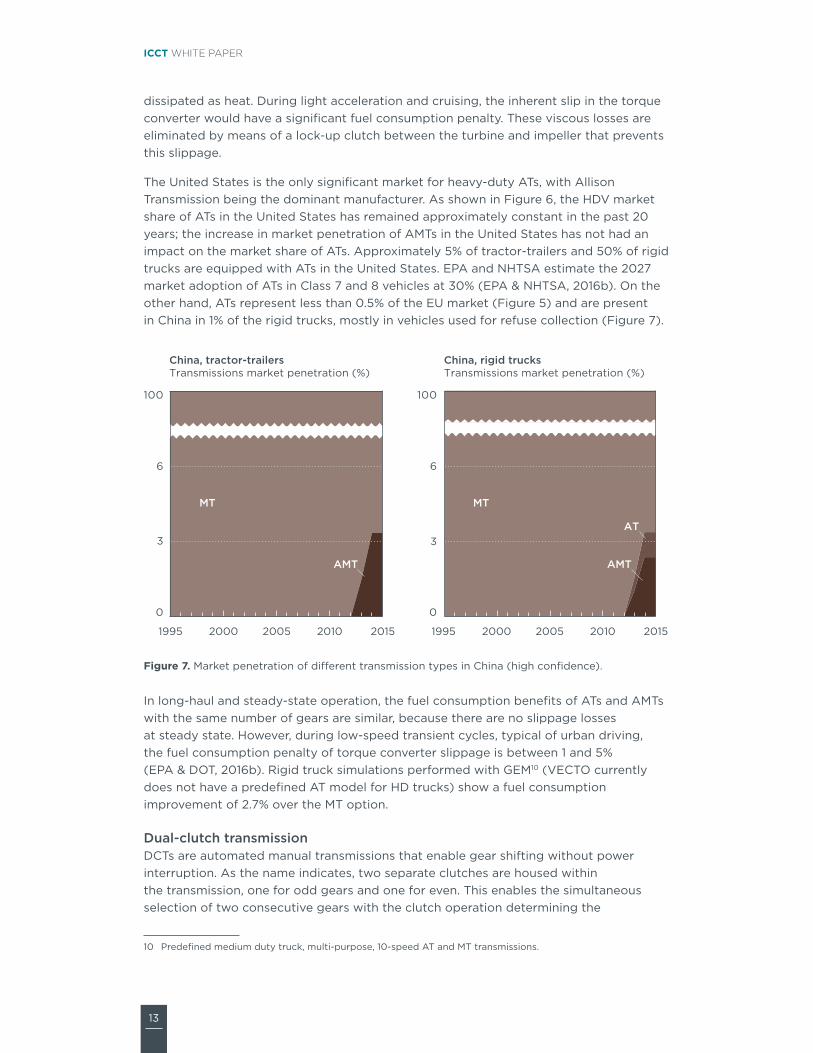
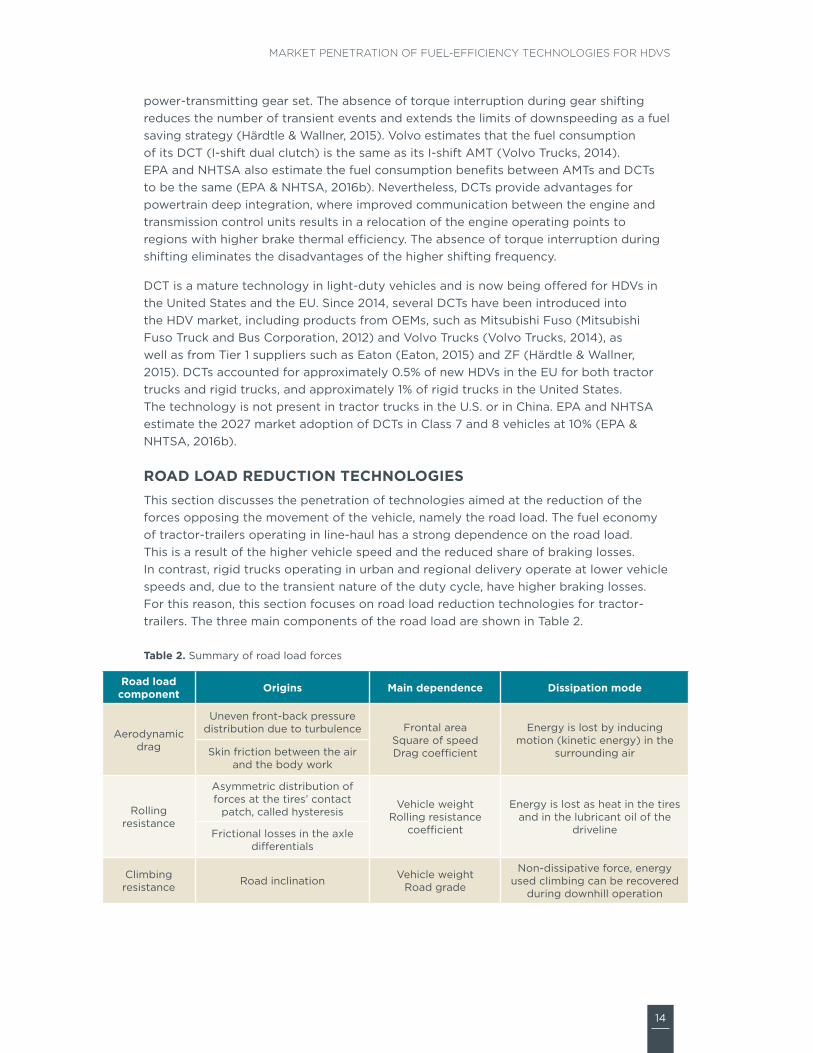

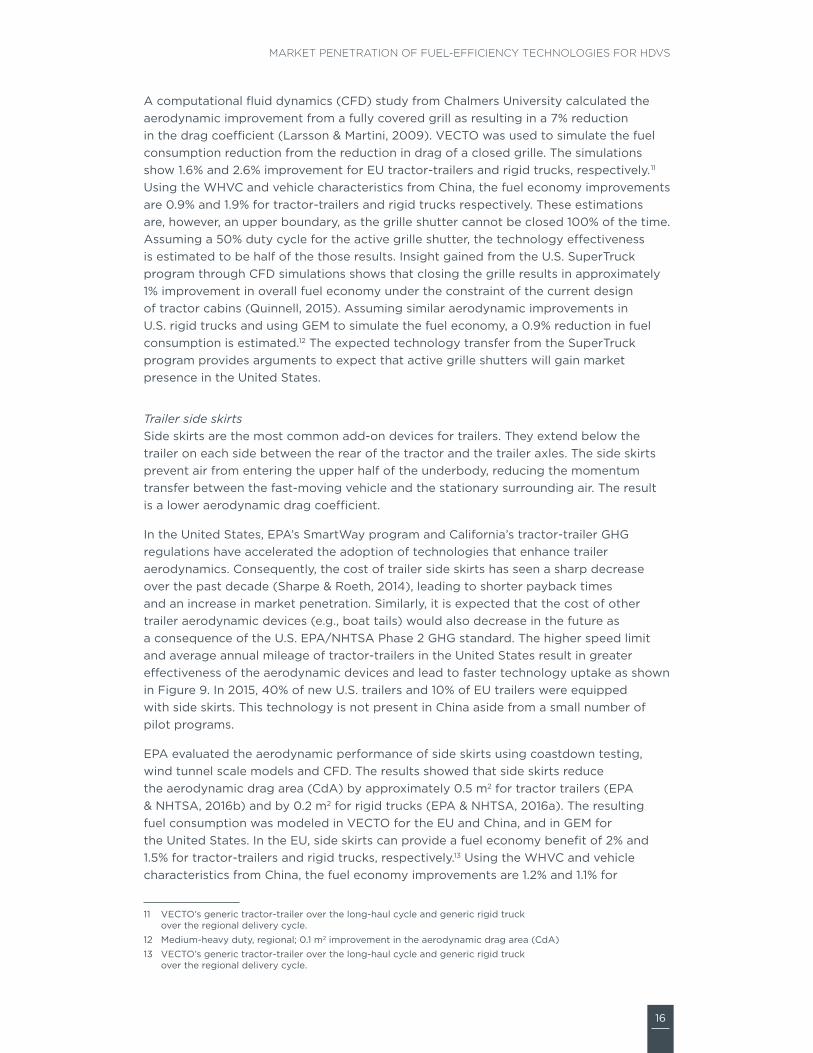


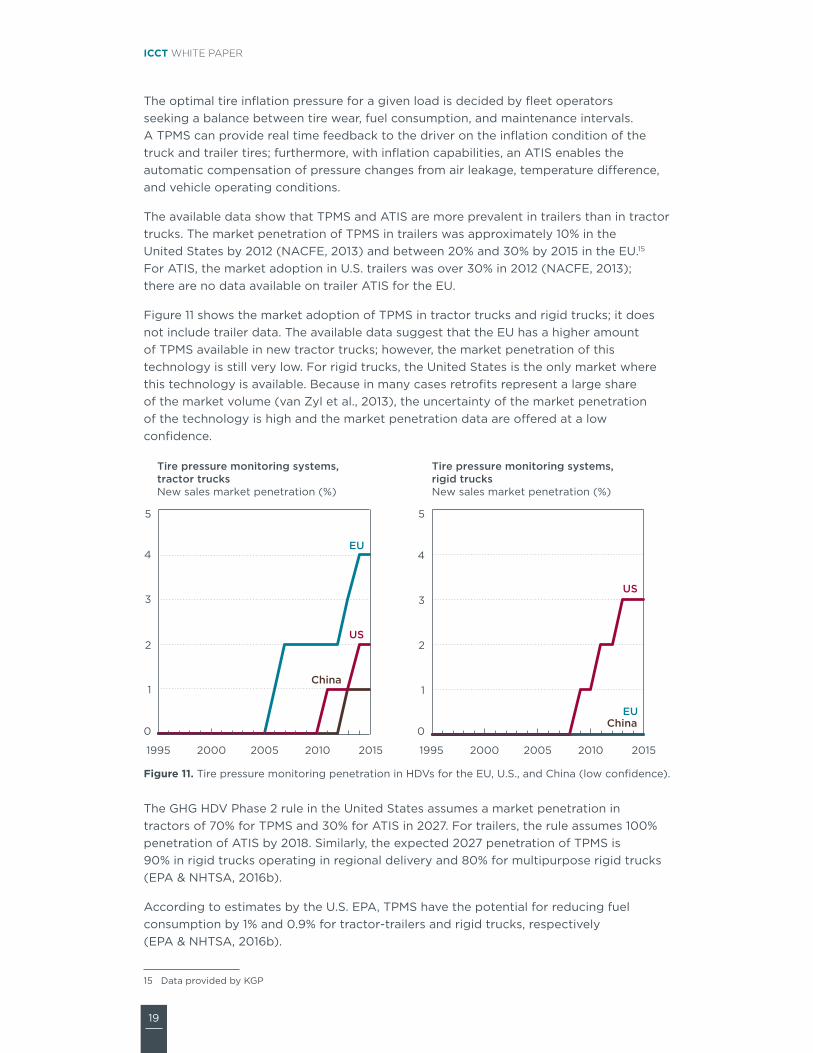

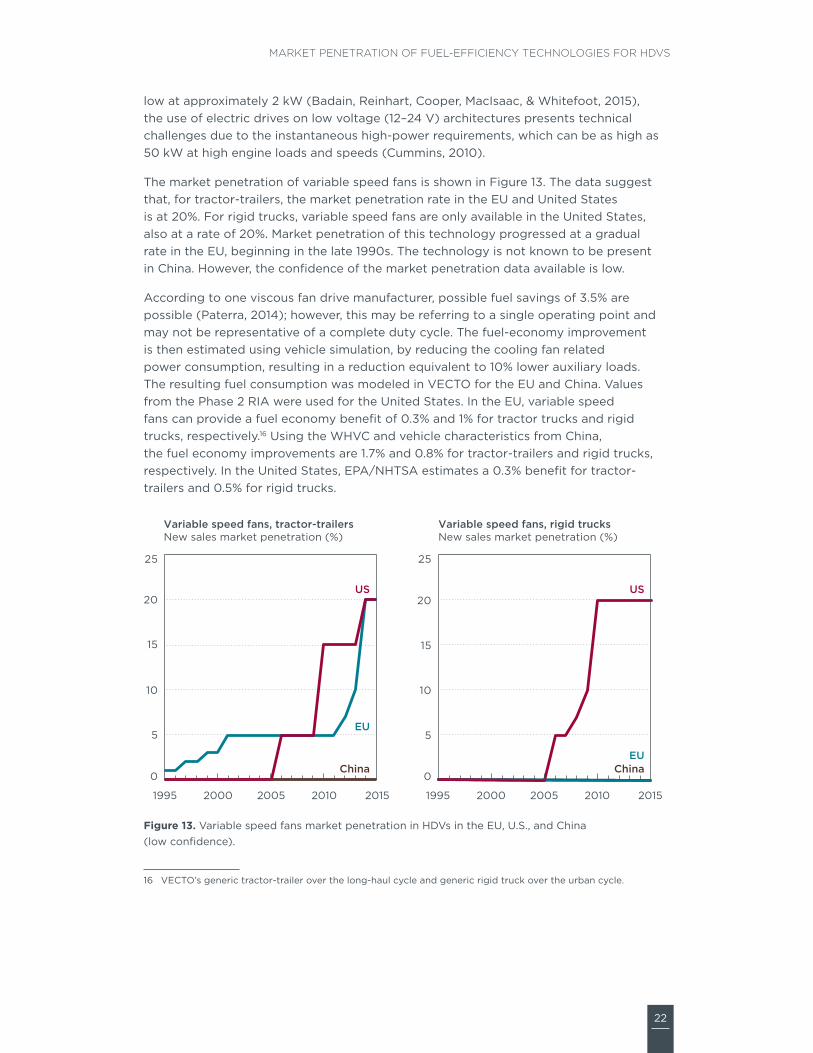


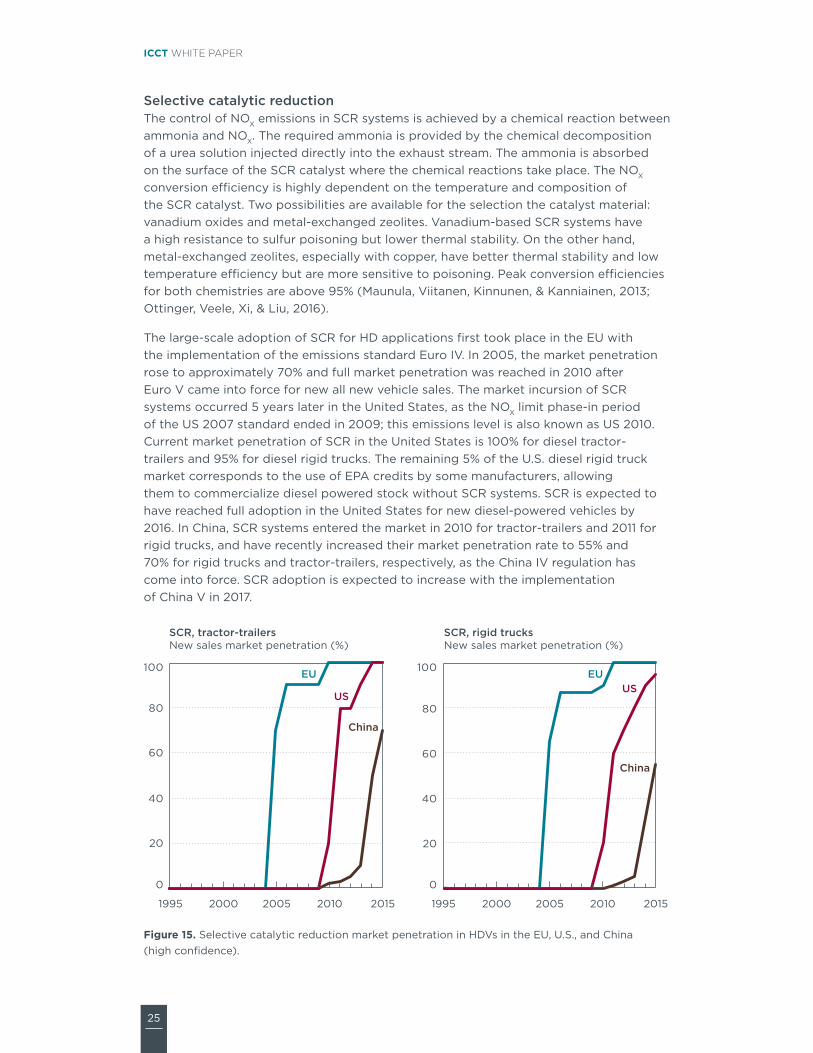

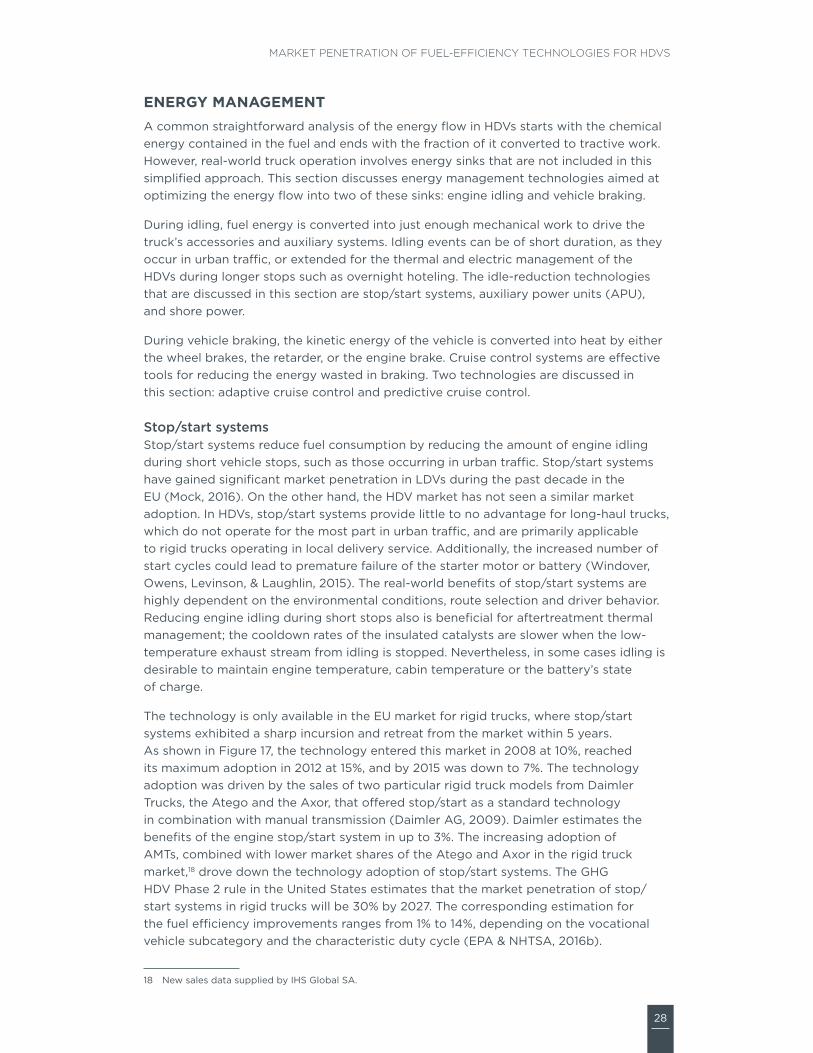
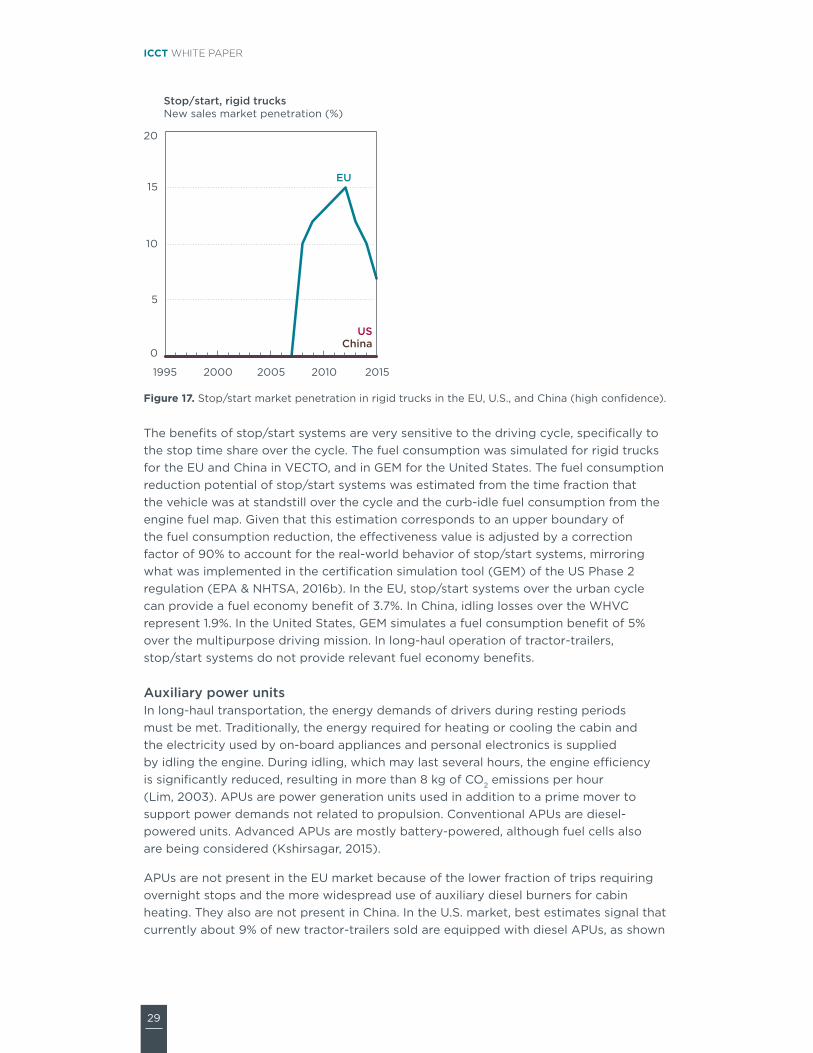


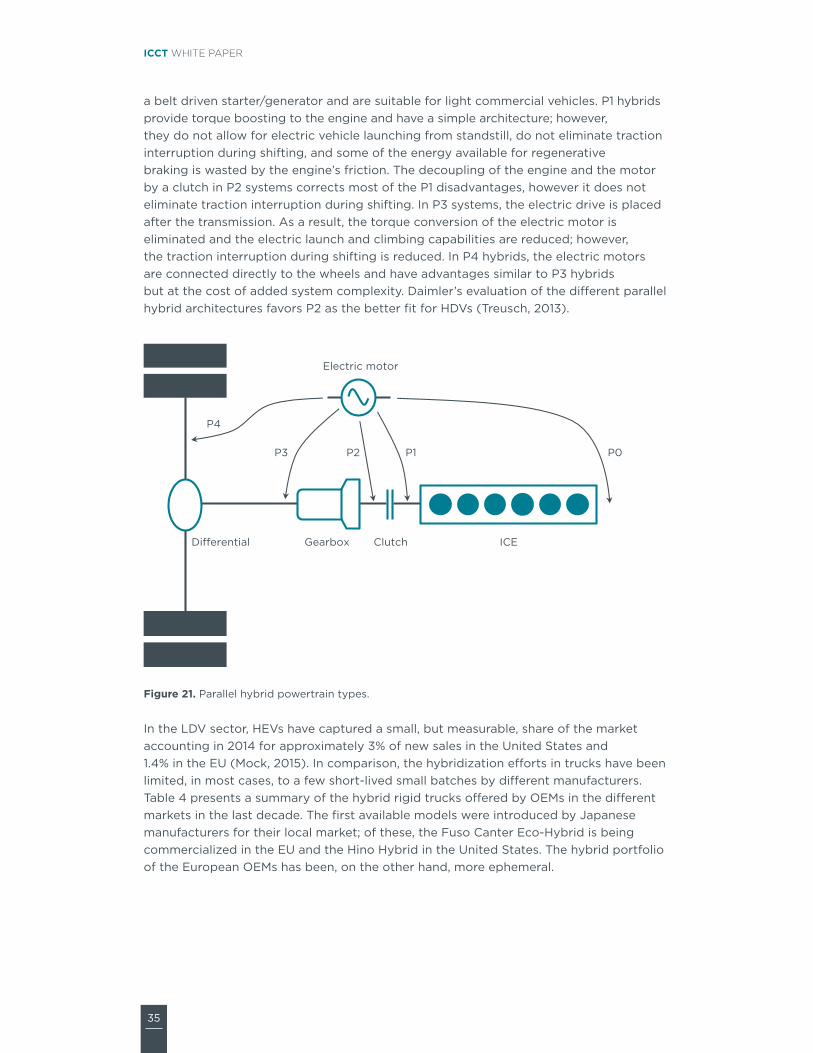
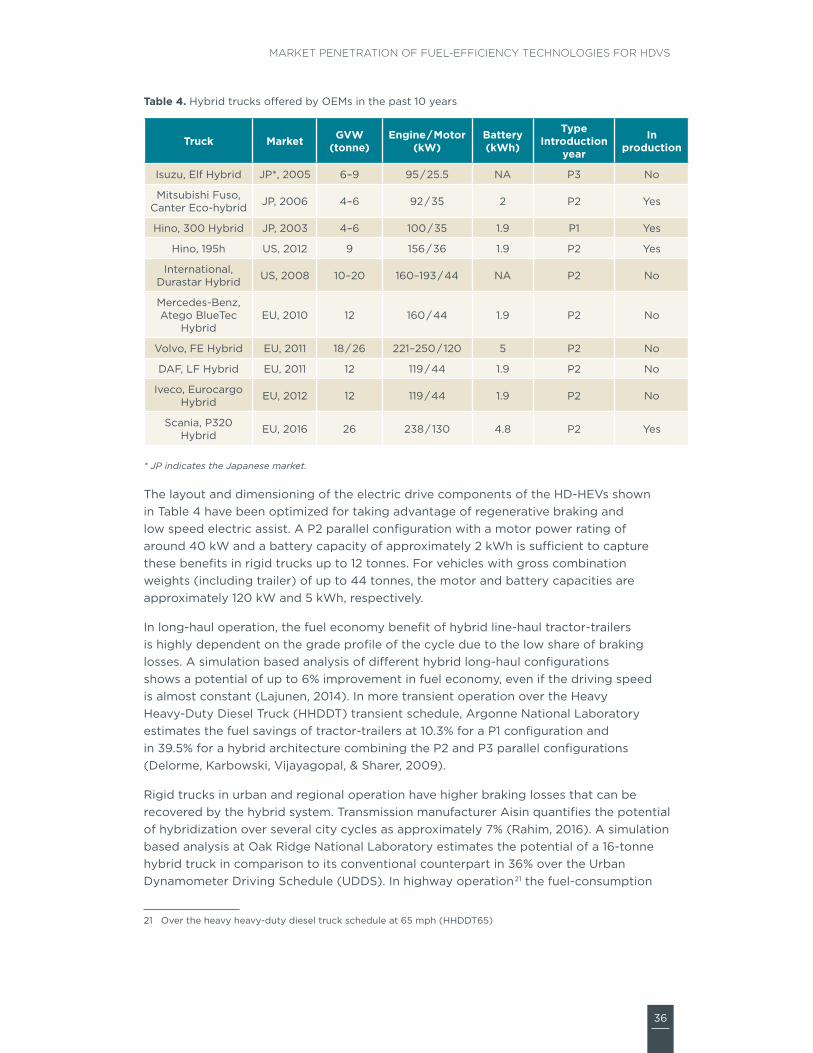


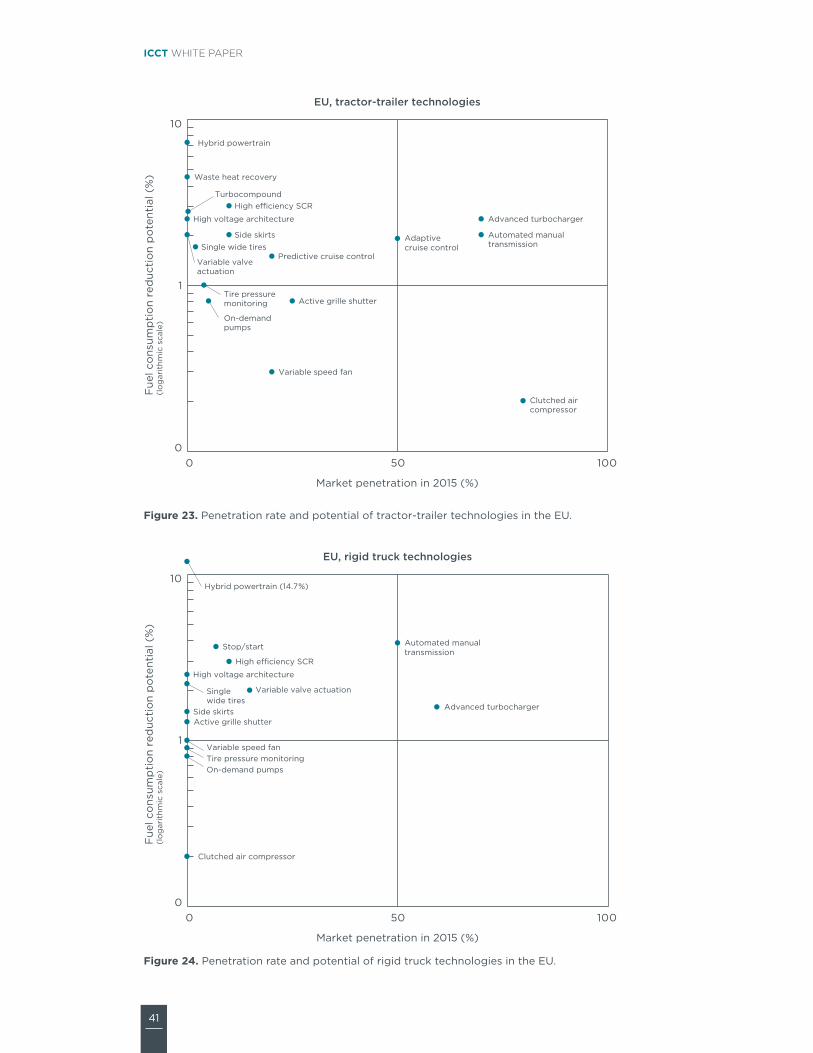


![Market Penetration Study 0[1]](https://static.documents.pub/doc/80x56/54773a935906b549068b464a/market-penetration-study-01.jpg)


