William A. Masters (Tufts Univ.) http://sites.tufts.edu/willmasters 1 Market prices and the cost of nutritious diets: New price indexes to measure food system change Will Masters & Robel Alemu Friedman School of Nutrition and Department of Economics, Tufts University Advancing Research on Nutrition and Agriculture (ARENA) pre-conference workshop at ICAE, 28 July 2018 http://sites.tufts.edu/willmasters | https://sites.tufts.edu/candasa With rapid change in food environments, is the overall cost of nutritious diets easier to buy, or further out of reach?
Transcript
William A. Masters (Tufts Univ.)http://sites.tufts.edu/willmasters 1
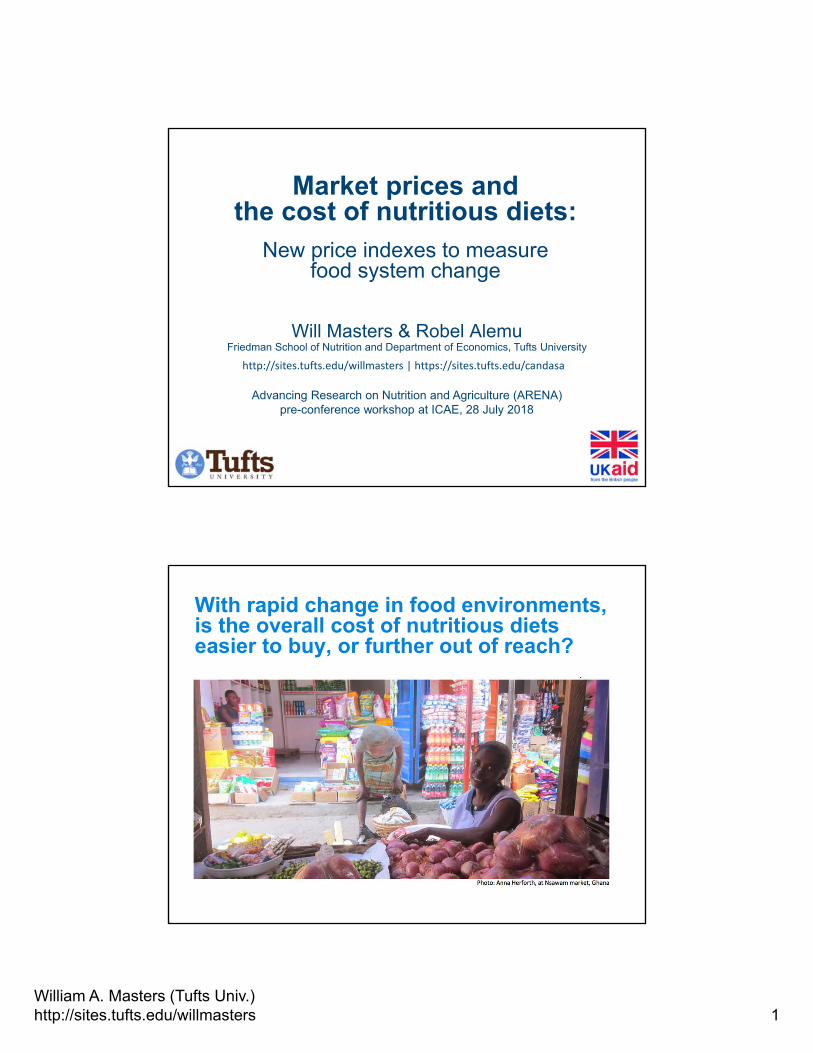
Market prices and the cost of nutritious diets:
New price indexes to measure food system change
Will Masters & Robel AlemuFriedman School of Nutrition and Department of Economics, Tufts University
Advancing Research on Nutrition and Agriculture (ARENA) pre-conference workshop at ICAE, 28 July 2018
With rapid change in food environments, is the overall cost of nutritious dietseasier to buy, or further out of reach?
William A. Masters (Tufts Univ.)http://sites.tufts.edu/willmasters 2
Existing food price indexes are weighted by market value and say little about nutrition
For global commodity prices, the FAO Food Price Index consists of five commodity group price indices, weighted with average export shares of each of the groups for 2002‐2004.
Source: www.fao.org/worldfoodsituation, 21 July 2018
New price indexes to measure food system changemotivation | data | methods & results | use cases & applications | conclusion
• For foods actually consumed, a very long history– Fleetwood (1707) food price index = 5 ‘quarters’ of wheat, 4 ‘hogsheads’ of beer– Lowe (1823) different baskets for different socioeconomic groups– Jevons (1865), Laspeyres (1871) and many others lead to modern CPI
• For affordability of dietary energy, a long history and wide use– Playfair (1821) chart of wheat prices and wages from 1565 to 1821– Sukhatme (1961) and FAO’s Prevalence of Undernourishment in calories– Drewnowski (2004) measure of energy cost ($/kcal) and density (kcal/kg)
• For nutrient adequacy, more recent history and many specific uses– Stigler (1945) linear programming to compute least-cost diets – USDA Thrifty Food Plan for US nutrition assistance (1975, 1983, 1999, 2006)– SCUK Cost of Diet tool (2009) and FANTA et al. Optifood (2012) for aid programs
• For next steps, we introduce three new concepts:– A nutritionally-weight price index (using nutrient profile scores, from 1 to 100)– A cost of diet diversity index (at least one from each of at least 5 food groups)– A cost of recommended diets index (with quantities from local dietary guidelines)
Measuring diet cost has a long history
New price indexes to measure food system changemotivation | data | methods & results | use cases & applications | conclusion
William A. Masters (Tufts Univ.)http://sites.tufts.edu/willmasters 3
We introduce four kinds of indicatorsto add up the cost of foodsin terms of their nutritional values• Unit-free indexes that track change over time
–Nutritious-food Price Index (NPI)• Weight prices by profile scores, instead of expenditure shares as in CPI
–Cost of Diet Diversity (CoDD)• Uses least-cost food from the lowest-cost food groups to reach MDD-W
• Cost-per-day values that specify quantities needed– Cost of a Recommended Diet (CoRD):
• weights each price by quantities in the recommended diet
– Cost of Nutrient Adequacy (CoNA):• the least-cost combination of foods to meet nutrient requirements
• Applications reveal their advantages and disadvantages for policy analysis, program management, and research
New price indexes to measure food system changemotivation | data | methods & results | use cases & applications | conclusion
The price of each food depends on where and when it is bought
Food away from home (restaurants etc.)
Food at home (groceries)
Processed food & feed
Unprocessed food and feed
Source: US. Bureau of Labor Statistics, downloaded 21 July 2018. Definitions and chart data are available at http://myf.red/g/kAoD
Retail prices
Wholesale prices
Local food prices in the United States, 1970-2018 (index values, 1982=100)
New price indexes to measure food system changemotivation | data | methods & results | use cases & applications | conclusion
William A. Masters (Tufts Univ.)http://sites.tufts.edu/willmasters 4
Several types of food price data are available
Ghana MoFA enumerator collecting food price data
Market information & price monitoring
National accounts & poverty monitoring
ActorAgricultural & food agencies
Financial & statistical agencies
PurposeInform farmers, traders, distributors
Measure real income, inflation, poverty
Products
Traded commodities, often a few key staple foods and cash crops at wholesale markets
Retail products, often a long list of over 50 standardized items from urban supermarkets
Access
Individual prices may be available upon request; Private sources charge for subscriptions
Aggregate indexes reported annually, quarterly or monthly; Item-level prices are sometimes confidentialPhoto: Anna Herforth, 2017
• All countries use food prices for their CPI• Many also collect food prices for an MIS• Sources differ in food lists and data quality
New price indexes to measure food system changemotivation | data | methods & results | use cases & applications | conclusion
Meat, Poultry and Fish Vegetables Fruits Egg DairyBeef Tomato Mango Egg Fresh Cow MilkPork Garden Egg PineappleSalted dried fish Okro Palm fruitLive chicken bird Onion WatermelonSmoked herring Ginger OrangeAnchovy Pepper BananaFresh fish Cabbage CoconutChicken meat Lettuce AvocadoSnail Carrot PawpawGoat meatMutton
IANDA (2015-17) helped Ghana MoFA expand price monitoring to more foods
For nutritious diets, need diverse foods’ prices
New price indexes to measure food system changemotivation | data | methods & results | use cases & applications | conclusion
William A. Masters (Tufts Univ.)http://sites.tufts.edu/willmasters 5
• Standard food CPI:– fCPI = ∑ipiwi , where pi and wi are prices and weights in consumer spending
weights each price by quantities actually chosen
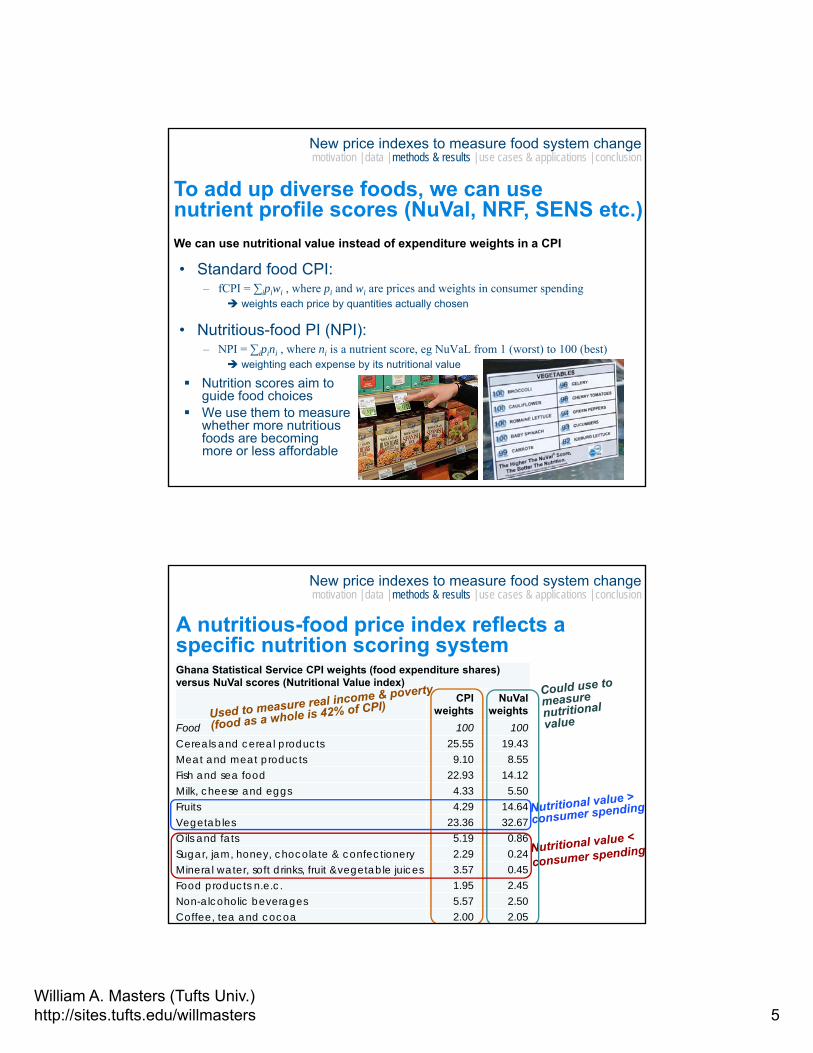
• Nutritious-food PI (NPI):– NPI = ∑ipini , where ni is a nutrient score, eg NuVaL from 1 (worst) to 100 (best)
weighting each expense by its nutritional value
Nutrition scores aim to guide food choices
We use them to measure whether more nutritious foods are becomingmore or less affordable
To add up diverse foods, we can use nutrient profile scores (NuVal, NRF, SENS etc.)
We can use nutritional value instead of expenditure weights in a CPI
New price indexes to measure food system changemotivation | data | methods & results | use cases & applications | conclusion
A nutritious-food price index reflects a specific nutrition scoring systemGhana Statistical Service CPI weights (food expenditure shares) versus NuVal scores (Nutritional Value index)
CPI weights
NuVal weights
Food 100 100
Cereals and cereal products 25.55 19.43Meat and meat products 9.10 8.55Fish and sea food 22.93 14.12Milk, cheese and eggs 4.33 5.50Fruits 4.29 14.64Vegetables 23.36 32.67Oils and fats 5.19 0.86Sugar, jam, honey, chocolate & confectionery 2.29 0.24Mineral water, soft drinks, fruit &vegetable juices 3.57 0.45Food products n.e.c. 1.95 2.45Non-alcoholic beverages 5.57 2.50Coffee, tea and cocoa 2.00 2.05
New price indexes to measure food system changemotivation | data | methods & results | use cases & applications | conclusion
William A. Masters (Tufts Univ.)http://sites.tufts.edu/willmasters 6
90
100
110
120
130
140
150
160
170
NPI CPI
In Ghana, have more nutritious foodsbecome more expensive than other foods?
90
100
110
120
130
140
150
160
170
NPI CPI
Food Price Indexes in Greater Accra, 2012-2017
Food Price Indexes in Tamale, 2012-2017
Prices of more nutritious foodsrose less than prices of other foods
...but in Tamale from 2012 to 2014, the opposite occurred
Source: Author’s calculation, from Ghana Statistical Service file data.
New price indexes to measure food system changemotivation | data | methods & results | use cases & applications | conclusion
Another metric of diet quality is diversity
We follow the MDD-W
MDD-W is defined as ≥ 5 of these 10 food groups in past 24 hrs
(1) Starchy staples (Grains, white roots/tubers, plantains)
(2) Pulses (beans, peas and lentils – includes soybeans)
(3) Nuts and seeds (higher fat than pulses, includes groundnuts)
(4) Flesh foods (meat, poultry and fish)
(5) Dark green leafy vegetables
(6) Other vitA-rich fruits & vegetables
(7) Other vegetables; (8) Other fruits; (9) Eggs; (10) Dairy
New price indexes to measure food system changemotivation | data | methods & results | use cases & applications | conclusion
William A. Masters (Tufts Univ.)http://sites.tufts.edu/willmasters 7
We can measure the cost of reaching MDD-W with the least-cost food in each group
MDD-W has a direct economic interpretation• Within groups, all foods are equal substitutes• Each group meets different needs, and also contributes to energy balance• Groups can be ranked by cost towards total daily energy balance• People with at least five groups are likely to reach adequacy thresholds
the least-cost way to include at least one food from at least 5 food groups
– CoDD2 = Ave{min{pi1}, min{pi2}, …, min{pim}} the least-cost way to include at least one food from any 5 of the 10 food groups
The cost of reaching MDD-W can be defined as:
New price indexes to measure food system changemotivation | data | methods & results | use cases & applications | conclusion
1.Maize or cassava
Foods counted for the Cost of Diet Diversity (CoDD) in Ghana, 2009-14
2.Soya
3.Groundnuts
4.Mangoes
5.Fish or banana
In Ghana, foods in the five lowest-cost groups are:
The least-cost food in each group may vary
Source: Masters et al., (2018), “Measuring the Affordability of Nutritious Diets in Africa: Price Indexes for Diet Diversity and the Cost of Nutrient Adequacy“. AJAE, forthcoming.
New price indexes to measure food system changemotivation | data | methods & results | use cases & applications | conclusion
William A. Masters (Tufts Univ.)http://sites.tufts.edu/willmasters 8
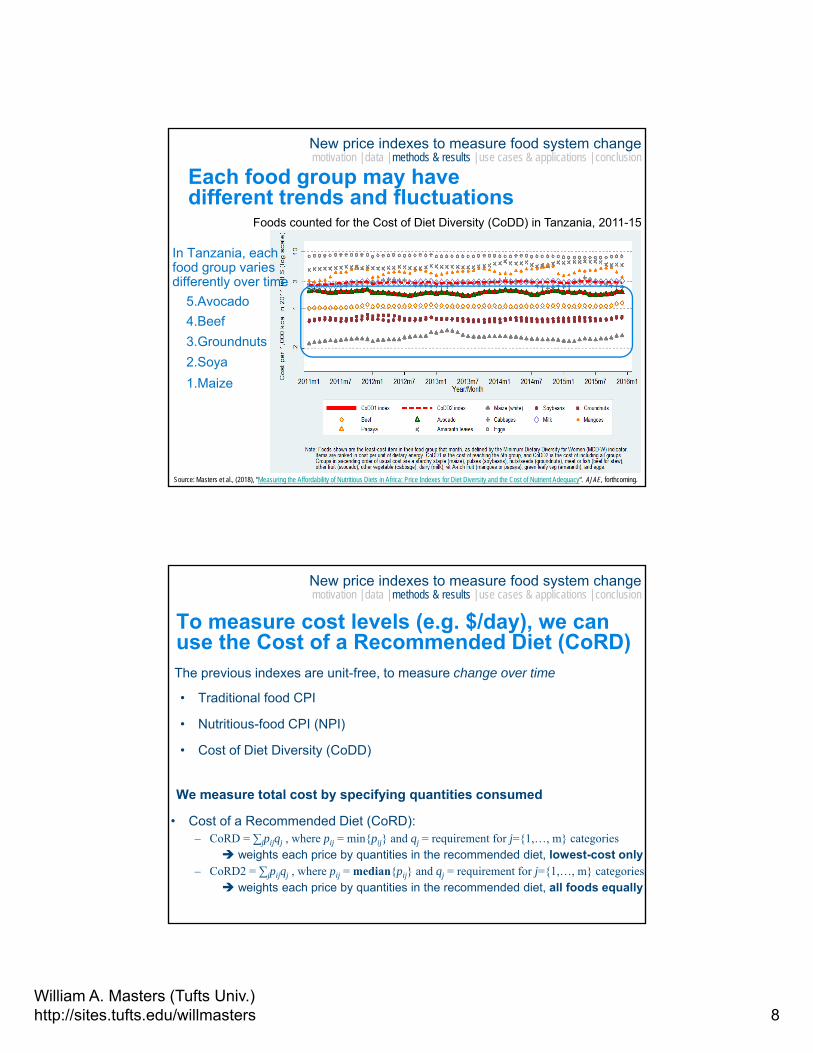
1.Maize
2.Soya
3.Groundnuts
4.Beef
5.Avocado
In Tanzania, each food group varies differently over time
Foods counted for the Cost of Diet Diversity (CoDD) in Tanzania, 2011-15
Each food group may have different trends and fluctuations
Source: Masters et al., (2018), “Measuring the Affordability of Nutritious Diets in Africa: Price Indexes for Diet Diversity and the Cost of Nutrient Adequacy“. AJAE, forthcoming.
New price indexes to measure food system changemotivation | data | methods & results | use cases & applications | conclusion
To measure cost levels (e.g. $/day), we can use the Cost of a Recommended Diet (CoRD)
• Traditional food CPI
• Nutritious-food CPI (NPI)
• Cost of Diet Diversity (CoDD)
The previous indexes are unit-free, to measure change over time
• Cost of a Recommended Diet (CoRD):– CoRD = ∑jpijqj , where pij = min{pij} and qj = requirement for j={1,…, m} categories
weights each price by quantities in the recommended diet, lowest-cost only– CoRD2 = ∑jpijqj , where pij = median{pij} and qj = requirement for j={1,…, m} categories
weights each price by quantities in the recommended diet, all foods equally
We measure total cost by specifying quantities consumed
New price indexes to measure food system changemotivation | data | methods & results | use cases & applications | conclusion
William A. Masters (Tufts Univ.)http://sites.tufts.edu/willmasters 9
The Cost of a Recommended Diet (CoRD) reflects specific dietary guidelinesIn Africa, the only countries with dietary guidelines are Benin, Sierra Leone, Nigeria, Namibia, and South Africa (+Kenya soon)
0.00 0.02 0.04 0.06 0.08 0.10
Starchy staples
Proteins
Vegetables
Fruits
Cost per serving for lowest-cost item in each food group (Ghana, 2015)
Cost/serving (PPP US$/item)Source: Author’s calculation, from Ghana Ministry of Food and Agriculture (MoFA) file data.
New price indexes to measure food system changemotivation | data | methods & results | use cases & applications | conclusion
The Cost of a Recommended Diet (CoRD) depends on which foods are used
Cost per day for a recommended diet, median of all items (Ghana, 2015)
Starchy staples
Proteins
Vegetables
Fruits
$0.00 $0.10 $0.20 $0.30
Cost per day (2011 US$ in PPP terms)
With the median item in each food group (except dairy), total cost would be US$1.37/day
Ghana price data include several high-cost vegetables and protein foods, so those groups can be very expensive
Source: Author’s calculation, from Ghana Ministry of Food and Agriculture (MoFA) file data.
New price indexes to measure food system changemotivation | data | methods & results | use cases & applications | conclusion
William A. Masters (Tufts Univ.)http://sites.tufts.edu/willmasters 10
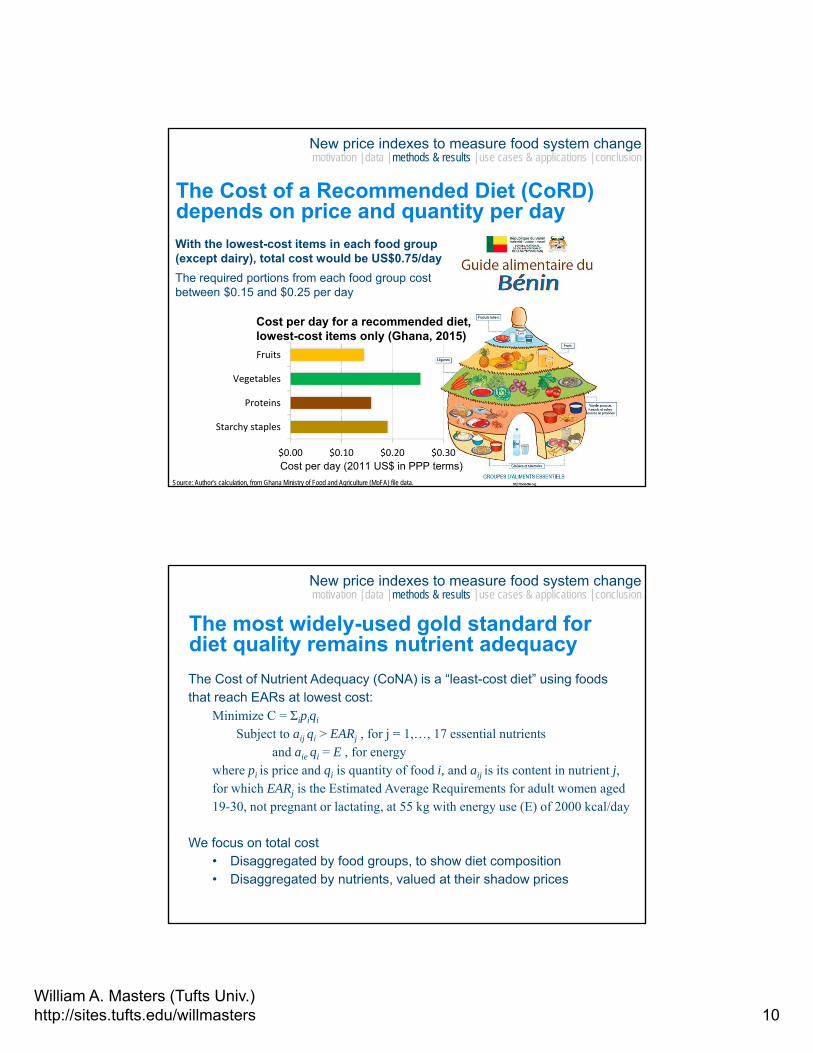
The Cost of a Recommended Diet (CoRD) depends on price and quantity per day
Starchy staples
Proteins
Vegetables
Fruits
$0.00 $0.10 $0.20 $0.30
Cost per day (2011 US$ in PPP terms)
Cost per day for a recommended diet, lowest-cost items only (Ghana, 2015)
With the lowest-cost items in each food group (except dairy), total cost would be US$0.75/day
The required portions from each food group cost between $0.15 and $0.25 per day
Source: Author’s calculation, from Ghana Ministry of Food and Agriculture (MoFA) file data.
New price indexes to measure food system changemotivation | data | methods & results | use cases & applications | conclusion
The Cost of Nutrient Adequacy (CoNA) is a “least-cost diet” using foods that reach EARs at lowest cost:
Minimize C = Σipiqi
Subject to aij qi > EARj , for j = 1,…, 17 essential nutrients and aie qi = E , for energy
where pi is price and qi is quantity of food i, and aij is its content in nutrient j, for which EARj is the Estimated Average Requirements for adult women aged 19-30, not pregnant or lactating, at 55 kg with energy use (E) of 2000 kcal/day
We focus on total cost• Disaggregated by food groups, to show diet composition• Disaggregated by nutrients, valued at their shadow prices
The most widely-used gold standard for diet quality remains nutrient adequacy
New price indexes to measure food system changemotivation | data | methods & results | use cases & applications | conclusion
William A. Masters (Tufts Univ.)http://sites.tufts.edu/willmasters 11
0.00
0.50
1.00
1.50
2.00
2.50
US dollars per day (at 2011
PPP prices)
Vit. A‐rich fruits &veg.Other oils & fats
Meat, poultry & fish
Pulses
Starchy staples
2009 2010 2011 2013 20142012
Source: Masters et al., (2018), “Measuring the Affordability of Nutritious Diets in Africa: Price Indexes for Diet Diversity and the Cost of Nutrient Adequacy“. AJAE, forthcoming.
In the Ghana data, vitamin A is very expensiveCost of Nutrient Adequacy (CoNA) in Ghana, by food group
New price indexes to measure food system changemotivation | data | methods & results | use cases & applications | conclusion
Cost of Nutrient Adequacy (CoNA) in Ghana, by limiting nutrient
Source: Masters et al., (2018), “Measuring the Affordability of Nutritious Diets in Africa: Price Indexes for Diet Diversity and the Cost of Nutrient Adequacy“. AJAE, forthcoming.
In Ghana, limiting nutrients after vitamin A are energy, calcium, vitamin E & vitamin B12
New price indexes to measure food system changemotivation | data | methods & results | use cases & applications | conclusion
William A. Masters (Tufts Univ.)http://sites.tufts.edu/willmasters 12
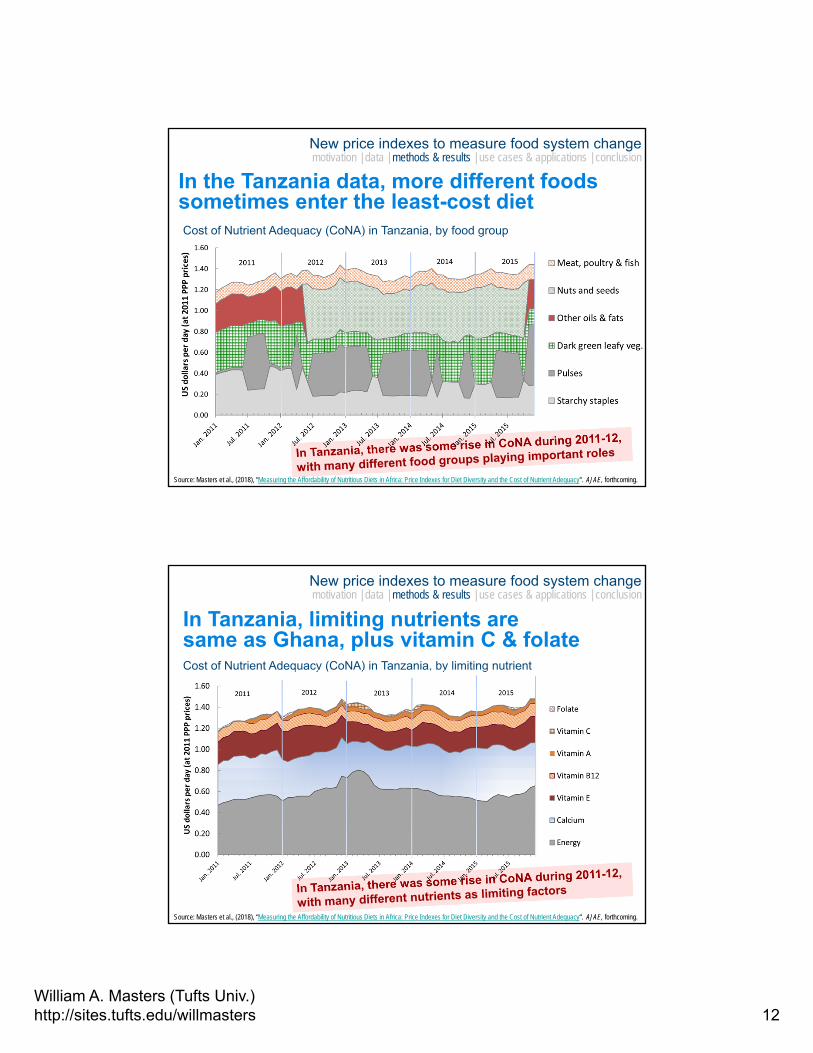
Cost of Nutrient Adequacy (CoNA) in Tanzania, by food group
Source: Masters et al., (2018), “Measuring the Affordability of Nutritious Diets in Africa: Price Indexes for Diet Diversity and the Cost of Nutrient Adequacy“. AJAE, forthcoming.
In the Tanzania data, more different foods sometimes enter the least-cost diet
New price indexes to measure food system changemotivation | data | methods & results | use cases & applications | conclusion
Source: Masters et al., (2018), “Measuring the Affordability of Nutritious Diets in Africa: Price Indexes for Diet Diversity and the Cost of Nutrient Adequacy“. AJAE, forthcoming.
Cost of Nutrient Adequacy (CoNA) in Tanzania, by limiting nutrient
In Tanzania, limiting nutrients are same as Ghana, plus vitamin C & folate
New price indexes to measure food system changemotivation | data | methods & results | use cases & applications | conclusion
William A. Masters (Tufts Univ.)http://sites.tufts.edu/willmasters 13
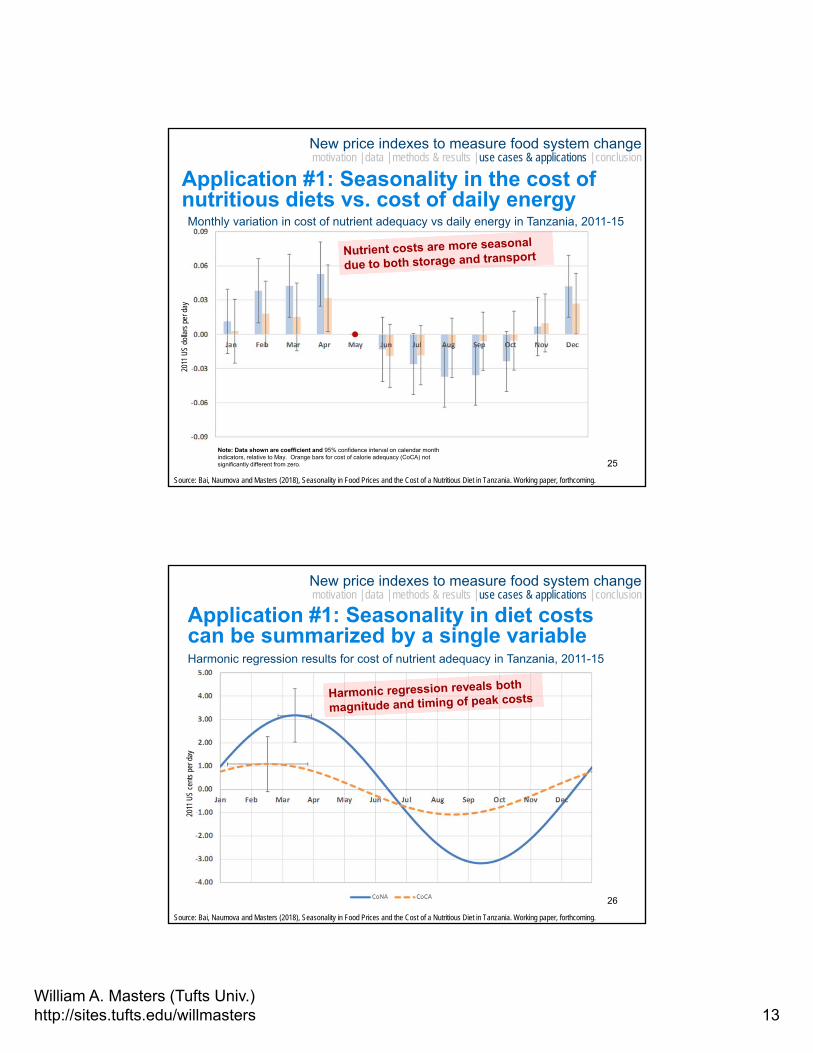
Note: Data shown are coefficient and 95% confidence interval on calendar month indicators, relative to May. Orange bars for cost of calorie adequacy (CoCA) not significantly different from zero. 25
Source: Bai, Naumova and Masters (2018), Seasonality in Food Prices and the Cost of a Nutritious Diet in Tanzania. Working paper, forthcoming.
Monthly variation in cost of nutrient adequacy vs daily energy in Tanzania, 2011-15
Application #1: Seasonality in the cost of nutritious diets vs. cost of daily energy
2011
US
dolla
rs p
er d
ay
New price indexes to measure food system changemotivation | data | methods & results | use cases & applications | conclusion
26
Source: Bai, Naumova and Masters (2018), Seasonality in Food Prices and the Cost of a Nutritious Diet in Tanzania. Working paper, forthcoming.
Harmonic regression results for cost of nutrient adequacy in Tanzania, 2011-15
2011
US
cent
s pe
r day
Application #1: Seasonality in diet costs can be summarized by a single variable
New price indexes to measure food system changemotivation | data | methods & results | use cases & applications | conclusion
William A. Masters (Tufts Univ.)http://sites.tufts.edu/willmasters 14
Source: Sarpong, Bai, Mishili and Masters (2018), Impacts of Agricultural and Trade Policy on the Cost of Nutritious Diets in Ghana and Tanzania. Framework paper for AERC AFPON project, forthcoming.
Impact on cost of nutrients of 10% price reductions by food group in Ghana, 2011-15
Application #2: Ghana’s PFJ program could have more impact if it included F&V
New price indexes to measure food system changemotivation | data | methods & results | use cases & applications | conclusion
Source: Sarpong, Bai, Mishili and Masters (2018), Impacts of Agricultural and Trade Policy on the Cost of Nutritious Diets in Ghana and Tanzania. Framework paper for AERC AFPON project, forthcoming.
Impact on cost of nutrients of 50% s.d. reductions by food group in Tanzania, 2009-14
Application #2: Tanzania’s marketing policies could reduce disparities in cost of nutrients by targeting pulses, nuts & seeds
New price indexes to measure food system changemotivation | data | methods & results | use cases & applications | conclusion
William A. Masters (Tufts Univ.)http://sites.tufts.edu/willmasters 15
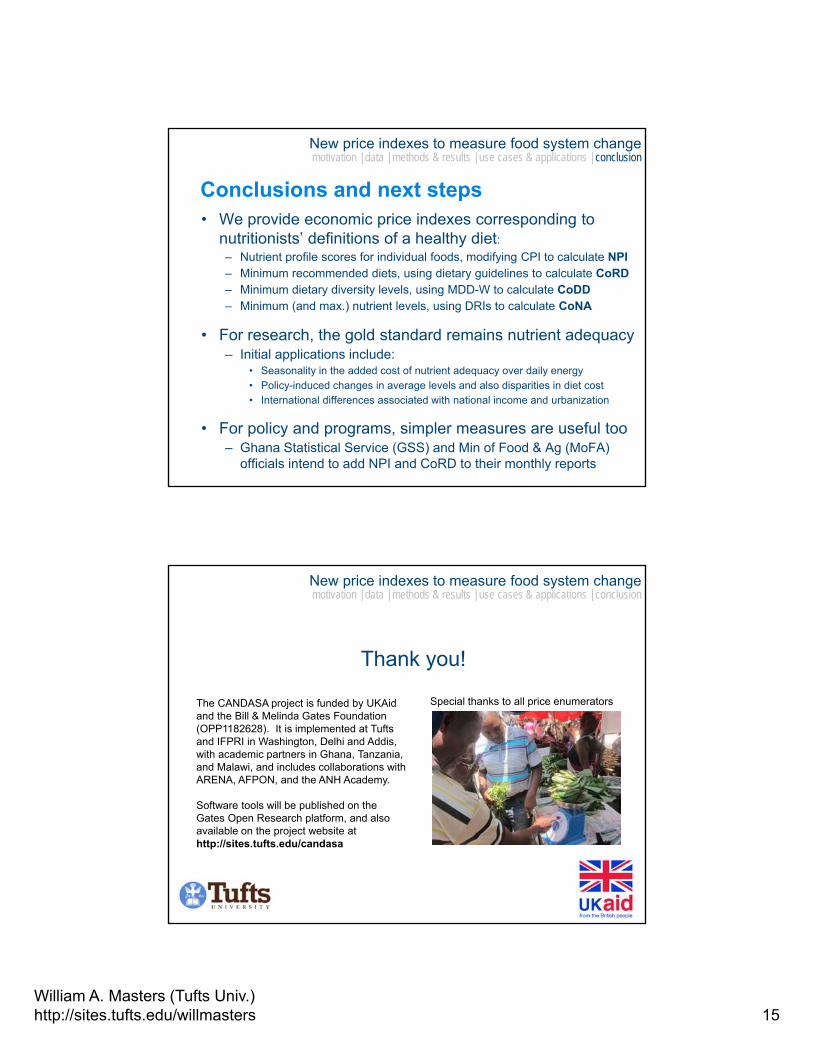
Conclusions and next steps• We provide economic price indexes corresponding to
nutritionists’ definitions of a healthy diet:– Nutrient profile scores for individual foods, modifying CPI to calculate NPI– Minimum recommended diets, using dietary guidelines to calculate CoRD– Minimum dietary diversity levels, using MDD-W to calculate CoDD– Minimum (and max.) nutrient levels, using DRIs to calculate CoNA
• For research, the gold standard remains nutrient adequacy– Initial applications include:
• Seasonality in the added cost of nutrient adequacy over daily energy• Policy-induced changes in average levels and also disparities in diet cost• International differences associated with national income and urbanization
• For policy and programs, simpler measures are useful too– Ghana Statistical Service (GSS) and Min of Food & Ag (MoFA)
officials intend to add NPI and CoRD to their monthly reports
New price indexes to measure food system changemotivation | data | methods & results | use cases & applications | conclusion
Thank you!
The CANDASA project is funded by UKAid and the Bill & Melinda Gates Foundation (OPP1182628). It is implemented at Tufts and IFPRI in Washington, Delhi and Addis, with academic partners in Ghana, Tanzania, and Malawi, and includes collaborations with ARENA, AFPON, and the ANH Academy.
Software tools will be published on the Gates Open Research platform, and also available on the project website at http://sites.tufts.edu/candasa
Special thanks to all price enumerators
New price indexes to measure food system changemotivation | data | methods & results | use cases & applications | conclusion