www.MarketRealist.com Market Realist Inc., 568 Broadway 11 th Floor, New York, NY 10012 The Market Realist Research Team Presents: How You Can Beat the Average Hedge Fund by 65% to 80% over 10 Years
Transcript
www.MarketRealist.com Market Realist Inc., 568 Broadway 11th Floor, New York, NY 10012
The Market Realist Research Team Presents:
How You Can Beat the Average Hedge Fund by
65% to 80% over 10 Years
1
TABLE OF CONTENTS SECTION 1.1: HOW YOU CAN BEAT THE AVERAGE HEDGE FUND 2 SECTION 1.2: EVALUATING THE UNDERPERFORMANCE OF FUNDS 3 SECTION 1.3: DIRECT COSTS OF INVESTING IN ACTIVELY MANAGED FUNDS 4 SECTION 1.4: INDIRECT COSTS OF INVESTING IN ACTIVE FUNDS 6 SECTION 1.5: THE DOWNSIDES OF HIGH PORTFOLIO TURNOVER 8 SECTION 1.6: ADVANTAGES OF ACTIVE INDEXING AND SECTOR SELECTION 10 SECTION 1.7: BRINGING IT ALL TOGETHER: COMPARATIVE RETURNS TABLE 11
2
HOW YOU CAN BEAT THE AVERAGE HEDGE FUND
How You Can Beat the Average Hedge Fund by 65% to 80% Over 10 Years Using Buy & Hold, Active Indexing, and Sector Selection Strategies
Over the last ten years, both hedge funds and actively managed mutual funds have been losing propositions for retail investors. Compared to simply purchasing diversified index funds and uncorrelated asset classes to reduce portfolio volatility, actively managed funds have continuously underperformed due to various factors. Why? One reason is that mutual fund and hedge fund managers are not always incentivized to serve their investors in the most cost-efficient and tax-efficient way possible. In fact, over the past ten years, passive indexing could have outperformed mutual funds by 35% and hedge funds by almost 65%. Over the same period, successful active indexing could have reasonably outperformed mutual funds by 50% and hedge funds by 80%. Our research team came to this conclusion after analyzing the following factors.
• Direct costs: o Management fees (both AUM-based and performance fees) o Sales commissions (front-end loads and back-end loads) o Transaction or trading costs (broker commissions, bid-ask
spreads, and market impact costs) • Indirect costs:
o Tax costs (inefficient trading and lack of tax loss harvesting) o Cash drag o Soft dollar costs and advisory fees
• Asset allocation: o Continuous underperformance by average portfolio managers o Buy and hold, active indexing, and sector selection strategies
While asset allocation and diversification into uncorrelated asset classes are undoubtedly beneficial for individuals, security selection and active management on a micro level are not only expensive, but also wrought with idiosyncratic risks that are magnified through investor behavioral biases.
Based on our study, the Market Realist team concluded that, contrary to popular belief, investment returns can have less volatility and higher Sharpe ratios using active indexing than by allocating to the average mutual fund or hedge fund. Investors can achieve this by creating a diversified equity and fixed-income portfolio with uncorrelated credit, commodity, and tax-free assets like REITs. The weights of these different asset classes and sectors should be optimized and tilted based on industry research, conviction, and outlook.
By properly weighting and diversifying your portfolio across uncorrelated securities, active indexing should perform better than most mutual fund and hedge fund strategies. Since 70% of portfolio returns are based on asset allocation and industry exposure, it can be much cheaper and more efficient to allocate using indices than via security selection. This report will explain the
3
competitive landscape of investing and assist you in making more informed decisions about your portfolio and retirement savings.
EVALUATING THE UNDERPERFORMANCE OF FUNDS
Especially since our last recession was so severe, more investors today seem to realize the need to be more prudent about preserving capital, maximizing their risk-adjusted returns, and avoiding speculative investments and expensive funds. As the demographics of savers and retirees have changed and their average age has increased over the last business cycle, many understand that they don’t have another chance to mismanage their assets either day trading or chasing the latest hot investment product or trend. Now, more than ever, prudent asset allocation is imperative to building a reliable nest egg for retirement.
The graph below shows that despite heavy marketing and bloated investment staffs, both large-cap mutual funds and multi-strategy hedge funds have severely underperformed the S&P 500 ETF. The green line represents the S&P 500 benchmark our team used to evaluate fund performance, which was up 45% over the eight years of the study. The blue line, which represents large-cap mutual funds based in the United States, has underperformed by more than 20% over this period due to various factors we will discuss in the next section of this report. The red line, which represents U.S.-based multi-asset–class hedge funds, has underperformed by more than 30% over period, but with much less volatility. (A larger version of the graph below is available in the Appendix.)
Why have these funds underperformed so drastically over the last decade? A lack of aligned incentives, high management fees, high turnover, and poor investment decisions have contributed to this bifurcation between actively managed funds and passive index funds and ETFs. Please keep in mind that the graph above doesn’t include any fees from financial advisers or funds of funds. A conservative 1.0% fee for services provided by either of these parties would skew the results even further, resulting in another 8.0% underperformance over the period.
4
When Ben Bernanke kept interest rates at 0.0% and quantitative easing and stimulus were a global phenomenon, investors should have been fully invested in low-cost investment vehicles to take advantage of easy monetary policy. Instead, many investors not only underperformed, but also stayed out of the market due to a lack of confidence in the system. In the next section of this report, you will develop a holistic perspective on why some investment strategies tend to underperform while others outperform.
DIRECT COSTS OF ACTIVELY MANAGED FUNDS
In this section, we will discuss the direct costs of investing in funds and why it is so detrimental to long-term investment returns. Unfortunately, many individual investors are often unaware that the average fund can pocket 20% to 30% of his or her returns over ten years and lose another 20%+ in payments to brokers, consultants, advisers, and Uncle Sam.
Management fees and expense ratios
Mutual fund expense ratios are usually the only costs investors pay attention to when making investment decisions. This ratio represents funds used to pay for ongoing management fees, marketing costs, and distribution costs for the fund. Now, depending on whether you include small-cap, international equity, commodity, or fixed-income funds in your sample set, this average expense can range from 0.8% to 1.5% per year.
Transaction costs (trading costs)
Transaction costs or trading costs can be the most difficult costs to track in a portfolio because they are not often disclosed in fund marketing materials and prospectuses. These costs usually consist of broker fees, bid-ask spread costs, and market impact costs. One way to judge trading costs from a relative perspective is by comparing portfolio turnover, which is often disclosed in fund marketing materials. On average, depending on your sample set, these combined fees can cost you 1.0% to 1.5% per year. In fact, a recent study by Edelen, Evans and Kadlec found that on average, U.S. Stock Mutual Funds average 1.44% in transaction costs per year.
The first component of transaction costs is broker commissions. Broker commissions result from buying and selling securities from the mutual fund company’s brokerage counts, which are usually at large global investment banks or similar financial institutions. How can individual investors estimate the magnitude of this component? One way is to ask a mutual fund company for a Statement of Additional Information. This is a document that these firms are required by law to deliver upon request, but which they generally don’t share in prospectuses or marketing materials. Unfortunately, even if investors know to ask for this documentation, they require experience to evaluate and estimate annual costs.
5
The second component of transaction costs is the bid-ask spread cost, which often depends on the strategy the fund deploys, the liquidity of its underlying assets, and the size of each holding. A good rule of thumb is that this cost is higher when the fund focuses more on illiquid, small-cap, or international securities. This cost is always incurred when a portfolio manager makes a transaction and it reflects the difference between the security’s best-quoted ask price and best-quoted bid price.
Example: If XYZ fund wants to purchase 10,000 shares of ABC stock at $10.00 (which is the highest bid available) and Citigroup wants to sell 20,000 shares of the same ABC stock at $10.15 (which is the lowest ask available), the spread is the difference between the asking price of $10.15 and the bid price $10.00—or 15 cents. An investor evaluating this spread would know that if she wants to sell shares, she could do so at $10.00 by selling up to 10,000 shares to XYZ fund. On the other hand, this investor would know that she could buy 20,000 shares from Citigroup at $10.15 as well. The net cost of buying and selling 10,000 shares in this scenario would be $0.15 x 10,000 shares or $150 (1.5%).
The third and most difficult component of transaction costs to determine is market impact cost. Like the bid-ask spread, this depends on fund characteristics—like size, liquidity, and type of underlying assets. Usually, the larger the fund and the more illiquid its holdings, the greater the market impact cost. For example, a sizeable fund making a transaction in a stock will usually cause the stock price to move before the order is even completely filled by the broker. As a result, these funds tend to receive worse prices on smaller and more illiquid stocks, because their large orders tend cause artificial swings in pricing. The portfolio manager of a larger fund may also miss out on good opportunities during periods of volatility, when she may have to avoid certain investments to avoid the adverse effects of market impact costs. Furthermore, the fund manager may miss out on opportune times to sell securities, as it may take multiple days for her to exit out of a single position. Market impact costs make it disadvantageous for individual investors in mutual funds to profit from market swings, especially when volumes are low and markets are illiquid. They also result in less-than-optimal decision making from a portfolio manager’s perspective.
INDIRECT COSTS OF ACTIVELY MANAGED FUNDS
While many of the direct costs were difficult to identify in the previous section, in this section, we will discuss three of the major indirect costs investors suffer from when investing in actively managed mutual funds and hedge funds.
Tax costs
Both young and old investors tend not to pay enough attention to taxation until the end of the year or right before filing in April. After paying taxes for years on
6
their income and purchases, investors tend to forget about taxation when they lock their funds away. Investors generally leave important tax issues to their fund managers or advisers. Unfortunately, fund management and adviser interests don’t always align with their customers’ strategies and interests. This problem is most transparent when mutual funds and hedge funds are owned outside of a tax-deferred vehicle, like a 401k, IRA, or Roth IRA.
For example, an individual investor who purchases a mutual fund that includes stocks that have appreciated before her purchasing the fund faces the risk of having to pay capital gains taxes on gains she didn’t participate in. In this scenario, the investor would be sharing proportionately in taxes due from selling these stocks when the fund manager turns over her portfolio. Prudent investors should check with a mutual fund company before making an investment to see the cost basis or level of embedded gains in its portfolio. Failing to do this can result in severely underperforming the fund’s benchmark on an after-tax basis. The average tax cost ratio for equity mutual funds could be anywhere from 1.0% to 1.5% per year.
Cash drag
Cash drag is a major opportunity cost of investing in mutual funds. In economics, an opportunity cost of a choice is the value of losing out on the best alternative when having to choose between several mutually exclusive alternatives, given scarce resources. In this case, mutual funds that hold large cash balances to maintain liquidity for potential transactions may underperform the index in an environment where stocks are rising. Mutual funds hold cash not only for potential transactions, but also for possible redemptions from investors. At Market Realist, we don’t view holding cash or cash alternatives as a negative, and we feel that liquidity can be necessary in times of uncertainty. As a result, we don’t include cash drag in our comparison between ETFs and funds. However, investors should decide how much cash to keep in their portfolio based on risk tolerance and need—not a portfolio manager setting aside a buffer for investor redemptions. In effect, individual investors in mutual funds are subsidizing other investors’ liquidity needs. According to Cap Trust Financial Advisors, the average cost from cash drag on a large-cap mutual fund portfolio was about 0.83% annually. This consisted not only of opportunity costs, but also that fact that investors pay the mutual fund’s expense ratio on 100% of funds invested, even though not all of the assets are invested in securities.
Soft dollar compensation costs
Soft dollar costs are even more difficult to estimate than cash drag and trading costs. The reason for this difficulty is lack of transparency. Portfolio managers pay soft dollar commissions when they buy and sell stocks using their brokerage accounts, and in return, they receive research and other services, like management access and investor trips. In return for research and other services, these managers may allocate more compensation to brokers with higher commissions instead of choosing the most cost-efficient option. Since this cost is
7
kept out of fund marketing materials and prospectuses, most funds look like they have artificially much lower expenses. A study by Stephen Horan and Bruce Johnsen at the George Mason University School of Law indicates that U.S. soft dollar arrangements could amount to up to 40% of all equity trading costs, or over $1 billion per year.
THE DOWNSIDES OF HIGH PORTFOLIO TURNOVER
Investors don’t often think about portfolio turnover, but as we discussed above, portfolio turnover not only drives transaction costs higher, but it also increases tax costs and soft dollar costs. Every time a portfolio manager buys or sells a security, the investor incurs both direct and indirect costs. These costs are paid out of the fund’s assets, so even if investors don’t see these costs directly in marketing materials, they should avoid them and look for vehicles that hold securities for longer periods.
An easy rule of thumb to remember is that on average, a 100% turnover (meaning that the fund replaces all the securities in its portfolio roughly once per year) approximately equals 1% in incremental transaction costs. So a 400% turnover for an actively managed fund would generate about 4% in incremental trading costs—on top of the management fee, tax drag, and other expenses.
Turnover is usually determined by the type of fund or the strategy the fund employs. For example, short-term fixed-income funds like money market mutual funds can have higher portfolio turnover rates because they tend to invest in short-term securities that mature very frequently and need to be replaced. For this type of strategy, high turnover is necessary, and also shouldn’t be very expensive. On the other hand, an actively managed mutual fund could have a higher turnover rate because of its mandate to outperform and index, but excessive trading in this case could be very expensive for its investors. Comparing this fund’s turnover with that of an index fund wouldn’t be fair, since index funds have a lower turnover ratio mainly because securities in the fund need to be traded only if there is a change in the underlying benchmark index. So, a good way to lower the expenses associated with turnover is by comparing the relative turnover of funds with the same style and mandate.
Many active portfolio managers try to explain away high portfolio turnover with the potential for better performance than passive funds. Although this can be true 10% of the time, usually, investors lose over longer periods by allowing high portfolio churn in their investments.
According to Jack Bogle, the founder of Vanguard, funds tend to trade too much. When Mr. Bogle entered financial services in 1951, mutual fund turnover was about 16% per year, which represented an average holding period of six years (1 / 16% = 6 years). Over the past two decades, mutual fund turnover has increased to 92%, representing an average holding period of less than one year! Using these statistics, Mr. Bogle points out the short-term nature and incentives of
8
financial institutions. These incentives tend to be counterproductive to generating long-term returns for investors. Since these costs tend to come out of a fund’s assets, instead of the management fee, investors often fail to directly monitor these expenses.
The table below shows the average relative performance of active and passive mutual funds, using data from 2007.
Stock and Bond Mutual Fund Portfolio Turnover Rates Fund Category Managed Fund
Category Average
Index Fund by Category*
Top-Rated Fund by Category**
Large-Cap Growth 97% 25% 2% Large-Cap Blend 77% 7% 68% Large-Cap Value 63% 22% 8% Mid-Cap Growth 118% NA 63% Mid-Cap Blend 115% 27% 59% Mid-Cap Value 76% NA 7% Small-Cap Growth 117% 48% 50% Small-Cap Blend 88% 25% 11% Small-Cap Value 68% 36% 16% Foreign Stock 90% 3% 201%*** High-Quality Bond 196% 64% 16%
* A Vanguard Group index fund was selected for each fund category. ** Using Morningstar Fund Investor data, the fund with the highest annualized ten-year total return was selected in each fund category. *** High portfolio turnover rate—implies holding stocks for six months!
Source: Morningstar & ValueClick
ADVANTAGES OF ACTIVE INDEXING & SECTOR SELECTION
In the graphs below, you can see the divergence between sectors in the U.S.-based S&P 500 index. Each period had multiple opportunities to allocate your portfolio to benefit from specific trends and avoid others. At an industry level, these opportunities were magnified even further.
US Large-Cap Equity Sector Performance (2009 - 2013)
Materials Consumer Cyclical Consumer StaplesEnergy Financials Health CareIndustrials Technology TelecomUtilities S&P 500 Source: State Street & iShares
10
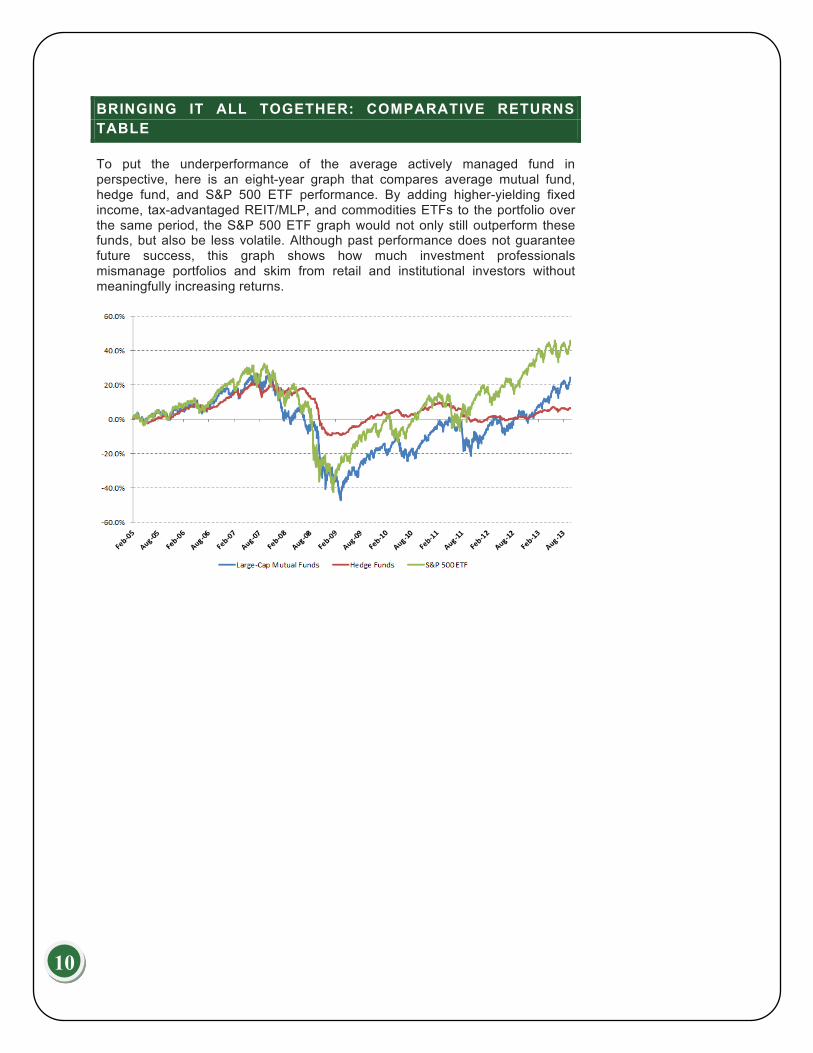
BRINGING IT ALL TOGETHER: COMPARATIVE RETURNS TABLE
To put the underperformance of the average actively managed fund in perspective, here is an eight-year graph that compares average mutual fund, hedge fund, and S&P 500 ETF performance. By adding higher-yielding fixed income, tax-advantaged REIT/MLP, and commodities ETFs to the portfolio over the same period, the S&P 500 ETF graph would not only still outperform these funds, but also be less volatile. Although past performance does not guarantee future success, this graph shows how much investment professionals mismanage portfolios and skim from retail and institutional investors without meaningfully increasing returns.