Market structure and coherence ofinternational cooperation: the case of thedairy sector in MalawiCesar Revoredo-Giha1* and Alan Renwick2
* Correspondence:[email protected] Economy, Environment andSociety Research Group, Scotland’sRural College (SRUC), King’sBuildings, West Mains Road,Edinburgh EH9 3JG, UKFull list of author information isavailable at the end of the article
Abstract
A supply chain in disarray can be identified as a barrier not only to growth for theagricultural sector but also to achieving food security in a country because it maylead to either a deficiency in food production and/or too high prices. Using the dairysector of Malawi as an example, the purpose of this paper is to discuss the coherencebetween market structure and the development strategy pursued by internationaldonors. Within Malawi the dairy sector may be characterised as a segmented market:with both formal and informal milk markets, with smallholder producers serving bothmarkets. The formal market includes few processing firms operating with idle capacityand selling dairy products to an affluent segment of the urban population, whilst theinformal market comprises the sale of unprocessed milk products to the less affluenturban population and also rural areas. In this context, cooperative international action,conducted through agencies from a range of countries, is targeted at improving theefficiency of the formal supply chain and also the creation of local supply chains thatsell processed products directly to poor consumers. The paper discusses reasons whythese two cooperation strategies, given the structure of the sector, may potentiallyconflict with each other, the need to address the degree of market imperfection of theformal sector and the desirability of ex-ante coordination of plans amongst donors.
Keywords: Malawi dairy supply chain, Development economics, Industrial organisation
JEL codes: O, L
IntroductionSupply chains in disarray have been identified in the economic literature as a barrier to
growth for the agricultural sector (e.g., Gorton and White 2007). In addition, they can
also be a constraint on the achievement of food security in a country, because less than
the optimal amount will be produced with a given level of resources (therefore affect-
ing the availability of food) and at higher prices (worsening accessibility and affordabil-
ity of food).
There are various reasons for the malfunctioning of supply chains and in many cases
there is an issue of path dependency. For example, this can be seen in the case of in-
dustries born from import substitution experiences (e.g., see Baer 1972 for a review of
the Latin American case and Mytelka 1989, for the African case) or the corollary of
those emerging from structural reforms such as in the case of the transition economies
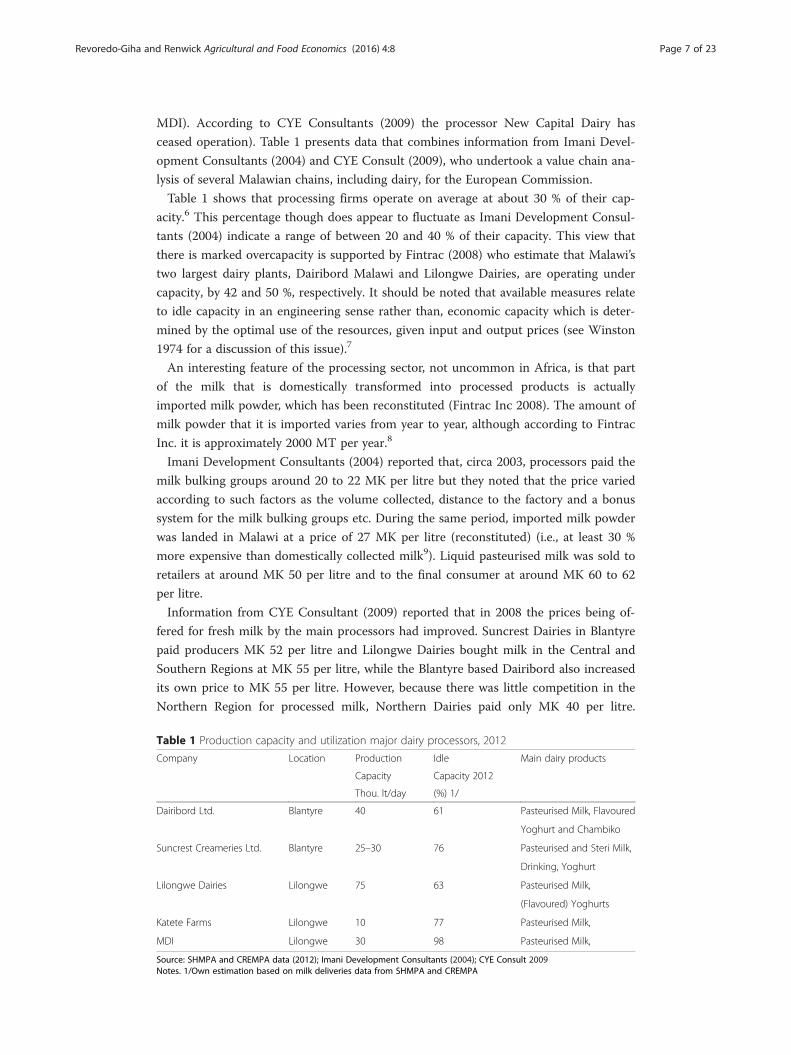
Suncrest Creameries Ltd. Blantyre 25–30 76 Pasteurised and Steri Milk,
Drinking, Yoghurt
Lilongwe Dairies Lilongwe 75 63 Pasteurised Milk,
(Flavoured) Yoghurts
Katete Farms Lilongwe 10 77 Pasteurised Milk,
MDI Lilongwe 30 98 Pasteurised Milk,
Source: SHMPA and CREMPA data (2012); Imani Development Consultants (2004); CYE Consult 2009Notes. 1/Own estimation based on milk deliveries data from SHMPA and CREMPA
Revoredo-Giha and Renwick Agricultural and Food Economics (2016) 4:8 Page 7 of 23
Untreated and often diluted milk is sold by vendors directly to consumers at about MK
50 per litre. Consumers are paying in supermarkets between MK 70 to 100 per litre for
pasteurised milk.
Figure 3 provides the monthly evolution of milk price paid to farmers and highlights
that the nominal price is characterised by discrete adjustments, after which it remains
constant. In contrast, the real price shows a long term negative trend showing de-
creases in purchasing power due to inflation.
Little information is available on the actual processing costs of milk in Malawi. Ac-
cording to Imani Development Consultants (2004) these vary by product and generally,
the less the value added the less the processing cost. The margin is also related to the
added value. According to the processors, the net margin on liquid pasteurised milk is
as low as 5 % whereas this can be as high as 15 % for products which have higher
added value such as cheese. For these products a much higher gross margin was re-
ported, but due to high operational costs, especially electricity, water and transport
costs within Malawi, the net margin is estimated at between 3 and 10 %. Supermarkets
are reported to take a margin of 15 to 20 %. According to Imani Development Consul-
tants the processing sector attains profits despite its high costs by targeting the affluent
part of the urban population.
Trade in dairy products
CYE Consultant (2009) report that due to low internal demand, value added products
such as cheese, yoghurt and butter are imported to satisfy the demand that exists. How-
ever, whole dried milk (i.e., milk powder) and UHT milk are by far the major imported
products in the dairy sector. Figure 4 presents the imports of whole dried milk.
On a milk-equivalent-basis imports have a dominant role in the market and exceed the
formal local market supply by a substantial margin (75 % versus 25 % circa 2008) even
though imported milk is more expensive than locally produced. The source of imported
milk products depends very much on world prices and also on which part of the world is
generating surpluses. At present cheese and yoghurts are coming from South Africa, but-
ter from Zimbabwe and powdered milk from Ireland and New Zealand.
0
5
10
15
20
25
0
20
40
60
80
100
120
Sep-
08
Nov
-08
Jan-
09
Mar
-09
May
-09
Jul-0
9
Sep-
09
Nov
-09
Jan-
10
Mar
-10
May
-10
Jul-1
0
Sep-
10
Nov
-10
Jan-
11
Mar
-11
May
-11
Jul-1
1
Sep-
11
Nov
-11
Jan-
12
Mar
-12
May
-12
Jul-1
2
Sep-
12
Nov
-12
Jan-
13
Mar
-13
May
-13
Jul-1
3
Sep-
13
Nov
-13
Jan-
14
Mar
-14
May
-14
Rea
l pri
ce in
200
0 K
wac
hassahca
wK
niecirplan imo
N
Nominal price Real price
Fig. 3 Nominal and real weighted average price of milk paid to farmers by processors September 2008 –June 2014 1/
Revoredo-Giha and Renwick Agricultural and Food Economics (2016) 4:8 Page 8 of 23
Consumption and distribution of dairy products
Compared to the rest of Africa, the consumption of milk products in Malawi is very
low, which is caused mainly by low purchasing power, limited supply and poor distribu-
tion beyond the main urban and trading centres (CYE Consultant 2009). In fact, ac-
cording to Imani Development Consultants (2004), Malawi has the lowest
consumption of milk per capita in Africa estimated at 4.7 kg/capita/year compared to
an Africa average of 15 kg/capita/year (CYE Consultant (2009) estimate these figures as
4 and 20 litres per capita, respectively).
Historically in Malawi, most consumers used powdered milk and where fresh milk is
unavailable or is inconvenient to buy, powdered milk still forms the main form of milk
consumed. Fresh pasteurised milk has traditionally been sold only to the higher and
middle income groups.
Sales and consumption of milk is heavily concentrated in the urban areas. The retail
sector is dominated by the large supermarkets such as People’s Trading Centre (PTC)
and Shoprite. Besides large supermarkets, milk is also sold by small convenience stores,
informal shops in low income housing areas, vendors and trading stores outside of the
three main cities. It has been reported that selling to retail outlets gives the highest
profit margin to processors, due to the fact that the milk can be sold to them in bulk.
In addition to processed liquid milk there is also a considerable supply of milk pow-
der in tins and packets in urban areas. The tins tend to be sold in the bigger stores that
are targeting upper and middle-income consumers, whilst the packets and sachets are
sold in smaller retailers targeting lower income consumers. Milk powder is very im-
portant to smaller retailers, because many of them do not have refrigeration facilities. It
is though interesting to note that small retailers are able to sell milk at the same price
as the large retailers.
As pointed out in Chitika (2008) studies have shown that informally marketed milk is
associated with zoonotic health risks (which include brucellosis, coliforms and bovine
tuberculosis) and high bacteria counts which are due to poor hygiene and a long time
lag between milking and sale. The absence of pasteurization increases the risk posed by
such organisms. There is therefore a need for effective control measures including
0
500
1,000
1,500
2,000
2,500
3,000
1989
1990
1991
1992
1993
1994
1995
1996
1997
1998
1999
2000
2001
2002
2003
2004
2005
2006
2007
2008
2009
2010
2011
2012
sen
no
T
Fig. 4 Malawi: Imports of whole dried milk 1988–2012
Revoredo-Giha and Renwick Agricultural and Food Economics (2016) 4:8 Page 9 of 23
hygienic handling of milk and its pasteurization to protect public health. However, ac-
tual health risks from bacterial contamination are judged to be low because of the com-
mon consumer practice of boiling milk before consumption.
Information on how the consumption of dairy products in Malawi reacts to changes
in expenditure and prices is limited. Although, Ecker and Qaim (2011) estimated ex-
penditure and Marshallian own price elasticity for food products using the 2004–05
Living Standards Measurement Survey for Malawi. Their results for milk and dairy
products are presented in Table 2. On average, urban consumers react more to changes
in expenditure but less to prices than rural consumers. Furthermore, the income elasti-
cities indicates that milk and dairy products are “luxuries” for the urban population
while “necessities” for the rural population. The reason for these differences are not
clear and deserve further research as they might be due to the aggregation amongst
several different type of products of different qualities.
International development donors in the dairy sector in Malawi
Dairy is considered a key investment sector within agriculture for the Government of
Malawi (MIPA 2011) and donors such as the USA (through USAID, United States
Agency for International Development), Japan (through JICA, the Japan International
Cooperation Agency) and Belgium (through FICA, the Flemish International Cooper-
ation Agency) have focused part of their development aid on the sector (in the case of
USAID this has been with the participation of the Land O’Lakes firm since 1999).
According to Imani Development Consultants (2004), donor support has assisted the
Government in the goal of meeting its stated objectives of development of the dairy
sector, namely: to promote dairy production so as to achieve self-sufficiency in dairy
and dairy products; to exploit export markets when surpluses arise; to contribute to
welfare of Malawians by providing dietary animal products and; income generating ac-
tivity through higher levels of production and competitive marketing systems.
The purpose of this section is not to provide a detailed description of all the work that
different donors are carrying out in the dairy sector in Malawi, but through the descrip-
tion of two different work programmes in the country, highlight two different develop-
ment strategies pursued by donors. The first strategy can be portrayed under the tag of
“Strengthening the formal dairy sector” (as exemplified by the USAID support through
the work undertaken by Land O’Lakes) while the second strategy can be classified as “De-
velopment of local supply chains” (identified with work supported in Africa by the JICA).
“Strengthening the formal dairy sector” strategy
Under this strategy we briefly consider the main characteristics of the work of three do-
nors: USAID through Land O’ Lakes; the EU support through their involvement with
the Shire Highland Milk Producers Association and; the work supported by FICA.
Table 2 Consumer’s expenditure and Marshallian own price elasticities for milk and dairy products
Elasticities Rural Urban
Average Lowest Middle Highest Average Lowest Middle Highest
Revoredo-Giha and Renwick Agricultural and Food Economics (2016) 4:8 Page 10 of 23
The Land O’Lakes dairy sector development programme USAID sponsored the
Land O’Lakes’ dairy sector development program, which started in 1999. According to
Land O’Lakes (Buck 2008) the goal of this project was to increase rural incomes by in-
creasing the number of rural poor households deriving their main livelihood from dairy
business, through managing high productivity enterprises, while delivering improved
quality and affordable dairy products to the market. The total investment in the sector
was US$ 11.0 million, of which US$ 2.5 million were USAID direct investment plus
US$ 8.5 million in leveraged funding.
Their key project components comprised: development of efficient milk producer or-
ganisations; development of efficient dairy processing and marketing and; expansion of
effective industry support services.
Their development strategy can be described as being based on the results of value
chain analyses of the dairy sector. Buck (2008) highlights the following specific aspects
of these analyses:
a. Milk quality - Their diagnosis is that milk is of poor quality, not meeting
international standards and there is a lack of certified laboratories. Therefore, their
programme promotes milk traceability systems and services and facilitating
upgrading of laboratory methods and equipment.
b. Supply – They found seasonal variation in production associated with the dry
season and lack of availability of forage and pasture seeds. In response to this, the
programme promotes use of water development and silage making services and
action-oriented research into new seed varieties.
c. Policy – They considered that the sector had inadequate animal feed quality
standards and that the industry associations have limited resources, so they propose
to facilitate technical revisions to and advocacy for enactment of animal feedstuffs
act and to facilitate capacity building of the associations to increase revenue
collection and service provision.
d. Market – They found that export requirements were not well understood by the
industry and there was low per capita milk consumption. Their programme
proposed stimulating the export market facilitation services and facilitating
industry-led consumer awareness campaigns to promote purchase of quality milk.
e. Producers – Their value chain analysis found that producers had high cost and use
poor quality commercial feeds. In addition, they lacked access to appropriate
financial services. Therefore, their programme promoted the use of improved feed
formulation and testing services and the innovative delivery of financial services and
development of new financial products.
f. Milk bulking groups – They found milk losses due to lack of cold chain
infrastructure and lack of guaranteed market for members’ milk. Their strategy to
address this consisted of facilitating links to financial service providers and
promoting guarantee schemes with processors. They also proposed to facilitate
vertical linkages and promote use of supply contracts between the milk bulking
groups and the processors.
g. Processors – The value chain analysis found that the quality of processed milk was
not aligned with export standards and that they suffered of margin squeeze
affecting profitability. They proposed to promote quality assurance services and to
Revoredo-Giha and Renwick Agricultural and Food Economics (2016) 4:8 Page 11 of 23
increase access to market information and the link to business sector programmes
to develop higher-value products and markets.
h. Inputs and Services – For this stage of the chain they found that there was a lack
of awareness of financial service options and that the return on investment of
providing in-house services and/or inputs was low or unknown. As a result, they
proposed to encourage financial service providers to expand marketing of existing
and development of new financial products and to promote feasibility studies and
pilot programmes for new, innovative services, inputs and technologies.
Finally, in order to develop a sustainable dairy sector support system, Land O’Lakes
stated its intention was ‘to source local and regional training and technical providers to
assist in the development of the sector including a strong emphasis to be placed on the
integration of the current local dairy service providers into the project’.
The shire highland milk producers association The Shire Highlands Milk Producers
Association (SHMPA) is a farmers’ organisation established in 1985 to look after the
interest of smallholder dairy farmers in the Southern Region. It has a membership of
2900 dairy farmers who sell their milk through the SHMPA managed milk collection
network. This network consists of 20 milk bulking groups within an 80 km radius of
Blantyre According to Imani Development Consultants (2004) the main funders of the
project were the EU and Oxfam.
The activities carried out by the SHMPA include: milk collection centre maintenance;
establishment of new collection centres; provision of AI services; election and training
of milk bulking group committees; auditing of milk bulking group accounts; advocacy
for smallholder dairy farmers – especially concerning milk marketing, input supply and
field services; farmer training in dairy farm management; operating a heifer loan
scheme; heifer breeding for new farmers and; provision of sustainable farmer-managed
animal breeding and health services.
In addition to the resources from donors, all farmers pay a small levy on milk sold to
cover the costs of SHMPA’s activities. SHMPA’s activities have had a positive influence
on dairy farming in the Southern Region as they also help farmers to establish dairy
farms under the Heifer loan scheme and provide field extension services (Imani Devel-
opment Consultants 2004).
Flemish international cooperation agency In 2009 the Flemish government awarded
the Malawi Milk Producers Association the sum of €500,000 for a four year project
(FICA 2011). The objective of the project is to strengthen the dairy sector in the central
and northern regions of Malawi by targeting four areas: capacity building and training
of the farmers and the milk bulk groups; reinforcing the capacity of the associations;
improving the technical services and; increasing the cattle numbers.
By targeting the direct link between farmers and the milk bulking groups, the
objective of the project is to raise milk production from its current low level,
through adequate training and management. Furthermore, existing farmers as well
as potential new entrants into dairying will be educated in marketing, hygiene and
quality control.
Revoredo-Giha and Renwick Agricultural and Food Economics (2016) 4:8 Page 12 of 23
At an institutional level, the associations’ staff members are trained to improve man-
agement practices with the aim of achieving sustainability of the associations. This
means among other things general and financial management, leadership, marketing,
etc. One important task of the associations is to provide information to their members
on the wellbeing of the animals, nutrition, artificial insemination, barn construction,
etc. Through bundled purchase of inputs, such as seeds, by the regional associations,
the associations can ensure that the farmers will pay less than if they were negotiating
individually and in time the association will be able to operate independently that way.
It is reasoned that a well-run association that provides professional services will gain
more members and farmers can continue to make the change from informal dairy pro-
duction to a more formal dairy production.
“Development of local supply chains” strategy
The approach followed by JICA is analysed in Kurokawa et al. (2008)10 and has many
aspects in common with the strategies already reviewed, as it is also focused on the de-
velopment of the private sector in Africa. The strategy is known as a One Village One
Product (OVOP) approach and is based on a “strategic movement” which relates
closely to regional development policies. It has its origins in Oita, one of the 47 prefec-
tures of Japan. It began in the 1970s as a community-based business activity aimed at
rediscovering and revitalising economically backward rural areas. The movement was
introduced in 1979 by former governor of the Oita Prefecture in Japan, Dr. Morihiko
Hiramatsu. Under the OVOP movement each village is encouraged to produce at least
one product or service which can be showcased across the country and the world
(Kurokawa et al. 2008, p. 23).
JICA considers that the major constraints on the performance of SMEs include
costs and access to finance (considered the major resource constraint), access to elec-
tricity, corruption, tax administration, level of skills and transportation. Furthermore,
they consider that many of the binding constraints are due to the presence of market
and government failures, which justifies support for private sector development. The
OVOP approach is located at the micro end of the spectrum of donor activities since
it aims to provide specific support for individual firms, groups of firms and/or
households.
The OVOP programme in Malawi is relatively small with an investment of $500,000
supporting four dozen projects. The programme aims to develop products and services
through value adding by communities and using locally available resources in a desig-
nated area. Specifically, it aims to: promote the OVOP concept approach of economic
development at the level of villages; promote value adding technologies, such as agro-
processing, quality control and packaging, at the village level; to facilitate small-scale
business skill development at the village level; to promote market linkages between
products and services from villages and domestic/international markets.
As pointed out by Kurokawa et al. (2008) the Malawi OVOP Programme had at the
time of the study supported 46 projects for 12,943 beneficiaries, including activities on:
dairy processing; fish processing; vegetable production and processing; rice milling;
honey production and mushroom production. One group, for example, received tech-
nical support from the programme and built a multi-purpose model factory where
Revoredo-Giha and Renwick Agricultural and Food Economics (2016) 4:8 Page 13 of 23
members successfully managed to produce commodities like confectionary, cooking oil,
and milk from soy beans and other products. Some of the OVOP products have been
exported to South Africa and Japan.
The Bvumbwe Milk Cooperative, formed in 2003, was one of the first projects to be
funded by OVOP. Bvumbwe received a loan of around US$12,000. JICA helped dairy
farmers in Bvumbwe who had a milk bulking group to form a cooperative. It also pro-
cured a cooling tank which the cooperative uses to store its milk before it is sold to the
Dairiboard, the largest consumer of raw milk in Malawi.
It should be noted that under the OVOP programme the Bvumbwe Milk Cooperative
has improved productivity and reduced the loss of milk collected from its members.
Milk production has increased from 13 litres to 27 litres per animal per day. The estab-
lishment of the cooperative has made it possible for them to negotiate with Dairibord
better prices as the quality of milk produced is of a high standard. This has also led to
an increase in the number of farmers and animals in the cooperative, increasing from
12 to 117. JICA supplied the Bvumbwe with a milk pasteuriser and milk packaging ma-
chine in 2003 for the cooperative to sell milk directly to consumers and not through
the major milk companies (One village one group (OVOP) 2011).
MethodsThe purpose of this section is to present the methods to be used in the paper. However,
before presenting the specific method used it is important to understand: first, why the
two approaches followed by the donors for the Malawian dairy supply chain potentially
conflict, and; second, why the choice of strategy to follow is dependent on the nature
of competition within the sector, that is whether it is perfectly competitive or whether
the processing sector has the capacity to exercise market power.
Why the two strategies potentially conflict
From the review of the donors’ strategies it is clear that they pursue similar goals,
which can be represented by Fig. 5. Panel a of the figure represents a stylised version of
the current consumption market for milk,11 which can be classified into high quality
demand and supply for milk (denoted by the supra-index H) and low quality demand
Panel a Panel b
Q
PDH
DL
SH
SL
QLQH
PL
PH
Q
P
DH
SH
QH
PH
Fig. 5 Malawi dairy market: stylised current situation and target situation
Revoredo-Giha and Renwick Agricultural and Food Economics (2016) 4:8 Page 14 of 23
and supply for milk (denoted by the supra-index L). As shown in the figure the formal
sector sells a low quantity of high quality milk (i.e., pasteurised) at a high price, while
the informal sector sells a large quantity of low quality milk at a lower price than the
formal sector (note that this is at the retail level). The presence of two demand curves
is due to the fact that the population can be considered as segmented by income, so
the high quality milk is sold to the affluent urban group and the low quality milk is sold
to the rural and poor urban population. Panel b of the figure can be considered as the
situation targeted by the donors, as the high quality milk replaces the low quality milk
and the supply expands sufficiently to serve both the rural and urban population. Of
course, the difference between the two strategies discussed in this paper is in how to
move from the situation in Panel a to Panel b.
It is clear from the review of the donors’ strategies that they have a great number of
features in common, such as increasing the efficiency of milk producers though micro
credit, knowledge transfer, empowering producers organisation, etc. Therefore, we
focus on those aspects that may lead to conflicts between the two approaches.
Overall the comparison between the two strategies can be seen as two different views
of what to do with an ineffective/inefficient supply chain. On the one hand, the strategy
of strengthening the formal dairy sector followed by USAID and others is aiming to re-
vamp a supply chain that it is in disarray and their strategy involves the entire supply
chain. On the other hand, JICA’s OVOP strategy aims at creating local supply chains
that sell processed milk directly to consumers, bypassing the formal sector. Further-
more, their strategy does not, to our knowledge, encompasses supply chain stake-
holders beyond the producers (and of course their associations).
At the most direct level of comparison both strategies are actually in conflict with
each other because a key feature of the formal dairy sector is the presence of significant
excess capacity in processing that appears to arise because of the low supply of milk to
the processing sector. The aim of USAID and the other donors’ strategy is to expand
that supply of milk, while JICA’s strategy of supporting direct marketing of pasteurised
milk to consumers worsens the situation by reducing the supply of milk to processors
and increasing their level of inefficiency.
A more substantive comparison involves considering each strategy as an approach to
development. On the one hand, the USAID and others are betting on a formal sector
that can be strengthened to replace the unsafe informal market and satisfy an under-
nourished population with safe dairy products at affordable prices. On the other hand,
JICA’s strategy implies (though it should be noted that this is not explicitly stated)
bypassing the ineffective formal sector to create a local supply of safe dairy products at
affordable prices that can replace the informal sector.
It may be argued that which of these strategies is most appropriate for the develop-
ment of a dairy sector in Malawi, will depend in great measure, on whether the dairy
sector is a competitive one, i.e., whether the processing sector (and also the retail sec-
tor) has market power.12
For example, if the processing sector is not competitive, then, all the work of USAID
and others to expand the supply of milk might be wasted as producers will continue to
receive low prices for their milk, the supply of high quality milk will still be insufficient
for the population, affluent urban consumers will continue paying high prices for their
milk and the informal market will remain. In this context, JICA’s strategy might be
Revoredo-Giha and Renwick Agricultural and Food Economics (2016) 4:8 Page 15 of 23
appropriate because it will not only ensure the expansion of the supply of high quality
milk but also “discipline” the non-competitive processing sector and force them to ex-
pand to compete.
On the other hand, if the processing sector is competitive but inefficient, JICA’s strat-
egy worsens the situation by reducing the amount of milk available to processors due
to encouraging direct marketing of milk and investment should be directed at revamp-
ing the processing industry together with expanding domestic milk production.
In the next section we consider the issue of market power in the Malawian formal
dairy sector in more detail.
Measuring imperfect competition in the Malawian dairy sector
It should be noted that in the absence of statistics to test the degree of market power,
we take a simpler approach using secondary data collected as part of a number of value
chain analyses and use the approach suggested by Landes and Posner (1981) for cases
of market power in antitrust cases.
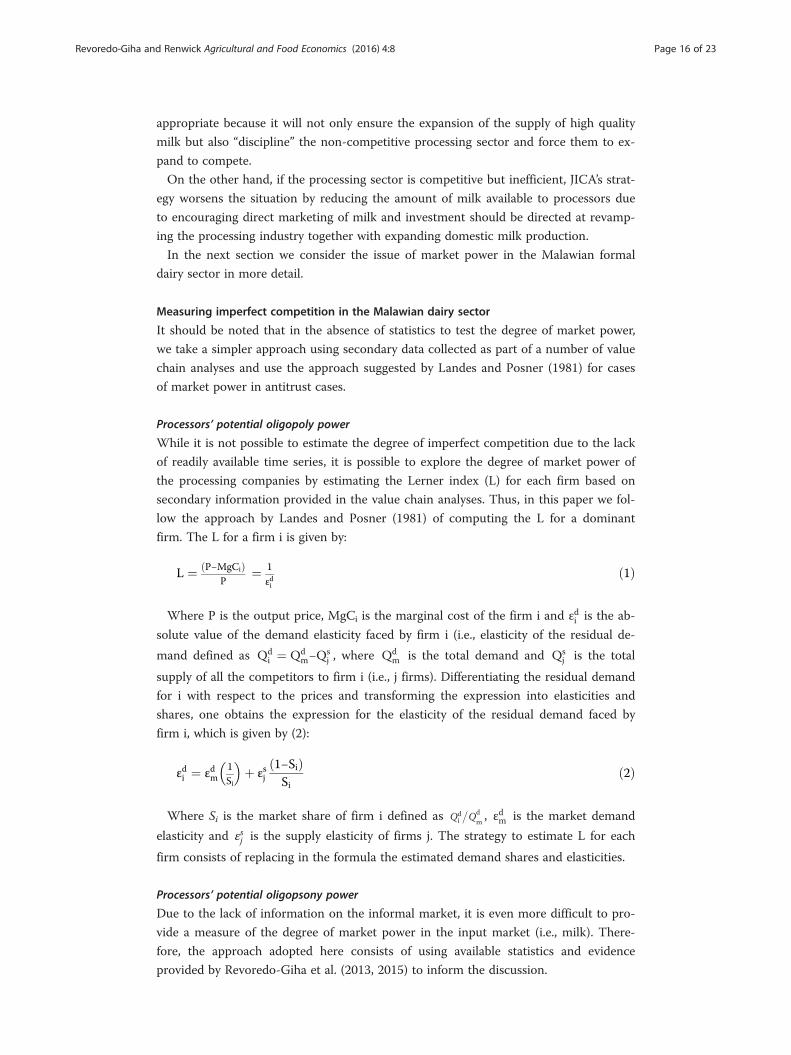
Processors’ potential oligopoly power
While it is not possible to estimate the degree of imperfect competition due to the lack
of readily available time series, it is possible to explore the degree of market power of
the processing companies by estimating the Lerner index (L) for each firm based on
secondary information provided in the value chain analyses. Thus, in this paper we fol-
low the approach by Landes and Posner (1981) of computing the L for a dominant
firm. The L for a firm i is given by:
L ¼ P−MgCið ÞP
¼ 1
εdið1Þ
Where P is the output price, MgCi is the marginal cost of the firm i and εdi is the ab-
solute value of the demand elasticity faced by firm i (i.e., elasticity of the residual de-
mand defined as Qdi ¼ Qd
m−Qsj , where Qd
m is the total demand and Qsj is the total
supply of all the competitors to firm i (i.e., j firms). Differentiating the residual demand
for i with respect to the prices and transforming the expression into elasticities and
shares, one obtains the expression for the elasticity of the residual demand faced by
firm i, which is given by (2):
εdi ¼ εdm1Si
� �þ εsj
1−Sið ÞSi
ð2Þ
Where Si is the market share of firm i defined as Qdi
�Qd
m, εdm is the market demand
elasticity and εsj is the supply elasticity of firms j. The strategy to estimate L for each
firm consists of replacing in the formula the estimated demand shares and elasticities.
Processors’ potential oligopsony power
Due to the lack of information on the informal market, it is even more difficult to pro-
vide a measure of the degree of market power in the input market (i.e., milk). There-
fore, the approach adopted here consists of using available statistics and evidence
provided by Revoredo-Giha et al. (2013, 2015) to inform the discussion.
Revoredo-Giha and Renwick Agricultural and Food Economics (2016) 4:8 Page 16 of 23
Results and discussionThe purpose of this section is to present the results of the analysis and discuss whether
the formal dairy sector in Malawi operates in a non-competitive way: first, with respect to
urban consumers paying high prices for the dairy products (oligopoly) and with respect to
producers receiving low prices for the milk (oligopsony). As mentioned, due to the lack of
available data for the dairy sector, the analysis has been carried on based on the available
information arising from value chains analyses that have been carried out for the sector.13
It is important to mention that the degree of competition in the dairy market has
been mentioned in the value chain analyses, but only in a marginal way. For instance,
this can be illustrated with reference to the report by Kedrock and Agar (2007) for
USAID, which indicates that “the three operating medium processors are reportedly
profitable while running at only 20–35 % of capacity utilization. This is possible because
they target the top 3 % of the population (375,000 people) with the highest disposable in-
come that are relatively price insensitive. This conservative approach removes a good por-
tion of the risk, but it does limit growth and volumes” (Kedrock and Agar 2007, p. 32).
The same authors also state that “Processors also are reported to pay low prices for raw
milk” (Kedrock and Agar 2007, p. 30). Despite that evidence the same authors indicate
that while the formal processing level is highly concentrated, “it appears to be reasonably
competitive. The production level is fairly well organized through associations and MBGs.
Milk moves from source to processor and consumer fairly effectively, if not always effi-
ciently, though it is not uncommon for tankers of milk to be lost from non-collection due
to poor roads and breakdowns” (Kedrock and Agar 2007, p. 32).
Based on the above arguments it is easy to see why market imperfection may fit the
stylised facts that were described in the overview of the Malawi formal dairy sector can
be explained by means of Fig. 6. This figure presents two vertically connected markets.
The top diagram represents the situation of the market for processed milk product,
while the bottom one the market for unprocessed milk. To simplify exposition (and the
diagram), we consider in the figure the situation where processing firms are acting col-
lusively and therefore it corresponds to the situation where they act as a monopoly in
selling (top panel) and a monopsony in buying (bottom panel).
The result of market imperfection is that affluent consumers pay more (PH) for the
pasteurised milk and the firms produce less (QH) than in perfect competition (where
the demand DH intersects the marginal cost of the processing firms MgCH).
The situation in the unprocessed milk market comprises two differentiated sub-
markets: (1) the market for milk to be pasteurised and (2) the informal milk market.
For (1), the result of the “monopsony”14 situation is that processors demand less milk
(QMH) and pay a low price for it (PMH) and dairy producers market the bulk of their
milk in the informal market, where they sell QL at a price PL, which can be higher or
lower than the price paid by the formal sector, depending on factors such as the price
elasticity of the demand and supply for low quality milk (DL, SL), and the total amount
of milk produced.
Processors’ potential oligopoly power
A problem for the estimation of the degree of market power is the lack of available data
to estimate the elasticity of supply of the competitors firms required in the Landes and
Revoredo-Giha and Renwick Agricultural and Food Economics (2016) 4:8 Page 17 of 23
Posner (1981) method. Due to this, Table 3 presents the values of L conditional to pos-
sible values of the supply elasticity of competitors. In the presence of idle capacity one
would expect the supply elasticity to be around one or higher as the firms would not
be constrained in terms of expanding production in response to an increase in price.
Therefore, we assume several values for the elasticity of supply ranging from 0.5 to 2.
In addition, based on data from SHMPA and CREMPA and interviews with processors,
the market shares at the retail level for pasteurised milk have been constructed. The
focus is on pasteurised milk because for other dairy products it is considered that the
DL
SL
QL
PL
QM
PM
MRPH
MFCH
QMH
PMH
AFCH
DH
Q
P
MRH
MgCH
QH
PH
Fig. 6 Malawi dairy market under imperfect competition situation
Table 3 Lerner index (L) for the processing companies conditional to several competitor supplyelasticities
Companies Supply elasticity 2/ Shares (%)
0.5 0.8 1 1.5 2 2012 3/
Processor 1 0.24 0.19 0.17 0.13 0.11 22.4
Processor 2 0.04 0.03 0.03 0.02 0.02 3.8
Processor 3 0.46 0.38 0.34 0.27 0.22 39.7
Processor 4 0.05 0.04 0.03 0.03 0.02 5.1
Processor 5 0.03 0.02 0.02 0.01 0.01 2.9
Processor 6 0.28 0.23 0.20 0.16 0.13 26.1
Source: Own elaboration based on information provided by dairy Malawian processorsNotes1/Market demand elasticity used for the exercise was −0.564 (highest quintile in urban areas) computed by Ecker andQaim (2011)2/Supply elasticity of all the competitors together3/It refers only to the market shares on pasteurised milk sold at the retail level for 2012
Revoredo-Giha and Renwick Agricultural and Food Economics (2016) 4:8 Page 18 of 23
existence of extensive imports prevents market power being exerted by domestic
processors.
Under our assumptions, the results of Table 3 seem to indicate that there is no clear
indication of market power by processors from the product side (pasteurised milk mar-
ket) as reflected in the Lerner index.
Processors’ potential oligopsony power
Whilst no formal tests have been undertaken, previous analysis has provided hints that
the processors have some degree of market power in the input markets. For example,
CYE Consult (2009) speculated that with the low volume of milk being supplied, it was
difficult to understand why the same price was paid throughout the year to dairy
farmers, when common practice in other parts of the world was to increase the price
paid to farmers when production fell due to seasonal factors. This paradoxical result
can be partially explained by the fact that processors have the possibility to use recon-
stituted imported milk powder in their production of dairy products. This could make
the derived demand for milk for processing more elastic and reduce the demand for
domestic milk if producers sought higher prices.15
Another reason for speculating that some degree of market power exists in the input
market is the fact that according to OVOP (2011) one of the reasons for the establish-
ment of the cooperative is to negotiate better prices with processors. Although this is
mentioned in terms of rewarding the production of higher quality milk, it also may
imply that the processors have the capacity to set prices.
More generally, a number of conditions need to be met in order for an oligopsonistic
situation to emerge. Two of these, are that the supply of milk to the processors must
be elastic and that they control a significant share of the market. In terms of supply
elasticity, Revoredo-Giha et al. (2013) estimated that the long term supply elasticity is
in fact elastic (and equal to 1.45). They hypothesise that part of the reason for this is
that as a sizeable proportion of milk enters the informal market then a price rise by
processors is likely to move milk from the informal into the formal market, implying
an elastic response.
However, one of the reasons hypothesised for the elastic supply of milk to processors,
the large informal market, is actually likely to preclude the processors from having real
market power as they do not control a significant enough share of the market. This is
shown in Fig. 7, which uses official statistics to estimate the split in raw milk supplies
over time between the formal and informal markets. The processors are clearly not the
main buyers of milk in Malawi, as the informal market receives over 60 % of the milk
produced.
Further, the evidence provided by Revoredo-Giha et al. (2013, 2015) in relation to the
supply response of milk in Malawi indicates that the role of the processing sector in
setting prices, is likely to be barometric (Scherer and Ross 1990), with the informal sec-
tor being a follower. This is consistent with the fact that the informal sector is not an
organised sector but a number of small traders.
The fact that the processors have idle capacity but not market power appears to sup-
port the argument that the two development strategies are indeed contradictory at the
present time. However, the data underlying Fig. 7, also allows further insights into this
Revoredo-Giha and Renwick Agricultural and Food Economics (2016) 4:8 Page 19 of 23
issue. The scale of milk production (even discounting the very high estimates for 2013)
and the amount of milk that is currently collected by the milk bulking groups for the
formal market (processors and microprocessors) suggests that actually the two studied
strategies could coexist, even with the processing sector operating at full capacity. This
would be the case if milk destined for the informal market could be captured by milk
bulking groups allowing them to supply an increasing demand from both processors
and microprocessors. However, under the current circumstances where the bulking
groups are not attracting this milk, there is an incompatibly between the two strategies
as expansion of micro processing reduces the milk available to processors.
ConclusionsThe purpose of this paper was not only to portray the situation of the Malawi dairy in-
dustry using the most recent available information, but also to show the need of inter-
national donors to coordinate their development plans. This case study shows the need
for detailed discussion on the actions to be taken within a country including the under-
lying rationale, because they do guide the allocation of scarce resources.
In the particular case of the dairy sector in Malawi, the results indicate that it is very
unlikely that the processing industry has either market power in both the output and
input market (milk) and therefore a strategy such as the one carried out by USAID of
reinforcing the formal market seems to be more consistent with the situation of the
dairy industry. Furthermore, given the current extent of milk collection by the milk
bulking groups the second strategy being followed in Malawi, the encouragement of
micro-processing actually conflicts with the reinforcing of the formal market.
An additional conclusion from the analysis is the need to “formalise” the informal
market. If statistics on production are correct, then a large proportion of the milk pro-
duced in Malawi is distributed without any sort of quality control. As the milk is sold
raw (without pasteurisation) nothing in the current system ensures that it will be of
good quality because all the quality controls in Malawi are made at the level of the milk
bulking groups.
0.0
10.0
20.0
30.0
40.0
50.0
60.0
70.0
80.0
90.0
100.0
0
20,000
40,000
60,000
80,000
100,000
120,000
1993
1994
1995
1996
1997
1998
1999
2000
2001
2002
2003
2004
2005
2006
2007
2008
2009
2010
2011
2012
2013
Perc
enta
ge s
old
to in
form
al m
arke
t
sennoT
Total production ofmilk (FAO estimations and GoM official data)Milk delivered to milk
bulking groups in the three regions
Milk delivered to informal market
Percentage of total production going to
informal market
Fig. 7 Total production of milk, milk delivered to processors and percentage of milk outside the formal market
Revoredo-Giha and Renwick Agricultural and Food Economics (2016) 4:8 Page 20 of 23
To add further weight to the importance of analysing the structure of domestic mar-
kets when considering development strategies, it should be noted that the Malawian
dairy sector is not an isolated case. There are a number of other supply chains, born
from industrialisation processes, which are characterised by high levels of idle capacity
and the production of a narrow range of products. These lead to high prices for con-
sumers with important implications not only for economic development, but also for
food security (for example see Gorton and White 2007).
Finally, it should be noted that other strategies are being considered by developing
countries (see for example, Jiaqi and Lambert 2002 or Omore et al. 2004). These in-
clude the creation of “small-scale dairy supply chains” (i.e., through small-scale market-
ing and processing facilities) as a way to contribute significantly to employment in
rural, peri-urban and urban areas. This approach aims to improve the quality of milk
destined for the informal markets. The existence of these other strategies increases the
need for discussion as to whether or not investing in improving ineffective supply
chains is the right approach to follow. However, as argued within this paper, whichever
development approach is followed, it needs to be based on solid evidence and the im-
pacts of different possible strategies need to be evaluated through the use of a range of
important development indicators.
Endnotes1Milk bulking groups are operated by farmers’ associations.2Note that estimated yields (milk production per cow) are a result of the estimation
of the number of dairy animals by FAO and the estimation of the total production of
milk by the Government of Malawi. During the period 1976 to 2011 yields were on
average 4591 Hg/cow with a coefficient of variation of 2.7 %, in 2012 yields were on
average 5525 Hg/cow and in 2013 9091 Hg/cow. Whilst the increase in the number of
cows might be explained by the Presidential Initiative “One Cow per Family” launched
in April 2013 and was supported by donors such as Heifer International, the massive
increase in production and in yields in 2013 is far more difficult to explain.3It is important to note that milk that is rejected from the formal channel is sold to
vendors in the informal market. According to Chimbaza (2010) a high percentage of
the milk sent to the formal channel is rejected due to quality (estimated at 17 %).4The higher price received in the informal market than in the formal market was also
reported by Barnard (2007).5The exchange rate in 2004 was 1 US$ = 108 Malawian Kwacha (MK).6Excess capacity is commonplace in African manufacturing being repeatedly men-
tioned in the development economics literature (e.g., Mytelka 1989 and Mazumdar and
Mazaheri 2003 for several Sub-Sahara African countries).7According to CYE Consultant (2008) a lot of the machinery used by the processors
is out of date and needs replacing. This is especially true with Northern Dairies where
some of the processing machinery is over fifty years old.8According to Fintrac Inc (2008) Malawi imports all of its milk powder requirements,
averaging about 2000 MT per year over the past five years, the equivalent of 15.3 mil-
lion litres of whole milk. The 2007 import data showed a steep decline to 1384 MT, at-
tributed to the unprecedented price increases for milk powder, which in the case of the
EU price of whole milk powder peaked in September 2007 at US$5,500 per MT.
Revoredo-Giha and Renwick Agricultural and Food Economics (2016) 4:8 Page 21 of 23
9Note, however, that the powder milk avoids costs in terms of quality and other mar-
keting costs associated with the milk collection.10This is a working paper produced by the Overseas Development Institute (ODI)
jointly with JICA. The paper reviews JICA’s strategy producing a strengths, weaknesses,
opportunities and threats (SWOT) analysis and comparing it with other donors’ strat-
egies, unfortunately, USAID strategy in Africa is not included in the paper.11In order to maintain the discussion in simple terms and focused on the donors’
strategy, we abstract from the role of imports of milk powder in the Malawi dairy
market.12It should be evident that the issue of market power is a necessary condition but not
sufficient to prefer one alternative strategy to the other. That decision will need to be
based on the consideration of multiple aspects each of which would need to be
‘weighted’. These aspects could be: employment generation; multiplier effects on the
wider population; sustainability of the strategy in terms of, whether it will generate re-
sources that can be reinvested to replace the capital (at the least); etc.13If time series were available the degree of market power could be studied by the ap-
proach presented in Schroeter (1988) or Azzam and Pagoulatos (1990).14MRPH denotes the derived demand for milk by processors, MFCH is the marginal
cost of the milk producers serving the high quality market and AFCH is the average
cost of those producers.15A related issue can be found in the discussion of whether the monetisation of milk
powder as part of USAID’s Programme of Food for Peace would distort the Malawian
dairy domestic market (Fintrac Inc 2008). Thus, on the one hand, Fintrac Inc., in their
report produced for USAID to provide guidance about what commodities should be
monetised, stated that selling milk powder to processors would expand their produc-
tion and reduce their prices with obvious benefit to consumers. On the other hand,
Land O’ Lakes made it clear that it did not support milk powder for monetization due
to its possible effects on the domestic market.
Competing interestsThe authors declare that they have no competing interests.
Author’s contributionsCRG drafted the first version of the paper and proposed the analytical approach. The final draft and structure of thepaper was the result of the discussion of both authors. Both authors read and approved the final manuscript.
AcknowledgmentsThis paper is part of the DFID/ESRC Growth Programme project Assessing the Contribution of the Dairy Sector toEconomic Growth and Food Security in Malawi.
Author details1Land Economy, Environment and Society Research Group, Scotland’s Rural College (SRUC), King’s Buildings, WestMains Road, Edinburgh EH9 3JG, UK. 2School Of Agriculture & Food Science, Agriculture and Food Science, UniversityCollege Dublin, Belfield, Dublin 4, Ireland.
Received: 15 June 2015 Accepted: 3 March 2016
ReferencesAlston JM, Sexton RJ, Zhang M (1997) The effects of imperfect competition on the size and distribution of research
benefits. Am J Agric Econ 79(4):1252–1265Azzam A, Pagoulatos E (1990) Testing oligopolistic and oligopsonistic behaviour: an application to the US meat-packing
industry. J Agric Econ 41(3):362–370Baer W (1972) Import substitution and industrialization in Latin America: experiences and interpretations. Latin Am Res
Rev 7(1):95–122
Revoredo-Giha and Renwick Agricultural and Food Economics (2016) 4:8 Page 22 of 23
Barnard J (2007) Milk enterprise development in Malawi – final report. Volunteer Service Organisation (VSO) Report,ESE/003, Lilongwe
Buck BJ (2008) Designing a private sector oriented dairy designing development program: experience from Africa. LandO’ Lakes. Presentation for the FAO Asia Regional Dairy Conference. November, 19.
Chagunda MGG (2009) Historical perspective. In: Smallholder dairy production in Malawi: current status and futuresolutions, Scoping papers: optimising smallholder dairying project. SAC, Edinburgh
Chagunda MGG, Msiska ACM, Wollny CBA, Tchale H, Banda JW (2006) An analysis of smallholder farmers’ willingness toadopt dairy performance recording in Malawi. Livestock Res Rural Dev 18:5
Chimbaza T (2010) Milk keeping quality in Malawi. In: Smallholder dairy production in Malawi: current status and futuresolutions, Scoping papers: optimising smallholder dairying project. SAC, Edinburgh
Chitika RJ (2008) Marketing channel choice: its determinants and evaluation of transaction costs in smallholder dairyfarming in Lilongwe milkshed area, Malawi. Unpublished Master Thesis, Makerere University.
CYE Consult (2009) Value chain analysis of selected commodities institutional development across the agri‐food sector(IDAF) – 9 ACP MAI 19. Final Report Request for services n°2008/159774/1.
Department of Animal Health and Livestock Development (DAHLD) (2008) Annual livestock census. Ministry ofagriculture and food security, Lilongwe, Malawi
Ecker O, Qaim M (2011) Analyzing nutritional impacts of policies: an empirical study for Malawi. World Dev 39(3):412–428
Fintrac Inc. (2008) Best analysis – Malawi - Bellmon estimation studies for Title II (best) project. Publication produced forreview by the United States Agency for International Development. December. Available online: http://pdf.usaid.gov/pdf_docs/Pnado944.pdf
Flemish International Cooperation Agency (FICA) (2011) Contribution on the dairy sector through farmers associations -Malawi. Description of the project. Accessed online at: [http://www.fica.be/index.php?pid=1&sid=&sit=49] onAugust 2013.
Gorton M, White J (2007) The restructuring of agrifood supply chains in CEE and the CIS Overview and policyimplications. Outlook on Agriculture 36, No 4: 237–246.
Gorton M, Dumitrashko ML, White J (2006) Overcoming supply chain failure in the agri-food sector: a case study fromMoldova. Food Policy 31:90–103
Gow H, Swinnen J (1998) Up- and downstream restructuring, foreign direct investment, and hold-up problems inagricultural transition. Eur Rev Agric Econ 25:331–350
Imani Development Consultants (2004) Review of the Dairy Industry in Malawi, Report prepared for RATES Centre,Ethiopia.
Jiaqi W, Lambert JC (2002) Proceedings of the China-FAO regional Asian workshop on “small-scale milk collection andprocessing in developing countries. FAO, Rome
Kedrock B, Agar J (2007) Assessment of the SME Sector in Malawi in preparation for a development credit authorityloan portfolio guarantee. Report prepared for USAID for the project Deepening Malawi’s Microfinance SectorProject (DMS).
Kurokawa K, Tembo F, te Velde DW (2008) Donor support to private sector development in sub-Saharan AfricaUnderstanding the Japanese OVOP programme. JICA-ODI Working Paper 290.
Kurwijila L, Bennett A (2011) Dairy development: institutions in East Africa: lessons and options. FAO, RomeLandes WM, Posner RA (1981) Market power in antitrust cases. Harv Law Rev 94(5):937–996Malawi Government (2008) Annual economic report. Ministry of economic planning and development, Lilongwe,
http://www.malawi-invest.net/inves_opp_agri.html] on August 2013.Mazumdar D, Mazaheri A (2003) The African manufacturing firm. Routledge, London and New York, 2003.Munthali JTK, Musa FA, Chiwayula CLK (1993) Smallholder dairy development in Malawi. In: Kategile JA, Mubi S (eds)
Proceedings of the workshop future of livestock industries in east and Southern Africa held at Kadoma RanchHotel, Zimbabwe 20–23 july 1992. International Livestock Centre for Africa, Addis Ababa
Mytelka LK (1989) The unfulfilled promise of African industrialization. Afr Stud Rev 32(3):77–137Omore A, Cheng’ole Mulindo J, Fakhrul Islam SM, Nurah G, Khan MI, Staal SJ (2004) Employment generation through
small-scale dairy marketing and processing: experiences from Kenya, Bangladesh and Ghana. FAO, RomeOne village one group (OVOP) (2011). Bvumbwe Dairy Farmers. Available online at: http://www.ovop.org.mw/group_
bvumbwedairy.htmlRevoredo-Giha C, Chitika R (2014) Identifying barriers for the development of the dairy supply chain in Malawi.
Available online at: https://cgspace.cgiar.org/bitstream/handle/10568/64975/IdentifyingBarriers.pdf?sequence=1Revoredo-Giha C, Arakelyan I, Chalmers N, Chitika R (2013) How responsive to prices is the supply of milk in Malawi?
(No. 152214). Available online at: http://r4d.dfid.gov.uk/pdf/outputs/ESRC_DFID/60974_Milk_Supply_Malawi.pdf.Revoredo-Giha C, Arakelyan I, Chalmers N (2015) Processors pricing and smallholders’ milk supply response in Malawi:
an application of the nonlinear autoregressive distributed lag model. In: Contributed paper at the 29th internationalconference of agricultural economists “agriculture in an interconnected world”, Milan august 9–14., p 2015
Scherer FM, Ross D (1990) Industrial market structure and economic performance, 3rd edn., Houghton MifflinSchroeter JR (1988) Estimating the degree of market power in the beef packing industry. Rev Econ Stat 70(1):158–162Winston GC (1974) The theory of capital utilization and idleness. J Econ Lit 12(4):1301–1320
Revoredo-Giha and Renwick Agricultural and Food Economics (2016) 4:8 Page 23 of 23