Macroeconomic Dynamics, 1, 1997, 169–205. Printed in the United States of America. MARKET STRUCTURE, SECURITY PRICES, AND INFORMATIONAL EFFICIENCY J ENNIFER HUANG Sloan School of Management, Massachusetts Institute of Technology J IANG WANG Sloan School of Management, Massachusetts Institute of Technology and National Bureau of Economic Research We consider an economy with an incomplete securities market and heterogeneously informed investors. Each investor trades in the market to hedge the risk to his endowment and to speculate on future security payoffs using his private information. We examine the efficiency of the securities market in allocating risk and transmitting information under different market structures, as defined by the set of securities traded in the market. We show that the introduction of derivative securities can decrease the market’s efficiency in revealing information on security payoffs, and increase the equity premium and price volatility in the market. Keywords: Securities Market, Market Structure, Security Prices, Communication Efficiency 1. INTRODUCTION A securities market performs two important functions: allocating risk and com- municating information among investors [see, e.g., Hayek (1945), Debreu (1959), and Arrow (1964)]. How efficiently the market performs these two functions cru- cially depends on the market structure, as defined by the set of securities traded in the market. Over time, the structure of the securities market changes as new securities are introduced. In the literature, the impact of these changes on the mar- ket’s informational efficiency has been studied separately from the impact on its allocational efficiency. For example, in analyzing the informational role of deriva- tive trading, the allocational trade in the market often is specified exogenously (as “noise”) [see, e.g., Grossman (1977)]. As pointed out by Grossman (1995), the informational role and the allocational role of the securities market are fundamen- tally related. This paper focuses on the interaction between the allocational and The authors thank Kerry Back and Jonathan Berk for comments and gratefully acknowledge financial support from the Taiwan Program at MIT (for Jennifer Huang), the Betterymarch Fellowship and NSF grant SES-9414112 (for Jiang Wang). Address correspondence to: Jiang Wang, E52-435, Sloan School of Management, Massachusetts Institute of Technology, 50 Memorial Drive, Cambridge, MA 02142-1347, USA. c 1997 Cambridge University Press 1365-1005/97 $9.00 + .10 169
Transcript
Macroeconomic Dynamics, 1, 1997, 169–205. Printed in the United States of America.
MARKET STRUCTURE, SECURITYPRICES, AND INFORMATIONALEFFICIENCY
JENNIFER HUANGSloan School of Management, Massachusetts Institute of Technology
JIANG WANGSloan School of Management, Massachusetts Institute of TechnologyandNational Bureau of Economic Research
We consider an economy with an incomplete securities market and heterogeneouslyinformed investors. Each investor trades in the market to hedge the risk to his endowmentand to speculate on future security payoffs using his private information. We examine theefficiency of the securities market in allocating risk and transmitting information underdifferent market structures, as defined by the set of securities traded in the market. Weshow that the introduction of derivative securities can decrease the market’s efficiency inrevealing information on security payoffs, and increase the equity premium and pricevolatility in the market.
A securities market performs two important functions: allocating risk and com-municating information among investors [see, e.g., Hayek (1945), Debreu (1959),and Arrow (1964)]. How efficiently the market performs these two functions cru-cially depends on the market structure, as defined by the set of securities tradedin the market. Over time, the structure of the securities market changes as newsecurities are introduced. In the literature, the impact of these changes on the mar-ket’s informational efficiency has been studied separately from the impact on itsallocational efficiency. For example, in analyzing the informational role of deriva-tive trading, the allocational trade in the market often is specified exogenously (as“noise”) [see, e.g., Grossman (1977)]. As pointed out by Grossman (1995), theinformational role and the allocational role of the securities market are fundamen-tally related. This paper focuses on the interaction between the allocational and
The authors thank Kerry Back and Jonathan Berk for comments and gratefully acknowledge financial support from theTaiwan Program at MIT (for Jennifer Huang), the Betterymarch Fellowship and NSF grant SES-9414112 (for JiangWang). Address correspondence to: Jiang Wang, E52-435, Sloan School of Management, Massachusetts Institute ofTechnology, 50 Memorial Drive, Cambridge, MA 02142-1347, USA.
informational roles of the securities market in analyzing the impact of changingmarket structure.
We consider an economy in which each investor is endowed with nontradedincome and private information about security payoffs. The securities market con-sists of a set of primary securities, including a risk-free security (bond) and arisky security (stock), both with nonzero net supply, and possibly a futures-typederivative security on the stock with zero net supply. An investor trades in themarket both to hedge the risk from his nontraded income and to speculate onfuture security payoffs using his private information. The equilibrium is solvedunder two different market structures, one with only the primary securities be-ing traded, and the other with both the primary and the derivative securities. Weexamine how adding a derivative security to the market changes the trading andpricing of primary securities in equilibrium, and how it affects the allocational andinformational efficiencies of the market.
When investors have symmetric information, the role of the securities marketis primarily to allocate risks among investors. When the market is incomplete,investors are often unable to perfectly hedge their individual risks. Security pricesdepend on both the aggregate and the individual risks in the economy. Introduc-ing derivative securities creates new hedging opportunities and increases alloca-tional efficiency. As a result, it tends to decrease the equity premium and pricevolatility.
When investors have asymmetric information, in addition to allocating risk, themarket also transmits information among investors through the security prices.Not only does introducing derivative securities change the allocational efficiency,but it also changes the informational efficiency of the market. On the one hand,the prices of new securities provide additional signals for investors to learn aboutother investors’ private information, making the market informationally more ef-ficient. On the other hand, the expanded trading opportunities increase the amountof allocational trade and, therefore, generate additional price movements in theexisting securities, making the prices less informative about investors’ privateinformation on the asset payoffs. In some cases, the second effect dominatesand opening derivative trading reduces the informational efficiency of the mar-ket. In contrast to the case of symmetric information, introducing derivative se-curities can increase the equity premium and price volatility under asymmetricinformation.
In the model, we analyze the market equilibrium under both incomplete-marketstructure and asymmetric information. Many authors have considered how marketincompleteness affects investor behavior and market equilibrium.1 In general, theindividual optimization problem is difficult to solve in an incomplete market, andthe results regarding optimal policies are limited. Analyzing the market equilibriumis more difficult and mostly carried out numerically.2 The existence of asymmetricinformation makes the analysis even more formidable.3 Our approach in this paperis to impose specific restrictions on individual preferences and shock distributions.We sacrifice generality for the benefit of being able to obtain closed-form solutions
INFORMATIONAL EFFICIENCY IN SECURITIES MARKETS 171
and analyze in more detail individual portfolio policies, equilibrium security prices,and allocational and informational efficiencies under different market structures.The intuition obtained from the model can be helpful in understanding more generalmodels.
Studies on the informational role of derivative markets include the first formaldiscussion of Grossman (1977), using a single-period model, and the more recentwork of Grossman (1988), Back (1993), and Brennan and Cao (1995), using mul-tiperiod models. All of these papers use the noisy rational expectations framework,in which the allocational trade is introduced exogenously. We, however, use a fullyrational expectations framework and explicitly model both the allocational and in-formational trade in the market. In particular, an investor’s demand for derivativesecurities is derived endogenously from his optimal consumption and investmentpolicies under the new market structure. Hence, we are able to analyze the alloca-tional and informational efficiencies of the securities market, and the interactionbetween these two functions in a unified framework.
The paper proceeds as follows. Section 2 defines the model and Section 3 givesa general discussion of the equilibrium. Section 4 considers the special case inwhich the securities market is complete. The equilibrium under symmetric andasymmetric information is analyzed in Sections 5 and 6, respectively. Section 7concludes. Proofs can be found in the Appendix.
2. THE MODEL
We consider an economy with a continuous time-horizon [0,∞) and a single good(which is also taken as the numeraire). Let(Ä,F , P) be a complete probabilityspace, whereÄ is the set of states of nature describing the exogenous environmentof the economy,F is theσ algebra of distinguishable events, andP is the prob-ability measure on(Ä,F). The uncertainty of the economy is generated by ann-dimensional standard Wiener process defined on(Ä,F , P), denoted byw. Theexogenous information flow is given by the augmented filtration{Ft : t ∈ [0,∞)},which is a set ofσ algebras ofF generated byw.
The economy consists of two classes of investors, denoted byi = 1 or 2, withpopulation weightω and 1− ω, respectively. Investors are identical within eachclass, but are different between the two classes with regard to their endowment andinformation. For convenience, we also refer to any class-i investor as investori .4
The economy is further defined as follows.
2.1. Market Structure
There is a competitive securities market withm+ 1 traded securities, indexed byk = 0, 1, . . . ,m. The menu of traded securities includes:
(0) Security 0 is a risk-free security (bond) that has constant interest rater > 0. Thebond price isBt = ert B0.
172 JENNIFER HUANG AND JIANG WANG
(1) Security 1 is a risky security (stock) that pays a cumulative dividendDt , with
Dt =∫ t
0
(Gs ds+ bD dws), (1a)
Gt = G0 +∫ t
0
eaG(t−s)bG dws, (1b)
whereaG is a negative constant andbD , bG are constant matrices of proper order.Thus, the dividend paid on the stock fromt to t + dt is d Dt = Gt dt + bD dwt ,whereGt gives the expected dividend rate andbD dwt the random shock.St denotesthe stock price att .
(2) Security 2 is a derivative security that pays a dividend at a rate equal to the currentstock price. Thus, the dividend paid fromt to t + dt is St dt. This security is similarto a collar contract in the fixed-income market; hence it is called the collar from nowon.5 Ht denotes the collar price att .
There also may be other securities with payoffs contingent on public information.Except securities 0 and 1, all securities are of zero net supply. The bond (security 0)has infinitely elastic supply at constant interest rater . The stock (security 1) hastotal supply of one share per capita. We denote them-dimensional vectors of cu-mulative cash flow and prices of all risky securities byCt = stack{C1,t , . . . ,Cm,t }andPt = stack{P1,t , . . . , Pm,t }, whereCk,t , Pk,t are the cumulative cash flow andmarket price of securityk(k ≥ 1), respectively.6 Let
d Qt = dCt + d Pt − r Pt dt
be the vector of excess share returns of all risky securities. The first component,d QS
t = d Dt + dSt − r St dt, gives the dollar return on one share of stock financedby borrowing at the risk-free rate. Similarly, the second component,d QH
t =St dt + d Ht − r Ht dt, gives the excess share return on the collar.
For any claim traded in the market, enforceability requires that its payoff becontingent only on public information. When all investors have perfect informationabout the underlying state of the economy, the payoff of a security can be madecontingent on the realization of the state. In general, however, some investors donot observe the underlying state. Security payoffs then should be made contingentonly on the information that is publicly available. Thus, in changing the marketstructure, we restrict our attention to the set of derivative securities whose payoffsdepend only on the market prices of other traded securities. In particular, weconsider the collar contract. The two market structures to be examined are
(a) Market structure I—only the stock and the bond are traded,(b) Market structure II—the collar also is traded in addition to the stock and the bond.
2.2. Endowments
Each investor is initially endowed with one share of the stock and a flow ofnontraded income. Investori ’s cumulative nontraded incomeNi,t (i = 1, 2) is
INFORMATIONAL EFFICIENCY IN SECURITIES MARKETS 173
given by
Ni,t =∫ t
0Yi,sbN dws, Yi,t = βi,YYt + βi,Z Zt , (2a)
Yt = Y0+∫ t
0eaY(t−s)bY dws, (2b)
Zt = Z0+∫ t
0eaZ(t−s)bZ dws, (2c)
whereaY,aZ are negative constants, andβi,Y, βi,Z, bN, bY, bZ are constant matri-ces of proper order. To fix ideas, we assume that|aY| < |aZ|. Thus,Yt and Zt
correspond, respectively, to the relatively more persistent and the more transitorycomponents of investor 1’s exposure to nontraded risk. Investori ’s nontraded in-come fromt to t + dt is d Ni,t = Yi,t bN dwt , wherebN dwt is the shock to thenontraded income process, andYi,t determines investori ’s exposure to this non-traded risk.7 For simplicity, we have assumed zero drift for the nontraded-incomeprocess. Extending the current model to allow a drift term is possible.
2.3. Information Distribution
Both investors observe the public information, which includes the path of divi-dend payments and market prices of all traded securities{Cs, Ps: 0≤ s ≤ t}. Theexpected dividend rateGt and individual investors’ exposure to nontraded incomeYi,t are private information. To simplify notation, defineXt = stack{Gt ,Yt , Zt },which fully determines the distribution of future stock payoffs and aggregate non-traded income. We assume that investor 1 observes the realization ofXt . Investor2, on the other hand, only observes a set of signals aboutXt . The signal processUt (which can be multidimensional) is given by
Ut =∫ t
0(aU Xs ds+ bU dws), (3)
whereaU andbU are constant matrices of proper order.Let Fi,t ,F {P,C}t denote the filtrations generated by the information set of in-
vestori and by the path of prices and dividends att ∈ [0,∞), respectively. Then,F1,t =F0⊗F {P,C,N1,X} andF2,t =F0⊗F {P,C,N2,U }, whereF0 is the investors’ priorinformation onX0= stack{G0,Y0, Z0}. Furthermore,F {P,C}t ⊆ F2,t ⊆ F1,t =Ft .The information of investor 1 (weakly) dominates that of investor 2. When thedominance is strict, we call investor 1 the informed and investor 2 the uninformed.If X0 ≤ F0,aU is full ranked andbU = 0,U[0,t ] fully revealsXt and investor 2becomes fully informed as well. This gives one example of symmetric informationwhereF1,t = F2,t = Ft .
174 JENNIFER HUANG AND JIANG WANG
2.4. Policies and Preferences
For investori (i = 1, 2), let {ci,t , θi,t : t ∈ [0,∞)} be his consumption and tradingpolicies, whereci,t dt is his consumption fromt to t + dt and θi,t is the m-dimensional vector of his shareholdings in all risky securities att . His policiesare adapted toFi,t . Consumption policies are restricted to integrable processes,and trading policies are restricted to predictable, square-integrable processes withrespect to the gain processes of the traded securities [see, e.g., Harrison and Pliska(1981) for a discussion on the requirement of square integrability].8
We assume that investors maximize expected utilities of the following form
E
[−∫ ∞
te−ρ(s−t)−γ ci,s ds
∣∣Fi,t
], i = 1, 2, (4)
whereρ andγ (both positive) are the time discount coefficient and the absoluterisk-aversion coefficient, respectively. This particular form of the utility functionhelps to solve the equilibrium in closed form.
2.5. Equilibrium Notion
Prices of risky securities are determined by the equilibrium of the economy. Thenotion of equilibrium is the standard one of rational expectations [see, e.g., Radner(1972)]. It is defined as a price process{Pt } under which each investor adoptsfeasible consumption and trading policies that maximize his expected utility
Ji,t = supci ,θi
E
[−∫ ∞
te−ρ(s−t)−γ ci,s ds
∣∣Fi,t
](5)
s.t. dWi,t = (rWi,t − ci,t ) dt + θ ′i,t d Qt + d Ni,t ,
wherei = 1, 2, and the market clears
ωθ1,t + (1− ω)θ2,t = 1(m,1)11 . (6)
Here, 1(p,q)lm denotes anindex matrixof order (p × q) with its (l ,m)th ele-ment being 1 and all other elements being 0. The transversality condition of theMerton (1971, 1989) type is imposed on each investor’s optimization problem:lims→∞E[ Ji,s |Fi,t ]= 0.9 We only consider the stationary equilibrium of theeconomy.
2.6. Further Simplifying Assumptions
To be more specific, we assume that then-dimensional Wiener processw has thefollowing decomposition:
whereιdenotes identity matrices of proper order. The above specification about theunderlying shocks to the economy has simple interpretations. For example,wD,t
andwG,t characterize the shocks to stock dividends,wY,t andwZ,t characterizethe shocks to individual investor’s exposure to the nontraded risk. The aboveassumptions about theb’s impose specific structure on the correlation among thestate variables. In particular, the stock dividends are correlated with the nontradedincome whenκDN 6= 0. To fix ideas, we maintain the assumption thatκDN > 0throughout this paper. The specific correlation structure assumed here simplifiesour analysis without great loss of generality on the points we want to make.
To guarantee the existence of an equilibrium, we impose the following parameterrestrictions:
σNσY <r − 2aY
2√
2r γ, σNσZ <
r − 2aZ
2√
2r γ. (7)
Equation (7) requires that the variability in the nontraded income is not too large.The economy as defined above exhibits the following features. First, the secu-
rities market is, in general, incomplete [see, e.g., Harrison and Kreps (1979) fora formal definition of market completeness]. Second, the existence of nontradedincome and its correlation with returns on traded securities generate allocationaltrade in the market. Third, the existence of private information on future securitypayoffs gives rise to the informational trade between the two classes of investors.In particular, class-1 investors speculate in the market on the basis of their privateinformation and expect to earn excess returns.
For future convenience, we introduce some notation. For any state variable thatinvestor 2 does not directly observe, ˆ· = E[· |F2,t ] denotes his conditional expec-tation. In particular,Xt = E[Xt |F2,t ] denotes investor 2’s conditional expectationof Xt ando(2) = E[(Xt − Xt )
2 |F2,t ] is the conditional variance.Letβi = stack{0, βi,Y, βi,Z}, i = 1, 2. (Here, we use 0 to denote matrices of zeros
without specifying their order, which can be inferred from the context.) Investori ’s nontraded income then can be expressed as
Ni,t =∫ t
0β ′i XsbN dws, (8)
wherei = 1, 2.For any two random variablesep andeq, wheredek = ak dt+bk dwt , k = p,q,
let σkl = bkb′l denote the instantaneous cross-variation betweenek andel , σ2k =
176 JENNIFER HUANG AND JIANG WANG
σkk, κkl = σ−1/2kk σklσ
−1/2ll be the instantaneous cross correlation (assuming that
σkk is positive definite) [see, e.g., Karatzas and Shreve (1988) for a discussion oncross-variation processes].
3. GENERAL DISCUSSION ON EQUILIBRIUM
We now provide a general discussion on the equilibrium of the economy as definedin Section 2. As mentioned earlier,Xt = stack{Gt ,Yt , Zt } fully determines thedistributions of future stock payoffs and nontraded income. Not directly observingXt , investor 2 relies on his expectationXt (and possibly other moments) in forminghis trading policy. Consequently, the equilibrium of the economy depends not onlyon the true value ofXt , but also on investor 2’s conditional expectationXt . Define1t = Xt − Xt to be the estimation error of investor 2. LetX1,t = stack{1, Xt ,1t }andX2,t = stack{1, Xt }.
We restrict our attention to the linear, stationary equilibria of the economy inwhich security prices are linear, time-independent functions ofXt andXt only. Inparticular, we can express the prices and cumulative payoffs of the traded securitiesas follows:
From (9) and (10), the excess share returns on the risky securities can be ex-pressed as
d Qt = dCt + d Pt − r Pt dt = ai,Q X1,t dt + bi,Q dwi,t , i = 1, 2, (12)
wherea1,Q = λC + λP(a1,X − r ι), b1,Q = bQ = bC + λPb1,X,a2,Q = λC +λP(a2,x − r ι), andb2,Q = bC + λPb2,X with λC = (λC
0 , λCX) andλP = (λP
0 , λPX).
BecauseXi,t follows a Gaussian Markov process underFi,t , it fully characterizesinvestori ’s current and future investment opportunities and endowments.
Given (9), (10), and (12), we can solve for individual consumption and tradingpolicies. The results are given in the following lemma.
LEMMA 2. Given(9), (10),and (12), investor i ’s optimal policies and valuefunction are
θi,t = hi Xi,t , ci,t = rWi,t − 1
2γX′i,tvi Xi,t − 1
γln r, (13a)
Ji,t = −e−ρt − r γWi,t + 12 X′i,tvi Xi,t , (13b)
where i= 1, 2 and
hi = (r γbQb′Q)−1 (ai,Q + bQb′i,Xvi − r γbQb′Nβ
′i ) (14)
if vi solves
(r γ )2h′i (bQb′Q) hi − (r γβi bN + vi bi,X)(r γβi bN + vi bi,X)′
+ r vi − (a′i,Xvi + vi ai,X)− vi 1
(di ,di )11 = 0. (15)
Here, vi = 2(r − ρ − r ln r )+ tr(b′i,Xvi bi,X), d1 = 7, and d2 = 4.
Given investori ’s trading policy in (13), the market clearing condition in (6)can be written as
ωh1+ (1− ω)h2τ = 1(m,1)11 , (16)
whereτ = (ι, stack{0, ι}).The price function in (9), the solution to investor 2’s expectations in Lemma 1,
the solution to both investors’ optimal policies in Lemma 2, and the market-clearingcondition (16) fully characterize a linear, stationary equilibrium of the economy ifit exists. The following theorem states the conditions under which the equilibriumexists.
178 JENNIFER HUANG AND JIANG WANG
THEOREM 1. For the economy defined in Section2, there exists(generically)a linear stationary equilibrium under both market structure I and II forω close to1. In the equilibrium, security prices and payoffs have the form of(9); the class-2investors’ expectations satisfy(10); investors’ optimal policies are given in(13);and the coefficientsλ, o, h, vi , i = 1, 2, solve the system(10b), (14), (15),and(16).
Several comments on the existence result follow. First, the condition thatω isclose to one is needed for technical reasons in proving the existence of an equi-librium. Our proof is based on a continuity argument. Whenω= 1, investors areidentical and all-informed, the market is effectively complete [see, e.g., Lucas(1978)]. A unique, linear, stationary equilibrium exists. By showing that the sys-tem to be solved for an equilibrium is nondegenerate atω= 1, we can prove thatits solution also exists forω close to one. The proof itself, however, does notsay how close to oneω needs to be. Second, the existence is only in the genericsense. This means that an equilibrium exists for all parameter values in the pa-rameter space,exceptpossibly a measure zero set. Because of the large numberof parameters and the particular approach used in the proof, we are unable toestablish if this set is actually empty, which would give us absolute existence.Third, except atω= 1, we have little knowledge concerning the uniqueness of thesolution.
The actual solution to the equilibrium is obtained by numerically solving thesystem (10b), (15), and (16). Recognizing the nature of our existence result, wealways start from the pointω= 1 in our numerical algorithm, and decrease itgradually to reach desired values ofω∈ [0, 1]. This helps us to find a solution andstay on the same solution branch if multiple solutions exist. We have exploredextensively in the parameter space following the above approach, and finding anumerical solution was quite easy.
Most of our analysis is based on numerical illustrations. Given the large numberof parameters in the model, only the results for a small range of parameter valuesare presented for brevity. The parameter values are chosen to be compatible withCampbell and Kyle’s (1993) estimated price process, which has a linear formsimilar to ours. The remaining degrees of freedom are used to fix a particular setof parameter values that generate simultaneously all results in this paper. As acost, some of the effects may seem small for this set of parameter values eventhough they can be larger for other parameter values. When a particular resultunder consideration changes qualitatively with certain parameters, we try to showthe changes by varying the relevant parameters in the numerical illustrations orto discuss them verbally. In particular, we focus on two parameters:σY andω,whereσY is the instantaneous variability in investor 1’s exposure to nontradedincome andω is the population weight of investor 1. These two parameters capturethe heterogeneity between the two investors and its relative importance to theequilibrium. Obviously, our exploration of the parameter space and the resultspresented in the paper are by no means exhaustive.
In our analysis, we make an additional assumption about the distribution ofnontraded income among investors. It is clear that the nature of the equilibrium
INFORMATIONAL EFFICIENCY IN SECURITIES MARKETS 179
depends on the distribution of risky endowments among investors. For some dis-tributions of the nontraded income, the equilibrium becomes fully revealing undermarket structure II. In this case, the introduction of derivative trading clearlyimproves the informational efficiency of the market. In the remainder of thepaper, however, we focus on those distributions of the nontraded income un-der which the equilibrium is nonfully revealing under both market structures Iand II. In this case, the impact of derivative trading on the informational effi-ciency of the market is less obvious. In particular, we setβ1 = stack{0, 1, 1}andβ2 = stack{0, 0, 0} in (8). In other words, only investor 1 is endowed withnontraded income.
4. CASE OF COMPLETE MARKET
We first consider the case in which the market is effectively complete. In particular,we consider the case whenω = 1 and the economy is populated only by class-1investors. This case provides some basic understanding about the model, which isuseful in analyzing more general cases.
When the securities market is complete (or effectively complete), the equilibriumallocation is Pareto optimal and does not depend on the actual market structureas long as it satisfies the spanning property [see, e.g., Duffie and Huang (1985)].Solving individual optimization problem and market clearing condition, we havethe following theorem.
THEOREM 2. Whenω = 1, the economy has a unique linear, stationary equi-librium of the form in Theorem1. In particular, the stock price is
St = λSXt = 1
r − aGGt + λS
0 + λSYt + λSZt , (17)
the investors’ value function is Jt = −e−ρt−r γWt+(1/2)X′tv Xt , and their optimalconsumption policy is ct = rWt − (1/2γ )X′tv Xt − (1/γ ) ln r , where λS and vare constant matrices of proper order given in AppendixA.3. For any derivativesecurity(k > 1) with cumulative payoff Ct =
∫ t0 ( f (Xs, s) ds+ bC dws), if its
price is twice differentiable with respect to Xt and once differentiable with respectto t, then P(Xt , t) satisfies the following equation:
where∂X P denotes the vector of first-order derivatives of P with respect to el-ements of X, ∂2
X P the matrix of second-order derivatives, and∂t P its derivativewith respect to t.10
To better understand the nature of the equilibrium, we consider a special casewhenZt = 0∀ t , andYt fully characterizes the exposure to nontraded risk. In this
180 JENNIFER HUANG AND JIANG WANG
case, we havev = diag{v00, vY Y, 0}, where
vY Y =(2σ 2
Y
)−1[(r − 2aY)−
√(r − 2aY)2− 4(r γ )2σ 2
Nσ2Y
]> 0,
v00 = (1/r )σ 2YvY Y+ r γ λS
0 + (2/r )(r − ρ − r ln r ),
and
λSY = −r γ σDN
/(r − aY − σ 2
YvY Y),
λS0 = −γ
[1
(r − aG)2σ 2
G + σ 2D +
(λS
YσY)2].
Furthermore,vY Y, |λS0|, and |λS
Y| increase withσY. It follows that an investor’soptimal consumptionct decreases with his exposure to nontraded riskYt , reflect-ing the investor’s precautionary saving. When the investor faces higher risk in hisfuture nontraded income, his marginal utility for future consumption increases.Under constant interest rate, he decreases current consumption to save more forfuture consumption.
The stock price is a simple linear function of the underlying state variables,St = [1/(r −aG)]Gt +λS
0+λSYYt , where [1/(r −aG)]Gt gives the expected value
of the stock’s future cash flow discounted at the risk-free rate, andλS0 + λS
YYt isthe risk premium on the stock. The constant component of the risk premiumλS
0is proportional to the investors’ risk aversion and the instantaneous variance ofthe stock price. This is because an investor’s consumption covaries linearly withthe stock price (because his wealth does). The covariance between consumptionchanges and stock returns depends linearly on the variance of stock returns. Sodoes the risk premium.
The time-varying component of the risk premium is linear inYt with propor-tionality coefficientλS
Y. It is easy to show thatr −aY−σ 2YvY Y > 0. Hence,λS
Y hasthe opposite sign ofσDN . Note thatσDN being positive implies positive correlationbetween shocks to an investor’s nontraded income and shocks to the stock payoff.WhenYt > 0, the investor has a positive exposure to the nontraded risk. Investingin the stock then becomes less desirable given a positiveσDN . In equilibrium,the stock price has to decrease withYt . Thus,λS
Y is negative. Furthermore, as thevolatility σY of the aggregate exposure to nontraded risk increases, an investor’sexpected utility becomes more sensitive to the changes in his exposure to nontradedrisk (i.e.,vY Y increases). The stock price becomes more sensitive toYt and|λS
Y|increases.
The price of a derivative security must satisfy the pricing equation (18) withappropriate boundary conditions. As an example, we solve for the collar price. Itpays a dividend at a rate equal to current stock price.Ht should be a function ofXt
only, independent of the calendar timet , i.e., Ht = H(Xt ). Given thatXt followsa Gaussian Markov process, it can be shown thatH(·) is linear. Thus,
Ht = H(Xt ) = λH Xt ,
INFORMATIONAL EFFICIENCY IN SECURITIES MARKETS 181
whereλH = (λH0 , λ
HG , λ
HY , λ
HZ ) is a constant matrix. Substituting this into equation
(18), we obtain
λH = λS[r ι− aX + (r γ )σX Xλ
S′1(1,4)11 + (r γ σX N − σXYvY Y) 1(1,4)13
]−1,
which fully specifies the equilibrium collar price. (The matrix in the square bracketis full ranked.)
5. CASE OF SYMMETRIC INFORMATION
We now consider the case whenF1,t =F2,t =Ft and all investors are fully in-formed about the underlying state of the economy. This is a special case of thegeneral model when investor 2’s private signalUt is fully informative of the unob-served state variables(e.g., whenaU is full ranked andbU = 0). This case allowsus to focus on the change in allocational trade among investors and its impact on theequilibrium risk allocation and security prices when the market structure changes.The result in this section serves as a benchmark when we introduce informationaltrade in Section 6. Note that under both market structures I and II, the market isincomplete.
5.1. Equilibrium Under Market Structure I
Under market structure I, only the stock and the bond are traded. LetXt = stack{1,Yt , Zt }, aX = diag{0,aY,aZ} andbX = stack{0, bY, bZ}. Then,dXt = aX Xt dt+bX dwt . Applying Theorem 1 to this case yields the following corollary:
COROLLARY 1. Under market structure I, whenFi,t = Ft ∀ t, i = 1, 2, β1 =(0, 1, 1)′, β2 = (0, 0, 0)′, andω is close to one, the economy has a linear, station-ary equilibrium in which the stock price and investors’ policies are
where i= 1, 2, λS, hi , vi are constant matrices determined by equations(14)–(16)with aQ = λS(aX − r ι) and bQ = λsbX + [1/(r − aG)]bG + bD.
We first examine the equilibrium trading strategy for investor 1. From marketclearing, we can easily infer the strategy for investor 2. From Corollary 1, investor1’s stockholding is a linear function ofYt andZt , that is,θS
1,t = hS1,0 + hS
1,YYt +hS
1,Z Zt . First note that it does not depend onGt , the expected future stock payoff.Under symmetric information, any information onGt is fully reflected in thecurrent stock price. Because investors have constant absolute risk aversion andtheir demand for risky securities is independent of wealth, they have no incentiveto trade asGt changes. The stockholding, however, does depend onYt and Zt ,
182 JENNIFER HUANG AND JIANG WANG
FIGURE 1. Hedging intensity for investor 1 under symmetric information and marketstructure I [parameters have the following values:ρ= 0.1, γ = 20, r = 0.06, aG=−0.2,aY =−0.2,aZ =−0.5,σD = 0.7,σG= 0.6,σZ = 0.5,σN = 0.22,κDN = 0.5,β1= (0, 1, 1)′,andβ2= (0, 0, 0)′].
because investor 1 uses the stock to hedge his nontraded risk. Given the linearform of investor 1’s stockholding, it is sufficient to look at the coefficientshS
1,Y andhS
1,Z , which characterize the intensity of his hedging trade in response to changesin his exposure to nontraded risk.
Figure 1 plotshS1,Y for different values ofσY andω. BecauseYt and Zt play
similar roles in the model, we focus only onYt from now on. Consider the situationwhenYt > 0 and investor 1 has a positive exposure to the nontraded risk. Becausethe stock dividends are positively correlated with the nontraded income(σDN > 0),investor 1 reduces his stockholding to hedge his nontraded risk. By doing so, hereduces the overall variability of his wealth. For example, when the nontradedincome is low, it is more likely that the dividend on the stock is also low. Thehedging position in the stock (by selling the stock) then yields a high payoff,which compensates for the low level of nontraded income. This implies thathS
1,Ymust be negative as Figure 1 confirms. Furthermore, asσY increases, investor 1’smarginal utility becomes more sensitive to changes in his exposure to nontradedrisk. Given a level of his exposure (i.e., a value ofYt ), he tends to hedge moreaggressively using the stock. Thus,|hS
1,Y| increases withσY.Whenω= 1, the economy is populated only by class-1 investors. Nobody takes
the opposite side for his hedging trade. Hence,hS1,Y approaches zero. Asω de-
creases, more class-2 investors are present to make the market, which allowsclass-1 investors to hedge more aggressively, and|hS
1,Y| increases.We now consider stock risk premium and price volatility. Figure 2 plotsλS
0andσ S for different values ofσY andω. As σY increases, investor 1 trades moreaggressively in the stock to hedge his nontraded risk. Consequently, the stock price
INFORMATIONAL EFFICIENCY IN SECURITIES MARKETS 183
A)
B)
FIGURE 2. Stock risk premium and price volatility under symmetric information and mar-ket structure I [other parameters have the following values:ρ= 0.1, γ = 20, r = 0.05,aG=−0.2, aY =−0.2, aZ =−0.5, σD = 0.7, σG= 0.2, σZ = 0.4, σN = 0.22, κDN = 0.6,β1= (0, 1, 1)′, andβ2= (0, 0, 0)′].
becomes more sensitive toYt and the absolute value ofλSY increases. Given that
stock price is linear inλSYYt , asσY increases, the price becomes more volatile
due both to its increased sensitivity toYt and to the increased volatility ofYt . Asthe stock price becomes more volatile, investors require a higher risk premium,leading to a higher value of|λS
0|.
184 JENNIFER HUANG AND JIANG WANG
The dependence ofλS0 andσ S onω is also quite intuitive. For larger values ofω,
the population of investor 1 is larger and so is the aggregate exposure to nontradedrisk (for given values ofYt and Zt ). The stock price becomes more sensitive tochanges inYt and Zt . Thus, the stock demands a higher premium and exhibitslarger price volatility.
5.2. Equilibrium Under Market Structure II
In addition to the stock and the bond, a derivative security (collar) also is tradedunder market structure II. Investors can achieve a larger set of possible payoffs. Inparticular, they can construct trading strategies to better hedge their nontraded risk.The new trading opportunities created by the introduction of the collar contractcertainly affect the stock price and the equilibrium allocation. From Theorem 1,we have
COROLLARY 2. Under market structure II, whenFi,t = Ft ∀ t andω is closeto 1, the economy has a linear, stationary equilibrium in which the security pricesand investors’ consumption and security holdings are
St = 1
(r − aG)Gt + λSXt , Ht = 1
(r − aG)2Gt + λH Xt ,
(θS
i,t
θ Hi,t
)= hi Xt , ci,t = rWi,t − 1
2γX′tvi Xt − 1
γln r,
where i= 1, 2,andλS, λH , hi , andvi are determined by equations(14)–(16)with
aQ = λ(aX − r ι)+ stack{0, λS}
and
bQ = stack{λS, λH }bX + stack
{1
r − aG,
1
(r − aG)2
}bG + stack{bD, 0}.
Figure 3 plotshS1,Y andhH
1,Y, the trading intensities in both markets for investor1. To understand investor 1’s trading behavior, we still consider the situation whenYt > 0, that is, the investor has a positive exposure to the nontraded risk. Given thepositive correlation between stock dividends and his nontraded income, investor 1wants to reduce his stockholding to hedge his nontraded risk. However, returnson the stock depend not only on the realization of current dividends, but also onchanges in its price. Hence, the stock does not provide a perfect hedge. By goingshort in the stock, investor 1 exposes himself to the risk of future price changes.This risk, which is unrelated to the risk to be hedged, is called the basis risk of thehedging instrument. The existence of basis risk makes the stock a less attractivehedging vehicle and limits investor 1’s hedging trade.
INFORMATIONAL EFFICIENCY IN SECURITIES MARKETS 185
A)
B)
FIGURE 3. Hedging intensity for investor 1 under symmetric information and marketstructure II [parameters have the following values:ρ= 0.1, γ = 20, r = 0.06, aG=−0.2,aY =−0.2,aZ =−0.5,σD = 0.7,σG= 0.6,σZ = 0.5,σN = 0.22,κDN = 0.5,β1= (0, 1, 1)′,andβ2= (0, 0, 0)′].
With the introduction of the collar, whose price is positively correlated to thestock price, investor 1 can use the collar to offset the basis risk in his hedgingposition. In the above example, whenYt > 0, investor 1 can take a long position inthe collar to hedge the basis risk in his short position in the stock. Indeed, Figure 3
186 JENNIFER HUANG AND JIANG WANG
shows thathH1,Y has the opposite sign ofhS
1,Y. By combining the stock and thecollar, investor 1 is now able to establish a hedging position (against his nontradedrisk) with much less basis risk. (The remaining basis risk is due to the imperfectcorrelation between the stock dividend and the nontraded income, and betweenthe stock price and the collar price.) The reduction in basis risk increases investor1’s hedging intensity. Comparing Figures 1 and 3A shows that the absolute valueof hS
1,Y is much larger under market structure II than under market structure I.Figure 4 shows how the stock risk premium and price volatility change with
σY andω. Qualitatively, their behavior is similar to that under market structure I.For brevity, we have omitted the premium and price volatility of the collar, whichvaries withσY andω in a fashion similar to that of the stock.
5.3. Comparing Market Structures I and II
To see more clearly the impact of collar trading on the equilibrium, we plot inFigure 5 the differences in stock risk premium and price volatility between marketstructures I and II. From the above discussion, opening collar trading allows aninvestor to better hedge his nontraded risk, and reduces the individual risk he bears.As a result, the stock price becomes less sensitive to the changes in individualexposure to nontraded risk. Figure 5A shows that the risk premium on the stock, asmeasured by|λS
0|, decreases as the derivatives market opens, and Figure 5B showsthat the stock price volatility also decreases.
The impact of collar trading on stock premium and price volatility dependson the heterogeneity among the two classes of investors. It is negligible whenω
approaches 1 or 0, but becomes significant whenω is in the middle range of [0, 1].For ω = 1 or 0, the economy is populated only by class-1 or class-2 investors,respectively. There is no heterogeneity among investors, the market is effectivelycomplete, and the introduction of collar has no impact on the equilibrium. Whenω is in the middle range of [0, 1], the heterogeneity among investors becomessignificant, and so is the impact of opening collar trading. For a given value ofω, theheterogeneity increases withσY. Thus, the impact of trading on stock premium andprice volatility is increasing withσY. For the parameter values shown in Figure 5,opening collar trading always reduces the stock premium and price volatility.However, for large values ofσY, we have found cases in which collar trading canincrease the stock risk premium.
6. CASE OF ASYMMETRIC INFORMATION
In Section 5, we discussed the impact of changing market structure on equilibriumrisk allocation and security prices when investors trade only for allocational rea-sons. In the presence of asymmetric information, changing market structure notonly changes risk allocations, but also changes the information revealed throughthe security prices. Comparing the equilibrium under asymmetric information withthat under symmetric information, we can see the interaction between the infor-mational and allocational functions of the market. We maintain the assumption
INFORMATIONAL EFFICIENCY IN SECURITIES MARKETS 187
A)
B)
FIGURE 4.Stock risk premium and price volatility under symmetric information and marketstructure II [parameters have the following values:ρ = 0.1, γ = 20, r = 0.06,aG=−0.2,aY =−0.2,aZ =−0.5,σD = 0.7,σG= 0.6,σZ = 0.5,σN = 0.22,κDN = 0.5,β1= (0, 1, 1)′,andβ2= (0, 0, 0)′].
that only investor 1 is informed and exposed to nontraded income. Without loss ofgenerality, assume investor 2’s private signalUt contains no useful information.Therefore, he learns his information only from the cash flows and market prices ofthe traded securities. Formally,F2,t =F {P,C}t ⊆F1,t =Ft . The actual informationcontent ofF2,t now crucially depends on the market structure.
188 JENNIFER HUANG AND JIANG WANG
A)
B)
FIGURE 5.Change of stock risk premium and price volatility from market structure I to II un-der symmetric information [parameters have the following values:ρ= 0.1,γ = 20,r = 0.06,aG=−0.2, aY =−0.2, aZ =−0.5, σD = 0.7, σG= 0.6, σZ = 0.5, σN = 0.22, κDN = 0.5,β1= (0, 1, 1)′, andβ2= (0, 0, 0)′].
6.1. Equilibrium Under Market Structure I
The equilibrium of the economy under market structure I again can be stated asa special case of the general results in Theorem 1. As noted in Section 3, thestate vector in general includes investor 2’s estimationXt of the unobserved state
INFORMATIONAL EFFICIENCY IN SECURITIES MARKETS 189
variablesXt = stack{Gt ,Yt , Zt }. The stock price reveals a linear combinationof these variables:(λS
X − λS1)Xt . Thus,(λS
X − λS1)Xt = (λS
X − λS1)Xt , or (λS
X −λS1)1t = 0. Only two degrees of uncertainty remain in investor 2’s estimation
error. In particular,1Z = Zt − Zt can be expressed as a linear combination of1G= Gt−Gt and1Y = Yt−Yt . Incorporating this observation into our descriptionof the equilibrium, we have the following corollary.
COROLLARY 3. Under market structure I, whenF1,t =Ft ,F2,t =F {P,C}t ,β1= (0, 1, 1)′,β2= (0, 0, 0)′, andω is close to1, the economy has a linear sta-tionary equilibrium in which investor i ’s policies and the stock price are
An important characteristic of the equilibrium is the information asymmetrybetween the two investors, measured by the conditional standard deviation of in-vestor 2’s estimation of the unobserved state variables. LetoGG = {E[(Gt −Gt )
2 | F2,t ]}1/2 denote the information asymmetry concerning future stock pay-offs, andoY Y = {E[(Yt − Yt )
denote the information asymmetry concerning investor 1’s hedging need.Figure 6 plotsoGG and oY Y againstσY andω. The plot foroZ Z is omitted
here because its behavior is similar to that ofoY Y. Increasingω, the populationweight of class-1 (informed) investors, has two offsetting effects on the informationasymmetry between the two classes of investors. On one hand, as more informedtraders take speculative positions, more information is incorporated into the prices.On the other hand, there is also more hedging trade in the market because onlyclass-1 investors are endowed with nontraded income. The increase in hedgingtrade introduces additional movements in the stock price that are unrelated to itspayoffs, making prices less informative about class-1 investors’ private informationon future stock payoffs. The net change inoGG asω increases depends on which ofthese two effects dominates. In the case shown in Figure 6A,oGG increases withω. The change ofoY Y can be analyzed similarly.
IncreasingσY, the volatility of investor 1’s exposure to nontraded income alwaysincreasesoGG. HigherσY gives rise to more volatile hedging trade from investor1, and thus reduces the amount of information revealed through stock trading onfuture stock payoffs. The impact of increasingσY onoY Y is, however, ambiguous.On the one hand, the higherσY increases the unconditional uncertainty aboutYt .On the other hand, the price of the stock, now more driven by investor 1’s hedgingtrade, also becomes more informative aboutYt . The trade-off between these twoeffects determines the net change inoY Y whenσY increases. For the current set ofparameters, the first effect dominates andoY Y increases withσY.
190 JENNIFER HUANG AND JIANG WANG
A)
B)
FIGURE 6.Conditional standard deviation ofGt andYt for investor 2 under market structureI and asymmetric information (parameters have the following values:ρ= 0.1, γ = 20,r = 0.06, aG=−0.2, aY =−0.2, aZ =−0.5, σD = 0.7, σG= 0.6, σZ = 0.5, σN = 0.22,κDN = 0.5,β1= (0, 1, 1)′, andβ2= (0, 0, 0)′].
Figure 7 illustrates how the stock risk premium and price volatility change withσY andω. Comparing it with Figure 2, we note that the behavior of the equilibriumprice under asymmetric information resembles that under symmetric informationfor largeω, but differs significantly whenω is small. In particular, for small valuesof ω, the risk premium|λS
0| and price volatilityσS both increase withσY under
INFORMATIONAL EFFICIENCY IN SECURITIES MARKETS 191
A)
B)
FIGURE 7. Stock risk premium and price volatility under market structure I and asymmetricinformation [parameters have the following values:ρ= 0.1, γ = 20, r = 0.06,aG=−0.2,aY =−0.2,aZ =−0.5,σD = 0.7,σG= 0.6,σZ = 0.5,σN = 0.22,κDN = 0.5,β1= (0, 1, 1)′,andβ2= (0, 0, 0)′].
symmetric information (see Figure 2). But under asymmetric information, the riskpremium increases withσY and price volatility decreases (see Figure 7).
IncreasingσY has two effects on the stock price under asymmetric information.First, similar to the case of symmetric information, it tends to increase the stockrisk premium and price volatility because of the increase in allocational trade. The
192 JENNIFER HUANG AND JIANG WANG
effect is stronger the larger thatω is, because more class-1 investors are tradingthe stock to hedge their nontraded risk. Second, increasingσY reduces the amountof information that investor 2 can extract from the security prices about futurestock payoffs, as reflected by the increase inoGG shown in Figure 6. Hence, in-vestor 2 demands a higher premium on the stock to compensate for the increasein his perceived uncertainty. Also, less information tends to reduce the variabilityof investor 2’s expectation ofGt and thus reduces the price volatility. Thus, in-creasingσY tends to increase the risk premium and decrease the price volatility.This information effect is stronger whenω is small and the information asymme-try between the two classes of investors is large. The net impact of increasingσY
depends on the combination of the allocational and informational effects. Whenω
is large, the allocational effect dominates and the equilibrium stock price behavessimilar to that under symmetric information. For small values ofω, the informationeffect dominates, the stock risk premium increases withσY, and its price volatilitydecreases withσY.
6.2. Equilibrium Under Market Structure II
As the collar is introduced, the prices of the stock and the collar provide twoendogenous signals aboutXt = (Gt ,Yt , Zt )
′, in particular,(λSX − λS
1)1t = 0 and(λH
X − λH1)1t = 0. Thus, only one degree of uncertainty remains in investor 2’s
estimation, and1Y,1Z can be expressed as linear functions of1G. We have thefollowing corollary.
COROLLARY 4. Under market structure II, whenF1,t =Ft , F2,t =F {C,P}t ,β1= (0, 1, 1)′, β2= (0, 0, 0)′, andω is close to1, the economy has a linear, sta-tionary equilibrium in which
h2,Z), v1, andv2 are determined by(10b), (14), (15),and(16).
Again, we first examine the information asymmetry between the two investors.Figure 8 plotsoGG andoY Y for different values ofσY andω. The intuition obtainedunder market structure I applies here as well. Now that investor 2 receives signalsboth from the stock price and from the collar price, in addition to the two effects inthe Section 6.1, increasingσY has a third effect on information asymmetry. Thatis, asσY changes, the difference between the two signals can also change, makingthe combination of the two signals more or less informative. For example, eachprice itself can become less informative aboutGt asσY increases. However, the
INFORMATIONAL EFFICIENCY IN SECURITIES MARKETS 193
A)
B)
FIGURE 8.Conditional standard deviation ofGt andYt for investor 2 under market structureII and asymmetric information [parameters have the following values:ρ= 0.1, γ = 20,r = 0.06, aG=−0.2, aY =−0.2, aZ =−0.5, σD = 0.7, σG= 0.6, σZ = 0.5, σN = 0.22,κDN = 0.5,β1= (0, 1, 1)′, andβ2= (0, 0, 0)′].
two signals can become less correlated, and jointly become more informative. Asa result,oGG can either increase or decrease withσY.
Figure 9 plots the risk premium and price volatility of the stock for differentvalues ofσY andω. They behave in a similar way to that under market structure I.
194 JENNIFER HUANG AND JIANG WANG
A)
B)
FIGURE 9.Stock risk premium and price volatility under market structure II and asymmetricinformation [parameters have the following values:ρ= 0.1, γ = 20, r = 0.06,aG=−0.2,aY =−0.2,aZ =−0.5,σD = 0.7,σG= 0.6,σZ = 0.5,σN = 0.22,κDN = 0.5,β1= (0, 1, 1)′,andβ2= (0, 0, 0)′].
6.3. Comparison Between Market Structures I and II
We now compare the equilibrium under market structures I and II and examine theimpact of derivative trading on the informational efficiency of the securities mar-ket. Under the assumption that the allocational trade (or noise trade) is exogenously
INFORMATIONAL EFFICIENCY IN SECURITIES MARKETS 195
specified and unchanged as new securities are introduced, Grossman (1977) arguesthat adding securities to the market should improve its informational efficiency be-cause more private information is revealed through a larger set of prices. In general,however, the allocational trade cannot be exogenously specified, especially whenwe consider changing the market structure. As we have shown under symmetricinformation, investors change their allocational trade significantly when the collaris introduced. An increase in allocational trade can introduce additional stock pricemovements that are unrelated to future payoffs, making the price less informative.In the case that the loss of information from the stock price exceeds the gain ofinformation from the collar price, the information asymmetry in the market canincrease when the collar is introduced. Thus, opening derivative trading can reducethe informational efficiency of the market.
To verify this intuition, we plot in Figure 10 the changes ofoGG andoY Y whenmarket structure changes from I to II. Atω= 1, the economy is populated onlyby class-1 investors. We can view this economy as if the allocational trade wereexogenously specified, because, being the only type of investors in the economy,investor 1 is forced to hold his endowment under both market structures. Theintuition in Grossman (1977) applies in this case and the information asymmetry,as measured byoGG, decreases after opening the collar market.
At ω < 1, with investor 2 making the market, investor 1 endogenously de-termines his allocational trade based on the market structure. The smaller theω,the more significantly investor 1 changes his allocational trade after collar trad-ing opens. For most values ofσY andω under consideration,oGG decreases frommarket structure I to II, indicating that the information asymmetry between theinvestors decreases after introducing the collar because the collar price providesnew information to the uninformed investors. However, for certain values ofω
andσY, especially whenω is small, the introduction of collar trading can increasethe information asymmetry between the two classes of investors on future stockpayoffs, as reflected by the increase inoGG. This is the case when the informationloss from the stock price exceeds the information gain from the collar price.
In general,oY Y decreases from market structure I to II. This is not surprisingbecause the addition of collar allows investor 1 to more actively hedge his non-traded risk. The increase in his hedging activity reveals more information abouthis hedging need through the stock and collar prices.
We now examine the difference in equilibrium stock price between marketstructures I and II. Figure 11 illustrates the changes of stock risk premium andprice volatility when the market structure changes from I to II. Atω = 1, changingmarket structure does not change the equilibrium allocation and security pricesbecause the market is effectively complete. Forω < 1, opening the collar markethas two effects on the equilibrium security prices. On the one hand, similar to thecase of symmetric information, it allows an investor to better hedge his nontradedrisk and thus reduces the stock risk premium and price volatility. This allocationaleffect is negligible asω approaches 1 or 0, because introducing derivative securityhas little impact on the equilibrium prices when the economy is dominated by one
196 JENNIFER HUANG AND JIANG WANG
A)
B)
FIGURE 10. Change in information asymmetry, as measured by the conditional standarddeviation ofGt andYt for investor 2 from market structure I to II [parameters have thefollowing values:ρ= 0.1, γ = 20, r = 0.06,aG=−0.2, aY =−0.2, aZ =−0.5, σD = 0.7,σG= 0.6, σZ = 0.5, σN = 0.22,κDN = 0.5,β1= (0, 1, 1)′, andβ2= (0, 0, 0)′].
class of investors (see Figure 5). On the other hand, opening the collar marketchanges the amount of information about future stock payoffs that uninformedinvestor 2 extracts from prices. As discussed under market structure I, ifoGG
increases, the information effect tends to increase the stock risk premium anddecrease the price volatility. IfoGG decreases, the opposite applies.
INFORMATIONAL EFFICIENCY IN SECURITIES MARKETS 197
A)
B)
FIGURE 11.Change in stock risk premium and price volatility from market structure I to IIunder asymmetric information [parameters have the following values:ρ= 0.1, γ = 20,r = 0.06, aG=−0.2, aY =−0.2, aZ =−0.5, σD = 0.7, σG= 0.6, σZ = 0.5, σN = 0.22,κDN = 0.5,β1= (0, 1, 1)′, andβ2= (0, 0, 0)′].
The net impact of opening collar trading depends on the trade-off between theallocational and informational effects. For smallω, the informational effect domi-nates. If the information asymmetry concerning the future stock payoffs increases(i.e.,oGG increases), stock risk premium can increase after introducing the collar.
198 JENNIFER HUANG AND JIANG WANG
Forω around 0.1 andσY around 0.3, oGG increases after opening the collar mar-ket (see Figure 10A) and the risk premium|λS
0| increases (see Figure 11A). Notethat for the same set of parameter values, the stock risk premium decreases un-der symmetric information (see Figure 5A). On the other hand, if opening collartrading decreases the informational asymmetry (oroGG decreases), stock pricevolatility tends to increase, because investor 2’s expectation aboutGt becomesmore volatile. Figures 10A and 11B show that forω around 0.2 andσY > 0.4,oGG decreases after introducing the collar (see Figure 10A) and the stock pricevolatility σ S increases. This is in contrast to the case of symmetric information inwhichσS decreases after introducing the collar (see Figure 5B).
7. CONCLUDING REMARKS
We analyze the impact of derivative trading on the allocational and informationalefficiencies of the securities market, using a specific model within the fully rationalexpectations framework. We show that the introduction of derivative securities notonly provides additional sources of information to the less informed investorsthrough the derivative prices, but also changes the information content of theexisting security prices by changing the allocational trade. The net impact ofintroducing derivatives on the informational efficiency of the securities marketdepends on the interaction between these two effects. In particular, the market maybecome less efficient informationally when derivative securities are introduced.We also show that introducing derivatives can increase the stock risk premium andprice volatility under asymmetric information.
Although the intuitions obtained from our model are general, the model itselfcontains several restrictive assumptions. In what follows, we provide some furthercomments on these assumptions.
The model assumes that the risk-free security yields constant returns, indepen-dent of market demands. This assumption is needed to solve the model. We canjustify this assumption by viewing the economy under consideration as a smalleconomy that has access to an outside bond market. We can also modify the modelto avoid this assumption. For example, we can define the model on a finite timehorizon and assume that the security payoffs, endowments, and consumptionsoccur only on the terminal date. We then can use the risk-free security as the nu-meraire, whose return is zero by definition.11 Solving such a model is similar tosolving the current model. The drawback of a finite-horizon model is that it is nolonger stationary; solving the equilibrium is possible but tedious. We do not expectthe results to be very different from those obtained in the current setting.
The model also assumes that investors have constant absolute risk aversion,which has the unattractive feature that it allows negative consumption and exhibitsno income effect on the individual demand for risky securities. However, under thispreference, an investor’s holding of risky securities is independent of his wealth,as are the equilibrium prices. The solution for an equilibrium then is simplifiedgreatly.
INFORMATIONAL EFFICIENCY IN SECURITIES MARKETS 199
Another feature of the model is that both stock dividend and nontraded in-come have Brownian-motion components. This has two implications. First, theinstantaneous dividend and nontraded income have significant probability of be-ing negative, regardless of the parameter values. Second, the cumulative incomeprocess (including both dividends and nontraded income) has infinite variation,whereas the cumulative consumption process is (required to be) absolutely con-tinuous. This difference in the nature of income process and consumption processmakes it infeasible for an investor to buy and hold (in which case, consump-tion would equal income). Although unattractive, these implications are merelybyproducts of the continuous-time specification. The fact that they do not arise ina discrete-time counterpart of the model implies that economically they are notimportant.12
The choice of collar contract as the derivative security is fairly arbitrary andmainly for convenience. More generally, we have given no justification for whythe securities market is incomplete in our model. Although it is beyond the scopeof this paper to provide an explicit justification, the reasons are quite obvious.Because an investor’s nontraded income is private information, certain contracts,such as those with payoffs contingent on the realization of the nontraded income,are informationally infeasible.13 In the absence of these contracts, the market isincomplete. Modeling the actual process of introducing derivative securities is alsobeyond the scope of this paper. We provide no rationale as to why a certain contract(e.g., the collar) is introduced and why no additional contracts are introduced. Thereis, however, a growing literature addressing these issues [see, e.g., Allen and Gale(1994) and Duffie and Rahi (1995)].
NOTES
1. For example, He and Pearson (1991) and Karatzas et al. (1991) examine the existence and char-acterization of optimal consumption and investment policies (with finite horizon) under an incompletemarket. Merton (1971), Duffie et al. (1993), He and Pag`es (1993), Svensson and Werner (1993), Koo(1994a, b), Cuoco (1995), among others, consider the problem when investors also have nontradedincome.
2. For equilibrium pricing models with nontraded income, see, e.g., Scheinkman and Weiss (1986),Marcet and Singleton (1990), Telmer (1993), Lucas (1994), Detemple (1995), and Heaton and Lucas(1996).
3. Wang (1993) and Detemple (1994) solve multiperiod pricing models under asymmetric infor-mation with specific assumptions about preferences and shock distributions. Judd and Bernardo (1994)consider numerical solutions to equilibrium models under asymmetric information.
4. Given that investors are identical within each class, they can be aggregated into a single repre-sentative investor.
5. The collar contract defined here represents a series of bets on future stock prices. For positivestock prices(St > 0), the long side of the contract receives payments at rateSt , whereas for negativestock prices, the short side receives payments at rate−St . Note that payments here are in the form ofcontinuous flows instead of discrete lumps.
6. Here, the following notations: diag{e1, e2, . . . ,ek}, (e1, e2, . . . ,ek), and stack{e1, e2, . . . ,ek}denote, respectively, the diagonal matrix, row matrix, and column matrix for a set of elements (ofproper order)e1, e2, . . . ,ek; (·)′ denotes the transpose of a matrix and trace(·) denotes its trace.
200 JENNIFER HUANG AND JIANG WANG
7. We have assumed that both investors are exposed to the same set of nontraded risks in theeconomy. Solving the model with additional independent shocks is straightforward, and the qualitativenature of our results does not change.
8. Here, the integrability on [0,∞) is defined to be integrable over [0, T ] ∀ T ≥ 0.9. For the infinite horizon control problem to have well-posed solutions, appropriate boundary
conditions are needed. Imposing the above transversality condition is equivalent to the followingprocedure: First, solve the control problem with finite horizon and a bequest function of the terminalwealth in the same form of the utility function, and then let the terminal data go to infinity.
10. For Xt = (1,Gt ,Yt , Zt )′, its variable elements areGt ,Yt , Zt . Let Xi , i = 1, . . . ,n, be the
variable elements ofX, then
∂X P = stack
{∂P
∂X1, . . . ,
∂P
∂Xn
}and ∂2
X P ={
∂2P
∂Xi ∂X j
}.
11. When there is only terminal consumption, the interest rate in the usual sense is not well definedhere. Making this assumption allows us to avoid dealing with the interest rate instead of endogenizingit. See Grossman and Zhou (1996) for an example.
12. A discrete-time counterpart of our model has been used by Hong (1996). The nature of theequilibrium in the discrete-time setting is very similar to that in the continuous-time setting.
13. In our setting, investors within the same class are assumed to have the same nontraded income.Thus, information on nontraded income is shared among investors within the same class, but not acrossclasses. We can easily introduce an idiosyncratic component in each investor’s nontraded income tomake it unobservable to other investors.
REFERENCES
Ahlfors, L.V. (1979)Complex Analysis, 3rd ed. New York: McGraw-Hill Book Co.Allen, F & D. Gale (1994)Financial Innovation and Risk Sharing. Cambridge, MA: MIT Press.Arrow, K. (1964) The role of securities in the optimal allocation of risk-bearing.Review of Economic
Studies31, 91–96.Back, K (1993) Asymmetric information and options.Review of Financial Studies6, 435–472.Brennan, M.J. & H.H., Cao (1996) Information trade, and derivative securities.Review of Financial
Studies9, 163–208.Campbell, J.Y. & A.S. Kyle (1993) Smart money, noise trading, and stock price behavior.Review of
Economic Studies60, 1–34.Cuoco, D. (1995) Optimal Policies and Equilibrium Prices with Portfolio Cone Constraints and Stochas-
tic Labor Income. Unpublished manuscript, University of Pennsylvania.Debreu, G. (1959)Theory of Value. New Haven, CT: Yale University Press.Detemple, J.B. (1994) Asset Pricing in an Intertemporal Noisy Rational Expectations Equilibrium.
Unpublished manuscript, MIT.Detemple, J.B. (1995) The Valuation of Non-traded Assets. Unpublished manuscript, MIT.Doob, J.L. (1991)Measure Theory. New York: Springer-Verlag.Duffie, D., W. Fleming & T. Zariphopoulou (1993) Hedging in Incomplete Markets with HARA Utility.
Unpublished manuscript, Stanford University.Duffie, D. & C. Huang (1985) Implementing Arrow-Debreu equilibria by continuous trading of few
long-lived securities.Econometrica53, 1337–1356.Duffie, D. & R. Rahi (1995) Financial market innovation and security design: An introduction.Journal
of Economic Theory65, 1–42.Grossman, S.J. (1977) The existence of futures markets, noisy rational expectations and informational
externalities.Review of Economic Studies44, 431–449.Grossman, S.J. (1988) An analysis of the implications for stock and futures price volatility of program
trading and dynamic hedging strategies.Journal of Business61, 275–298.
INFORMATIONAL EFFICIENCY IN SECURITIES MARKETS 201
Grossman, S.J. (1995) Presidential address: Dynamic asset allocation and the informational efficiencyof markets.Journal of Finance50, 773–788.
Grossman, S.J. & J. Stiglitz (1980) On the impossibility of informationally efficient markets.AmericanEconomic Review70, 393–408.
Grossman, S.J. & Z. Zhou (1996) Equilibrium analysis of portfolio insurance.Journal of Finance51,1379–1403.
Harrison, J.M. & D. Kreps (1979) Martingales and multiperiod securities markets.Journal of EconomicTheory20, 381–408.
Harrison, J.M. & S.R. Pliska (1981) Martingales and stochastic integrals in the theory of continuoustrading.Stochastic Process Applications11, 215–260.
Hayek, F.A. (1945) The use of knowledge in society.American Economic Review35, 519–530.He, H. & H.F. Pag`es (1993) Labor income, borrowing constraints, and equilibrium asset prices: A
duality approach.Economic Theory3, 663–696.He, H. & N.D. Pearson (1991) Consumption and portfolio policies with incomplete markets and short-
sale constraints: The infinite dimensional case.Journal of Economic Theory54, 259–305.Heaton, J. & D. Lucas (1996) Evaluating the effects of incomplete markets of risk sharing and asset
pricing.Journal of Political Economy104, 443–487.Hong, H.G. (1996) A Model Futures Returns and Trading Under Asymmetric Information. Unpublished
manuscript, MIT.Judd K.L. & A. Bernardo (1994) Asset Market Equilibrium with General Tastes, Securities, and
Informational Asymmetries. Unpublished manuscript, Stanford University.Karatzas, I., J.P. Lehoczky, S.E. Shreve & G.L. Xu (1991) Martingale and duality methods for utility
maximization in an incomplete market.SIAM Journal of Control and Optimization29, 702–730.Karatzas, I. & S.E. Shreve (1988)Brownian Motion and Stochastic Calculus. New York: Springer-
Verlag.Koo, H.K. (1994a) Consumption and Portfolio Choice with Labor Income, I: Evaluation of Human
Capital. Unpublished manuscript, Washington University at St. Louis.Koo, H.K. (1994b) Consumption and Portfolio Choice with Labor Income, II: The Life Cycle-
Permanent Income Hypothesis. Unpublished manuscript, Washington University at St. Louis.Lipster, R.S. & A.N. Shriyayev (1977)Statistics of Random Processes, I: General Theory. New York:
Springer-Verlag.Lucas, D.J. (1994) Asset pricing with undiversifiable income risk and short sales constraints: Deepening
the equity premium puzzle.Journal of Monetary Economics34, 325–341.Lucas, R.E., Jr. (1978) Asset prices in an exchange economy.Econometrica46, 1429–1445.Marcet, A. & K.J. Singleton (1990) Optimal Consumption Savings Decisions and Equilibrium Asset
Prices in a Model with Heterogeneous Agents Subject to Short-Sales Constraints. Unpublishedmanuscript, Stanford University.
Merton, R. (1971) Optimal consumption and portfolio rules in a continuous time model.Journal ofEconomic Theory3, 373–413.
Merton, R. (1989)Continuous-Time Finance. Oxford: Blackwell.Protter, M.H. & C.B. Morrey (1991)A First Course in Real Analysis, 2nd ed. New York: Springer-
Verlag.Radner, R. (1972) Existence of equilibrium of plans, prices and price expectations in a sequence of
markets.Econometrica40, 289–303.Scheinkman, J.A. & L. Weiss (1986) Borrowing constraints and aggregate economic activity.Econo-
metrica54, 23–45.Svensson, L.E.O. & I. Werner (1993) Non-trade assets in incomplete markets: Pricing and portfolio
choices.European Economic Review37, 1149–1168.Telmer, C.I. (1993) Asset-pricing puzzles and incomplete markets.Journal of Finance48, 1803–1832.Wang, J. (1993) A model of intertemporal asset prices under asymmetric information.Review of
Economic Studies60, 249–282.Willems, J.C. & F.M. Callier (1991) The infinite horizon and the receding horizon LQ-problems
with partial stabilization constraints. In S. Bittanti, A.J. Laub, and J.C. Willems (eds.),The RiccatiEquation. New York: Springer-Verlag.
202 JENNIFER HUANG AND JIANG WANG
APPENDIX
A.1. PROOF OF LEMMA 2
Given the return processes specified in (11) and (12), it is easy to verify thatJi,t in (13b)solves the Bellman equation and satisfies the specified transversality condition whenvi
solves (15). In this case,Ji,t gives investori ’s value function. It then follows thatci,t andθi,t in (13a) are investori ’s optimal policies. The investors’ optimization problem is nowreduced to solving the algebraic matrix equation in (15). For any two square matricesm andn, we denotem≥ n (m larger thann) if m−n is positive semidefinite. The strict inequalityapplies whenm− n is positive definite. Define three matricesm2,m1, andm0 by
m2 = bi,X
[ι− b′Q(bQb′Q)
−1bQ
]b′i,X,
m1 = bi,Xb′Qσ−1QQ(aQ − r γbQb′Nβ
′i )+ [(r/2)ι− ai,X ], (A.1)
m0 = (ai,Q − r γbQb′Nβ′i )′σ−1
QQ(ai,Q − r γbQb′Nβ′i )− (r γ σN)
2βiβ′i .
Note that bothm2 andm0 are symmetric. Equation (15) then can be expressed as
m0 +m′1v + vm1 − vm2v = 0. (A.2)
Equation (A.2) is called the algebraic Riccati equation (ARE). The ARE in general hasmultiple solutions. We need the smallest solution forv to maximize the value function. Thefollowing lemma on ARE is useful.
LEMMA A.1. [Willems and Callier (1991)]If m2 and m0 are positive definite, (A.2)has a unique largest(smallest) solution that is symmetric and positive(negative) definite.
Let v = stack{(v00, v0), (v′0, v)}, wherev is the submatrix ofv that corresponds to the
variable part ofXt (v00 corresponds to the constant part and ˜v0 the cross part). Also, letm0,m1, m2 denote the submatrices ofm0, m1, andm2 that correspond to ˜v. Equation (A.2) thengives the following equation for ˜v:
m0 + m′1v + vm1 − vm2v = 0, (A.3)
which is also an ARE. We only need to solve for ˜v, because given ˜v, solving v0 andv00
is straightforward. Thus, we needm2 andm0 to be positive definite for the existence ofa solution to the optimization problem. Given thatι ≥ b′Q(bQb′Q)
−1bQ for any bQ, m2 ispositive definite. The existence of a solution ˜v now only requiresm0 to be positive. Thefollowing lemma is immediate.
LEMMA A.2. In the absence of nontraded income, the investor’s control problem givenby (15)has a unique solution.
Proof. Given the linear price function,m0 = a′Qσ−1QQaQ in the absence of nontraded in-
come. HereaQ= λP(aX − r ι) + λC. Because bothσ−1QQ and−(aX − r ι) are symmetric
positive definite,a′Qσ−1QQaQ is also symmetric and positive definite. Thus,m0 is positive
definite, and so ism0. By Lemma A.1, there exists a solution to the optimization problemof the conjectured form.
INFORMATIONAL EFFICIENCY IN SECURITIES MARKETS 203
In the presence of nontraded income, to ensure the existence of a solution, we needadditional conditions to guaranteem0 positive definite.
A.2. PROOF OF THEOREM 1
We now prove Theorem 1 by proving the existence of a solution to the system (10b), (15), and(16). The proof follows three steps. First, for a fixed parameter(ω = 1), a unique solutionto the system is shown to exist. Then we show that at the solution, the determinant of theJacobian matrix isgenericallynondegenerate (to be defined). Finally, using the ImplicitFunction Theorem, we conclude that the system has a solution in a neighborhood of theinitial parameter (i.e.,ω = 1). We start by providing some auxiliary definitions and results.
DEFINITION A.1. Let D be an open set in<n. A function f:D → <m is calledgenerically nondegenerate if the n-dimensional Lebesgue measure of its zero set{x: f (x) =0} is zero.
LEMMA A.3. (Implicit Function Theorem). LetD be an open set in<m+n containingthe point(x0, y0) where x0 ∈ <m and y0 ∈ <n. Suppose that F:D → <m is continuouswith continuous first partial derivatives inD, and
F(x0, y0) = 0 and det[∇x F(x0, y0)] 6= 0. (A.4)
Then positive numbersεx andεy can be chosen so that
1. The direct product of the closed ballsBm(x0, εx) andBn(y0, εy)with centers at x0, y0
and radii εx andεy, respectively, is inD;2. εx and εy are such that for each y∈ Bn(y0, εy) there is a unique x∈ Bm(x0, εx)
satisfying F(x, y) = 0. If f is the function from Bn(y0, εy) to Bm(x0, εx) defined bythese ordered pairs(x, y), then F[ f (y), y] = 0; furthermore, f and all its partialderivatives are continuous on Bn(y0, εy).
A proof of Lemma A3 can be found in Protter and Morrey (1991).
LEMMA A.4. Let f :D→ < be a real analytical function, whereD = D1⊗ · · · ⊗Dn
is an open subset of<n. LetN ={x ∈D : f (x)= 0} be its zero set. Then eitherN = D orµn(N ) = 0 whereµn is the n-dimensional Lebesgue measure.
Proof. We will prove by induction. First,N is closed and therefore measurable. Forn = 1,N is either finite, or has an accumulation point. In the latter case, the functionf isidentically zero onD [see Ahlfors (1979)]. Noting that any finite set has zero Lebesgue mea-sure concludes this part of the proof. Let us assume that the conclusion of the lemma holds forcertaink ≥ 1 and prove it forn = k+1. Denotingf as a function of two variables,f (t, x),onD1⊗D−1 , whereD−1 ≡ D2 ⊗ · · · ⊗ Dk+1. We see thatf is a real analytical functionin botht andx separately as well. Consider the setS = {t ∈ D1 : ∀x ∈ D2, f (t, x) = 0}.For t 6∈ S, we have
∫D−1
f (t, x) dx = 0 by the inductive assumption. If setS is finite,it is of zero Lebesgue measure inD1. Thus,µn(N) =
∫D1
∫D−1
1 f (t,x)=0 dx dt = 0 byFubini’s theorem [see, e.g., Doob (1991)]. If, on the other hand,S is not finite, then it has anaccumulation point. From the result ofn = 1, we see that for any fixedx ∈ D−1, f (t, x)is identically zero inD1, and therefore identically zero onD = D1⊗D−1. This concludesthe proof.
We are now ready to show the existence of equilibrium atω = 1.
204 JENNIFER HUANG AND JIANG WANG
LEMMA A.5. At ω = 1, if the parameters satisfy assumption(7), then there exists asolution to the system(10b), (15),and(16)under both market structures I and II.
Proof. At ω= 1, class-2 investors have population-weight zero, hence have no impacton the equilibrium prices. We derive the equilibrium in this case in two steps: first, to finda price process at which class-1 investors’ demand for traded securities equals the supply,and then to show that class-2 investors’ expectations and optimal policies have the proposedsolution under the given price process. The first step is completed in Appendix A.3 and weonly focus on the second step here. In particular, we show the existence of a solution to(10b) and (15), taking the price process (9) as given. Leto= αoα′, whereo is a full-rankedsubmatrix ofo. Simple algebra shows that equation (10b) reduces to an ARE as defined in(A.2) with
m2 = α′a8X ′(b8b′8)−1a8Xα,
m1 ={α′[a8X′(b8b′8)
−1(bXb′8)′ + a′X
]} ∣∣(3−m)×(3−m)
,
m0 ={
bX
[b′8((b8b′8)
−1b8]b′X + bXb′X
} ∣∣(3−m)×(3−m)
,
where|(3−m)×(3−m) means taking the first(3−m) × (3−m) submatrix. Obviously,m2 =(α′λ)m(α′λ)′wherem= a′Xσ
−188aX is symmetric and positive definite andm0 is also positive
definite; by Lemma A.1, (10b) has a unique positive definite solution. Furthermore, becauseinvestor 2 has no nontraded income, Lemma A.2 implies that (15) has a solution forv2.This completes our proof.
Now we show the existence of a solution to the system (10b), (15), and (16) forω close to1. To conform to the notation in Lemma A.3, we reformulate the system asF(x; p,q) = 0,whereF = (F1, F2, F3, F4) with F1, F2 corresponding to (15),F3 corresponding to (16),and F4 to (10b). Let [·] denote the column vector of all nonidentical entries of a matrix.Define x = [[v1], [v2], λP, [o]], where [v1], [v2] are the coefficients in investors’ valuefunctions,λP is the coefficient of the price processes, ando is the uninformed investor’sconditional variance of the unobserved state variables. Letp = ω, the population weightof class-1 investors, andq = [r, γ, ρ,aG,aY,aZ, σD, σG, σY, σZ, σN, [κ]] ([κ] is the vectorof covariance coefficients among all shocks) be the vector of all fixed parameters in thesystem. From Lemma A.5, the system has a solution atw= 1. In other words, for anyfixed set of parametersq, ∃ x0 = x0(q), such thatF(x0; p0,q) = 0 for p0 = 1. As thesecond step, we show that the Jacobian matrix is nondegenerate at(x0, p0) for any set ofparametersq. Given the high dimensionality ofq, the calculation would be messy andtedious. Instead, we show that the set ofq at which the Jacobian is degenerate has measurezero. Let f (q) = det[∇x F(x0; p0,q)], then f (q) is a real analytical function. It is easyto find aq0 such that f (qo) 6= 0; therefore, the Jacobian is generically nondegenerate at(x0, p0) by Lemma A.4. Applying the Implicit Function Theorem, we conclude that thereexists a solution to system (10b), (15), and (16) forω close to 1. This completes the proofof Theorem 1.
A.3. PROOF OF THEOREM 2
Whenω = 1, the economy is populated only with class-1 investors and is thus equivalent tothe economy with one representative agent who has total exposureYt+Zt to nontraded risk.We conjecture a linear equilibrium with price processPt = λP Xt . The representative agentsolves his control problem as defined in (15) with market clearing conditionh= 1m,4
1,1 . Define
INFORMATIONAL EFFICIENCY IN SECURITIES MARKETS 205
v= stack{(vY Y, vY Z), (vY Z, vZ Z)}. We can rewrite (15) in the form of (A.2) with coefficientsm2= diag{σY,σZ},m1= diag{(r/2)−aY, (r/2)−aZ},m0= r γ σN(1, 1). Letd0=−r 2γ 2σ 2
N ,d1 = (r − 2aY)
2/4+ d0σ2Y, d2= (r − 2aZ)
2/4+ d0σ2Z , andd4= (d1d2 − σ 2
Yσ2Zd2
0)1/2. The
condition (7) ensures thatd1d2 − σ 2Yσ
2Zd2
0 ≥ 0. We can solve ˜v in closed form:
vY Z = ±√
d1 + d2 ± 2d4
[(d1 − d2)/d0]2 + 4σ 2Yσ
2Z
,
vY Y = 1
2σ 2Y
[(r − 2aY)+ d0v
−1Y Z + (d1 − d2)
/d−1
3 vY Z
],
vZ Z = 1
2σ 2Z
[(r − 2aZ)+ d0v
−1Y Z − (d1 − d2)d
−13 vY Z
],
v0Y = v0Z = 0 and v00 = r γ λs0 + (1/r )
(σ 2
YvY Y+ σ 2ZvZ Z
)+ (2/r )(r − ρ − r ln r ).
Note that we have four different roots for ˜v corresponding to the four choices ofvY Z. Wedenote ˜v− as the one corresponding to
vY Z =√
d1 + d2 − 2d4
[(d1 − d2)/d0]2 + 4σ 2Yσ
2Z
.
It is easy to check that the difference matrix between ˜v− and any other root is negativedefinite. Thus, ˜v− solves the value functionJt = −e−ρt−r γWt+(1/2)X′t vXt . Having solvedv, we can easily solveλP from the market clearing condition andv = diag{v00, v}. Theequilibrium stock price is
St = [1/(r − aG)]Gt + λSXt ,
whereλS = (λS0, λ
SY, λ
SZ) and Xt = stack{1,Yt , Zt }
λSY =
−r γ σDN
[vY Zσ
2Z + (r − aZ − σ 2
ZvZ Z)](
r − aZ − σ 2ZvZ Z
)(r − aY − σ 2
YvY Y
)− v2Y Zσ
2Yσ
2Z
,
λSZ =
−r γ σDN
[vY Zσ
2Y +(r − aY − σ 2
YvY Y
)](r − aZ − σ 2
ZvZ Z
)(r − aY − σ 2
YvY Y
)− v2Y Zσ
2Yσ
2Z
,
λS0 = −γ
[σ 2
D +1
(r − aG)2σ 2
G + λ2Yσ
2Y + λ2
Zσ2Z
].
The optimal consumption policy is
ct = rWt − (1/2γ )X′tv Xt − (1/γ ) ln r.
Using optimal consumption policy, we can solve the price for any traded security by
r Pt dt = Et
[u′(ct+dt,t + dt)
u′(ct , t)(dCt + d Pt )
],
whereu′ denotes investor’s marginal utility, andCt =∫ t
0f (Xt , t) dt + bC dws is the
cumulative payoff for the security. Using Ito’s Lemma, we can get the differential equation(18) for any price process{Pt }.


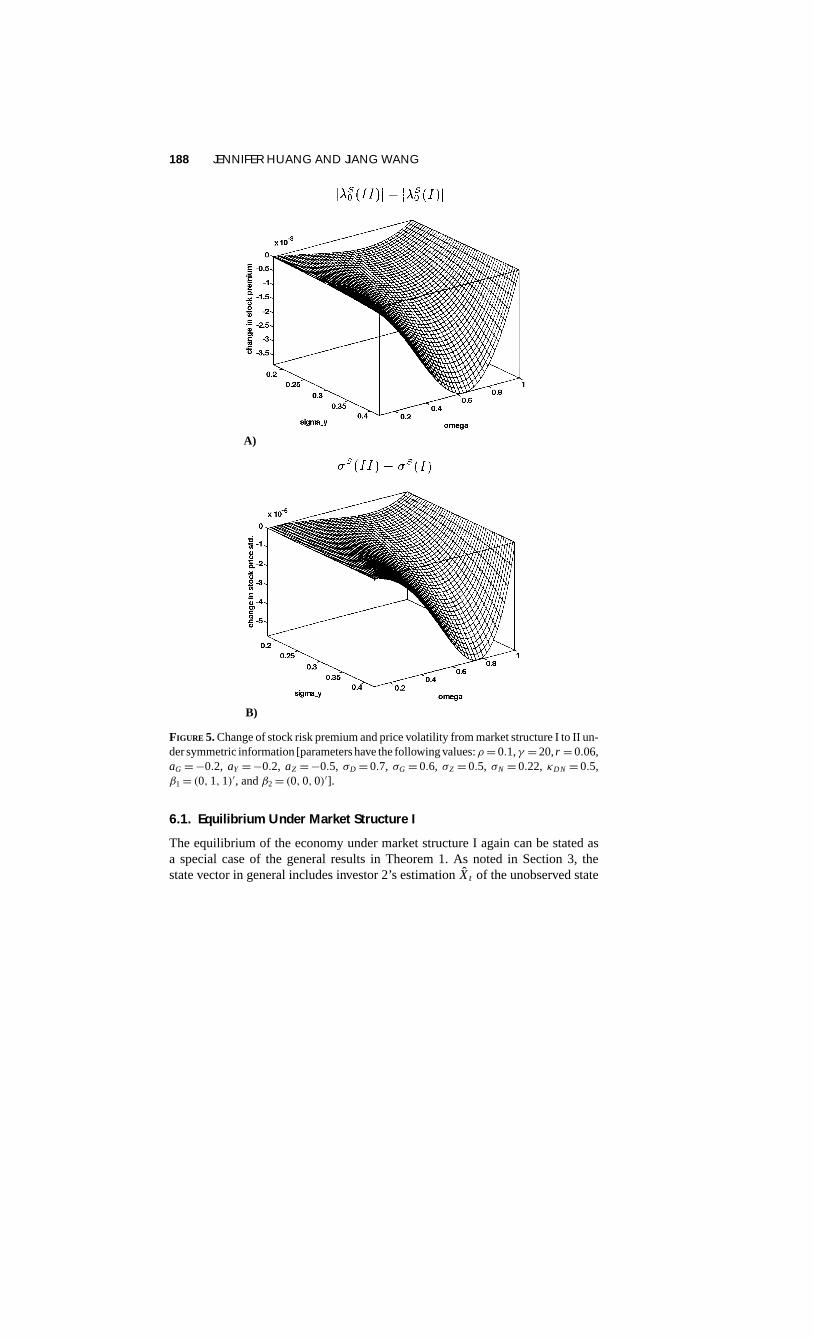

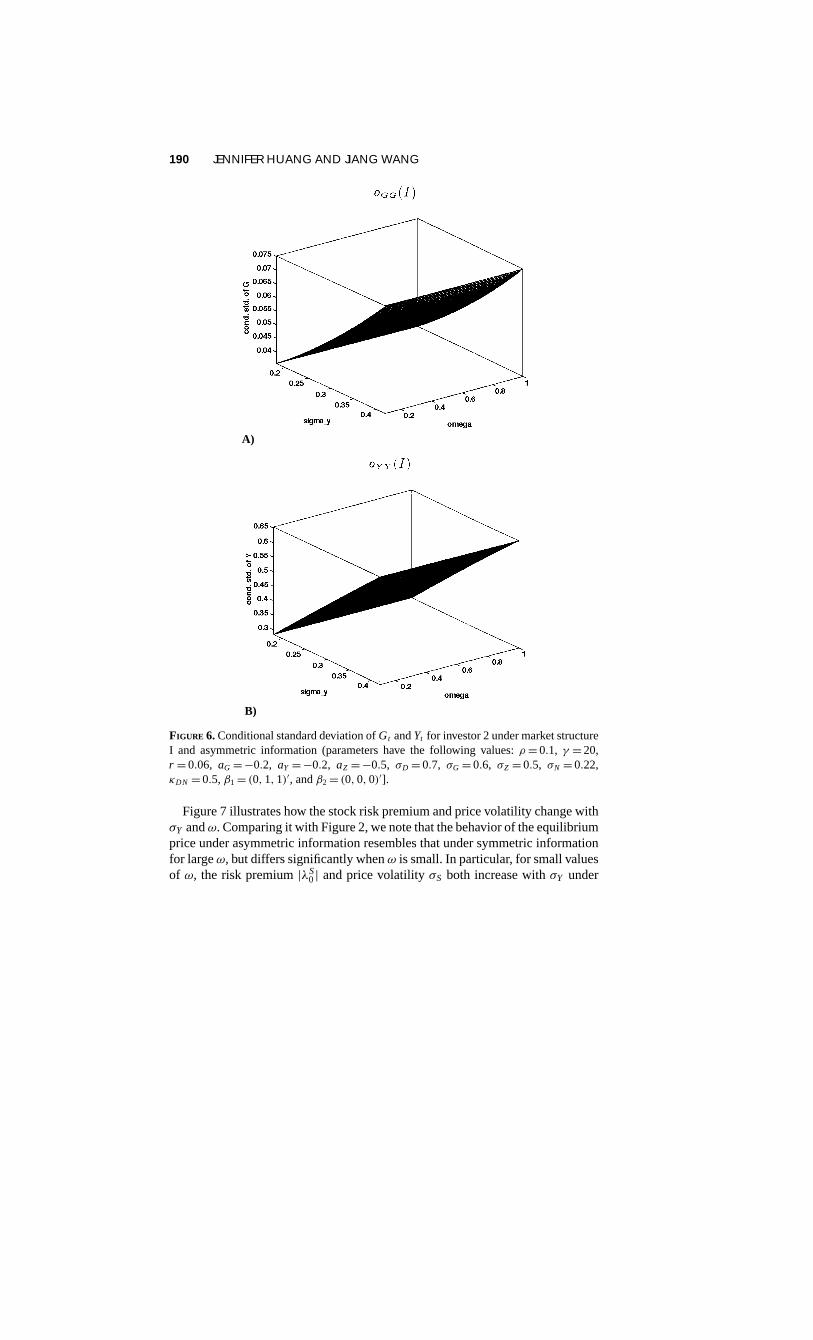


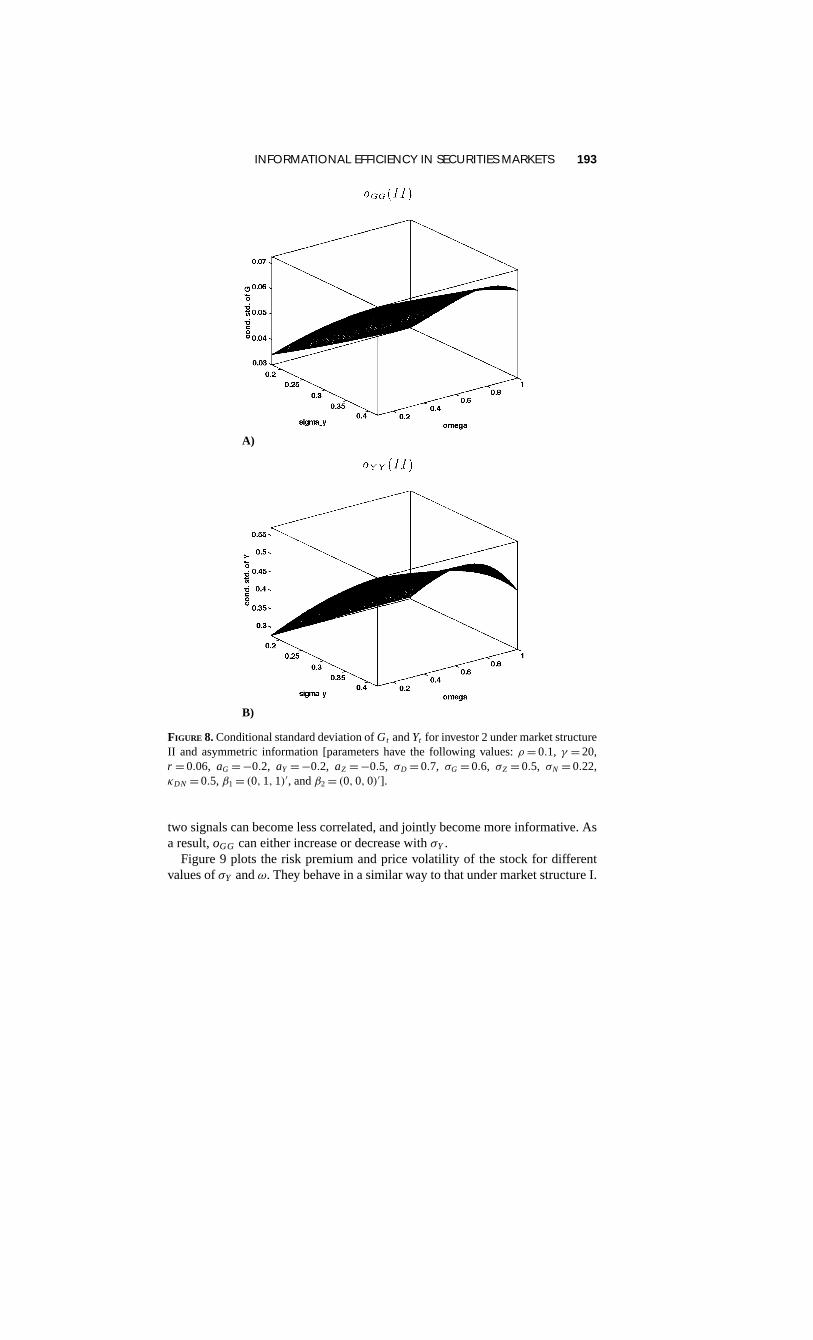
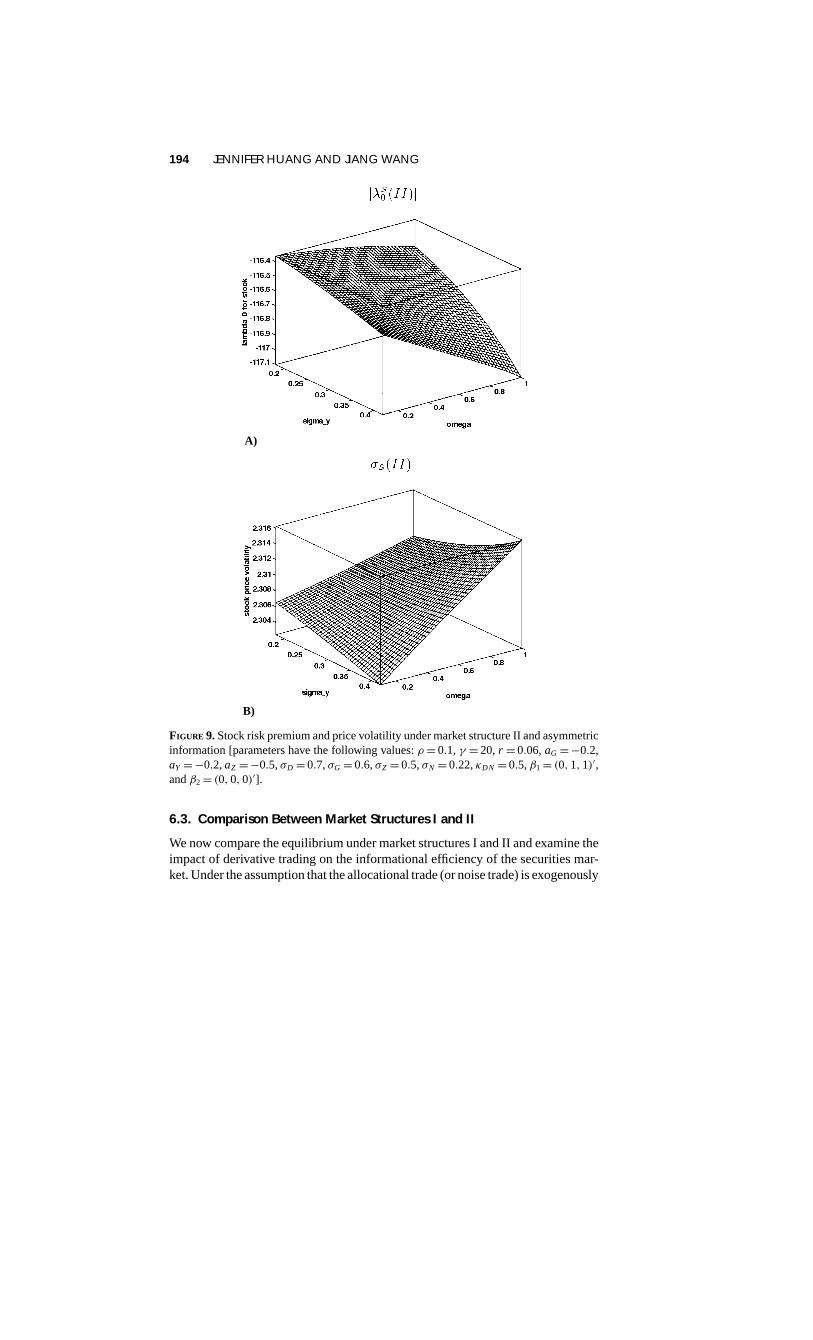


![[26] K. Zhang, D. Shasha, and J. T. L. W ximate tree matc hing in …wangj/publications/ARTICLES/tmatch... · 2001-07-04 · [25] K. Zhang and D. Shasha. Simple fast algorithms for](https://static.documents.pub/doc/80x56/5f0ba7a67e708231d43191c7/26-k-zhang-d-shasha-and-j-t-l-w-ximate-tree-matc-hing-in-wangjpublicationsarticlestmatch.jpg)


