35
Market Study and Marketing Strategy of Olive Sector in Irbid Draft Report v2 (10 August 2014)
Market Study and Marketing Strategy of
Olive Sector in Irbid
Draft Report v2 (10 August 2014)
Page 2 of 35
Contents Tables .................................................................................................................................................. 3
Figures ................................................................................................................................................ 3
Executive Summary .............................................................................................................................. 4
Introduction ........................................................................................................................................... 5
Background ......................................................................................................................................... 5
Objectives ........................................................................................................................................... 5
Methodology ....................................................................................................................................... 5
Limitations and Data Issues ................................................................................................................ 7
Structure of this Report ....................................................................................................................... 7
Socio-Economic Overview .................................................................................................................... 7
Socio-Economic Overview of Jordan ................................................................................................. 7
Irbid Socio-Economic Overview ........................................................................................................ 9
Overview of Socio-Economic Implications of the Syrian Refugee Crisis on Irbid Governorate, with
Focus on the Agricultural Sector .................................................................................................. 10
Market Analysis .................................................................................................................................. 12
Supply Analysis ................................................................................................................................ 12
Areas, Yield and Production ......................................................................................................... 12
Structure of Production ................................................................................................................. 13
Olive Oil Production (Processing Sector) ..................................................................................... 15
Inputs and Raw Materials ............................................................................................................. 17
Local Skills ................................................................................................................................... 18
Other Production and Supply Issues ............................................................................................. 19
Demand Analysis .............................................................................................................................. 20
Domestic Consumption and International Trade .......................................................................... 20
Consumer Trends and Preferences ................................................................................................ 22
Competitive Position of Irbid Olives ............................................................................................ 22
Assessment of Marketing Practices .............................................................................................. 25
SWOT Analysis ................................................................................................................................... 28
SWOT Analysis ................................................................................................................................ 28
Key Findings and Conclusion ........................................................................................................... 29
Marketing Strategy and Recommendations ..................................................................................... 32
Marketing Upgrading Needs and Recommendations ....................................................................... 32
Business Opportunities/Value-Added Initiatives for Women and Small-Scale Producers ............... 34
Proposed Business Opportunities and Value-Added Initiatives ................................................... 34
Page 3 of 35
Tables
Table 1: Selected Socio-Economic Indicators of Jordan ........................................................................ 8
Table 2: Main Demographic Indicators of Irbid Governorate ................................................................ 9
Table 3: Key Economic and Labour Market Statistics in Irbid (2012) ................................................. 10
Table 4: Cultivated Area in Irbid Governorate ..................................................................................... 12
Table 5: Key Statistics of Jordan's Olive Production (2008-2012) ....................................................... 13
Table 6: Jordan's Olive and Olive Oil Production (2008-2012) ........................................................... 15
Table 7: Olive Oil Mills in Jordan ........................................................................................................ 17
Table 8: Olive Oil production in Jordan by Grade ................................................................................ 17
Table 9: Imports, Exports and Estimated Domestic Consumption of Fresh Olives in Jordan (2007-2012)
.............................................................................................................................................................. 20
Table 10: Imports, Exports and Estimated Domestic Consumption of Olive Oil in Jordan (2007-2012)20
Table 11: Top Exporters of Fresh Olives (2013) .................................................................................. 22
Table 12: Top Importers of Fresh Olives (2013) .................................................................................. 23
Table 13: Top Exporters of Olive Oil (2013) ....................................................................................... 23
Table 14: Top Importers of Olive Oil (2013) ....................................................................................... 24
Figures
Figure 1: Distribution of Olive Quantities transferred to Pressing and Oil Extraction (2008-2012) .... 16
Figure 2: Progression of Olive Oil Extraction in Jordan (2005-2012) .................................................. 16
Figure 3: Jordan's Exported Quantities (Mt thousands) of Fresh Olives and Olive Oil (2007-2013) ... 21
Figure 4: Distribution Channels of the Olive Market in Irbid .............................................................. 27
Page 4 of 35
Executive Summary The olive industry is considered the most important agri-business activity in the governorate of Irbid,
and it contributes 32% of Jordan’s total olive production. The sector has undergone remarkable
developments over the last two decades, which has resulted in expanding production in recent years.
Today, Jordan is the world’s 2nd
and 8th largest exporter of table olives and olive oil respectively, and
imports negligible quantities of both commodities compared to exports.
Market analysis in this report provides a range of statistics and indicators that show the high potentials
for further sector growth. There are several opportunities that can be exploited as demand continues to
increase.
However, despite enjoying several marketing strengths, mainly the geographic proximity to key
regional markets, commercial potential of produced varieties, availability of modern olive oil mills, the
sector suffers from a number of internal weaknesses and is quite vulnerable to a number of external
challenges.
Key internal weaknesses revolve around the fragmentation of the olive production base, insufficient
farmer know-how and in-adequate awareness of market trends and demand characteristics, improper
packaging, unidentified geographic indication of Irbid olives, poor marketing performance, lack of
effective branding, as well as a lack of coordination between farmers and mills which is increasingly
causing delays in accessing oil mills, often leading to quality deterioration. Key external challenges are
related to changing climatic conditions that have been causing unpredictable rainfall in recent years,
competition in export markets, and domestic consumer product quality trust issues.
Key recommendations include: establishing a farmer cooperative in Irbid to achieve economies of scale
through collective procurement, and enhance coordination between member farms and the olive mills.
The proposed cooperative can also introduce a number of value-added services to member farms, such
as rendering outsourced post-harvest handling services, and hosting micro and small businesses that
produce olive by-products. In addition, the report proposes introducing mobile mills, through the
introduction of a business idea to start a company that renders mobile milling to Irbid olive orchards.
Such business can be operated by women and small-scaled producers. The report proposes other
recommendations in the areas of: capacity building to workers in the areas of cultivation planning, soil
tillage, rugged land use, rainwater harvesting techniques, fertilizers and pesticides application, and post-
harvest handling. Finally, recommendations extend to cover branding, marketing communications, and
packaging.
Page 5 of 35
Introduction
Background
ILO value chain assessment reports of the Irbid olive sector highlighted pitfalls within various phases of
the value chain of the sector. Some of the main weaknesses are related to marketing practices,
including: branding, product quality, packaging, distribution and other marketing and operational
shortcomings. The value chain assessment report concluded that it was necessary to conduct a market
study that examines market demand and supply dynamics, marketing challenges and opportunities, as
well as identifying economic opportunities to various players within the marketing channels as well as
the local community within the sector, with particular focus on women and small-scale producers.
Objectives
The primary objective of this study was to identify windows of business opportunity within the Irbid
olive sector that are likely to have a good marketing potential for women, entrepreneurs, as well as
micro-to-small-scaled producers. The study also aimed at identifying and describing the corresponding
market segment(s), as well as devising a suitable marketing strategy that would ultimately lead to more
effective community engagement.
In order to achieve the above objective, the specific objectives of this study, as stated in the ToRs are:
I. Map out the current situation in terms of available raw materials, local skills, processing and
communication infrastructure, marketing channels and appropriate technologies within the
Project target area.
II. Assess the local, regional and national demand for those products that could be efficiently
produced at a micro- to small-scale of operation by the women assisted by the project and
organized in the form of sole producers or micro- to small-scale enterprises as defined by the
Project either producing and marketing on an individual firm basis or networking with other
firms in particular for joint purchasing or marketing.
III. Among the olive sub sector in Irbid, identify those with higher potential and with an emphasis
on value-added activities (e.g. Food production, processing, and vending; Horticulture; Organic
farming.
IV. Identify potential marketing outlets, including relevant trade flows, procedures and regulations,
mainly in the host communities but also in the rest of the country or for export in other
countries or overseas (e.g. Europe), if relevant to the selected lines of production.
Methodology
This report is based on desk research as well as field research and analysis of primary qualitative data
gathered through interviews with a number of farmers and growers of olive in Irbid.
Secondary data presented in this report primarily comes from reports and databases published by
Department of Statistics, Ministry of Agriculture, Central Bank of Jordan, ILO Irbid Olive Production
Value Chain Assessment Report, Jordan Exporters and Producers Association for Fruit and Vegetables
(JEPA), as well as any other sector reports and statistics that may be available at official secondary data
sources.
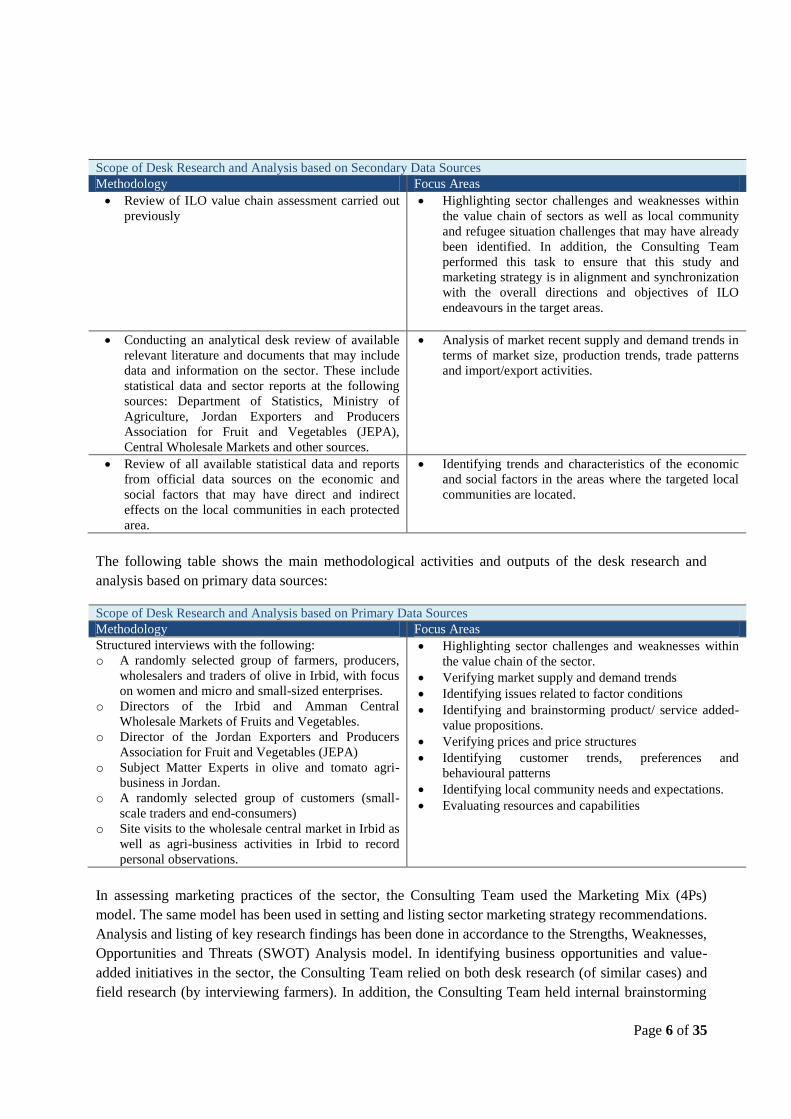
The following table shows the main methodological activities and outputs of the desk research and
analysis based on secondary data sources:
Page 6 of 35
Scope of Desk Research and Analysis based on Secondary Data Sources
Methodology Focus Areas
Review of ILO value chain assessment carried out
previously
Highlighting sector challenges and weaknesses within
the value chain of sectors as well as local community
and refugee situation challenges that may have already
been identified. In addition, the Consulting Team
performed this task to ensure that this study and
marketing strategy is in alignment and synchronization
with the overall directions and objectives of ILO
endeavours in the target areas.
Conducting an analytical desk review of available
relevant literature and documents that may include
data and information on the sector. These include
statistical data and sector reports at the following
sources: Department of Statistics, Ministry of
Agriculture, Jordan Exporters and Producers
Association for Fruit and Vegetables (JEPA),
Central Wholesale Markets and other sources.
Analysis of market recent supply and demand trends in
terms of market size, production trends, trade patterns
and import/export activities.
Review of all available statistical data and reports
from official data sources on the economic and
social factors that may have direct and indirect
effects on the local communities in each protected
area.
Identifying trends and characteristics of the economic
and social factors in the areas where the targeted local
communities are located.
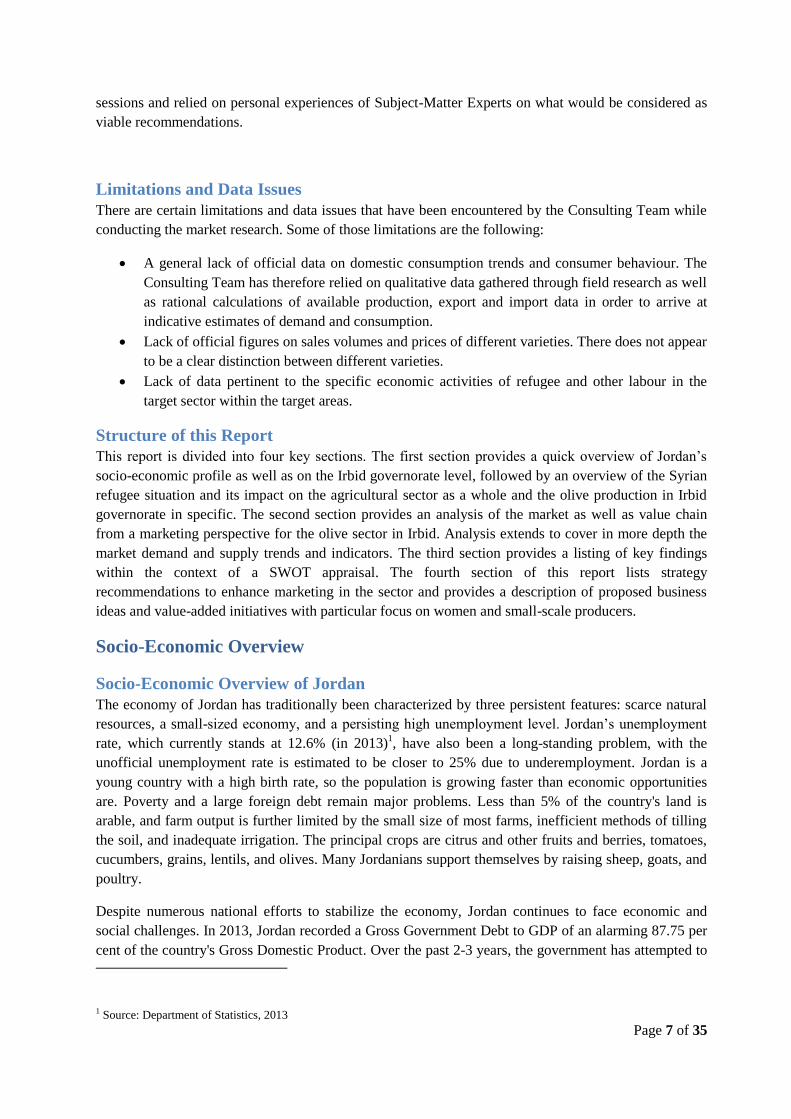
The following table shows the main methodological activities and outputs of the desk research and
analysis based on primary data sources:
Scope of Desk Research and Analysis based on Primary Data Sources
Methodology Focus Areas
Structured interviews with the following:
o A randomly selected group of farmers, producers,
wholesalers and traders of olive in Irbid, with focus
on women and micro and small-sized enterprises.
o Directors of the Irbid and Amman Central
Wholesale Markets of Fruits and Vegetables.
o Director of the Jordan Exporters and Producers
Association for Fruit and Vegetables (JEPA)
o Subject Matter Experts in olive and tomato agri-
business in Jordan.
o A randomly selected group of customers (small-
scale traders and end-consumers)
o Site visits to the wholesale central market in Irbid as
well as agri-business activities in Irbid to record
personal observations.
Highlighting sector challenges and weaknesses within
the value chain of the sector.
Verifying market supply and demand trends
Identifying issues related to factor conditions
Identifying and brainstorming product/ service added-
value propositions.
Verifying prices and price structures
Identifying customer trends, preferences and
behavioural patterns
Identifying local community needs and expectations.
Evaluating resources and capabilities
In assessing marketing practices of the sector, the Consulting Team used the Marketing Mix (4Ps)
model. The same model has been used in setting and listing sector marketing strategy recommendations.
Analysis and listing of key research findings has been done in accordance to the Strengths, Weaknesses,
Opportunities and Threats (SWOT) Analysis model. In identifying business opportunities and value-
added initiatives in the sector, the Consulting Team relied on both desk research (of similar cases) and
field research (by interviewing farmers). In addition, the Consulting Team held internal brainstorming
Page 7 of 35
sessions and relied on personal experiences of Subject-Matter Experts on what would be considered as
viable recommendations.
Limitations and Data Issues
There are certain limitations and data issues that have been encountered by the Consulting Team while
conducting the market research. Some of those limitations are the following:
A general lack of official data on domestic consumption trends and consumer behaviour. The
Consulting Team has therefore relied on qualitative data gathered through field research as well
as rational calculations of available production, export and import data in order to arrive at
indicative estimates of demand and consumption.
Lack of official figures on sales volumes and prices of different varieties. There does not appear
to be a clear distinction between different varieties.
Lack of data pertinent to the specific economic activities of refugee and other labour in the
target sector within the target areas.
Structure of this Report
This report is divided into four key sections. The first section provides a quick overview of Jordan’s
socio-economic profile as well as on the Irbid governorate level, followed by an overview of the Syrian
refugee situation and its impact on the agricultural sector as a whole and the olive production in Irbid
governorate in specific. The second section provides an analysis of the market as well as value chain
from a marketing perspective for the olive sector in Irbid. Analysis extends to cover in more depth the
market demand and supply trends and indicators. The third section provides a listing of key findings
within the context of a SWOT appraisal. The fourth section of this report lists strategy
recommendations to enhance marketing in the sector and provides a description of proposed business
ideas and value-added initiatives with particular focus on women and small-scale producers.
Socio-Economic Overview
Socio-Economic Overview of Jordan
The economy of Jordan has traditionally been characterized by three persistent features: scarce natural
resources, a small-sized economy, and a persisting high unemployment level. Jordan’s unemployment
rate, which currently stands at 12.6% (in 2013)1, have also been a long-standing problem, with the
unofficial unemployment rate is estimated to be closer to 25% due to underemployment. Jordan is a
young country with a high birth rate, so the population is growing faster than economic opportunities
are. Poverty and a large foreign debt remain major problems. Less than 5% of the country's land is
arable, and farm output is further limited by the small size of most farms, inefficient methods of tilling
the soil, and inadequate irrigation. The principal crops are citrus and other fruits and berries, tomatoes,
cucumbers, grains, lentils, and olives. Many Jordanians support themselves by raising sheep, goats, and
poultry.
Despite numerous national efforts to stabilize the economy, Jordan continues to face economic and
social challenges. In 2013, Jordan recorded a Gross Government Debt to GDP of an alarming 87.75 per
cent of the country's Gross Domestic Product. Over the past 2-3 years, the government has attempted to
1 Source: Department of Statistics, 2013
Page 8 of 35
tackle economic challenges by increasing several tax rates, reducing fuel and electricity subsidies and
made efforts to broaden the tax base and increase collection efficiency.
The economy of Jordan started to show signs of recovery in 2010 from the aftermath of the global
financial crisis in 2008. However, this slight recovery did not last for long as Jordan’s economic
challenges have reportedly worsened amid the Syrian crisis which erupted in 2011. The influx of Syrian
refugees to Jordan has added a huge burden on the country’s economy which suffers from relatively
high rates of poverty and unemployment, not to mention huge challenges facing the infrastructure. The
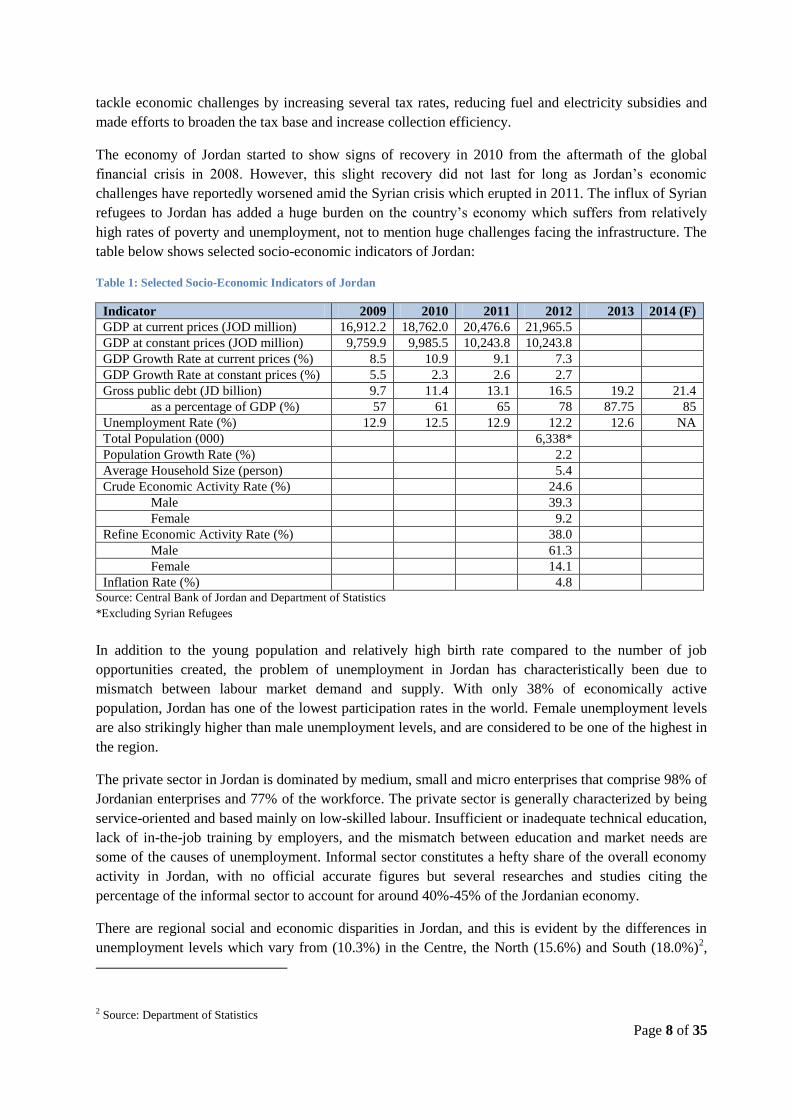
table below shows selected socio-economic indicators of Jordan:
Table 1: Selected Socio-Economic Indicators of Jordan
Indicator 2009 2010 2011 2012 2013 2014 (F)
GDP at current prices (JOD million) 16,912.2 18,762.0 20,476.6 21,965.5
GDP at constant prices (JOD million) 9,759.9 9,985.5 10,243.8 10,243.8
GDP Growth Rate at current prices (%) 8.5 10.9 9.1 7.3
GDP Growth Rate at constant prices (%) 5.5 2.3 2.6 2.7
Gross public debt (JD billion) 9.7 11.4 13.1 16.5 19.2 21.4
as a percentage of GDP (%) 57 61 65 78 87.75 85
Unemployment Rate (%) 12.9 12.5 12.9 12.2 12.6 NA
Total Population (000) 6,338*
Population Growth Rate (%) 2.2
Average Household Size (person) 5.4
Crude Economic Activity Rate (%) 24.6
Male 39.3
Female 9.2
Refine Economic Activity Rate (%) 38.0
Male 61.3
Female 14.1
Inflation Rate (%) 4.8 Source: Central Bank of Jordan and Department of Statistics
*Excluding Syrian Refugees
In addition to the young population and relatively high birth rate compared to the number of job
opportunities created, the problem of unemployment in Jordan has characteristically been due to
mismatch between labour market demand and supply. With only 38% of economically active
population, Jordan has one of the lowest participation rates in the world. Female unemployment levels
are also strikingly higher than male unemployment levels, and are considered to be one of the highest in
the region.
The private sector in Jordan is dominated by medium, small and micro enterprises that comprise 98% of
Jordanian enterprises and 77% of the workforce. The private sector is generally characterized by being
service-oriented and based mainly on low-skilled labour. Insufficient or inadequate technical education,
lack of in-the-job training by employers, and the mismatch between education and market needs are
some of the causes of unemployment. Informal sector constitutes a hefty share of the overall economy
activity in Jordan, with no official accurate figures but several researches and studies citing the
percentage of the informal sector to account for around 40%-45% of the Jordanian economy.
There are regional social and economic disparities in Jordan, and this is evident by the differences in
unemployment levels which vary from (10.3%) in the Centre, the North (15.6%) and South (18.0%)2,
2 Source: Department of Statistics
Page 9 of 35
and this is mainly due to a mismatch between people’s places of residence and work locations, as well
as the notion that little focus has been given to rural labour intensive enterprises which represent the
livelihood and employment generators for many of the poor in rural areas.
Poverty levels in Jordan remain relatively high, and the relative poverty rate has actually regressed from
13.3% in 2008 to 14.4% in 20103, which shows that the poverty situation has worsened. There are 27
poverty pockets in Jordan, 2 are in the governorate in Irbid.
Irbid Socio-Economic Overview
The city of Irbid is located about 85 km north of Amman and is considered the third largest city in
Jordan by population (after Amman and Zarqa). The province of Irbid Governorate has the second
largest population and the highest population density in Jordan. It is situated in the north west of the
Hashemite Kingdom of Jordan, surrounded by fertile agricultural lands from north, east, west and south,
with many fountains and springs water, as well as rain-fed valleys, and climatic conditions that are
favorable for agricultural activity, and the city has always been known for its fresh olives and olive oil.
Total area of Irbid Governorate is estimated at about 1571.8 km2 which accounts for 1.8% of Jordan’s
total geographic area. Due to its unique geographic location Irbid at the vicinity of the borders with
Israel, Syria and the Palestinian territories, Irbid is considered one of the most important trading centers
in Jordan, and is considered a major ground transportation hub between Amman, Syria to the north, and
Mafraq to the east.
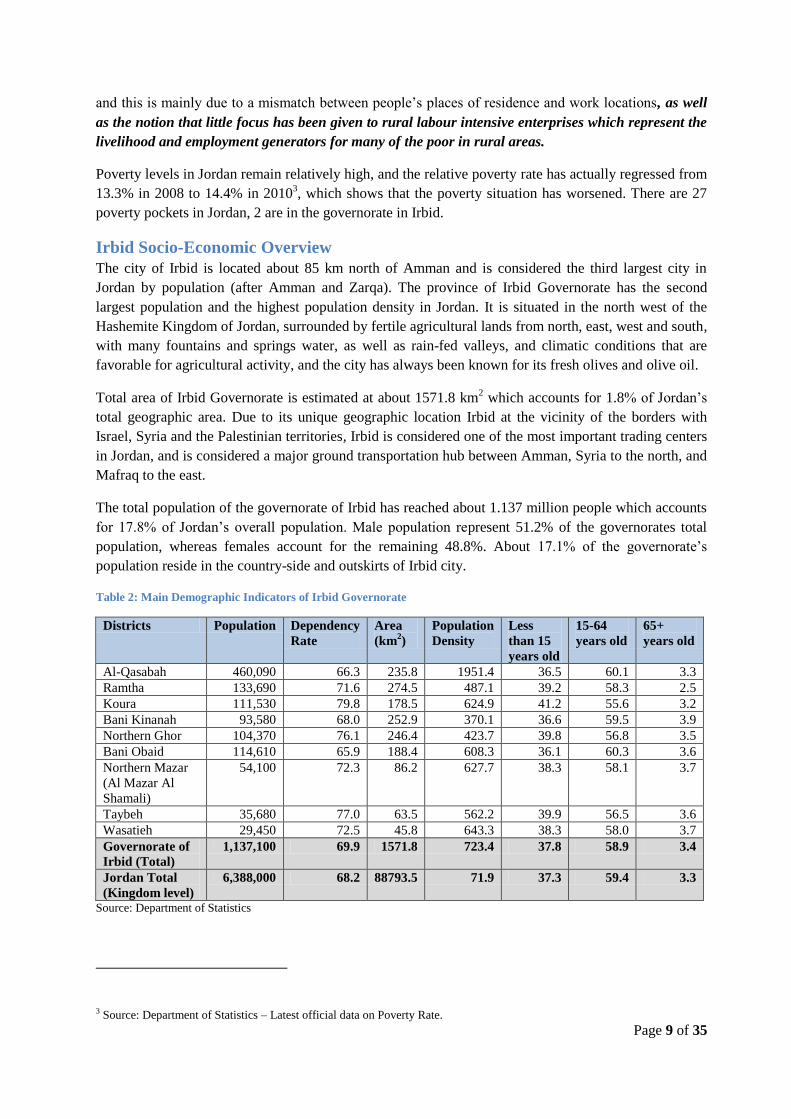
The total population of the governorate of Irbid has reached about 1.137 million people which accounts
for 17.8% of Jordan’s overall population. Male population represent 51.2% of the governorates total
population, whereas females account for the remaining 48.8%. About 17.1% of the governorate’s
population reside in the country-side and outskirts of Irbid city.
Table 2: Main Demographic Indicators of Irbid Governorate
Districts Population Dependency
Rate
Area
(km2)
Population
Density
Less
than 15
years old
15-64
years old
65+
years old
Al-Qasabah 460,090 66.3 235.8 1951.4 36.5 60.1 3.3
Ramtha 133,690 71.6 274.5 487.1 39.2 58.3 2.5
Koura 111,530 79.8 178.5 624.9 41.2 55.6 3.2
Bani Kinanah 93,580 68.0 252.9 370.1 36.6 59.5 3.9
Northern Ghor 104,370 76.1 246.4 423.7 39.8 56.8 3.5
Bani Obaid 114,610 65.9 188.4 608.3 36.1 60.3 3.6
Northern Mazar
(Al Mazar Al
Shamali)
54,100 72.3 86.2 627.7 38.3 58.1 3.7
Taybeh 35,680 77.0 63.5 562.2 39.9 56.5 3.6
Wasatieh 29,450 72.5 45.8 643.3 38.3 58.0 3.7
Governorate of
Irbid (Total)
1,137,100 69.9 1571.8 723.4 37.8 58.9 3.4
Jordan Total
(Kingdom level)
6,388,000 68.2 88793.5 71.9 37.3 59.4 3.3
Source: Department of Statistics
3 Source: Department of Statistics – Latest official data on Poverty Rate.
Page 10 of 35
Latest official statistics on poverty indicators published by the Department of Statistics, based on the
Household Income and Expenditure Survey 2010, show that the poverty ratio in Irbid has reached 15%
which is slightly higher than the Kingdom’s average of 14.4%4. The number of the ‘poor’ in Irbid
Governorate is 163,933 people, accounting for 18.7% of the total number of the ‘poor’ in Jordan.
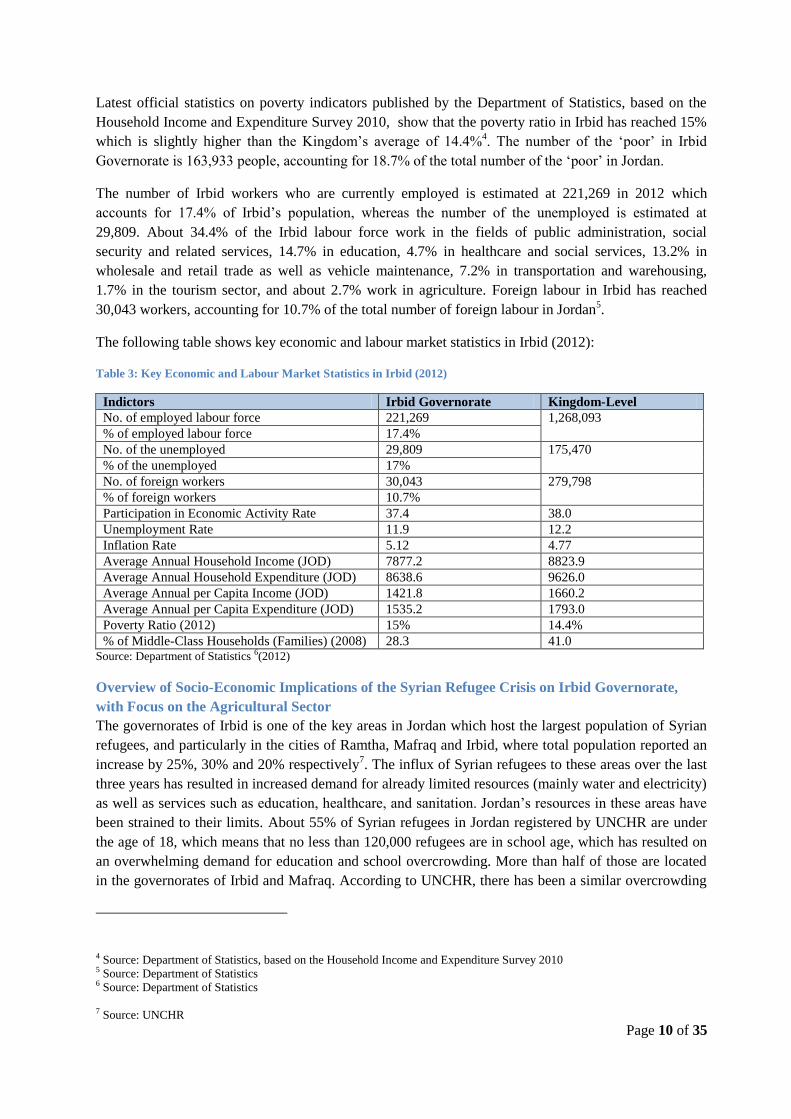
The number of Irbid workers who are currently employed is estimated at 221,269 in 2012 which
accounts for 17.4% of Irbid’s population, whereas the number of the unemployed is estimated at
29,809. About 34.4% of the Irbid labour force work in the fields of public administration, social
security and related services, 14.7% in education, 4.7% in healthcare and social services, 13.2% in
wholesale and retail trade as well as vehicle maintenance, 7.2% in transportation and warehousing,
1.7% in the tourism sector, and about 2.7% work in agriculture. Foreign labour in Irbid has reached
30,043 workers, accounting for 10.7% of the total number of foreign labour in Jordan5.
The following table shows key economic and labour market statistics in Irbid (2012):
Table 3: Key Economic and Labour Market Statistics in Irbid (2012)
Indictors Irbid Governorate Kingdom-Level
No. of employed labour force 221,269 1,268,093
% of employed labour force 17.4%
No. of the unemployed 29,809 175,470
% of the unemployed 17%
No. of foreign workers 30,043 279,798
% of foreign workers 10.7%
Participation in Economic Activity Rate 37.4 38.0
Unemployment Rate 11.9 12.2
Inflation Rate 5.12 4.77
Average Annual Household Income (JOD) 7877.2 8823.9
Average Annual Household Expenditure (JOD) 8638.6 9626.0
Average Annual per Capita Income (JOD) 1421.8 1660.2
Average Annual per Capita Expenditure (JOD) 1535.2 1793.0
Poverty Ratio (2012) 15% 14.4%
% of Middle-Class Households (Families) (2008) 28.3 41.0 Source: Department of Statistics 6(2012)
Overview of Socio-Economic Implications of the Syrian Refugee Crisis on Irbid Governorate,
with Focus on the Agricultural Sector
The governorates of Irbid is one of the key areas in Jordan which host the largest population of Syrian
refugees, and particularly in the cities of Ramtha, Mafraq and Irbid, where total population reported an
increase by 25%, 30% and 20% respectively7. The influx of Syrian refugees to these areas over the last
three years has resulted in increased demand for already limited resources (mainly water and electricity)
as well as services such as education, healthcare, and sanitation. Jordan’s resources in these areas have
been strained to their limits. About 55% of Syrian refugees in Jordan registered by UNCHR are under
the age of 18, which means that no less than 120,000 refugees are in school age, which has resulted on
an overwhelming demand for education and school overcrowding. More than half of those are located
in the governorates of Irbid and Mafraq. According to UNCHR, there has been a similar overcrowding
4 Source: Department of Statistics, based on the Household Income and Expenditure Survey 2010 5 Source: Department of Statistics 6 Source: Department of Statistics
7 Source: UNCHR
Page 11 of 35
is witnessed at primary healthcare facilities in Ramtha, Irbid and Mafraq where shortages of medicine
has also been witnessed. This problem is aggravated by the already low bed capacity in both Irbid and
Mafraq governorates, where the number of beds per 10,000 people is as low as 11 and 8 in both
governorates, respectively8.
Water resources in Irbid governorate had been scarce even prior to the Syrian crisis, where water
distribution to households was only for once or twice a week for a period of up to six hours only.
UNCHR, based on meetings with officials and representatives in both governorates, indicates that
Syrian refugee communities reportedly have little understanding and application of water conservation
practices, and this has also contributed to the water scarcity problem.
In terms of employment and labor market, it has been noted that Syrians have been crowding and
pushing out Jordanians workers in specific sectors, such as: hospitality, retail, trade, and construction.
With regards to agriculture, the situation is quite similar. However, the problem is less severe than in
other sectors mainly because Jordanians do not heavily engage with production practices of the sector.
Some reports point out to the issue of “the culture of shame” that states that Jordanians refrain from
working in low-end occupations including those related to farming and agricultural jobs. However, field
research shows that the underlying reason why Jordanians do not pursue such jobs in the agriculture
sector is rather down to economic reasons, related to low wage pay offered by producers and poor
working conditions, rather than socio-cultural issues. The ILO report on value chain assessment of
Mafraq tomato production points out the opportunity of creating higher value adding activities to entice
Jordanians to take on such jobs, and that a rapid assessment should be conducted to examine the cultural
dimensions related to Jordanians’ unwillingness to work in farms. In the agricultural sector, Egyptian
workers, who have previously dominated the scene, have been more susceptible than Jordanians to
Syrian workers influx and entry to the sector.
The agricultural sector in Jordan has characteristically been limited due to lack of human resources,
with Jordanians refraining from working in the sector and the government placing restrictions on the
number of foreign labour in the sector. With the influx of Syrian refugees, the situation has changed.
Jordanian farm owners have been tempted to increase their tomato production as the unavailability of
labour has become less of a problem since the Syrian farmers arrived. Interviewees mentioned that
Egyptian workers remain more skilled and efficient in the early stages of agricultural production, which
include soil preparation, fertilization and seeding. However, Syrian workers are preferred in harvesting
and post-harvest handling stages, which include picking and handling the harvested crop and
performing crop sorting and grading processes.
Prior to the Syrian crisis, Egyptian workers have lobbied and managed to increase their wages by
almost three-folds. The competition imposed on Egyptian workers ever since the Syrians arrived has
contributed to stabilizing wage levels. However due to: (1) family connections, (2) higher post-
harvesting skills of Syrian workers, (3) cultural similarities between Syrian workers and Jordanian
farmers - many Jordanian farmers/farm owners have displaced Egyptian with Syrian employment,
especially that Syrian farmers are considered to be more skilled particularly in the areas of harvest and
post-harvest handling activities.
8 Source: Ministry of Health
Page 12 of 35
Market Analysis
Supply Analysis
Irbid is considered to be one of the most active regions of Jordan in terms of agricultural activities. The
Governorate produces citrus, olives and grain, in addition to the production of honey and livestock.
More on the distribution of production is provided in the following section.
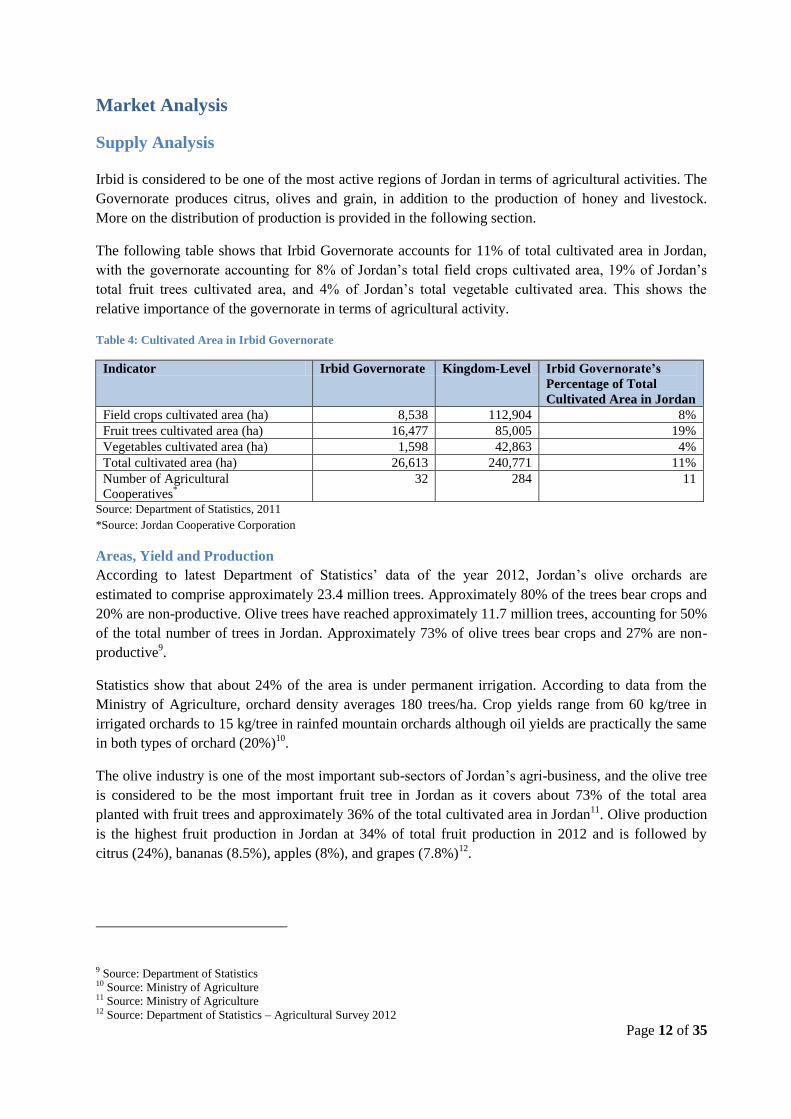
The following table shows that Irbid Governorate accounts for 11% of total cultivated area in Jordan,
with the governorate accounting for 8% of Jordan’s total field crops cultivated area, 19% of Jordan’s
total fruit trees cultivated area, and 4% of Jordan’s total vegetable cultivated area. This shows the
relative importance of the governorate in terms of agricultural activity.
Table 4: Cultivated Area in Irbid Governorate
Indicator Irbid Governorate Kingdom-Level Irbid Governorate’s
Percentage of Total
Cultivated Area in Jordan
Field crops cultivated area (ha) 8,538 112,904 8%
Fruit trees cultivated area (ha) 16,477 85,005 19%
Vegetables cultivated area (ha) 1,598 42,863 4%
Total cultivated area (ha) 26,613 240,771 11%
Number of Agricultural
Cooperatives*
32 284 11
Source: Department of Statistics, 2011
*Source: Jordan Cooperative Corporation
Areas, Yield and Production
According to latest Department of Statistics’ data of the year 2012, Jordan’s olive orchards are
estimated to comprise approximately 23.4 million trees. Approximately 80% of the trees bear crops and
20% are non-productive. Olive trees have reached approximately 11.7 million trees, accounting for 50%
of the total number of trees in Jordan. Approximately 73% of olive trees bear crops and 27% are non-
productive9.
Statistics show that about 24% of the area is under permanent irrigation. According to data from the
Ministry of Agriculture, orchard density averages 180 trees/ha. Crop yields range from 60 kg/tree in
irrigated orchards to 15 kg/tree in rainfed mountain orchards although oil yields are practically the same
in both types of orchard (20%)10
.
The olive industry is one of the most important sub-sectors of Jordan’s agri-business, and the olive tree
is considered to be the most important fruit tree in Jordan as it covers about 73% of the total area
planted with fruit trees and approximately 36% of the total cultivated area in Jordan11
. Olive production
is the highest fruit production in Jordan at 34% of total fruit production in 2012 and is followed by
citrus (24%), bananas (8.5%), apples (8%), and grapes (7.8%)12
.
9 Source: Department of Statistics 10 Source: Ministry of Agriculture 11 Source: Ministry of Agriculture 12 Source: Department of Statistics – Agricultural Survey 2012
Page 13 of 35
Table 5: Key Statistics of Jordan's Olive Production (2008-2012)
Crop: Olive Level: Jordan
Statistic Items 2008 2009 2010 2011 2012
Cultivated Area (ha) 60,531.8 60,659.8 60,878.8 62,087.9 62,687.1
Total No. of Trees 11,136,565 11,154,168 11,225,985 11,518,114 11,686,719
No. of Bearing Trees 5,977,547 8,886,471 8,674,114 8,607,646 8,541,418
Average Yield (KG/bearing tree) 15.7 15.8 19.8 15.3 18.2
Production (Mt) 94,068 140,719 171,672 131,847 155,640
Production Growth Rate (%) -25% 50% 22% -23% 18%
Source: Department of Statistics, Agricultural Survey
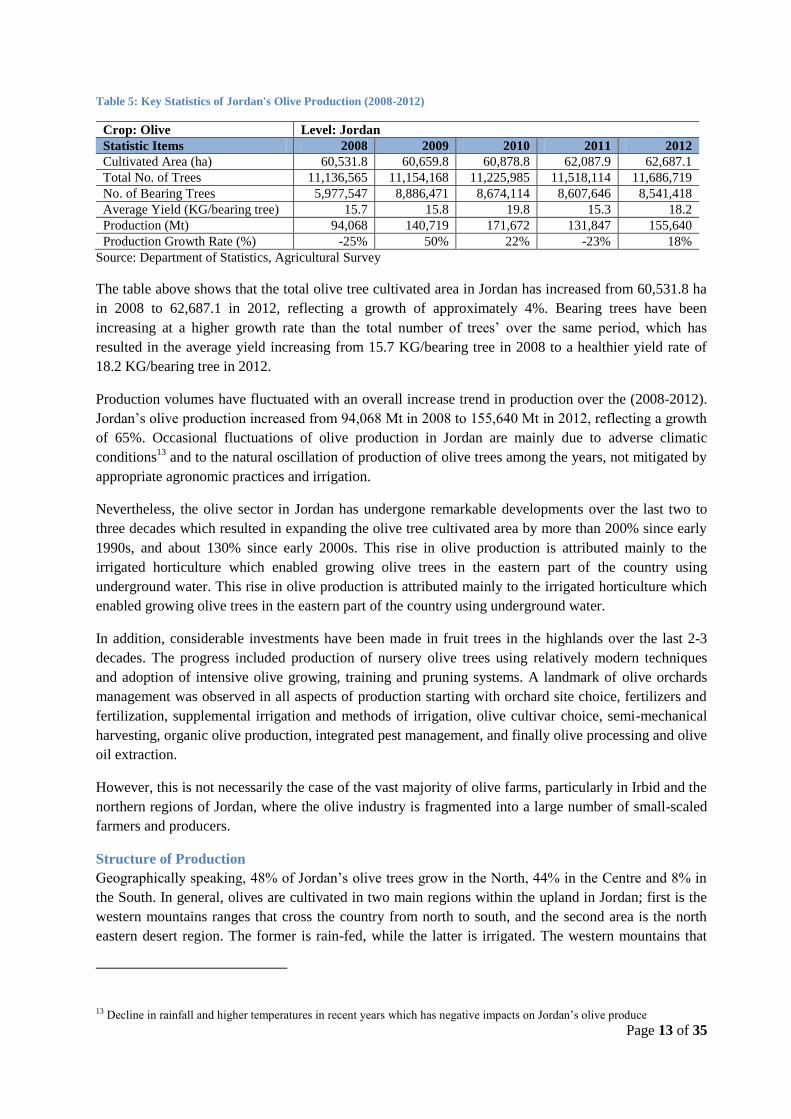
The table above shows that the total olive tree cultivated area in Jordan has increased from 60,531.8 ha
in 2008 to 62,687.1 in 2012, reflecting a growth of approximately 4%. Bearing trees have been
increasing at a higher growth rate than the total number of trees’ over the same period, which has
resulted in the average yield increasing from 15.7 KG/bearing tree in 2008 to a healthier yield rate of
18.2 KG/bearing tree in 2012.
Production volumes have fluctuated with an overall increase trend in production over the (2008-2012).
Jordan’s olive production increased from 94,068 Mt in 2008 to 155,640 Mt in 2012, reflecting a growth
of 65%. Occasional fluctuations of olive production in Jordan are mainly due to adverse climatic
conditions13
and to the natural oscillation of production of olive trees among the years, not mitigated by
appropriate agronomic practices and irrigation.
Nevertheless, the olive sector in Jordan has undergone remarkable developments over the last two to
three decades which resulted in expanding the olive tree cultivated area by more than 200% since early
1990s, and about 130% since early 2000s. This rise in olive production is attributed mainly to the
irrigated horticulture which enabled growing olive trees in the eastern part of the country using
underground water. This rise in olive production is attributed mainly to the irrigated horticulture which
enabled growing olive trees in the eastern part of the country using underground water.
In addition, considerable investments have been made in fruit trees in the highlands over the last 2-3
decades. The progress included production of nursery olive trees using relatively modern techniques
and adoption of intensive olive growing, training and pruning systems. A landmark of olive orchards
management was observed in all aspects of production starting with orchard site choice, fertilizers and
fertilization, supplemental irrigation and methods of irrigation, olive cultivar choice, semi-mechanical
harvesting, organic olive production, integrated pest management, and finally olive processing and olive
oil extraction.
However, this is not necessarily the case of the vast majority of olive farms, particularly in Irbid and the
northern regions of Jordan, where the olive industry is fragmented into a large number of small-scaled
farmers and producers.
Structure of Production
Geographically speaking, 48% of Jordan’s olive trees grow in the North, 44% in the Centre and 8% in
the South. In general, olives are cultivated in two main regions within the upland in Jordan; first is the
western mountains ranges that cross the country from north to south, and the second area is the north
eastern desert region. The former is rain-fed, while the latter is irrigated. The western mountains that
13 Decline in rainfall and higher temperatures in recent years which has negative impacts on Jordan’s olive produce
Page 14 of 35
cross the country from north to south (rain-fed) which represent about 77% of the total area planted
with olive and the north eastern region (irrigated), where the average annual rainfall is more than
300mm. Each producing region pursues a very different olive cultivation pattern. In Irbid and the rain-
fed mountainous area, farms tend to be small.
Irbid and the northern region of Jordan are considered to be a major region of rain-fed olive tree
cultivation14
, and olive growing has always been a major feature of the heritage and socio-cultural life
in Irbid. Large numbers of olive farms in Irbid belong to mainly small-size holders which are
considered as a source of income for many families in Irbid, and provide many seasonal job
opportunities for agricultural workers. Therefore, the structure of the olive sector in Irbid is fragmented
into small holdings.
In Irbid, the olive industry is considered as the most important agri-business activity. Overlooking the
Golan Heights of Syria, Kfarat, some 20 kilometres north of the city of Irbid, is rich with old olive trees,
with some dating back to the Roman era. The governorate is home to over one million olive trees. In
Irbid alone, the areas planted with olive trees reached 25,022 hectares, which accounts for about 21% of
total areas planted with olive trees in Jordan15
. Irbid’s production of fresh olives is therefore estimated
to account for 32% of Jordan’s total olive production. The main cultivated areas of Irbid where olives
are produced include: Kfarat, Taybeh, Wasateyeh, Ramtha, and Bani Kinanah. The average rainfall is
450mm which is very suitable for olive trees. The peak in activity occurs in winter, which makes it
compatible with other agricultural and non-agricultural activities. With traditional growing methods,
labour represents over half of production costs.
However, Irbid’s is considered to be vastly under-producing as the cultivated areas are only 14,830
hectares out of 105,000 hectares suitable for cultivation in Irbid, which means that only 14% of suitable
land for cultivation in Irbid is actually utilized.
Olive growing in Jordan, and particularly in Irbid, produces two main products, namely table olives and
olive oil. There are round thirty different types of Olive trees present in Jordan and all of which are
capable of producing excellent quality Extra Virgin Olive Oil. In Irbid, cultivated olives trees produce
olives that can be used to produce table olives as well as olive oil. The predominant olive varieties are
big and black, belonging to the Nabali olive variety. Main olive varieties are:
Nabali Baladi: This variety adapts well to all the olive producing regions of Jordan, growing in
the Western mountain range and in the irrigated Eastern plains. It is dual-purpose and has a
high oil content ranging from 28 to 33% and an oleic acid content of around 67–71%. The tree
has a vigorous and spreading growth habit. The fruit is small to medium-sized, ovoid in shape
and asymmetric, and weighs 2–4 g on average. Its flesh is firm, adheres strongly to the stone
and represents about 82% of the fruit’s weight. The stone is medium sized, narrow and
elongated with clear veins. It is considered to be drought tolerant and to show medium salt
tolerance. It is resistant to most common olive pests and diseases. Oils of this variety have
organoleptic qualities of nice light to medium fruitiness. This is the predominant olive variety
produced in Irbid.
Rasie’: This variety is very widespread and is found across almost the whole of the country. It
originates from the south of Jordan and is grown in mountainous areas with an annual rainfall
14 Source: Ministry of Agriculture 15 Source: Ministry of Agriculture
Page 15 of 35
of around 330 mm. Owing to its resistance to dry climates; it is also spreading to the drier,
eastern parts of the country where it is grown with supplemental irrigation. It is hardy and it has
a low rooting ability. It has an intermediate start of bearing. Its time of flowering is also
intermediate. It is self-compatible and it has a low pistil abortion rate. Its productivity is high
and alternate. The fruit is used for green or black pickling as well for producing good quality
oil. It is clingstone. The oil content present ranges from 15 to 28% according to end use,
growing area and whether or not irrigation is applied. It adapts readily to different climates and
soils. It is very resistant to drought and cold climates, besides being tolerant of salinity. It is
resistant to the most common olive diseases although it is sensitive to olive anthracnose. This
variety has a taste of medium fruitiness with hints of green apple.
Souri: Oils of these olives have an intense fruity aroma and differentiated organoleptic
characteristics. However, its production is considered to be rather limited compared to the
Nabali and Rasie’ varieties.
Olive Oil Production (Processing Sector)
Jordan’s olive oil processing industry has undergone extensive modernisation in recent years. This is
clear from the data given in the table below, supplied by the Ministry of Agriculture, which show a
gradual increase in the number of three and two-phase facilities, a decrease in press mills and the total
disappearance of traditional oil mills.
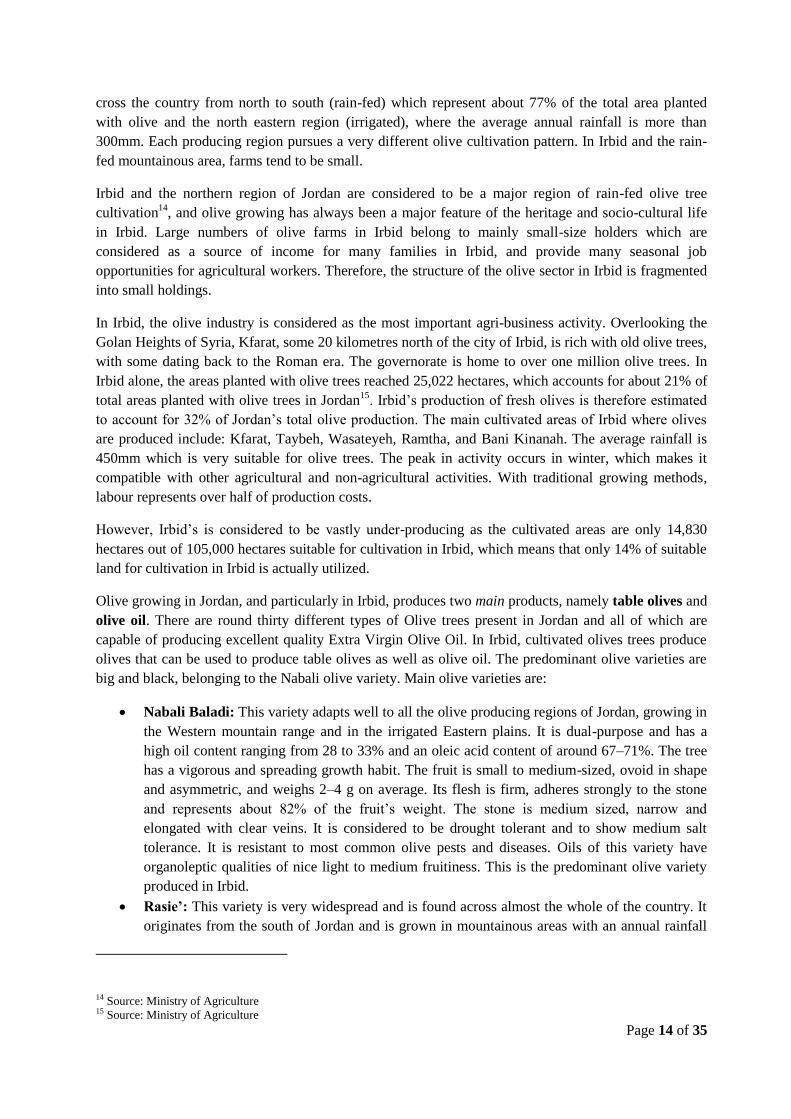
In 2012, Jordan’s olive farms produced 21,548 tonnes of olive oil during the harvest season between
October 15 and January 23, according to the official data released by the Department of Statistics . The
DoS report estimated the volume of olive production at 115,282 tonnes in 2012, 9 per cent higher than
the 106,006 tonnes produced in 2011. Irbid Governorate was the highest olive oil producer in 2012 in
Jordan at 7,188 tonnes, followed by Ajloun with 4,413 tonnes. According to the National Centre for
Agricultural Research and Extension NCARE, there are over 17 million olive trees in the country,
nearly half of which are in the northern region of Jordan. The olive oil industry represents an important
source of income for around 80,000 Jordanian families, according to the NCARE. The olive sector’s
annual contribution to the economy is estimated at JD100 million, with average exports of over JD20
million, according to the official data.
Table 6: Jordan's Olive and Olive Oil Production (2008-2012)
Crop: Olive Level: Jordan
Statistic Items 2008 2009 2010 2011 2012
Total Production (Mt) 138,689 221,588 171,036 174,514 155,640
Quantities processed as table olives & pickled olives 16,624 32,739 28,794 30,203 31,128
% of Quantities transferred to pressing (%) 12% 15% 17% 17% 20% Quantities transferred to mills for oil extraction (Mt) 122,065 188,849 142,242 144,311 115,282
% of Quantities transferred to mills (%) 88% 85% 83% 83% 74% Extracted olive oil (Mt) 18,472 36,652 27,311 19,352 21,548
Oil extraction rate (%) 15% 19% 19% 13% 19% Olive pomace and residues (Mt) 30,516 47,212 35,561 41,289 39,562
Source: Ministry of Agriculture, Annual Statistical Book (2012)
The table above shows that only about 20% of olive crops are transferred to pressing and producing
table olives and related products (such as pickles and olive paste), whereas the vast majority of olive
crops are transferred to mills for olive oil extraction. The table shows that there has been a gradual
decrease in the quantity of olives transferred to olive oil production (extraction). This is mainly due to
mill access difficulties emanating from lack of coordination between olive growers and mills in light of
Page 16 of 35
increasing olive production. However, this decrease has not resulted in decreasing the quantities of
produced olive oil which has been fluctuating over the same period, and produced quantities of olive oil
registered a slight growth in 2012 over produced quantities in 2008 and 2011 where the percentage of
olives transferred to mills for oil extraction where 88% and 83% respectively.
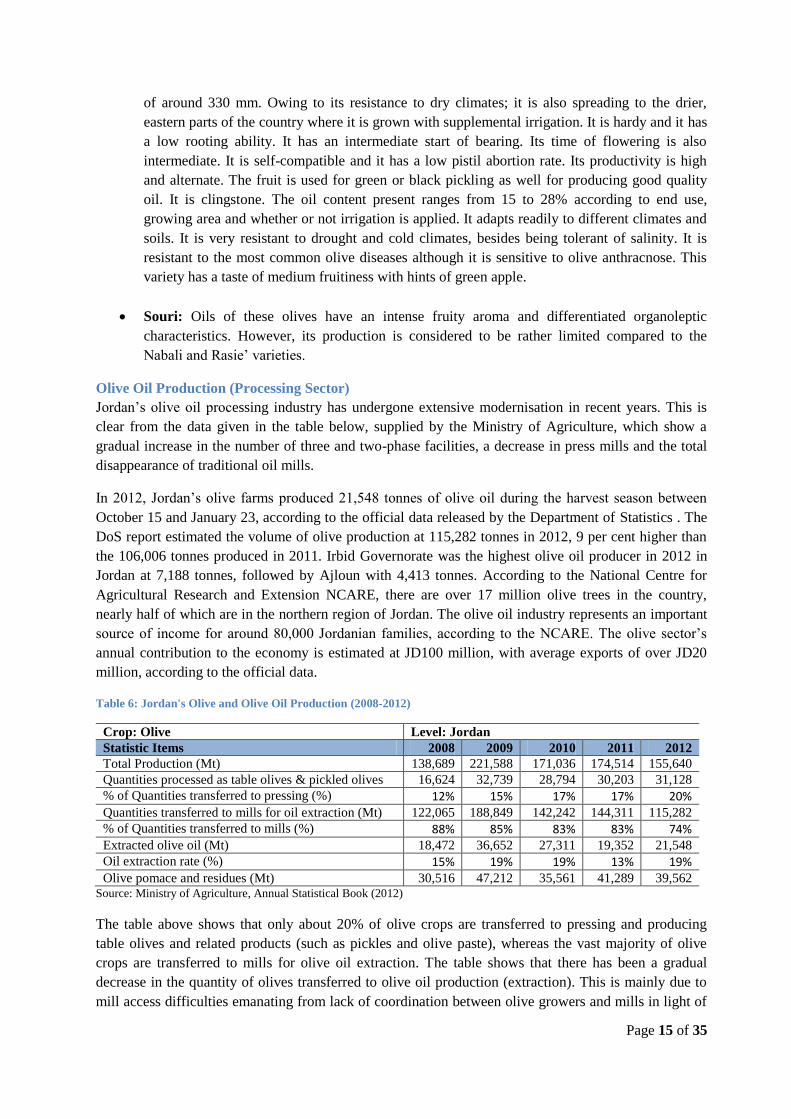
The following figure illustrates the distribution of olive production in Jordan based on the end product.
The figure shows that the percentage of table olive production has been increasing over the (2008-2012)
period, whereas the percentage of olives transferred to mills for olive oil extraction have decreased
slightly between the 2008 and 2012.
Source: Ministry of Agriculture, Annual Statistical Book (2012)
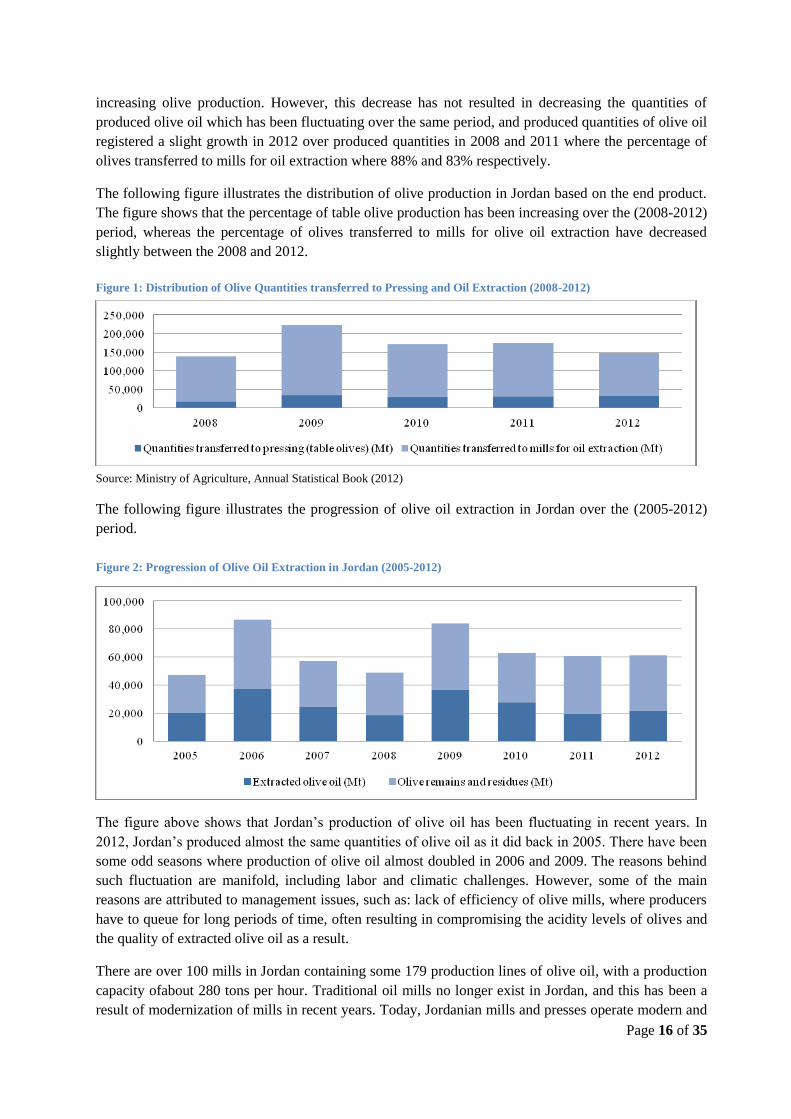
The following figure illustrates the progression of olive oil extraction in Jordan over the (2005-2012)
period.
The figure above shows that Jordan’s production of olive oil has been fluctuating in recent years. In
2012, Jordan’s produced almost the same quantities of olive oil as it did back in 2005. There have been
some odd seasons where production of olive oil almost doubled in 2006 and 2009. The reasons behind
such fluctuation are manifold, including labor and climatic challenges. However, some of the main
reasons are attributed to management issues, such as: lack of efficiency of olive mills, where producers
have to queue for long periods of time, often resulting in compromising the acidity levels of olives and
the quality of extracted olive oil as a result.
There are over 100 mills in Jordan containing some 179 production lines of olive oil, with a production
capacity ofabout 280 tons per hour. Traditional oil mills no longer exist in Jordan, and this has been a
result of modernization of mills in recent years. Today, Jordanian mills and presses operate modern and
Figure 1: Distribution of Olive Quantities transferred to Pressing and Oil Extraction (2008-2012)
Figure 2: Progression of Olive Oil Extraction in Jordan (2005-2012)
Page 17 of 35
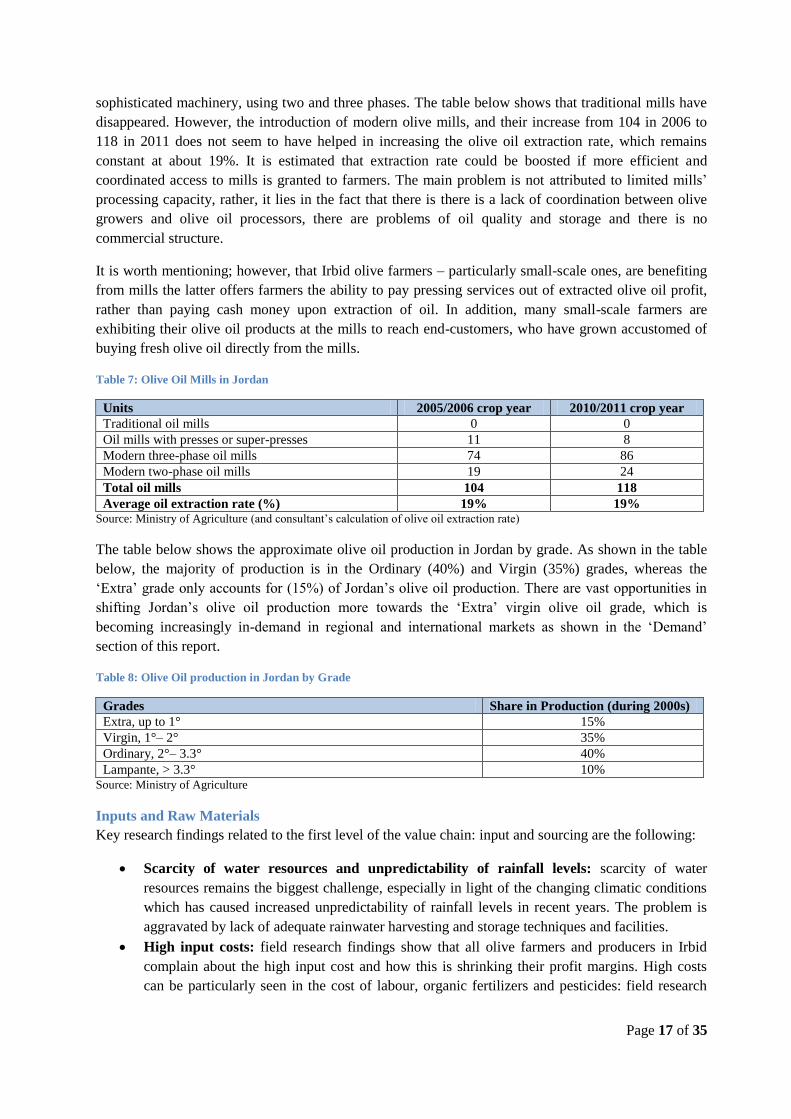
sophisticated machinery, using two and three phases. The table below shows that traditional mills have
disappeared. However, the introduction of modern olive mills, and their increase from 104 in 2006 to
118 in 2011 does not seem to have helped in increasing the olive oil extraction rate, which remains
constant at about 19%. It is estimated that extraction rate could be boosted if more efficient and
coordinated access to mills is granted to farmers. The main problem is not attributed to limited mills’
processing capacity, rather, it lies in the fact that there is there is a lack of coordination between olive
growers and olive oil processors, there are problems of oil quality and storage and there is no
commercial structure.
It is worth mentioning; however, that Irbid olive farmers – particularly small-scale ones, are benefiting
from mills the latter offers farmers the ability to pay pressing services out of extracted olive oil profit,
rather than paying cash money upon extraction of oil. In addition, many small-scale farmers are
exhibiting their olive oil products at the mills to reach end-customers, who have grown accustomed of
buying fresh olive oil directly from the mills.
Table 7: Olive Oil Mills in Jordan
Units 2005/2006 crop year 2010/2011 crop year
Traditional oil mills 0 0
Oil mills with presses or super-presses 11 8
Modern three-phase oil mills 74 86
Modern two-phase oil mills 19 24
Total oil mills 104 118
Average oil extraction rate (%) 19% 19% Source: Ministry of Agriculture (and consultant’s calculation of olive oil extraction rate)
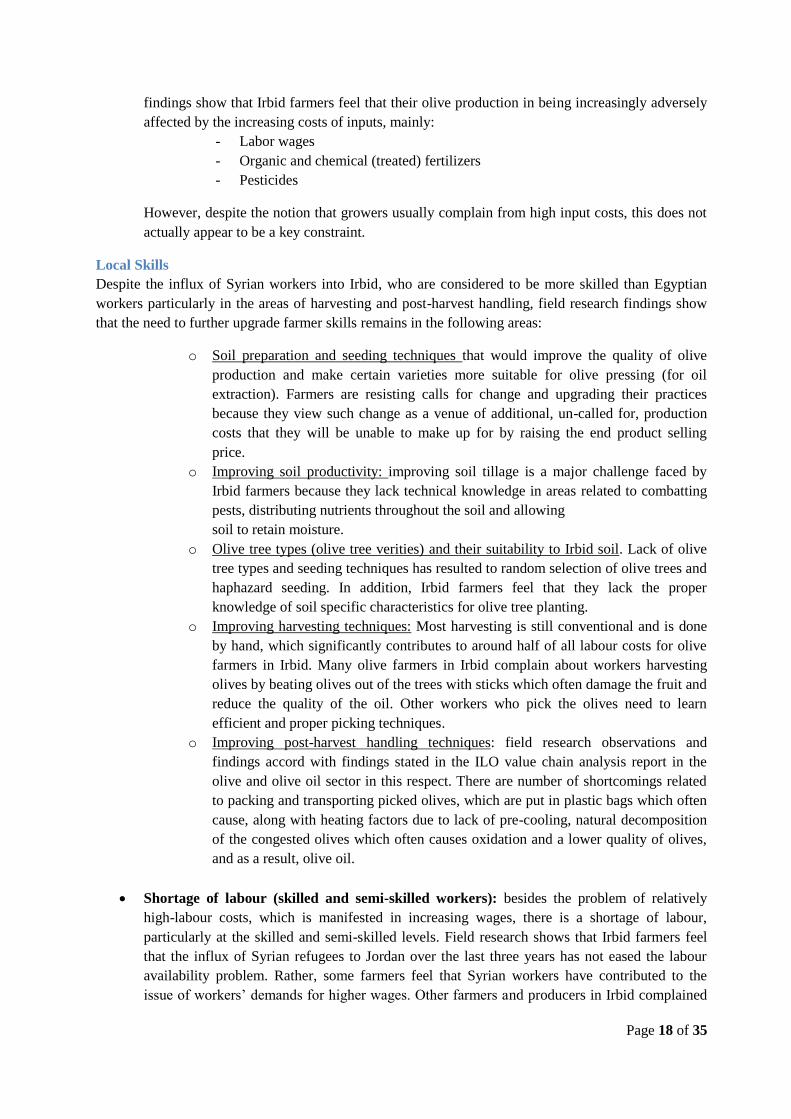
The table below shows the approximate olive oil production in Jordan by grade. As shown in the table
below, the majority of production is in the Ordinary (40%) and Virgin (35%) grades, whereas the
‘Extra’ grade only accounts for (15%) of Jordan’s olive oil production. There are vast opportunities in
shifting Jordan’s olive oil production more towards the ‘Extra’ virgin olive oil grade, which is
becoming increasingly in-demand in regional and international markets as shown in the ‘Demand’
section of this report.
Table 8: Olive Oil production in Jordan by Grade
Grades Share in Production (during 2000s)
Extra, up to 1° 15%
Virgin, 1°– 2° 35%
Ordinary, 2°– 3.3° 40%
Lampante, > 3.3° 10% Source: Ministry of Agriculture
Inputs and Raw Materials
Key research findings related to the first level of the value chain: input and sourcing are the following:
Scarcity of water resources and unpredictability of rainfall levels: scarcity of water
resources remains the biggest challenge, especially in light of the changing climatic conditions
which has caused increased unpredictability of rainfall levels in recent years. The problem is
aggravated by lack of adequate rainwater harvesting and storage techniques and facilities.
High input costs: field research findings show that all olive farmers and producers in Irbid
complain about the high input cost and how this is shrinking their profit margins. High costs
can be particularly seen in the cost of labour, organic fertilizers and pesticides: field research
Page 18 of 35
findings show that Irbid farmers feel that their olive production in being increasingly adversely
affected by the increasing costs of inputs, mainly:
- Labor wages
- Organic and chemical (treated) fertilizers
- Pesticides
However, despite the notion that growers usually complain from high input costs, this does not
actually appear to be a key constraint.
Local Skills
Despite the influx of Syrian workers into Irbid, who are considered to be more skilled than Egyptian
workers particularly in the areas of harvesting and post-harvest handling, field research findings show
that the need to further upgrade farmer skills remains in the following areas:
o Soil preparation and seeding techniques that would improve the quality of olive
production and make certain varieties more suitable for olive pressing (for oil
extraction). Farmers are resisting calls for change and upgrading their practices
because they view such change as a venue of additional, un-called for, production
costs that they will be unable to make up for by raising the end product selling
price.
o Improving soil productivity: improving soil tillage is a major challenge faced by
Irbid farmers because they lack technical knowledge in areas related to combatting
pests, distributing nutrients throughout the soil and allowing
soil to retain moisture.
o Olive tree types (olive tree verities) and their suitability to Irbid soil. Lack of olive
tree types and seeding techniques has resulted to random selection of olive trees and
haphazard seeding. In addition, Irbid farmers feel that they lack the proper
knowledge of soil specific characteristics for olive tree planting.
o Improving harvesting techniques: Most harvesting is still conventional and is done
by hand, which significantly contributes to around half of all labour costs for olive
farmers in Irbid. Many olive farmers in Irbid complain about workers harvesting
olives by beating olives out of the trees with sticks which often damage the fruit and
reduce the quality of the oil. Other workers who pick the olives need to learn
efficient and proper picking techniques.
o Improving post-harvest handling techniques: field research observations and
findings accord with findings stated in the ILO value chain analysis report in the
olive and olive oil sector in this respect. There are number of shortcomings related
to packing and transporting picked olives, which are put in plastic bags which often
cause, along with heating factors due to lack of pre-cooling, natural decomposition
of the congested olives which often causes oxidation and a lower quality of olives,
and as a result, olive oil.
Shortage of labour (skilled and semi-skilled workers): besides the problem of relatively
high-labour costs, which is manifested in increasing wages, there is a shortage of labour,
particularly at the skilled and semi-skilled levels. Field research shows that Irbid farmers feel
that the influx of Syrian refugees to Jordan over the last three years has not eased the labour
availability problem. Rather, some farmers feel that Syrian workers have contributed to the
issue of workers’ demands for higher wages. Other farmers and producers in Irbid complained
Page 19 of 35
about Syrian workers’ negligence and carelessness about proper cultivation and growing
practices. In addition, some farmers pointed out the impact of Syrian labour has shown only in
the area of harvesting and collecting the olive fruits, and that there has been no real positive
impact in terms of production planning, seeding or tree growing phases of production.
Other Production and Supply Issues
Field research based on interviews with a number of olive farmers in Irbid shows that there are
productivity and efficiency challenges that are impacting the profitability of those farmers’ olive
business. Some of the aspects of those challenges as reported by interviewed farmers and producers are:
Land use (acreage) can be improved and expanded further: production statistics show that
the olive cultivation sector has expanded and this is attributed to significant development in
recent years. However, local production in Irbid can be expanded further by utilizing rugged
land. Desk review of the ILO value chain assessment report of Irbid olive production points to
the opportunity of strengthening local capacity for rugged land use and reclamation of land
currently not used16
.
Conventional pruning and field care techniques: review of the ILO value chain assessment
report of Irbid olive production as well as field interviews and subject-matter experts’
observations, all point to the fact that currently practiced techniques of ploughing, pruning and
inoculation of olive trees are still conventional and need to be upgraded in order to improve the
yield rate.
Harvesting and pressing costs: this issue is shrinking producers’ profit margins in light of
competition among farmers and relatively low consumer price. The high costs of harvesting is
mainly attributed to high wages of skilled farmers and the lack of automated harvesting
technologies, whereas the high cost of pressing is attributed to the bargaining power of pressers
in light of the fragmentation of farmers and lack of effective farmer representation.
Desk research shows that Irbid olive production has been increasing in recent years. However, the
expansion of production not accompanied by investments for increasing productivity and organisation
of the value chain will perpetuate the problem of low yields (in some seasons) and exacerbate the
oscillation of production between years. From a marketing perspective, there are several challenges
which include the following:
Fragmentation of the sector is not enabling efficiency of small farms: preference of farmers
is for self-standing activity, with consequent scarcity of joint farmers’ initiatives, such as
producer groups or cooperatives. Without increased cooperation between farmers logistic of
harvesting and marketing will become increasingly difficult, and this will keep those small
farms from achieving a higher degree of efficiency.
Poor infrastructure and lack of irrigation and rainwater storage facilities, affecting the
yields and making the production vulnerable to weather conditions: There is a growing
need to upgrade irrigation techniques as well as rainwater harvesting and storage methods and
facilities in light of recent adverse climate conditions and scarcity of water resources. increased
temperature and decreased rainfall as seen in Jordan in recent years is negatively impacting
olive cultivation in Irbid, especially that the majority of trees are rain-fed, which makes farmers
vulnerable to these adverse conditions.
16 Source: ILO, Value Chain Analysis in the Olive and Oil Sector in Irbid, 2013
Page 20 of 35
Demand Analysis
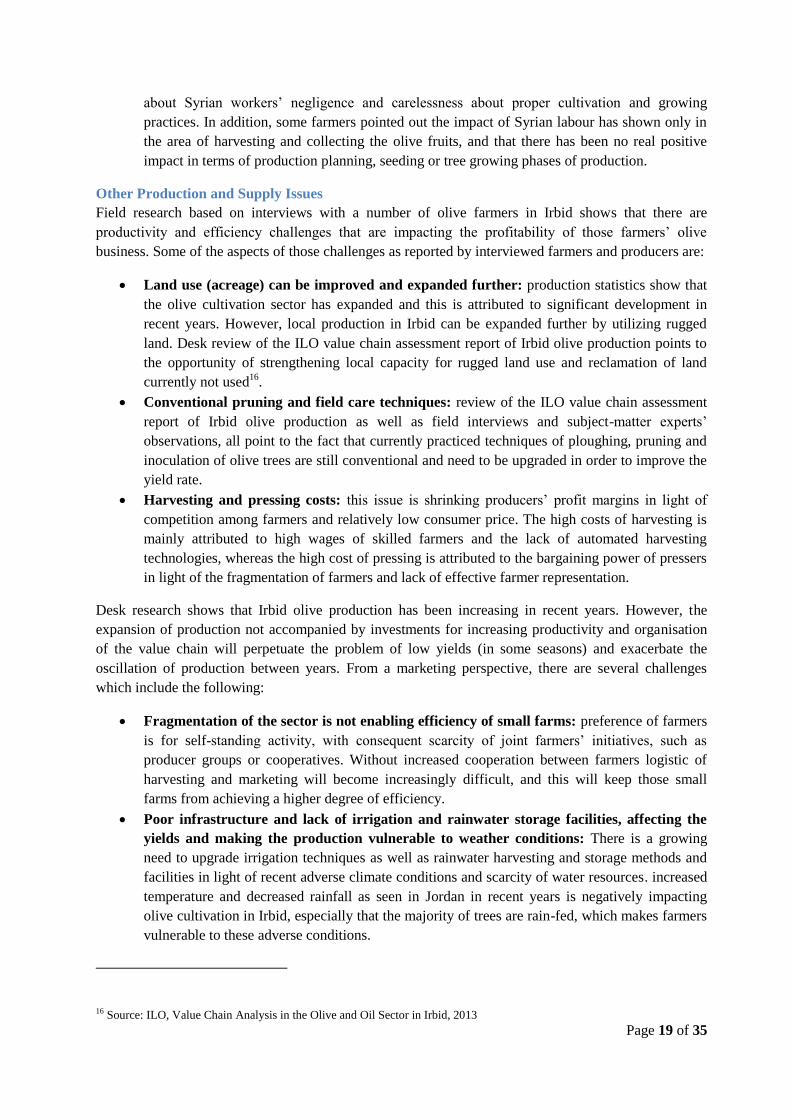
Domestic Consumption and International Trade
There is no statistical data available at official data sources on the actual size of domestic consumption
of table olives and olive oil in Jordan. However, based on the Consultant’s calculations of production,
imports and exports, a rough estimate of domestic consumption has been arrived at in order to provide
an indication of domestic demand. The following table shows the domestic consumption of table olives
(fresh and pickled) in Jordan compared to imports and exports:
Table 9: Imports, Exports and Estimated Domestic Consumption of Fresh Olives in Jordan (2007-2012)
Commodity: Table Olives
(Fresh and pickled olives) 2007 2008 2009 2010 2011 2012
Production (1000 Mt) 32.2 16.7 32.7 28.9 30.2 31.1
Domestic Consumption* (1000 Mt) 19.6 8.7 17.4 22.0 23.8 21.4
Consumption % of Production (%) 61% 52% 53% 76% 79% 69%
Imports (1000 Mt) 0.64 0.51 0.52 0.75 1.24 1.67
Exports (1000 Mt) 13.3 8.44 15.8 7.53 7.66 11.4
Exports % of Production (%) 41% 51% 48% 26% 25% 37% Source: Ministry of Agriculture based on results of Department of Statistics’ Olive Mills and Pressers Survey 2012
*Domestic consumption is based on consultant’s calculations.
The table above indicates that current production levels exceed domestic consumption levels of table
olives, which implies that Jordan is self-sufficient of table olives and that current production levels
exceed domestic demand. However, it is worth-mentioning that domestic consumption levels have
increased quite remarkably since 2009, and this has affected exported quantities which used to account
for almost half of production until 2009. Assuming the same rationale, the following table shows the
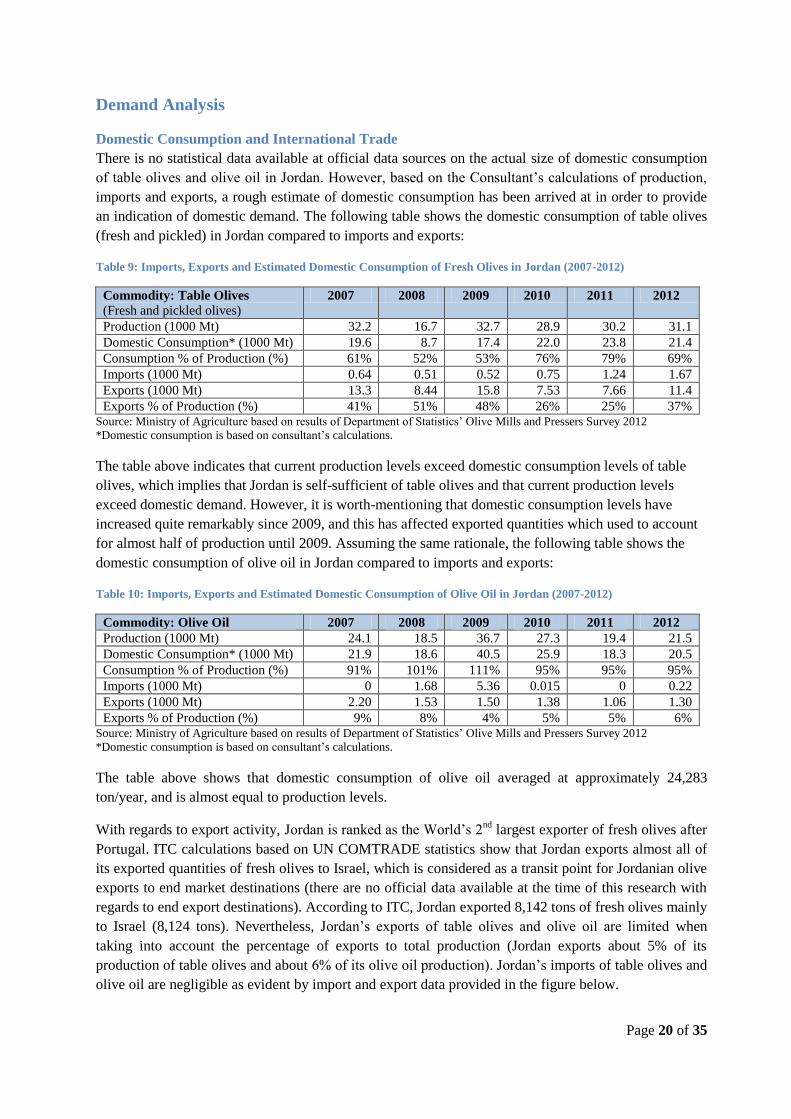
domestic consumption of olive oil in Jordan compared to imports and exports:
Table 10: Imports, Exports and Estimated Domestic Consumption of Olive Oil in Jordan (2007-2012)
Commodity: Olive Oil 2007 2008 2009 2010 2011 2012
Production (1000 Mt) 24.1 18.5 36.7 27.3 19.4 21.5
Domestic Consumption* (1000 Mt) 21.9 18.6 40.5 25.9 18.3 20.5
Consumption % of Production (%) 91% 101% 111% 95% 95% 95%
Imports (1000 Mt) 0 1.68 5.36 0.015 0 0.22
Exports (1000 Mt) 2.20 1.53 1.50 1.38 1.06 1.30
Exports % of Production (%) 9% 8% 4% 5% 5% 6% Source: Ministry of Agriculture based on results of Department of Statistics’ Olive Mills and Pressers Survey 2012
*Domestic consumption is based on consultant’s calculations.
The table above shows that domestic consumption of olive oil averaged at approximately 24,283
ton/year, and is almost equal to production levels.
With regards to export activity, Jordan is ranked as the World’s 2nd
largest exporter of fresh olives after
Portugal. ITC calculations based on UN COMTRADE statistics show that Jordan exports almost all of
its exported quantities of fresh olives to Israel, which is considered as a transit point for Jordanian olive
exports to end market destinations (there are no official data available at the time of this research with
regards to end export destinations). According to ITC, Jordan exported 8,142 tons of fresh olives mainly
to Israel (8,124 tons). Nevertheless, Jordan’s exports of table olives and olive oil are limited when
taking into account the percentage of exports to total production (Jordan exports about 5% of its
production of table olives and about 6% of its olive oil production). Jordan’s imports of table olives and
olive oil are negligible as evident by import and export data provided in the figure below.
Page 21 of 35
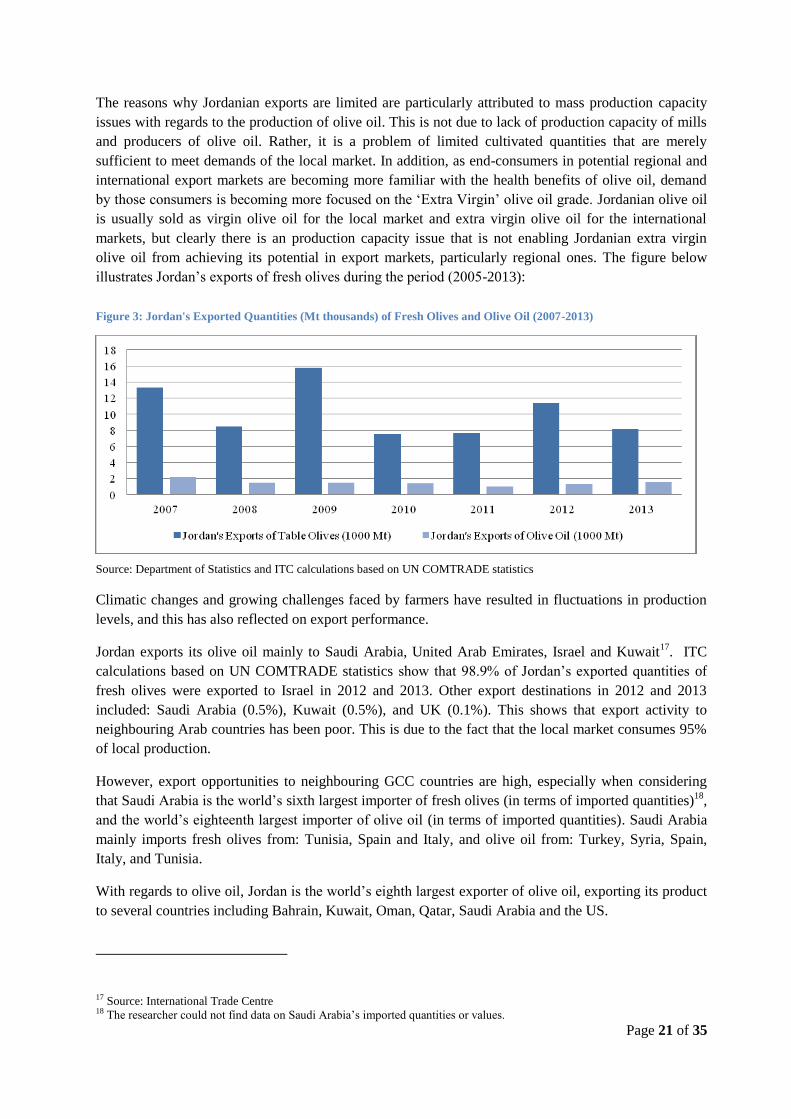
The reasons why Jordanian exports are limited are particularly attributed to mass production capacity
issues with regards to the production of olive oil. This is not due to lack of production capacity of mills
and producers of olive oil. Rather, it is a problem of limited cultivated quantities that are merely
sufficient to meet demands of the local market. In addition, as end-consumers in potential regional and
international export markets are becoming more familiar with the health benefits of olive oil, demand
by those consumers is becoming more focused on the ‘Extra Virgin’ olive oil grade. Jordanian olive oil
is usually sold as virgin olive oil for the local market and extra virgin olive oil for the international
markets, but clearly there is an production capacity issue that is not enabling Jordanian extra virgin
olive oil from achieving its potential in export markets, particularly regional ones. The figure below
illustrates Jordan’s exports of fresh olives during the period (2005-2013):
Source: Department of Statistics and ITC calculations based on UN COMTRADE statistics
Climatic changes and growing challenges faced by farmers have resulted in fluctuations in production
levels, and this has also reflected on export performance.
Jordan exports its olive oil mainly to Saudi Arabia, United Arab Emirates, Israel and Kuwait17
. ITC
calculations based on UN COMTRADE statistics show that 98.9% of Jordan’s exported quantities of
fresh olives were exported to Israel in 2012 and 2013. Other export destinations in 2012 and 2013
included: Saudi Arabia (0.5%), Kuwait (0.5%), and UK (0.1%). This shows that export activity to
neighbouring Arab countries has been poor. This is due to the fact that the local market consumes 95%
of local production.
However, export opportunities to neighbouring GCC countries are high, especially when considering
that Saudi Arabia is the world’s sixth largest importer of fresh olives (in terms of imported quantities)18
,
and the world’s eighteenth largest importer of olive oil (in terms of imported quantities). Saudi Arabia
mainly imports fresh olives from: Tunisia, Spain and Italy, and olive oil from: Turkey, Syria, Spain,
Italy, and Tunisia.
With regards to olive oil, Jordan is the world’s eighth largest exporter of olive oil, exporting its product
to several countries including Bahrain, Kuwait, Oman, Qatar, Saudi Arabia and the US.
17 Source: International Trade Centre 18 The researcher could not find data on Saudi Arabia’s imported quantities or values.
Figure 3: Jordan's Exported Quantities (Mt thousands) of Fresh Olives and Olive Oil (2007-2013)
Page 22 of 35
Consumer Trends and Preferences
Domestically, table olive and olive oil are essential ingredients of the local cuisine. Therefore, the
product is not considered price elastic, and consumers will continue to buy it with increasing inflation
and declining purchasing power having minimal effect on consumers’ buying decision.
Local consumers are mostly accustomed to “traditional” table olive and olive oil, which is a single
product, without specification of quality. In fact the average consumer has not a real knowledge of the
product.
Another major issue is the scarce trust of consumers in domestic industrial producers. This has resulted
in many domestic consumers purchase olive oil directly from known or trusted mills and producers.
Competitive Position of Irbid Olives
In the Domestic Market
Jordanian consumers prefer domestic production, and trade data show that Jordan imports of fresh
olives and olive oil are negligible compared to local production. For local customers, they always prefer
Jordanian olive oil when considered genuine. However, the low trust in industrial producers pushes
many of them either to buy olive oil directly from trusted farmers and mills, or to buy imported olive
oil, perceived as safer, if not tastier.
The general perception by Jordanian consumers that Irbid and Ajloun olives and olive oils are the best
olive items produced in Jordan. Therefore, Irbid olives are well regarded by local consumers.
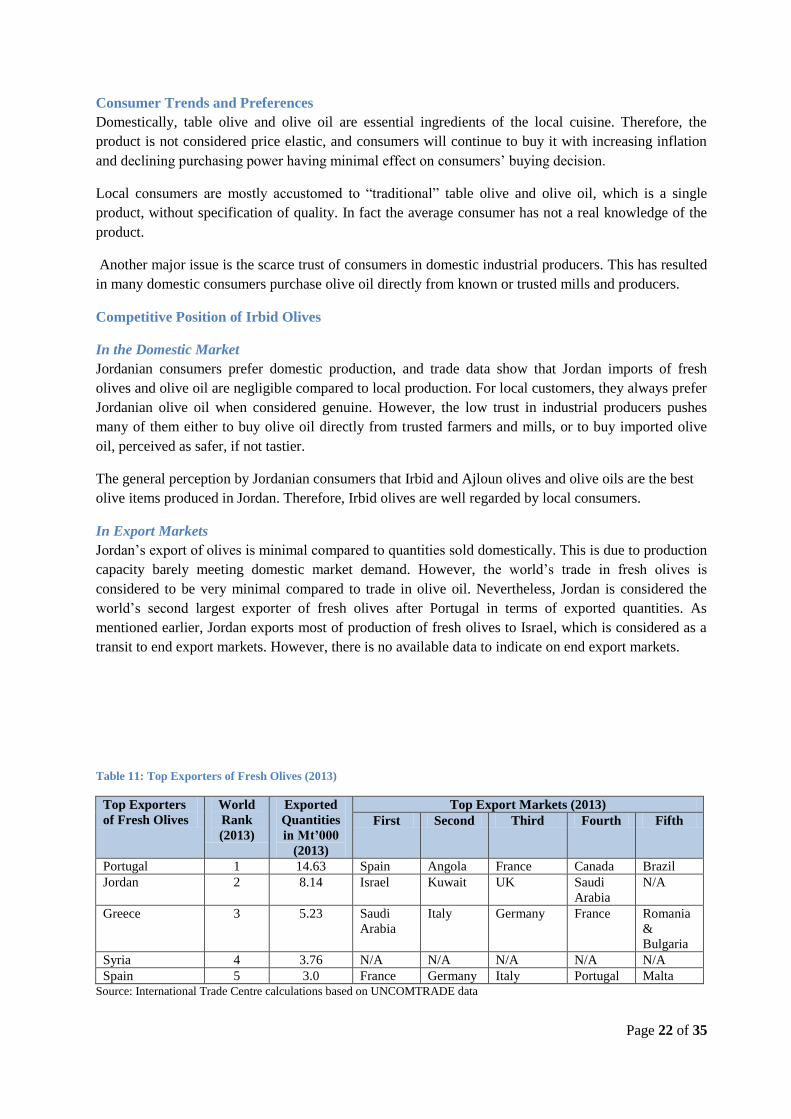
In Export Markets
Jordan’s export of olives is minimal compared to quantities sold domestically. This is due to production
capacity barely meeting domestic market demand. However, the world’s trade in fresh olives is
considered to be very minimal compared to trade in olive oil. Nevertheless, Jordan is considered the
world’s second largest exporter of fresh olives after Portugal in terms of exported quantities. As
mentioned earlier, Jordan exports most of production of fresh olives to Israel, which is considered as a
transit to end export markets. However, there is no available data to indicate on end export markets.
Table 11: Top Exporters of Fresh Olives (2013)
Top Exporters
of Fresh Olives
World
Rank
(2013)
Exported
Quantities
in Mt’000
(2013)
Top Export Markets (2013)
First Second Third Fourth Fifth
Portugal 1 14.63 Spain Angola France Canada Brazil
Jordan 2 8.14 Israel Kuwait UK Saudi
Arabia
N/A
Greece 3 5.23 Saudi
Arabia
Italy Germany France Romania
&
Bulgaria
Syria 4 3.76 N/A N/A N/A N/A N/A
Spain 5 3.0 France Germany Italy Portugal Malta Source: International Trade Centre calculations based on UNCOMTRADE data
Page 23 of 35
The table above lists the top five exporting countries of fresh olives in 2013 according to ITC estimates
based on UNCOMTRADE data. It is worth noting that Greece, which ranks below Jordan with exported
quantities accounting for only 64% of quantities exported by Jordan in 2013, has Saudi Arabia as its
main export destination.
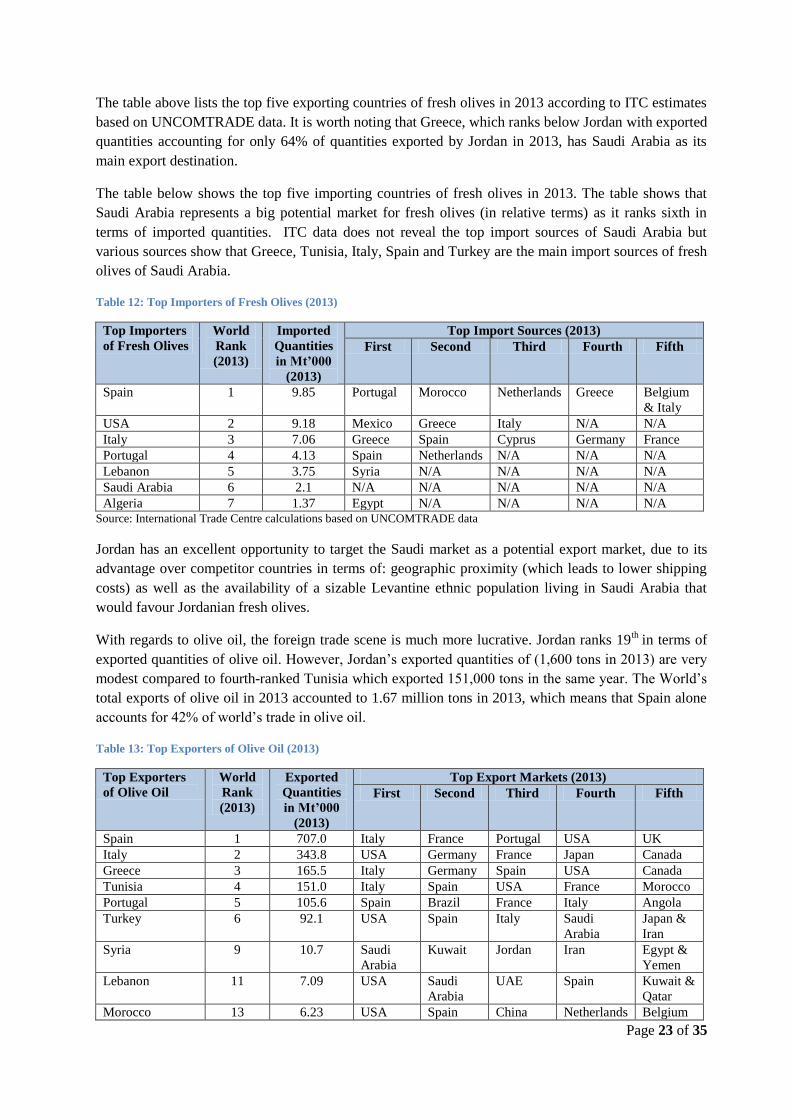
The table below shows the top five importing countries of fresh olives in 2013. The table shows that
Saudi Arabia represents a big potential market for fresh olives (in relative terms) as it ranks sixth in
terms of imported quantities. ITC data does not reveal the top import sources of Saudi Arabia but
various sources show that Greece, Tunisia, Italy, Spain and Turkey are the main import sources of fresh
olives of Saudi Arabia.
Table 12: Top Importers of Fresh Olives (2013)
Top Importers
of Fresh Olives
World
Rank
(2013)
Imported
Quantities
in Mt’000
(2013)
Top Import Sources (2013)
First Second Third Fourth Fifth
Spain 1 9.85 Portugal Morocco Netherlands Greece Belgium
& Italy
USA 2 9.18 Mexico Greece Italy N/A N/A
Italy 3 7.06 Greece Spain Cyprus Germany France
Portugal 4 4.13 Spain Netherlands N/A N/A N/A
Lebanon 5 3.75 Syria N/A N/A N/A N/A
Saudi Arabia 6 2.1 N/A N/A N/A N/A N/A
Algeria 7 1.37 Egypt N/A N/A N/A N/A Source: International Trade Centre calculations based on UNCOMTRADE data
Jordan has an excellent opportunity to target the Saudi market as a potential export market, due to its
advantage over competitor countries in terms of: geographic proximity (which leads to lower shipping
costs) as well as the availability of a sizable Levantine ethnic population living in Saudi Arabia that
would favour Jordanian fresh olives.
With regards to olive oil, the foreign trade scene is much more lucrative. Jordan ranks 19th
in terms of
exported quantities of olive oil. However, Jordan’s exported quantities of (1,600 tons in 2013) are very
modest compared to fourth-ranked Tunisia which exported 151,000 tons in the same year. The World’s
total exports of olive oil in 2013 accounted to 1.67 million tons in 2013, which means that Spain alone
accounts for 42% of world’s trade in olive oil.
Table 13: Top Exporters of Olive Oil (2013)
Top Exporters
of Olive Oil
World
Rank
(2013)
Exported
Quantities
in Mt’000
(2013)
Top Export Markets (2013)
First Second Third Fourth Fifth
Spain 1 707.0 Italy France Portugal USA UK
Italy 2 343.8 USA Germany France Japan Canada
Greece 3 165.5 Italy Germany Spain USA Canada
Tunisia 4 151.0 Italy Spain USA France Morocco
Portugal 5 105.6 Spain Brazil France Italy Angola
Turkey 6 92.1 USA Spain Italy Saudi
Arabia
Japan &
Iran
Syria 9 10.7 Saudi
Arabia
Kuwait Jordan Iran Egypt &
Yemen
Lebanon 11 7.09 USA Saudi
Arabia
UAE Spain Kuwait &
Qatar
Morocco 13 6.23 USA Spain China Netherlands Belgium
Page 24 of 35
& Canada
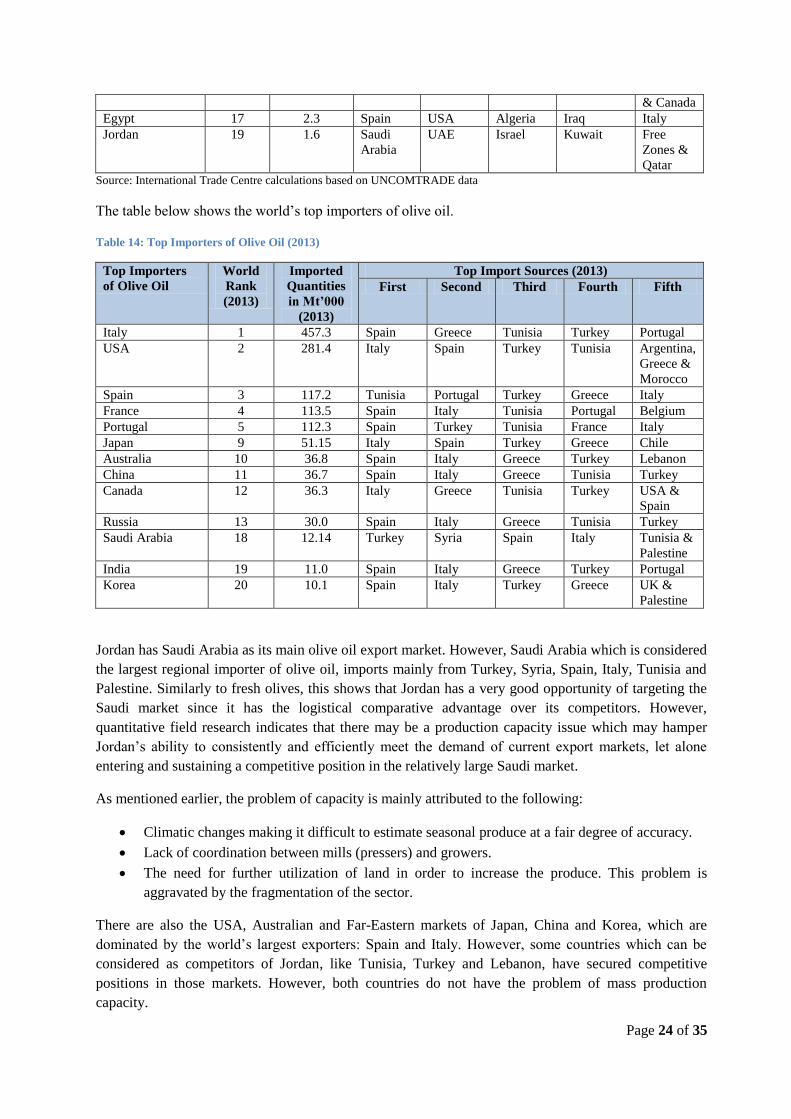
Egypt 17 2.3 Spain USA Algeria Iraq Italy
Jordan 19 1.6 Saudi
Arabia
UAE Israel Kuwait Free
Zones &
Qatar Source: International Trade Centre calculations based on UNCOMTRADE data
The table below shows the world’s top importers of olive oil.
Table 14: Top Importers of Olive Oil (2013)
Top Importers
of Olive Oil
World
Rank
(2013)
Imported
Quantities
in Mt’000
(2013)
Top Import Sources (2013)
First Second Third Fourth Fifth
Italy 1 457.3 Spain Greece Tunisia Turkey Portugal
USA 2 281.4 Italy Spain Turkey Tunisia Argentina,
Greece &
Morocco
Spain 3 117.2 Tunisia Portugal Turkey Greece Italy
France 4 113.5 Spain Italy Tunisia Portugal Belgium
Portugal 5 112.3 Spain Turkey Tunisia France Italy
Japan 9 51.15 Italy Spain Turkey Greece Chile
Australia 10 36.8 Spain Italy Greece Turkey Lebanon
China 11 36.7 Spain Italy Greece Tunisia Turkey
Canada 12 36.3 Italy Greece Tunisia Turkey USA &
Spain
Russia 13 30.0 Spain Italy Greece Tunisia Turkey
Saudi Arabia 18 12.14 Turkey Syria Spain Italy Tunisia &
Palestine
India 19 11.0 Spain Italy Greece Turkey Portugal
Korea 20 10.1 Spain Italy Turkey Greece UK &
Palestine
Jordan has Saudi Arabia as its main olive oil export market. However, Saudi Arabia which is considered
the largest regional importer of olive oil, imports mainly from Turkey, Syria, Spain, Italy, Tunisia and
Palestine. Similarly to fresh olives, this shows that Jordan has a very good opportunity of targeting the
Saudi market since it has the logistical comparative advantage over its competitors. However,
quantitative field research indicates that there may be a production capacity issue which may hamper
Jordan’s ability to consistently and efficiently meet the demand of current export markets, let alone
entering and sustaining a competitive position in the relatively large Saudi market.
As mentioned earlier, the problem of capacity is mainly attributed to the following:
Climatic changes making it difficult to estimate seasonal produce at a fair degree of accuracy.
Lack of coordination between mills (pressers) and growers.
The need for further utilization of land in order to increase the produce. This problem is
aggravated by the fragmentation of the sector.
There are also the USA, Australian and Far-Eastern markets of Japan, China and Korea, which are
dominated by the world’s largest exporters: Spain and Italy. However, some countries which can be
considered as competitors of Jordan, like Tunisia, Turkey and Lebanon, have secured competitive
positions in those markets. However, both countries do not have the problem of mass production
capacity.
Page 25 of 35
In light of relatively limited production capacity, Jordan would benefit from focusing on increasing its
export in one or two priority markets in the short-to-medium terms, particularly the Saudi market. On
the other hand, Jordan is expected to benefit significantly from branding its products in a way that
would provide a differentiation factor (i.e. claiming the category of: Holy land olive oil).
Assessment of Marketing Practices
Product
Product Varieties and By-Products
Irbid mainly produces the Nabali olive variety, which is suitable for oil extraction. However, there is a
general lack of awareness by farmers about the product variety difference and characteristics of
different olive trees. This has resulted in olive trees being planted haphazardly in Irbid without carefully
examining tree suitability to the specific characteristics of the soils. In addition, this lack of awareness
of specific olive varieties has not helped farmers establish any competitive edge or meet market
demand, whether locally or internationally, for specific olive varieties.
In addition, there is a lack of any real investment initiatives or entrepreneurial activities to utilize olive
stones (pits) or other olive by-products such as home-made olive oil soap and cosmetics as well as
pickled olive products.
In terms of by products, there is a market opportunity in introducing a number of household productions
of the following by-products: Olive Oil Soap and Olive Pickles
Quality
Irbid olives particularly the Nabali varieties which are suitable for olive oil extraction and are capable of
producing extra virgin olive oil. However, there are issues that are impacting the Irbid olive quality and
there is a considerable room for improvement. Olive growing in Irbid is generally carried out in a
traditional way with minimal use of chemical fertilizers and pesticides; this is due to lack of farmers’
access to organic or treated fertilizers as well as the high costs of fertilizing, as well as general lack of
technical knowledge in the area of pest management. As a result, production costs as well as
productivity are relatively low, and pests, especially the olive fly, are rather common. By comparison,
in the irrigated eastern areas of Jordan, farms are larger, and production costs and productivity are
higher since fertilizers are widely used and other agricultural practices like ploughing, weeding and
trimming are more common.
In addition, the Irbid olive sector, like the overall olive sector of Jordan, has not established
geographical indications or organic farming. Therefore, Irbid olives remain unidentified in terms of
geographic indication and this also goes for olive oil, which restricts Irbid olives and olive oil from
entering, let alone competing in, important ‘sophisticated’ export markets, such as the EU, where the
consumer trends are increasingly heading towards organic farming. In the EU, for example, there is the
EU certification system, which highlights the product attributes of imported olive oil and geographic
indication. For this reason, Irbid olives and olive oil faces market access issues and therefore cannot
compete with the Spanish, Italian or Greek olives in the EU market.
Another issue that often hampers quality is long waiting lines at olive mills (pressers). During the
pressing season, olive farmers in Irbid, as well as many end consumers who grow their own olive trees,
take their olives to pressers and this creates queues due to the limited number of pressers available,
which causes long waiting time at the olive oil mills. Delays in pressing the olive causes increased
acidity, especially in the first two days.
Page 26 of 35
With regards to olive oil, every so often there are problems related to post-harvest handling techniques
as well as the timing of transporting fresh olives to pressing mills as mentioned earlier in this report.
This contributes to increasing the acidity of olive oil produced.
Branding
Irbid olive production lacks any effective or systematic branding that would help consumers, whether
local or international, recognize the Irbid olives. This is mainly due to the fact the sector is fragmented
into small-scaled farmers who lack effective marketing organization, representation and coordination.
There have been no real national initiatives to launch an effective, unified branding for Irbid olives.
Packaging and Labelling
Packaging and labelling is almost the shortcoming that Irbid olives and olive oil has in terms of
branding.
Price
Prices of fresh olives and olive oil in Irbid, although subject to supply and demand, are largely
controlled by the bargaining prowess and influence of wholesale traders in light of the fragmentation of
farmers and lack of effective farmer representation.
Since most of the Irbid olive production is within the Nabali variety, the prices of available olives and
olive oil categories are fairly similar. However, there is no clear or unified pricing strategy that is
adopted by farmers and producers, which are considered to be a weak link within the olive value chain
due to their fragmentation and lack of proper representation. The way the farmers’ olive prices are set is
dependent on the bargaining power of wholesale traders.
In addition, preference of farmers for self-standing activity, with consequent scarcity of joint farmers’
initiatives, such as producer groups or cooperatives. Without increased cooperation between farmers
logistic of harvesting and marketing will become increasingly difficult.
Promotion
There are hardly any promotional efforts done by olive producers in Irbid. This is mainly due to lack of
marketing and management know-how – the farming base is made by subsistence farming and are
typically not perceived as businesses but as mere agriculture production units. The problem is
aggravated by farmer/grower specialized marketing body.
Additional promotion related challenges are:
There is a need for more effective participation in relevant local, regional and international
exhibitions: Farmers have expressed strong interest in identifying the most important trade fairs
and exhibitions, whether at the local, regional or global spheres, and they demonstrated their
desire to participate more effectively in these exhibitions under the guidance and auspices of the
association.
Lack of national olive festival in Jordan and there have been no initiatives to organize a special
event for Irbid olives and olive oil.
No apparent or effective links established with the local and regional media for the purpose of
promoting Irbid olives and olive oil.
Distribution Channels
Olives are usually distributed to wholesale markets. There are three main wholesale markets which are
located in: Amman, Irbid and Zarqa. There is no reliable data on the distributed quantities and the share
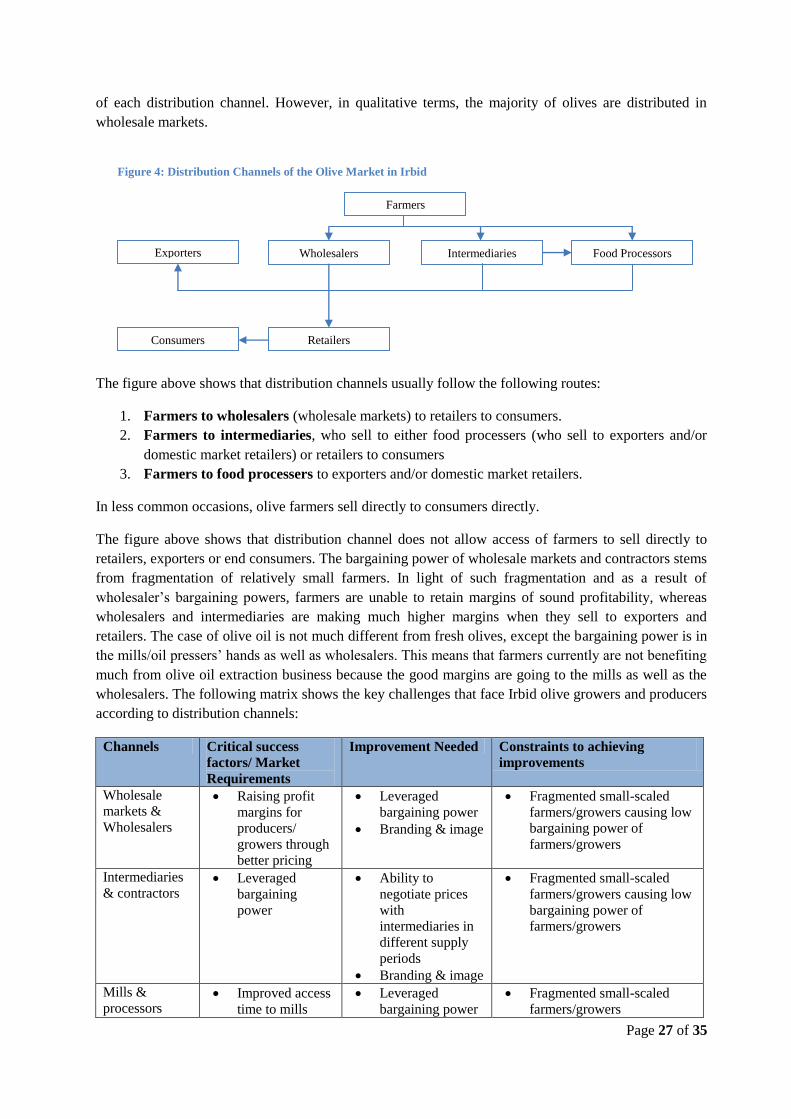
Page 27 of 35
of each distribution channel. However, in qualitative terms, the majority of olives are distributed in
wholesale markets.
The figure above shows that distribution channels usually follow the following routes:
1. Farmers to wholesalers (wholesale markets) to retailers to consumers.
2. Farmers to intermediaries, who sell to either food processers (who sell to exporters and/or
domestic market retailers) or retailers to consumers
3. Farmers to food processers to exporters and/or domestic market retailers.
In less common occasions, olive farmers sell directly to consumers directly.
The figure above shows that distribution channel does not allow access of farmers to sell directly to
retailers, exporters or end consumers. The bargaining power of wholesale markets and contractors stems
from fragmentation of relatively small farmers. In light of such fragmentation and as a result of
wholesaler’s bargaining powers, farmers are unable to retain margins of sound profitability, whereas
wholesalers and intermediaries are making much higher margins when they sell to exporters and
retailers. The case of olive oil is not much different from fresh olives, except the bargaining power is in
the mills/oil pressers’ hands as well as wholesalers. This means that farmers currently are not benefiting
much from olive oil extraction business because the good margins are going to the mills as well as the
wholesalers. The following matrix shows the key challenges that face Irbid olive growers and producers
according to distribution channels:
Channels Critical success
factors/ Market
Requirements
Improvement Needed Constraints to achieving
improvements
Wholesale
markets &
Wholesalers
Raising profit
margins for
producers/
growers through
better pricing
Leveraged
bargaining power
Branding & image
Fragmented small-scaled
farmers/growers causing low
bargaining power of
farmers/growers
Intermediaries
& contractors Leveraged
bargaining
power
Ability to
negotiate prices
with
intermediaries in
different supply
periods
Branding & image
Fragmented small-scaled
farmers/growers causing low
bargaining power of
farmers/growers
Mills &
processors Improved access
time to mills
Leveraged
bargaining power
Fragmented small-scaled
farmers/growers
Farmers
Wholesalers Intermediaries
Food Processors Exporters
Retailers Consumers
Figure 4: Distribution Channels of the Olive Market in Irbid
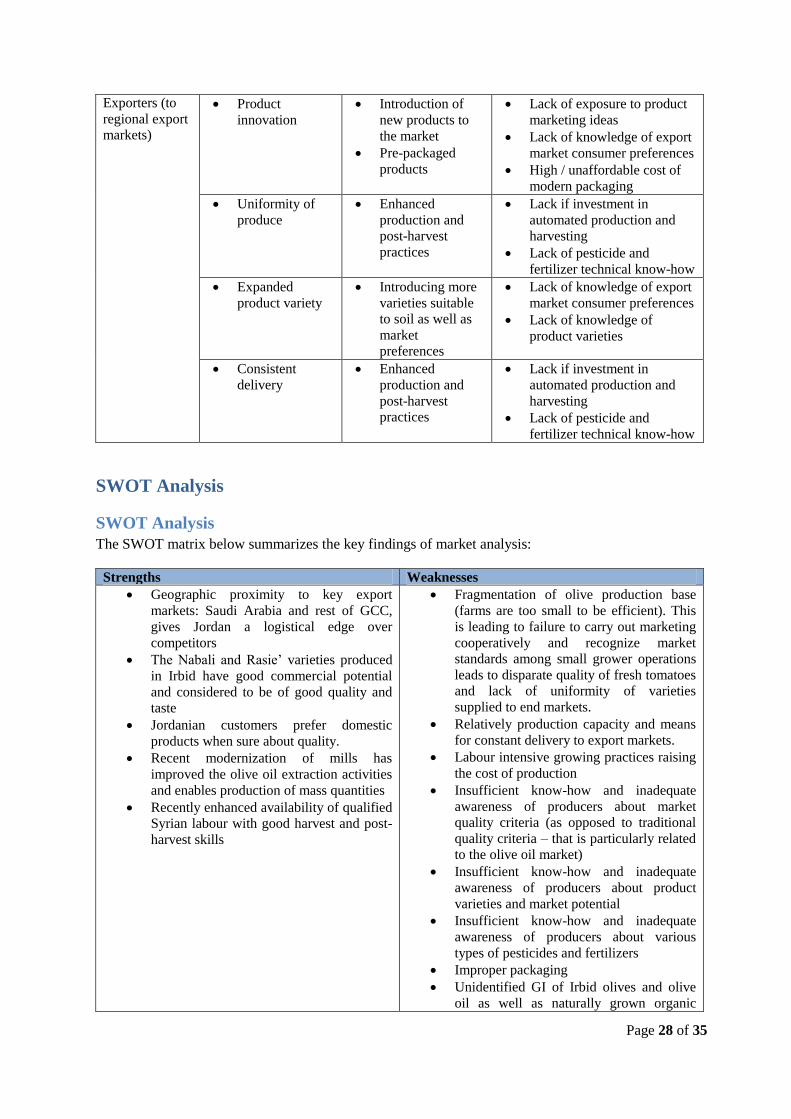
Page 28 of 35
Exporters (to
regional export
markets)
Product
innovation
Introduction of
new products to
the market
Pre-packaged
products
Lack of exposure to product
marketing ideas
Lack of knowledge of export
market consumer preferences
High / unaffordable cost of
modern packaging
Uniformity of
produce
Enhanced
production and
post-harvest
practices
Lack if investment in
automated production and
harvesting
Lack of pesticide and
fertilizer technical know-how
Expanded
product variety
Introducing more
varieties suitable
to soil as well as
market
preferences
Lack of knowledge of export
market consumer preferences
Lack of knowledge of
product varieties
Consistent
delivery
Enhanced
production and
post-harvest
practices
Lack if investment in
automated production and
harvesting
Lack of pesticide and
fertilizer technical know-how
SWOT Analysis
SWOT Analysis
The SWOT matrix below summarizes the key findings of market analysis:
Strengths Weaknesses
Geographic proximity to key export
markets: Saudi Arabia and rest of GCC,
gives Jordan a logistical edge over
competitors
The Nabali and Rasie’ varieties produced
in Irbid have good commercial potential
and considered to be of good quality and
taste
Jordanian customers prefer domestic
products when sure about quality.
Recent modernization of mills has
improved the olive oil extraction activities
and enables production of mass quantities
Recently enhanced availability of qualified
Syrian labour with good harvest and post-
harvest skills
Fragmentation of olive production base
(farms are too small to be efficient). This
is leading to failure to carry out marketing
cooperatively and recognize market
standards among small grower operations
leads to disparate quality of fresh tomatoes
and lack of uniformity of varieties
supplied to end markets.
Relatively production capacity and means
for constant delivery to export markets.
Labour intensive growing practices raising
the cost of production
Insufficient know-how and inadequate
awareness of producers about market
quality criteria (as opposed to traditional
quality criteria – that is particularly related
to the olive oil market)
Insufficient know-how and inadequate
awareness of producers about product
varieties and market potential
Insufficient know-how and inadequate
awareness of producers about various
types of pesticides and fertilizers
Improper packaging
Unidentified GI of Irbid olives and olive
oil as well as naturally grown organic
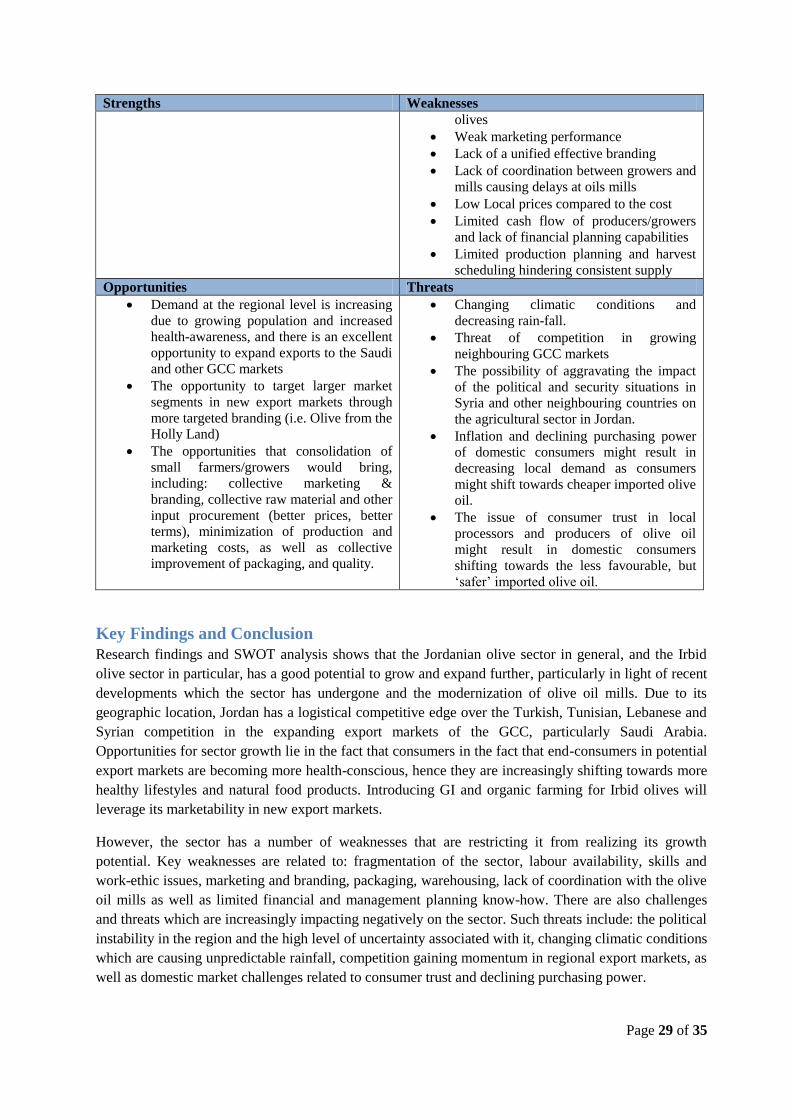
Page 29 of 35
Strengths Weaknesses
olives
Weak marketing performance
Lack of a unified effective branding
Lack of coordination between growers and
mills causing delays at oils mills
Low Local prices compared to the cost
Limited cash flow of producers/growers
and lack of financial planning capabilities
Limited production planning and harvest
scheduling hindering consistent supply
Opportunities Threats
Demand at the regional level is increasing
due to growing population and increased
health-awareness, and there is an excellent
opportunity to expand exports to the Saudi
and other GCC markets
The opportunity to target larger market
segments in new export markets through
more targeted branding (i.e. Olive from the
Holly Land)
The opportunities that consolidation of
small farmers/growers would bring,
including: collective marketing &
branding, collective raw material and other
input procurement (better prices, better
terms), minimization of production and
marketing costs, as well as collective
improvement of packaging, and quality.
Changing climatic conditions and
decreasing rain-fall.
Threat of competition in growing
neighbouring GCC markets
The possibility of aggravating the impact
of the political and security situations in
Syria and other neighbouring countries on
the agricultural sector in Jordan.
Inflation and declining purchasing power
of domestic consumers might result in
decreasing local demand as consumers
might shift towards cheaper imported olive
oil.
The issue of consumer trust in local
processors and producers of olive oil
might result in domestic consumers
shifting towards the less favourable, but
‘safer’ imported olive oil.
Key Findings and Conclusion
Research findings and SWOT analysis shows that the Jordanian olive sector in general, and the Irbid
olive sector in particular, has a good potential to grow and expand further, particularly in light of recent
developments which the sector has undergone and the modernization of olive oil mills. Due to its
geographic location, Jordan has a logistical competitive edge over the Turkish, Tunisian, Lebanese and
Syrian competition in the expanding export markets of the GCC, particularly Saudi Arabia.
Opportunities for sector growth lie in the fact that consumers in the fact that end-consumers in potential
export markets are becoming more health-conscious, hence they are increasingly shifting towards more
healthy lifestyles and natural food products. Introducing GI and organic farming for Irbid olives will
leverage its marketability in new export markets.
However, the sector has a number of weaknesses that are restricting it from realizing its growth
potential. Key weaknesses are related to: fragmentation of the sector, labour availability, skills and
work-ethic issues, marketing and branding, packaging, warehousing, lack of coordination with the olive
oil mills as well as limited financial and management planning know-how. There are also challenges
and threats which are increasingly impacting negatively on the sector. Such threats include: the political
instability in the region and the high level of uncertainty associated with it, changing climatic conditions
which are causing unpredictable rainfall, competition gaining momentum in regional export markets, as
well as domestic market challenges related to consumer trust and declining purchasing power.
Page 30 of 35
In order to enhance the sector’s chances of achieving and sustaining growth, the following TWOS
Matrix (which is a variant of the SWOT Analysis) provides recommendations on how the sector can:
utilize its strengths to capitalize on opportunities (SO), utilize strengths to avoid current and potential
threats (ST), overcome current weaknesses by exploiting opportunities (WO), and; lessen the impact of
weaknesses and avoid current and potential threats (WT).
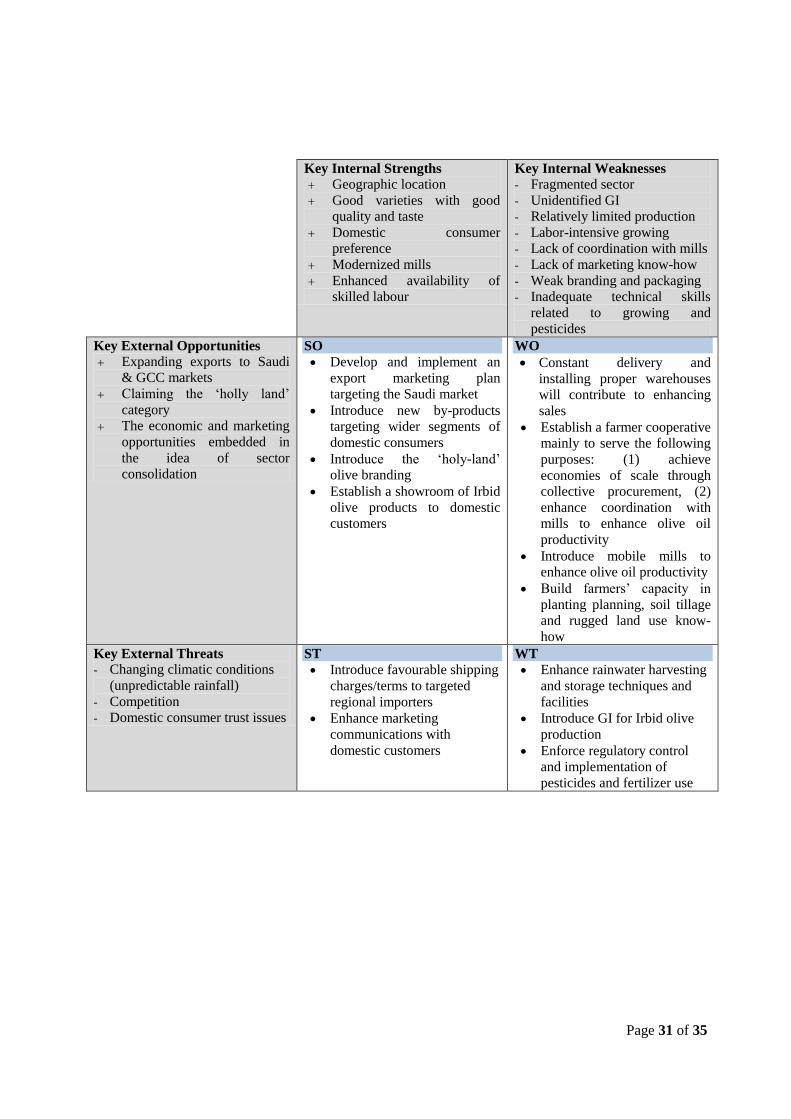
Page 31 of 35
Key Internal Strengths
Geographic location
Good varieties with good
quality and taste
Domestic consumer
preference
Modernized mills
Enhanced availability of
skilled labour
Key Internal Weaknesses
- Fragmented sector
- Unidentified GI
- Relatively limited production
- Labor-intensive growing
- Lack of coordination with mills
- Lack of marketing know-how
- Weak branding and packaging
- Inadequate technical skills
related to growing and
pesticides
Key External Opportunities
Expanding exports to Saudi
& GCC markets
Claiming the ‘holly land’
category
The economic and marketing
opportunities embedded in
the idea of sector
consolidation
SO
Develop and implement an
export marketing plan
targeting the Saudi market
Introduce new by-products
targeting wider segments of
domestic consumers
Introduce the ‘holy-land’
olive branding
Establish a showroom of Irbid
olive products to domestic
customers
WO
Constant delivery and
installing proper warehouses
will contribute to enhancing
sales
Establish a farmer cooperative
mainly to serve the following
purposes: (1) achieve
economies of scale through
collective procurement, (2)
enhance coordination with
mills to enhance olive oil
productivity
Introduce mobile mills to
enhance olive oil productivity
Build farmers’ capacity in
planting planning, soil tillage
and rugged land use know-
how
Key External Threats - Changing climatic conditions
(unpredictable rainfall)
- Competition
- Domestic consumer trust issues
ST
Introduce favourable shipping
charges/terms to targeted
regional importers
Enhance marketing
communications with
domestic customers
WT
Enhance rainwater harvesting
and storage techniques and
facilities
Introduce GI for Irbid olive
production
Enforce regulatory control
and implementation of
pesticides and fertilizer use
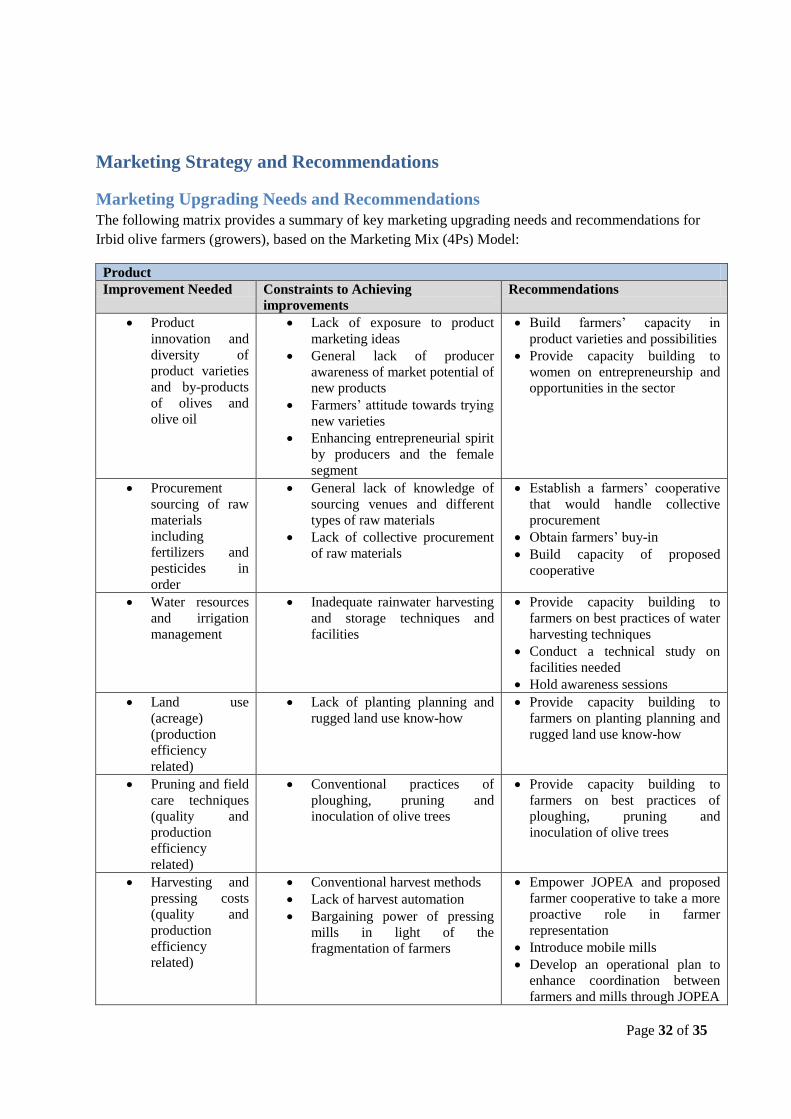
Page 32 of 35
Marketing Strategy and Recommendations
Marketing Upgrading Needs and Recommendations
The following matrix provides a summary of key marketing upgrading needs and recommendations for
Irbid olive farmers (growers), based on the Marketing Mix (4Ps) Model:
Product
Improvement Needed Constraints to Achieving
improvements
Recommendations
Product
innovation and
diversity of
product varieties
and by-products
of olives and
olive oil
Lack of exposure to product
marketing ideas
General lack of producer
awareness of market potential of
new products
Farmers’ attitude towards trying
new varieties
Enhancing entrepreneurial spirit
by producers and the female
segment
Build farmers’ capacity in
product varieties and possibilities
Provide capacity building to
women on entrepreneurship and
opportunities in the sector
Procurement
sourcing of raw
materials
including
fertilizers and
pesticides in
order
General lack of knowledge of
sourcing venues and different
types of raw materials
Lack of collective procurement
of raw materials
Establish a farmers’ cooperative
that would handle collective
procurement
Obtain farmers’ buy-in
Build capacity of proposed
cooperative
Water resources
and irrigation
management
Inadequate rainwater harvesting
and storage techniques and
facilities
Provide capacity building to
farmers on best practices of water
harvesting techniques
Conduct a technical study on
facilities needed
Hold awareness sessions
Land use
(acreage)
(production
efficiency
related)
Lack of planting planning and
rugged land use know-how
Provide capacity building to
farmers on planting planning and
rugged land use know-how
Pruning and field
care techniques
(quality and
production
efficiency
related)
Conventional practices of
ploughing, pruning and
inoculation of olive trees
Provide capacity building to
farmers on best practices of
ploughing, pruning and
inoculation of olive trees
Harvesting and
pressing costs
(quality and
production
efficiency
related)
Conventional harvest methods
Lack of harvest automation
Bargaining power of pressing
mills in light of the
fragmentation of farmers
Empower JOPEA and proposed
farmer cooperative to take a more
proactive role in farmer
representation
Introduce mobile mills
Develop an operational plan to
enhance coordination between
farmers and mills through JOPEA
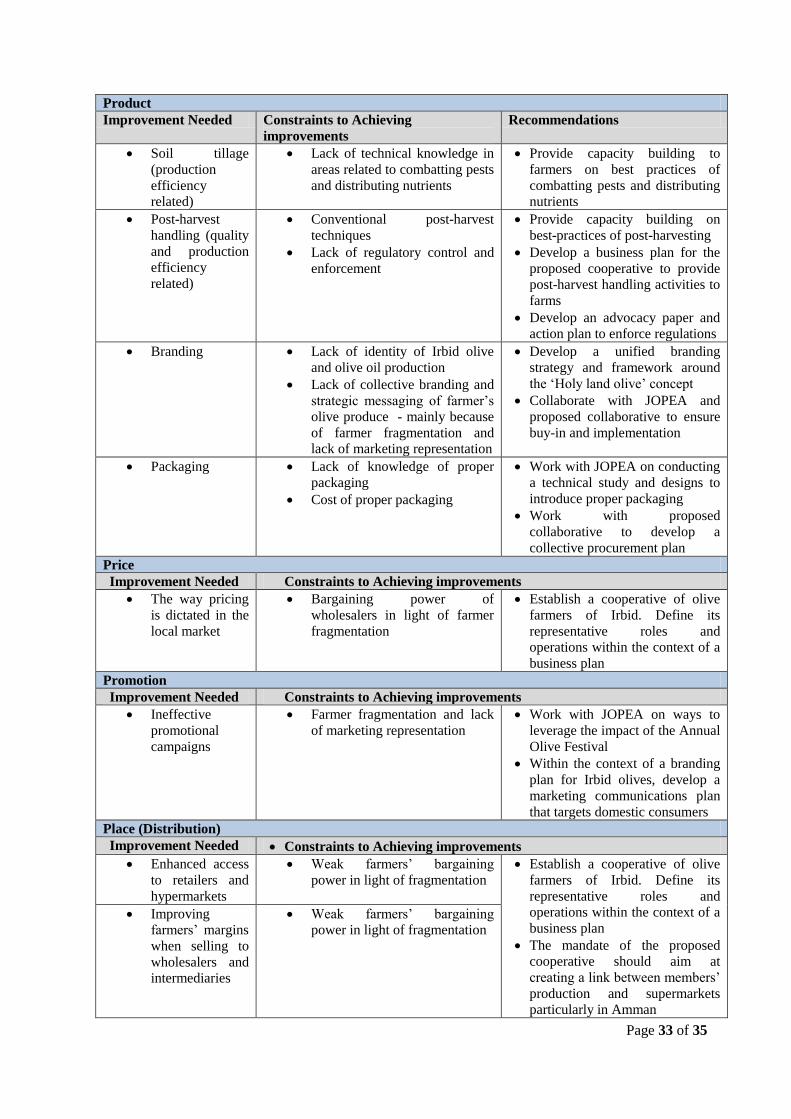
Page 33 of 35
Product
Improvement Needed Constraints to Achieving
improvements
Recommendations
Soil tillage
(production
efficiency
related)
Lack of technical knowledge in
areas related to combatting pests
and distributing nutrients
Provide capacity building to
farmers on best practices of
combatting pests and distributing
nutrients
Post-harvest
handling (quality
and production
efficiency
related)
Conventional post-harvest
techniques
Lack of regulatory control and
enforcement
Provide capacity building on
best-practices of post-harvesting
Develop a business plan for the
proposed cooperative to provide
post-harvest handling activities to
farms
Develop an advocacy paper and
action plan to enforce regulations
Branding Lack of identity of Irbid olive
and olive oil production
Lack of collective branding and
strategic messaging of farmer’s
olive produce - mainly because
of farmer fragmentation and
lack of marketing representation
Develop a unified branding
strategy and framework around
the ‘Holy land olive’ concept
Collaborate with JOPEA and
proposed collaborative to ensure
buy-in and implementation
Packaging Lack of knowledge of proper
packaging
Cost of proper packaging
Work with JOPEA on conducting
a technical study and designs to
introduce proper packaging
Work with proposed
collaborative to develop a
collective procurement plan
Price
Improvement Needed Constraints to Achieving improvements
The way pricing
is dictated in the
local market
Bargaining power of
wholesalers in light of farmer
fragmentation
Establish a cooperative of olive
farmers of Irbid. Define its
representative roles and
operations within the context of a
business plan
Promotion
Improvement Needed Constraints to Achieving improvements
Ineffective
promotional
campaigns
Farmer fragmentation and lack
of marketing representation
Work with JOPEA on ways to
leverage the impact of the Annual
Olive Festival
Within the context of a branding
plan for Irbid olives, develop a
marketing communications plan
that targets domestic consumers
Place (Distribution)
Improvement Needed Constraints to Achieving improvements
Enhanced access
to retailers and
hypermarkets
Weak farmers’ bargaining
power in light of fragmentation
Establish a cooperative of olive
farmers of Irbid. Define its
representative roles and
operations within the context of a
business plan
The mandate of the proposed
cooperative should aim at
creating a link between members’
production and supermarkets
particularly in Amman
Improving
farmers’ margins
when selling to
wholesalers and
intermediaries
Weak farmers’ bargaining
power in light of fragmentation
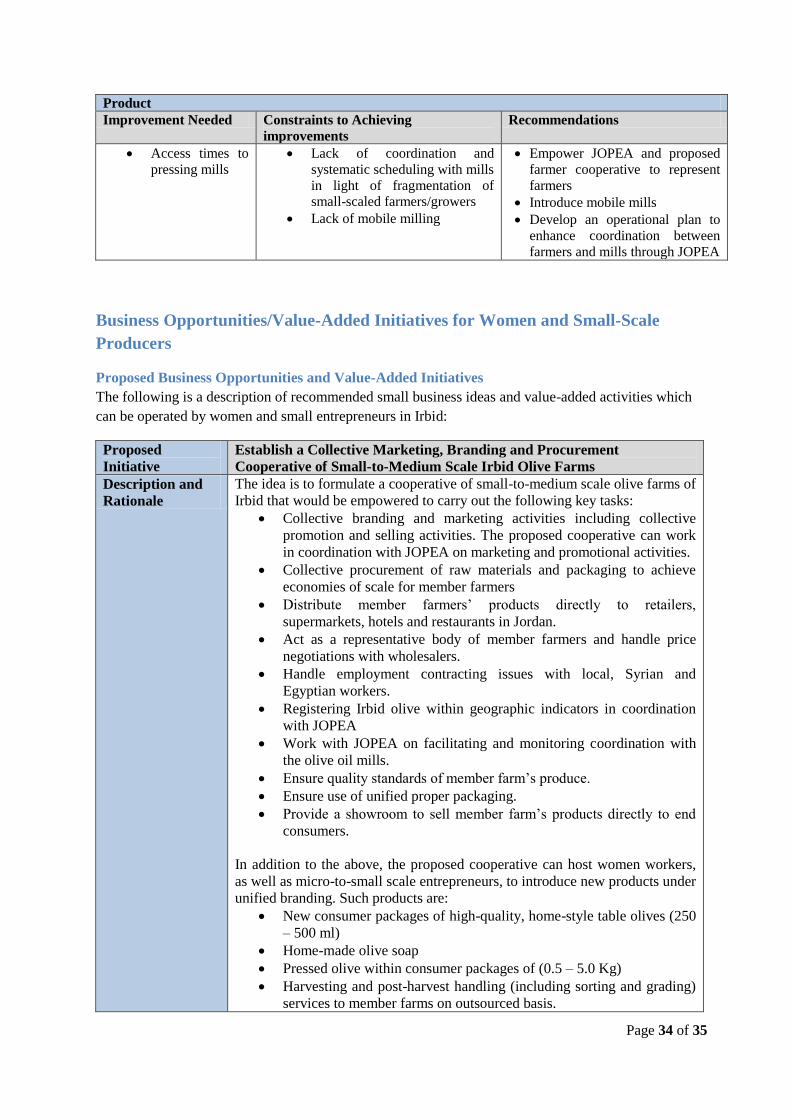
Page 34 of 35
Product
Improvement Needed Constraints to Achieving
improvements
Recommendations
Access times to
pressing mills
Lack of coordination and
systematic scheduling with mills
in light of fragmentation of
small-scaled farmers/growers
Lack of mobile milling
Empower JOPEA and proposed
farmer cooperative to represent
farmers
Introduce mobile mills
Develop an operational plan to
enhance coordination between
farmers and mills through JOPEA
Business Opportunities/Value-Added Initiatives for Women and Small-Scale
Producers
Proposed Business Opportunities and Value-Added Initiatives
The following is a description of recommended small business ideas and value-added activities which
can be operated by women and small entrepreneurs in Irbid:
Proposed
Initiative
Establish a Collective Marketing, Branding and Procurement
Cooperative of Small-to-Medium Scale Irbid Olive Farms
Description and
Rationale
The idea is to formulate a cooperative of small-to-medium scale olive farms of
Irbid that would be empowered to carry out the following key tasks:
Collective branding and marketing activities including collective
promotion and selling activities. The proposed cooperative can work
in coordination with JOPEA on marketing and promotional activities.
Collective procurement of raw materials and packaging to achieve
economies of scale for member farmers
Distribute member farmers’ products directly to retailers,
supermarkets, hotels and restaurants in Jordan.
Act as a representative body of member farmers and handle price
negotiations with wholesalers.
Handle employment contracting issues with local, Syrian and
Egyptian workers.
Registering Irbid olive within geographic indicators in coordination
with JOPEA
Work with JOPEA on facilitating and monitoring coordination with
the olive oil mills.
Ensure quality standards of member farm’s produce.
Ensure use of unified proper packaging.
Provide a showroom to sell member farm’s products directly to end
consumers.
In addition to the above, the proposed cooperative can host women workers,
as well as micro-to-small scale entrepreneurs, to introduce new products under
unified branding. Such products are:
New consumer packages of high-quality, home-style table olives (250
– 500 ml)
Home-made olive soap
Pressed olive within consumer packages of (0.5 – 5.0 Kg)
Harvesting and post-harvest handling (including sorting and grading)
services to member farms on outsourced basis.
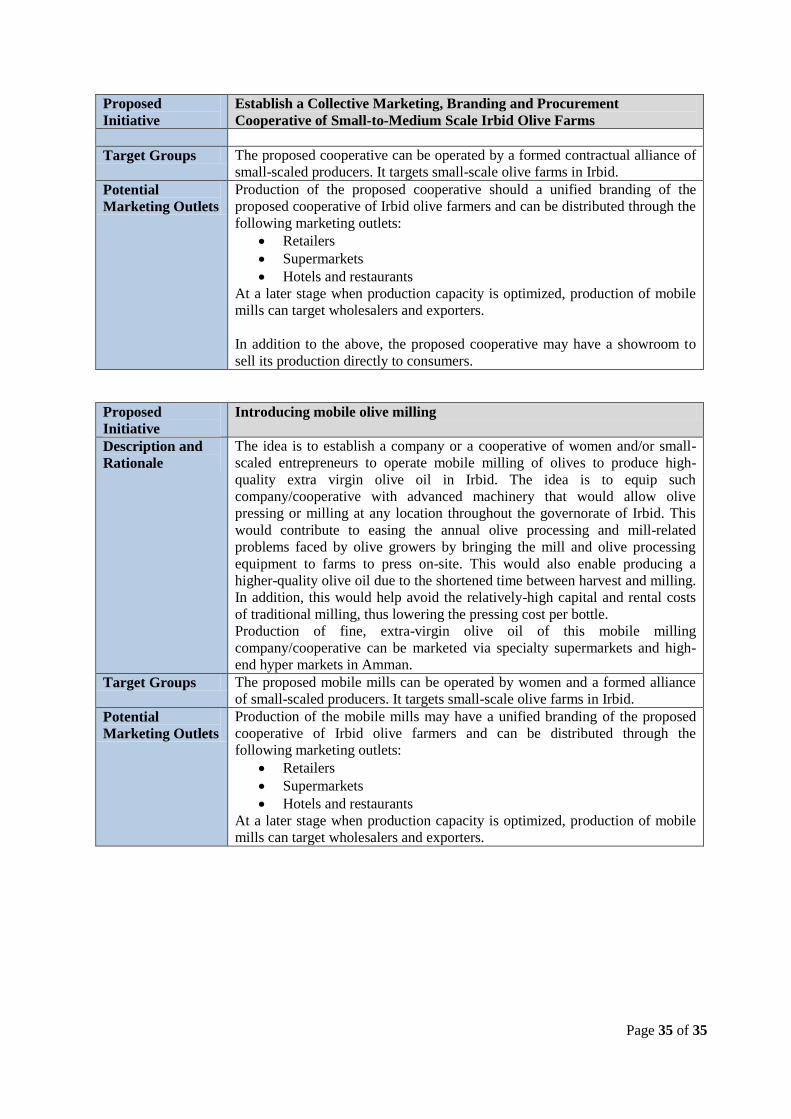
Page 35 of 35
Proposed
Initiative
Establish a Collective Marketing, Branding and Procurement
Cooperative of Small-to-Medium Scale Irbid Olive Farms
Target Groups The proposed cooperative can be operated by a formed contractual alliance of
small-scaled producers. It targets small-scale olive farms in Irbid.
Potential
Marketing Outlets
Production of the proposed cooperative should a unified branding of the
proposed cooperative of Irbid olive farmers and can be distributed through the
following marketing outlets:
Retailers
Supermarkets
Hotels and restaurants
At a later stage when production capacity is optimized, production of mobile
mills can target wholesalers and exporters.
In addition to the above, the proposed cooperative may have a showroom to
sell its production directly to consumers.
Proposed
Initiative
Introducing mobile olive milling
Description and
Rationale
The idea is to establish a company or a cooperative of women and/or small-
scaled entrepreneurs to operate mobile milling of olives to produce high-
quality extra virgin olive oil in Irbid. The idea is to equip such
company/cooperative with advanced machinery that would allow olive
pressing or milling at any location throughout the governorate of Irbid. This
would contribute to easing the annual olive processing and mill-related
problems faced by olive growers by bringing the mill and olive processing
equipment to farms to press on-site. This would also enable producing a
higher-quality olive oil due to the shortened time between harvest and milling.
In addition, this would help avoid the relatively-high capital and rental costs
of traditional milling, thus lowering the pressing cost per bottle.
Production of fine, extra-virgin olive oil of this mobile milling
company/cooperative can be marketed via specialty supermarkets and high-
end hyper markets in Amman.
Target Groups The proposed mobile mills can be operated by women and a formed alliance
of small-scaled producers. It targets small-scale olive farms in Irbid.
Potential
Marketing Outlets
Production of the mobile mills may have a unified branding of the proposed
cooperative of Irbid olive farmers and can be distributed through the
following marketing outlets:
Retailers
Supermarkets
Hotels and restaurants
At a later stage when production capacity is optimized, production of mobile
mills can target wholesalers and exporters.


