Page 1
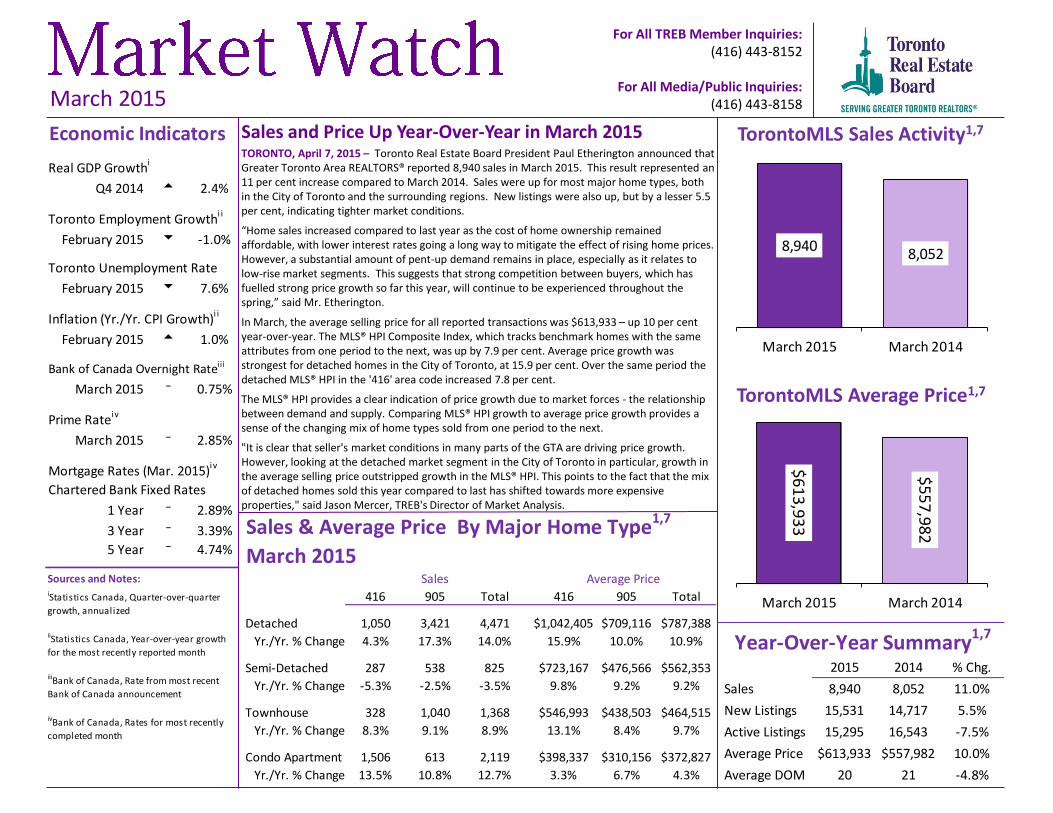
Sales and Price Up Year-Over-Year in March 2015 TORONTO, April 7, 2015 – Toronto Real Estate Board President Paul Etherington announced that Greater Toronto Area REALTORS® reported 8,940 sales in March 2015. This result represented an 11 per cent increase compared to March 2014. Sales were up for most major home types, both in the City of Toronto and the surrounding regions. New listings were also up, but by a lesser 5.5 per cent, indicating tighter market conditions.
“Home sales increased compared to last year as the cost of home ownership remained affordable, with lower interest rates going a long way to mitigate the effect of rising home prices. However, a substantial amount of pent-up demand remains in place, especially as it relates to low-rise market segments. This suggests that strong competition between buyers, which has fuelled strong price growth so far this year, will continue to be experienced throughout the spring,” said Mr. Etherington.
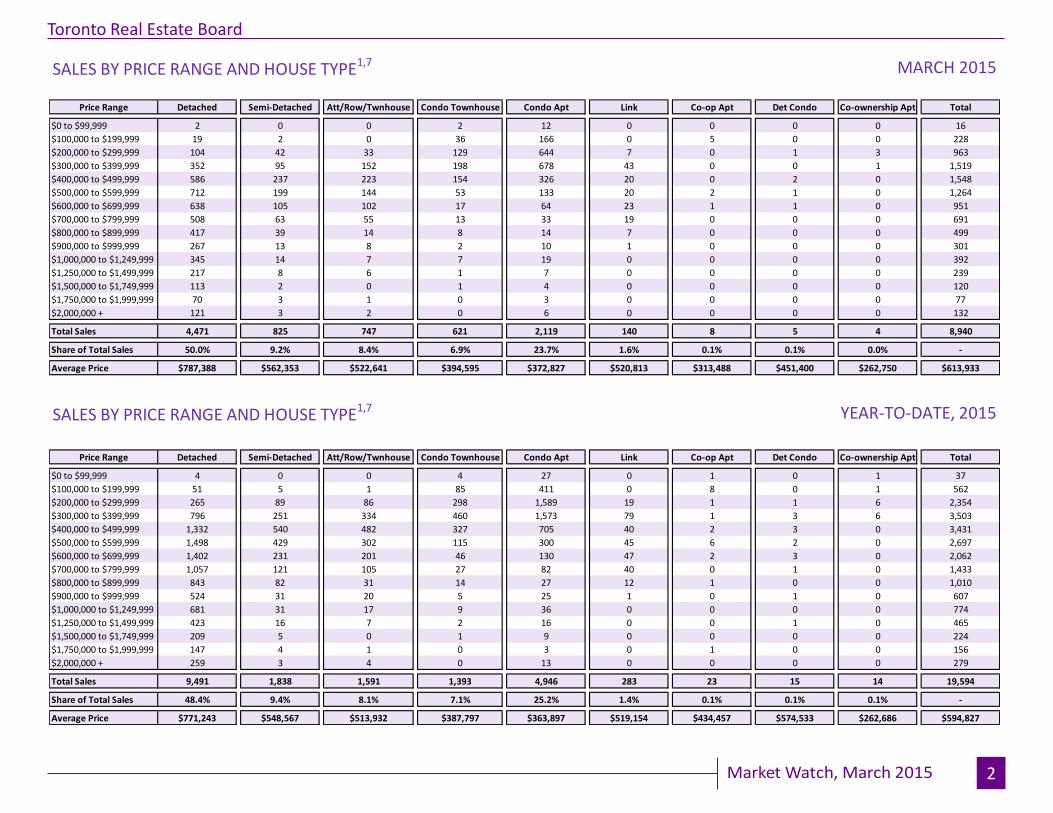
In March, the average selling price for all reported transactions was $613,933 – up 10 per cent year-over-year. The MLS® HPI Composite Index, which tracks benchmark homes with the same attributes from one period to the next, was up by 7.9 per cent. Average price growth was strongest for detached homes in the City of Toronto, at 15.9 per cent. Over the same period the detached MLS® HPI in the '416' area code increased 7.8 per cent.
The MLS® HPI provides a clear indication of price growth due to market forces - the relationship between demand and supply. Comparing MLS® HPI growth to average price growth provides a sense of the changing mix of home types sold from one period to the next.
"It is clear that seller's market conditions in many parts of the GTA are driving price growth. However, looking at the detached market segment in the City of Toronto in particular, growth in the average selling price outstripped growth in the MLS® HPI. This points to the fact that the mix of detached homes sold this year compared to last has shifted towards more expensive properties," said Jason Mercer, TREB's Director of Market Analysis.
8,9408,052
March 2015 March 2014
$613,933
$5
57
,98
2
March 2015 March 2014
For All TREB Member Inquiries: (416) 443-8152
For All Media/Public Inquiries:
(416) 443-8158 March 2015
Real GDP Growthi
Q4 2014 t 2.4%
Toronto Employment Growthi i
February 2015 u -1.0%
Toronto Unemployment Rate
February 2015 u 7.6%
Inflation (Yr./Yr. CPI Growth)i i
February 2015 t 1.0%
Bank of Canada Overnight Rateiii
March 2015 q 0.75%
Prime Ratei v
March 2015 q 2.85%
Mortgage Rates (Mar. 2015)i v
Chartered Bank Fixed Rates
1 Year q 2.89%
3 Year q 3.39%
5 Year q 4.74%
Sources and Notes:
Economic Indicators
iStatistics Canada, Quarter-over-quarter
growth, annualized
iiStatistics Canada, Year-over-year growth
for the most recently reported month
iiiBank of Canada, Rate from most recent
Bank of Canada announcement
ivBank of Canada, Rates for most recently
completed month
Sales & Average Price By Major Home Type1,7
416 905 Total 416 905 Total
Detached 1,050 3,421 4,471 $1,042,405 $709,116 $787,388
Yr./Yr. % Change 4.3% 17.3% 14.0% 15.9% 10.0% 10.9%
Semi-Detached 287 538 825 $723,167 $476,566 $562,353
Yr./Yr. % Change -5.3% -2.5% -3.5% 9.8% 9.2% 9.2%
Townhouse 328 1,040 1,368 $546,993 $438,503 $464,515
Yr./Yr. % Change 8.3% 9.1% 8.9% 13.1% 8.4% 9.7%
Condo Apartment 1,506 613 2,119 $398,337 $310,156 $372,827
Yr./Yr. % Change 13.5% 10.8% 12.7% 3.3% 6.7% 4.3%
March 2015Sales Average Price
2015 2014 % Chg.
Sales 8,940 8,052 11.0%
New Listings 15,531 14,717 5.5%
Active Listings 15,295 16,543 -7.5%
Average Price $613,933 $557,982 10.0%
Average DOM 20 21 -4.8%
Year-Over-Year Summary1,7
TorontoMLS Sales Activity1,7
TorontoMLS Average Price1,7
Page 2
Price Range Detached Semi-Detached Att/Row/Twnhouse Condo Townhouse Condo Apt Link Co-op Apt Det Condo Co-ownership Apt Total
$0 to $99,999 2 0 0 2 12 0 0 0 0 16
$100,000 to $199,999 19 2 0 36 166 0 5 0 0 228
$200,000 to $299,999 104 42 33 129 644 7 0 1 3 963
$300,000 to $399,999 352 95 152 198 678 43 0 0 1 1,519
$400,000 to $499,999 586 237 223 154 326 20 0 2 0 1,548
$500,000 to $599,999 712 199 144 53 133 20 2 1 0 1,264
$600,000 to $699,999 638 105 102 17 64 23 1 1 0 951
$700,000 to $799,999 508 63 55 13 33 19 0 0 0 691
$800,000 to $899,999 417 39 14 8 14 7 0 0 0 499
$900,000 to $999,999 267 13 8 2 10 1 0 0 0 301
$1,000,000 to $1,249,999 345 14 7 7 19 0 0 0 0 392
$1,250,000 to $1,499,999 217 8 6 1 7 0 0 0 0 239
$1,500,000 to $1,749,999 113 2 0 1 4 0 0 0 0 120
$1,750,000 to $1,999,999 70 3 1 0 3 0 0 0 0 77
$2,000,000 + 121 3 2 0 6 0 0 0 0 132
Total Sales 4,471 825 747 621 2,119 140 8 5 4 8,940
Share of Total Sales 50.0% 9.2% 8.4% 6.9% 23.7% 1.6% 0.1% 0.1% 0.0% -
Average Price $787,388 $562,353 $522,641 $394,595 $372,827 $520,813 $313,488 $451,400 $262,750 $613,933
Price Range Detached Semi-Detached Att/Row/Twnhouse Condo Townhouse Condo Apt Link Co-op Apt Det Condo Co-ownership Apt Total
$0 to $99,999 4 0 0 4 27 0 1 0 1 37
$100,000 to $199,999 51 5 1 85 411 0 8 0 1 562
$200,000 to $299,999 265 89 86 298 1,589 19 1 1 6 2,354
$300,000 to $399,999 796 251 334 460 1,573 79 1 3 6 3,503
$400,000 to $499,999 1,332 540 482 327 705 40 2 3 0 3,431
$500,000 to $599,999 1,498 429 302 115 300 45 6 2 0 2,697
$600,000 to $699,999 1,402 231 201 46 130 47 2 3 0 2,062
$700,000 to $799,999 1,057 121 105 27 82 40 0 1 0 1,433
$800,000 to $899,999 843 82 31 14 27 12 1 0 0 1,010
$900,000 to $999,999 524 31 20 5 25 1 0 1 0 607
$1,000,000 to $1,249,999 681 31 17 9 36 0 0 0 0 774
$1,250,000 to $1,499,999 423 16 7 2 16 0 0 1 0 465
$1,500,000 to $1,749,999 209 5 0 1 9 0 0 0 0 224
$1,750,000 to $1,999,999 147 4 1 0 3 0 1 0 0 156
$2,000,000 + 259 3 4 0 13 0 0 0 0 279
Total Sales 9,491 1,838 1,591 1,393 4,946 283 23 15 14 19,594
Share of Total Sales 48.4% 9.4% 8.1% 7.1% 25.2% 1.4% 0.1% 0.1% 0.1% -
Average Price $771,243 $548,567 $513,932 $387,797 $363,897 $519,154 $434,457 $574,533 $262,686 $594,827
SALES BY PRICE RANGE AND HOUSE TYPE1,7 MARCH 2015
SALES BY PRICE RANGE AND HOUSE TYPE1,7 YEAR-TO-DATE, 2015
Market Watch, March 2015 2
Toronto Real Estate Board
Page 3
ALL HOME TYPES, MARCH 2015ALL TREB AREAS
Number of Sales Dollar Volume1 Average Price1 Median Price1 New Listings2 SNLR (Trend)8 Active Listings3Mos. Inv. (Trend)9 Avg. SP/LP4 Avg. DOM5
TREB Total 8,940 $5,488,558,837 $613,933 $515,000 15,531 60.2% 15,295 2.1 101% 20
Halton Region 813 $538,446,458 $662,296 $581,000 1,328 64.6% 1,363 2.1 99% 21
Burlington 198 $122,921,474 $620,816 $555,700 316 67.3% 318 2.2 99% 27
Halton Hills 99 $55,375,970 $559,353 $505,000 143 65.6% 172 2.2 98% 23
Milton 211 $111,100,139 $526,541 $493,500 348 68.4% 266 1.5 99% 17
Oakville 305 $249,048,875 $816,554 $727,000 521 60.4% 607 2.4 98% 21
Peel Region 1,743 $900,643,209 $516,720 $477,000 3,081 60.0% 2,824 2.0 99% 18
Brampton 824 $391,869,536 $475,570 $457,000 1,310 62.8% 988 1.7 99% 16
Caledon 69 $42,279,840 $612,751 $567,000 173 56.5% 228 3.2 98% 23
Mississauga 850 $466,493,833 $548,816 $506,000 1,598 58.3% 1,608 2.2 99% 21
City of Toronto 3,196 $2,093,594,011 $655,067 $505,000 6,122 56.5% 6,593 2.3 101% 22
York Region 1,794 $1,360,823,473 $758,542 $690,000 2,949 60.0% 2,717 2.1 101% 18
Aurora 100 $69,282,570 $692,826 $636,500 158 65.1% 143 1.9 101% 18
E. Gwillimbury 32 $21,418,084 $669,315 $591,192 44 64.7% 56 2.4 97% 38
Georgina 95 $37,011,530 $389,595 $379,900 151 65.4% 156 2.2 98% 24
King 32 $28,459,090 $889,347 $747,000 80 41.6% 166 6.1 97% 36
Markham 462 $368,552,898 $797,734 $745,500 841 61.3% 689 1.8 104% 15
Newmarket 184 $112,694,346 $612,469 $589,900 229 73.3% 140 1.2 100% 14
Richmond Hill 352 $297,902,087 $846,313 $766,000 560 56.7% 507 2.2 102% 18
Vaughan 463 $368,726,892 $796,386 $725,000 740 56.5% 704 2.3 100% 17
Whitchurch-Stouffville 74 $56,775,976 $767,243 $674,000 146 63.6% 156 2.4 99% 24
Durham Region 1,086 $467,295,999 $430,291 $405,000 1,527 71.5% 1,142 1.4 101% 15
Ajax 195 $92,928,376 $476,556 $445,000 260 76.1% 146 0.9 101% 11
Brock 15 $5,018,000 $334,533 $320,000 39 54.8% 77 4.9 97% 43
Clarington 192 $72,792,435 $379,127 $357,500 242 70.3% 200 1.5 99% 17
Oshawa 275 $94,817,434 $344,791 $329,900 377 72.8% 230 1.2 101% 13
Pickering 134 $68,687,938 $512,597 $483,550 194 70.2% 140 1.3 101% 14
Scugog 22 $9,180,300 $417,286 $385,000 51 58.5% 80 3.4 98% 32
Uxbridge 28 $14,959,900 $534,282 $484,000 61 58.2% 89 3.8 98% 29
Whitby 225 $108,911,616 $484,052 $451,000 303 75.1% 180 1.1 101% 12
Dufferin County 65 $23,914,600 $367,917 $354,500 89 68.9% 97 2.6 99% 25
Orangeville 65 $23,914,600 $367,917 $354,500 89 68.9% 97 2.6 99% 25
Simcoe County 243 $103,841,088 $427,330 $415,000 435 61.0% 559 3.1 98% 30
Adjala-Tosorontio 23 $10,018,800 $435,600 $425,000 36 52.9% 63 5.0 98% 52
Bradford West Gwillimbury 79 $41,441,998 $524,582 $535,000 121 61.3% 127 2.5 98% 23
Essa 27 $8,618,900 $319,219 $292,500 73 62.9% 89 3.1 99% 31
Innisfil 49 $19,260,600 $393,073 $360,000 107 55.1% 159 3.8 100% 31
New Tecumseth 65 $24,500,790 $376,935 $363,000 98 69.7% 121 2.8 98% 28
SUMMARY OF EXISTING HOME TRANSACTIONS
! TURN PAGE FOR CITY OF TORONTO
TABLES OR CLICK HERE:
Market Watch, March 2015 3
Toronto Real Estate Board
Page 4
Market Watch, March 2015July 2010 Page 3
4
Toronto Real Estate Board
ALL HOME TYPES, MARCH 2015CITY OF TORONTO MUNICIPAL BREAKDOWN
Number of Sales Dollar Volume1
Average Price1
Median Price1
New Listings2
SNLR (Trend)8
Active Listings3
Mos. Inv. (Trend)9 Avg. SP/LP4
Avg. DOM5
TREB Total 8,940 $5,488,558,837 $613,933 $515,000 15,531 60.2% 15,295 2.1 101% 20
City of Toronto Total 3,196 $2,093,594,011 $655,067 $505,000 6,122 56.5% 6,593 2.3 101% 22
Toronto West 795 $442,528,816 $556,640 $499,000 1,605 57.1% 1,710 2.4 101% 23
Toronto W01 57 $42,543,890 $746,384 $589,000 121 51.2% 115 2.6 104% 20
Toronto W02 74 $51,627,158 $697,664 $615,000 119 69.0% 106 1.3 106% 17
Toronto W03 60 $32,545,100 $542,418 $528,450 109 60.8% 81 1.6 102% 16
Toronto W04 80 $40,420,970 $505,262 $501,500 135 61.5% 124 2.1 101% 23
Toronto W05 107 $44,683,551 $417,603 $465,000 209 60.8% 226 2.4 100% 26
Toronto W06 104 $52,521,991 $505,019 $485,500 307 45.1% 402 3.6 101% 27
Toronto W07 28 $23,942,388 $855,085 $822,500 43 69.8% 34 1.3 102% 20
Toronto W08 160 $100,313,229 $626,958 $411,250 360 54.6% 421 2.6 99% 24
Toronto W09 42 $23,131,965 $550,761 $590,550 73 65.5% 62 2.0 103% 17
Toronto W10 83 $30,798,574 $371,067 $410,200 129 60.0% 139 2.3 99% 27
Toronto Central 1,554 $1,197,206,389 $770,403 $493,500 3,199 51.0% 3,907 2.9 100% 24
Toronto C01 402 $191,433,767 $476,203 $402,000 1,083 45.0% 1,390 3.6 99% 27
Toronto C02 98 $115,940,969 $1,183,071 $1,040,500 157 50.7% 196 3.4 100% 40
Toronto C03 59 $65,077,138 $1,103,002 $860,000 104 54.6% 114 2.3 104% 15
Toronto C04 108 $153,021,613 $1,416,867 $1,447,500 154 58.3% 150 2.0 102% 20
Toronto C06 40 $31,951,150 $798,779 $805,000 51 54.1% 73 3.0 99% 18
Toronto C07 119 $90,693,462 $762,130 $590,000 218 52.6% 263 2.8 101% 20
Toronto C08 161 $75,847,098 $471,100 $415,000 335 52.4% 402 2.6 99% 25
Toronto C09 26 $33,352,400 $1,282,785 $1,260,000 37 57.6% 55 2.6 99% 19
Toronto C10 54 $44,742,500 $828,565 $662,500 90 60.1% 101 2.0 103% 20
Toronto C11 37 $22,729,000 $614,297 $276,500 55 72.8% 55 1.3 100% 18
Toronto C12 35 $72,615,200 $2,074,720 $1,398,000 88 48.6% 131 3.8 95% 26
Toronto C13 77 $62,927,102 $817,235 $585,000 127 65.9% 114 1.5 105% 14
Toronto C14 179 $136,991,878 $765,318 $457,900 399 46.5% 512 3.3 100% 26
Toronto C15 159 $99,883,112 $628,196 $443,000 301 52.5% 351 2.6 103% 25
Toronto East 847 $453,858,806 $535,843 $527,000 1,318 67.7% 976 1.4 104% 15
Toronto E01 72 $53,705,112 $745,904 $732,500 114 67.7% 79 1.1 109% 13
Toronto E02 65 $50,919,826 $783,382 $751,000 105 67.7% 65 1.1 105% 8
Toronto E03 93 $59,744,920 $642,418 $649,000 119 70.2% 64 1.0 106% 11
Toronto E04 99 $43,583,600 $440,238 $473,000 161 69.4% 121 1.3 103% 17
Toronto E05 84 $45,008,066 $535,810 $482,900 124 72.5% 86 1.1 106% 12
Toronto E06 32 $18,430,850 $575,964 $560,250 62 57.1% 46 1.5 104% 13
Toronto E07 77 $36,824,168 $478,236 $418,000 144 64.5% 127 1.7 105% 25
Toronto E08 61 $32,279,315 $529,169 $516,500 77 65.5% 72 1.7 100% 22
Toronto E09 135 $53,865,058 $399,000 $332,000 213 66.7% 167 1.6 103% 15
Toronto E10 59 $30,361,675 $514,605 $520,000 89 66.0% 68 1.5 102% 21
Toronto E11 70 $29,136,216 $416,232 $435,000 110 72.5% 81 1.3 103% 13
SUMMARY OF EXISTING HOME TRANSACTIONS
Page 5
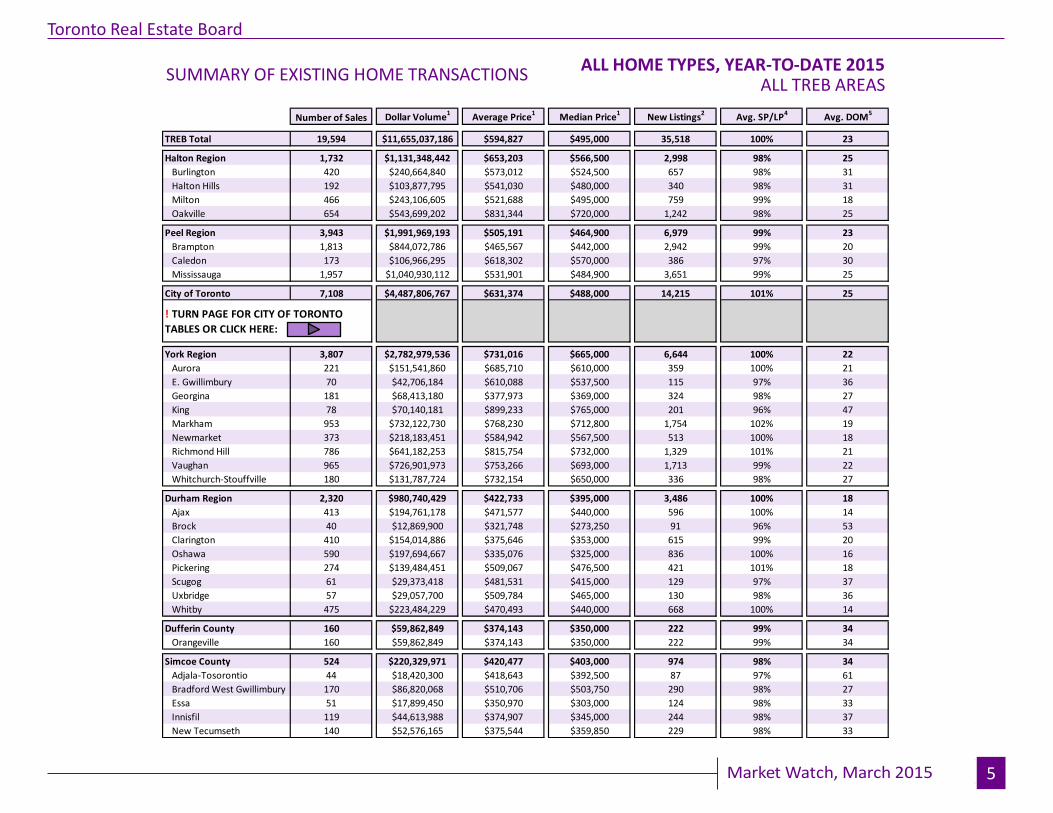
ALL HOME TYPES, YEAR-TO-DATE 2015ALL TREB AREAS
Number of Sales Dollar Volume1 Average Price1 Median Price1 New Listings2 Avg. SP/LP4 Avg. DOM5
TREB Total 19,594 $11,655,037,186 $594,827 $495,000 35,518 100% 23
Halton Region 1,732 $1,131,348,442 $653,203 $566,500 2,998 98% 25
Burlington 420 $240,664,840 $573,012 $524,500 657 98% 31
Halton Hills 192 $103,877,795 $541,030 $480,000 340 98% 31
Milton 466 $243,106,605 $521,688 $495,000 759 99% 18
Oakville 654 $543,699,202 $831,344 $720,000 1,242 98% 25
Peel Region 3,943 $1,991,969,193 $505,191 $464,900 6,979 99% 23
Brampton 1,813 $844,072,786 $465,567 $442,000 2,942 99% 20
Caledon 173 $106,966,295 $618,302 $570,000 386 97% 30
Mississauga 1,957 $1,040,930,112 $531,901 $484,900 3,651 99% 25
City of Toronto 7,108 $4,487,806,767 $631,374 $488,000 14,215 101% 25
York Region 3,807 $2,782,979,536 $731,016 $665,000 6,644 100% 22
Aurora 221 $151,541,860 $685,710 $610,000 359 100% 21
E. Gwillimbury 70 $42,706,184 $610,088 $537,500 115 97% 36
Georgina 181 $68,413,180 $377,973 $369,000 324 98% 27
King 78 $70,140,181 $899,233 $765,000 201 96% 47
Markham 953 $732,122,730 $768,230 $712,800 1,754 102% 19
Newmarket 373 $218,183,451 $584,942 $567,500 513 100% 18
Richmond Hill 786 $641,182,253 $815,754 $732,000 1,329 101% 21
Vaughan 965 $726,901,973 $753,266 $693,000 1,713 99% 22
Whitchurch-Stouffville 180 $131,787,724 $732,154 $650,000 336 98% 27
Durham Region 2,320 $980,740,429 $422,733 $395,000 3,486 100% 18
Ajax 413 $194,761,178 $471,577 $440,000 596 100% 14
Brock 40 $12,869,900 $321,748 $273,250 91 96% 53
Clarington 410 $154,014,886 $375,646 $353,000 615 99% 20
Oshawa 590 $197,694,667 $335,076 $325,000 836 100% 16
Pickering 274 $139,484,451 $509,067 $476,500 421 101% 18
Scugog 61 $29,373,418 $481,531 $415,000 129 97% 37
Uxbridge 57 $29,057,700 $509,784 $465,000 130 98% 36
Whitby 475 $223,484,229 $470,493 $440,000 668 100% 14
Dufferin County 160 $59,862,849 $374,143 $350,000 222 99% 34
Orangeville 160 $59,862,849 $374,143 $350,000 222 99% 34
Simcoe County 524 $220,329,971 $420,477 $403,000 974 98% 34
Adjala-Tosorontio 44 $18,420,300 $418,643 $392,500 87 97% 61
Bradford West Gwillimbury 170 $86,820,068 $510,706 $503,750 290 98% 27
Essa 51 $17,899,450 $350,970 $303,000 124 98% 33
Innisfil 119 $44,613,988 $374,907 $345,000 244 98% 37
New Tecumseth 140 $52,576,165 $375,544 $359,850 229 98% 33
! TURN PAGE FOR CITY OF TORONTO
TABLES OR CLICK HERE:
SUMMARY OF EXISTING HOME TRANSACTIONS
Market Watch, March 2015July 2010 Page 3
5
Toronto Real Estate Board
Page 6
Market Watch, March 2015July 2010 Page 3
6
Toronto Real Estate Board
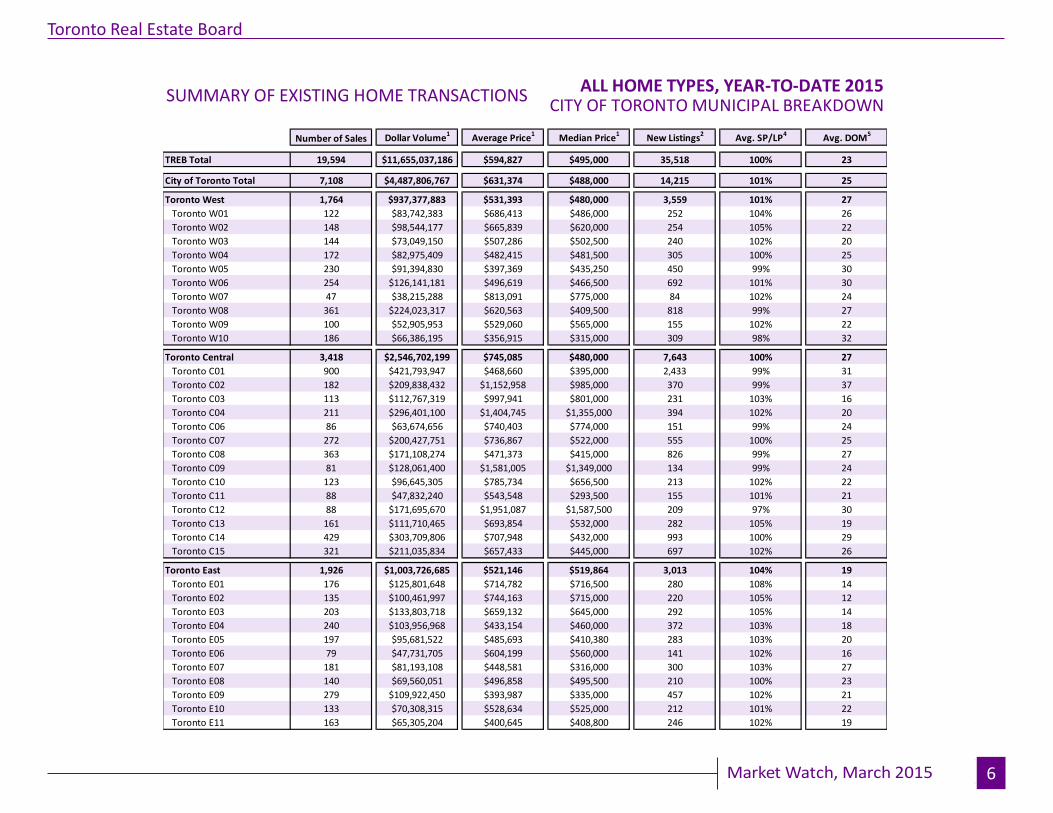
ALL HOME TYPES, YEAR-TO-DATE 2015CITY OF TORONTO MUNICIPAL BREAKDOWN
Number of Sales Dollar Volume1
Average Price1
Median Price1
New Listings2
Avg. SP/LP4
Avg. DOM5
TREB Total 19,594 $11,655,037,186 $594,827 $495,000 35,518 100% 23
City of Toronto Total 7,108 $4,487,806,767 $631,374 $488,000 14,215 101% 25
Toronto West 1,764 $937,377,883 $531,393 $480,000 3,559 101% 27
Toronto W01 122 $83,742,383 $686,413 $486,000 252 104% 26
Toronto W02 148 $98,544,177 $665,839 $620,000 254 105% 22
Toronto W03 144 $73,049,150 $507,286 $502,500 240 102% 20
Toronto W04 172 $82,975,409 $482,415 $481,500 305 100% 25
Toronto W05 230 $91,394,830 $397,369 $435,250 450 99% 30
Toronto W06 254 $126,141,181 $496,619 $466,500 692 101% 30
Toronto W07 47 $38,215,288 $813,091 $775,000 84 102% 24
Toronto W08 361 $224,023,317 $620,563 $409,500 818 99% 27
Toronto W09 100 $52,905,953 $529,060 $565,000 155 102% 22
Toronto W10 186 $66,386,195 $356,915 $315,000 309 98% 32
Toronto Central 3,418 $2,546,702,199 $745,085 $480,000 7,643 100% 27
Toronto C01 900 $421,793,947 $468,660 $395,000 2,433 99% 31
Toronto C02 182 $209,838,432 $1,152,958 $985,000 370 99% 37
Toronto C03 113 $112,767,319 $997,941 $801,000 231 103% 16
Toronto C04 211 $296,401,100 $1,404,745 $1,355,000 394 102% 20
Toronto C06 86 $63,674,656 $740,403 $774,000 151 99% 24
Toronto C07 272 $200,427,751 $736,867 $522,000 555 100% 25
Toronto C08 363 $171,108,274 $471,373 $415,000 826 99% 27
Toronto C09 81 $128,061,400 $1,581,005 $1,349,000 134 99% 24
Toronto C10 123 $96,645,305 $785,734 $656,500 213 102% 22
Toronto C11 88 $47,832,240 $543,548 $293,500 155 101% 21
Toronto C12 88 $171,695,670 $1,951,087 $1,587,500 209 97% 30
Toronto C13 161 $111,710,465 $693,854 $532,000 282 105% 19
Toronto C14 429 $303,709,806 $707,948 $432,000 993 100% 29
Toronto C15 321 $211,035,834 $657,433 $445,000 697 102% 26
Toronto East 1,926 $1,003,726,685 $521,146 $519,864 3,013 104% 19
Toronto E01 176 $125,801,648 $714,782 $716,500 280 108% 14
Toronto E02 135 $100,461,997 $744,163 $715,000 220 105% 12
Toronto E03 203 $133,803,718 $659,132 $645,000 292 105% 14
Toronto E04 240 $103,956,968 $433,154 $460,000 372 103% 18
Toronto E05 197 $95,681,522 $485,693 $410,380 283 103% 20
Toronto E06 79 $47,731,705 $604,199 $560,000 141 102% 16
Toronto E07 181 $81,193,108 $448,581 $316,000 300 103% 27
Toronto E08 140 $69,560,051 $496,858 $495,500 210 100% 23
Toronto E09 279 $109,922,450 $393,987 $335,000 457 102% 21
Toronto E10 133 $70,308,315 $528,634 $525,000 212 101% 22
Toronto E11 163 $65,305,204 $400,645 $408,800 246 102% 19
SUMMARY OF EXISTING HOME TRANSACTIONS
Page 7
Market Watch, March 2015
Industrial Leasing
July 2010 Page 3
7
Toronto Real Estate Board
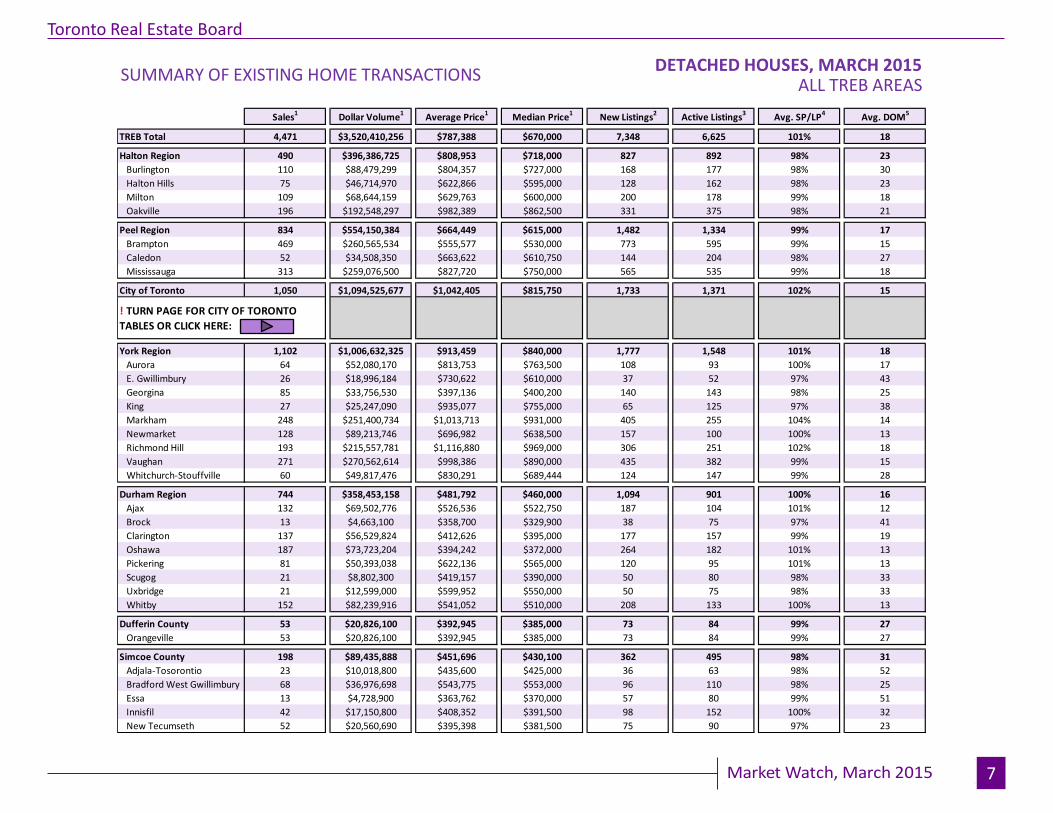
ALL TREB AREAS
Sales1 Dollar Volume1 Average Price1 Median Price1 New Listings2 Active Listings3 Avg. SP/LP4 Avg. DOM5
TREB Total 4,471 $3,520,410,256 $787,388 $670,000 7,348 6,625 101% 18- - - - - - - -
Halton Region 490 $396,386,725 $808,953 $718,000 827 892 98% 23
Burlington 110 $88,479,299 $804,357 $727,000 168 177 98% 30
Halton Hills 75 $46,714,970 $622,866 $595,000 128 162 98% 23
Milton 109 $68,644,159 $629,763 $600,000 200 178 99% 18
Oakville 196 $192,548,297 $982,389 $862,500 331 375 98% 21- - - - - - - -
Peel Region 834 $554,150,384 $664,449 $615,000 1,482 1,334 99% 17
Brampton 469 $260,565,534 $555,577 $530,000 773 595 99% 15
Caledon 52 $34,508,350 $663,622 $610,750 144 204 98% 27
Mississauga 313 $259,076,500 $827,720 $750,000 565 535 99% 18- - - - - - - -
City of Toronto 1,050 $1,094,525,677 $1,042,405 $815,750 1,733 1,371 102% 15
- - - - - - - -
York Region 1,102 $1,006,632,325 $913,459 $840,000 1,777 1,548 101% 18
Aurora 64 $52,080,170 $813,753 $763,500 108 93 100% 17
E. Gwillimbury 26 $18,996,184 $730,622 $610,000 37 52 97% 43
Georgina 85 $33,756,530 $397,136 $400,200 140 143 98% 25
King 27 $25,247,090 $935,077 $755,000 65 125 97% 38
Markham 248 $251,400,734 $1,013,713 $931,000 405 255 104% 14
Newmarket 128 $89,213,746 $696,982 $638,500 157 100 100% 13
Richmond Hill 193 $215,557,781 $1,116,880 $969,000 306 251 102% 18
Vaughan 271 $270,562,614 $998,386 $890,000 435 382 99% 15
Whitchurch-Stouffville 60 $49,817,476 $830,291 $689,444 124 147 99% 28- - - - - - - -
Durham Region 744 $358,453,158 $481,792 $460,000 1,094 901 100% 16
Ajax 132 $69,502,776 $526,536 $522,750 187 104 101% 12
Brock 13 $4,663,100 $358,700 $329,900 38 75 97% 41
Clarington 137 $56,529,824 $412,626 $395,000 177 157 99% 19
Oshawa 187 $73,723,204 $394,242 $372,000 264 182 101% 13
Pickering 81 $50,393,038 $622,136 $565,000 120 95 101% 13
Scugog 21 $8,802,300 $419,157 $390,000 50 80 98% 33
Uxbridge 21 $12,599,000 $599,952 $550,000 50 75 98% 33
Whitby 152 $82,239,916 $541,052 $510,000 208 133 100% 13- - - - - - - -
Dufferin County 53 $20,826,100 $392,945 $385,000 73 84 99% 27
Orangeville 53 $20,826,100 $392,945 $385,000 73 84 99% 27- - - - - - - -
Simcoe County 198 $89,435,888 $451,696 $430,100 362 495 98% 31
Adjala-Tosorontio 23 $10,018,800 $435,600 $425,000 36 63 98% 52
Bradford West Gwillimbury 68 $36,976,698 $543,775 $553,000 96 110 98% 25
Essa 13 $4,728,900 $363,762 $370,000 57 80 99% 51
Innisfil 42 $17,150,800 $408,352 $391,500 98 152 100% 32
New Tecumseth 52 $20,560,690 $395,398 $381,500 75 90 97% 23
SUMMARY OF EXISTING HOME TRANSACTIONSDETACHED HOUSES, MARCH 2015
! TURN PAGE FOR CITY OF TORONTO
TABLES OR CLICK HERE:
Page 8
Market Watch, March 2015
Industrial Leasing
July 2010 Page 3
8
Toronto Real Estate Board
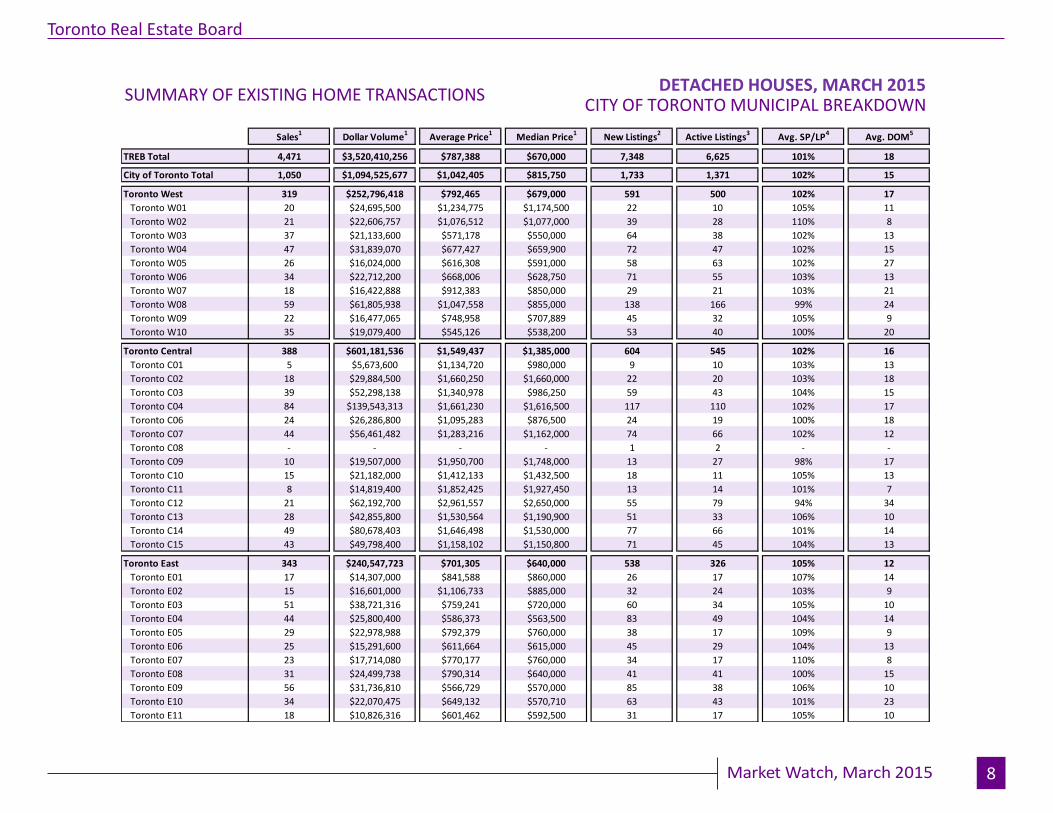
CITY OF TORONTO MUNICIPAL BREAKDOWN
Sales1 Dollar Volume1 Average Price1 Median Price1 New Listings2 Active Listings3 Avg. SP/LP4 Avg. DOM5
TREB Total 4,471 $3,520,410,256 $787,388 $670,000 7,348 6,625 101% 18
City of Toronto Total 1,050 $1,094,525,677 $1,042,405 $815,750 1,733 1,371 102% 15
Toronto West 319 $252,796,418 $792,465 $679,000 591 500 102% 17
Toronto W01 20 $24,695,500 $1,234,775 $1,174,500 22 10 105% 11
Toronto W02 21 $22,606,757 $1,076,512 $1,077,000 39 28 110% 8
Toronto W03 37 $21,133,600 $571,178 $550,000 64 38 102% 13
Toronto W04 47 $31,839,070 $677,427 $659,900 72 47 102% 15
Toronto W05 26 $16,024,000 $616,308 $591,000 58 63 102% 27
Toronto W06 34 $22,712,200 $668,006 $628,750 71 55 103% 13
Toronto W07 18 $16,422,888 $912,383 $850,000 29 21 103% 21
Toronto W08 59 $61,805,938 $1,047,558 $855,000 138 166 99% 24
Toronto W09 22 $16,477,065 $748,958 $707,889 45 32 105% 9
Toronto W10 35 $19,079,400 $545,126 $538,200 53 40 100% 20
Toronto Central 388 $601,181,536 $1,549,437 $1,385,000 604 545 102% 16
Toronto C01 5 $5,673,600 $1,134,720 $980,000 9 10 103% 13
Toronto C02 18 $29,884,500 $1,660,250 $1,660,000 22 20 103% 18
Toronto C03 39 $52,298,138 $1,340,978 $986,250 59 43 104% 15
Toronto C04 84 $139,543,313 $1,661,230 $1,616,500 117 110 102% 17
Toronto C06 24 $26,286,800 $1,095,283 $876,500 24 19 100% 18
Toronto C07 44 $56,461,482 $1,283,216 $1,162,000 74 66 102% 12
Toronto C08 - - - - 1 2 - -
Toronto C09 10 $19,507,000 $1,950,700 $1,748,000 13 27 98% 17
Toronto C10 15 $21,182,000 $1,412,133 $1,432,500 18 11 105% 13
Toronto C11 8 $14,819,400 $1,852,425 $1,927,450 13 14 101% 7
Toronto C12 21 $62,192,700 $2,961,557 $2,650,000 55 79 94% 34
Toronto C13 28 $42,855,800 $1,530,564 $1,190,900 51 33 106% 10
Toronto C14 49 $80,678,403 $1,646,498 $1,530,000 77 66 101% 14
Toronto C15 43 $49,798,400 $1,158,102 $1,150,800 71 45 104% 13
Toronto East 343 $240,547,723 $701,305 $640,000 538 326 105% 12
Toronto E01 17 $14,307,000 $841,588 $860,000 26 17 107% 14
Toronto E02 15 $16,601,000 $1,106,733 $885,000 32 24 103% 9
Toronto E03 51 $38,721,316 $759,241 $720,000 60 34 105% 10
Toronto E04 44 $25,800,400 $586,373 $563,500 83 49 104% 14
Toronto E05 29 $22,978,988 $792,379 $760,000 38 17 109% 9
Toronto E06 25 $15,291,600 $611,664 $615,000 45 29 104% 13
Toronto E07 23 $17,714,080 $770,177 $760,000 34 17 110% 8
Toronto E08 31 $24,499,738 $790,314 $640,000 41 41 100% 15
Toronto E09 56 $31,736,810 $566,729 $570,000 85 38 106% 10
Toronto E10 34 $22,070,475 $649,132 $570,710 63 43 101% 23
Toronto E11 18 $10,826,316 $601,462 $592,500 31 17 105% 10
DETACHED HOUSES, MARCH 2015SUMMARY OF EXISTING HOME TRANSACTIONS
Page 9
Industrial Leasing
Toronto Real Estate Board
ALL TREB AREAS
Sales1 Dollar Volume1 Average Price1 Median Price1 New Listings2 Active Listings3 Avg. SP/LP4 Avg. DOM5
TREB Total 825 $463,941,622 $562,353 $515,000 1,272 725 103% 11- - - - - - - -
Halton Region 48 $23,777,700 $495,369 $490,250 76 48 99% 13
Burlington 7 $3,432,900 $490,414 $517,000 16 11 101% 7
Halton Hills 7 $2,651,500 $378,786 $400,000 3 - 99% 19
Milton 23 $11,045,900 $480,257 $475,000 41 25 99% 15
Oakville 11 $6,647,400 $604,309 $600,000 16 12 99% 11- - - - - - - -
Peel Region 275 $127,835,075 $464,855 $455,000 472 266 100% 12
Brampton 150 $63,363,007 $422,420 $415,051 231 136 99% 13
Caledon 3 $1,392,500 $464,167 $473,500 10 9 100% 6
Mississauga 122 $63,079,568 $517,046 $516,000 231 121 101% 12- - - - - - - -
City of Toronto 287 $207,548,921 $723,167 $658,000 452 282 106% 10
- - - - - - - -
York Region 134 $78,446,776 $585,424 $586,500 166 86 103% 9
Aurora 10 $5,447,000 $544,700 $569,500 15 6 105% 9
E. Gwillimbury 1 $445,000 $445,000 $445,000 2 2 99% 32
Georgina 5 $1,738,000 $347,600 $360,000 3 1 100% 11
King - - - - - - - -
Markham 35 $22,933,476 $655,242 $650,000 47 22 107% 9
Newmarket 18 $8,223,000 $456,833 $470,000 21 9 99% 10
Richmond Hill 17 $10,439,010 $614,059 $600,000 26 17 106% 7
Vaughan 45 $27,603,290 $613,406 $597,000 50 29 101% 9
Whitchurch-Stouffville 3 $1,618,000 $539,333 $535,000 2 - 100% 4- - - - - - - -
Durham Region 67 $21,930,150 $327,316 $302,000 83 31 103% 7
Ajax 13 $5,608,600 $431,431 $401,500 14 7 101% 7
Brock - - - - - - - -
Clarington 3 $934,000 $311,333 $285,000 6 3 100% 10
Oshawa 34 $8,642,150 $254,181 $250,000 42 13 103% 8
Pickering 7 $2,986,400 $426,629 $437,400 8 2 104% 5
Scugog - - - - - - - -
Uxbridge 1 $333,000 $333,000 $333,000 1 1 98% 8
Whitby 9 $3,426,000 $380,667 $391,000 12 5 105% 5- - - - - - - -
Dufferin County 4 $1,023,500 $255,875 $258,750 6 5 99% 9
Orangeville 4 $1,023,500 $255,875 $258,750 6 5 99% 9- - - - - - - -
Simcoe County 10 $3,379,500 $337,950 $295,000 17 7 99% 9
Adjala-Tosorontio - - - - - - - -
Bradford West Gwillimbury 5 $1,974,400 $394,880 $406,000 9 3 98% 11
Essa 4 $1,130,000 $282,500 $282,750 3 - 99% 8
Innisfil - - - - - - - -
New Tecumseth 1 $275,100 $275,100 $275,100 5 4 102% 8
! TURN PAGE FOR CITY OF TORONTO
TABLES OR CLICK HERE:
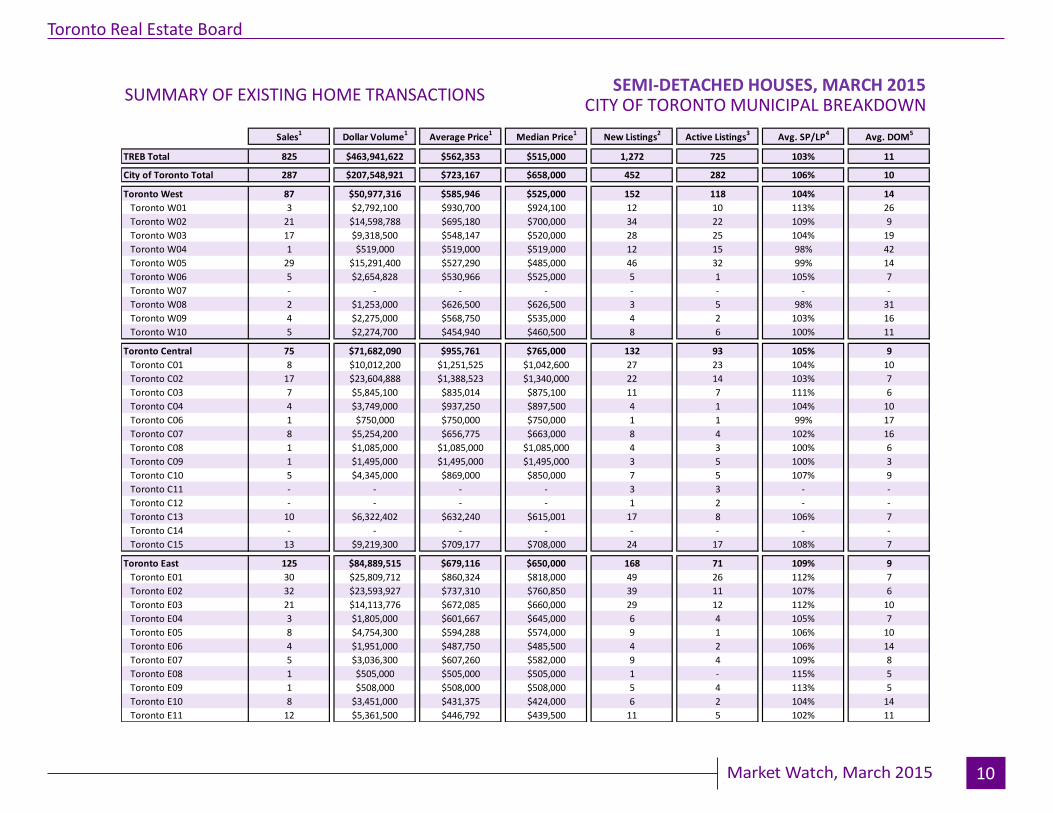
SUMMARY OF EXISTING HOME TRANSACTIONSSEMI-DETACHED HOUSES, MARCH 2015
July 2010 Page 3 Market Watch, March 2015 9
Page 10
Industrial Leasing
July 2010 Page 3
Toronto Real Estate Board
Market Watch, March 2015
CITY OF TORONTO MUNICIPAL BREAKDOWN
Sales1 Dollar Volume1 Average Price1 Median Price1 New Listings2 Active Listings3 Avg. SP/LP4 Avg. DOM5
TREB Total 825 $463,941,622 $562,353 $515,000 1,272 725 103% 11
City of Toronto Total 287 $207,548,921 $723,167 $658,000 452 282 106% 10
Toronto West 87 $50,977,316 $585,946 $525,000 152 118 104% 14
Toronto W01 3 $2,792,100 $930,700 $924,100 12 10 113% 26
Toronto W02 21 $14,598,788 $695,180 $700,000 34 22 109% 9
Toronto W03 17 $9,318,500 $548,147 $520,000 28 25 104% 19
Toronto W04 1 $519,000 $519,000 $519,000 12 15 98% 42
Toronto W05 29 $15,291,400 $527,290 $485,000 46 32 99% 14
Toronto W06 5 $2,654,828 $530,966 $525,000 5 1 105% 7
Toronto W07 - - - - - - - -
Toronto W08 2 $1,253,000 $626,500 $626,500 3 5 98% 31
Toronto W09 4 $2,275,000 $568,750 $535,000 4 2 103% 16
Toronto W10 5 $2,274,700 $454,940 $460,500 8 6 100% 11
Toronto Central 75 $71,682,090 $955,761 $765,000 132 93 105% 9
Toronto C01 8 $10,012,200 $1,251,525 $1,042,600 27 23 104% 10
Toronto C02 17 $23,604,888 $1,388,523 $1,340,000 22 14 103% 7
Toronto C03 7 $5,845,100 $835,014 $875,100 11 7 111% 6
Toronto C04 4 $3,749,000 $937,250 $897,500 4 1 104% 10
Toronto C06 1 $750,000 $750,000 $750,000 1 1 99% 17
Toronto C07 8 $5,254,200 $656,775 $663,000 8 4 102% 16
Toronto C08 1 $1,085,000 $1,085,000 $1,085,000 4 3 100% 6
Toronto C09 1 $1,495,000 $1,495,000 $1,495,000 3 5 100% 3
Toronto C10 5 $4,345,000 $869,000 $850,000 7 5 107% 9
Toronto C11 - - - - 3 3 - -
Toronto C12 - - - - 1 2 - -
Toronto C13 10 $6,322,402 $632,240 $615,001 17 8 106% 7
Toronto C14 - - - - - - - -
Toronto C15 13 $9,219,300 $709,177 $708,000 24 17 108% 7
Toronto East 125 $84,889,515 $679,116 $650,000 168 71 109% 9
Toronto E01 30 $25,809,712 $860,324 $818,000 49 26 112% 7
Toronto E02 32 $23,593,927 $737,310 $760,850 39 11 107% 6
Toronto E03 21 $14,113,776 $672,085 $660,000 29 12 112% 10
Toronto E04 3 $1,805,000 $601,667 $645,000 6 4 105% 7
Toronto E05 8 $4,754,300 $594,288 $574,000 9 1 106% 10
Toronto E06 4 $1,951,000 $487,750 $485,500 4 2 106% 14
Toronto E07 5 $3,036,300 $607,260 $582,000 9 4 109% 8
Toronto E08 1 $505,000 $505,000 $505,000 1 - 115% 5
Toronto E09 1 $508,000 $508,000 $508,000 5 4 113% 5
Toronto E10 8 $3,451,000 $431,375 $424,000 6 2 104% 14
Toronto E11 12 $5,361,500 $446,792 $439,500 11 5 102% 11
SUMMARY OF EXISTING HOME TRANSACTIONSSEMI-DETACHED HOUSES, MARCH 2015
10
Page 11
Industrial Leasing
July 2010 Page 3
Toronto Real Estate Board
Market Watch, March 2015
ALL TREB AREAS
Sales1 Dollar Volume1 Average Price1 Median Price1 New Listings2 Active Listings3 Avg. SP/LP4 Avg. DOM5
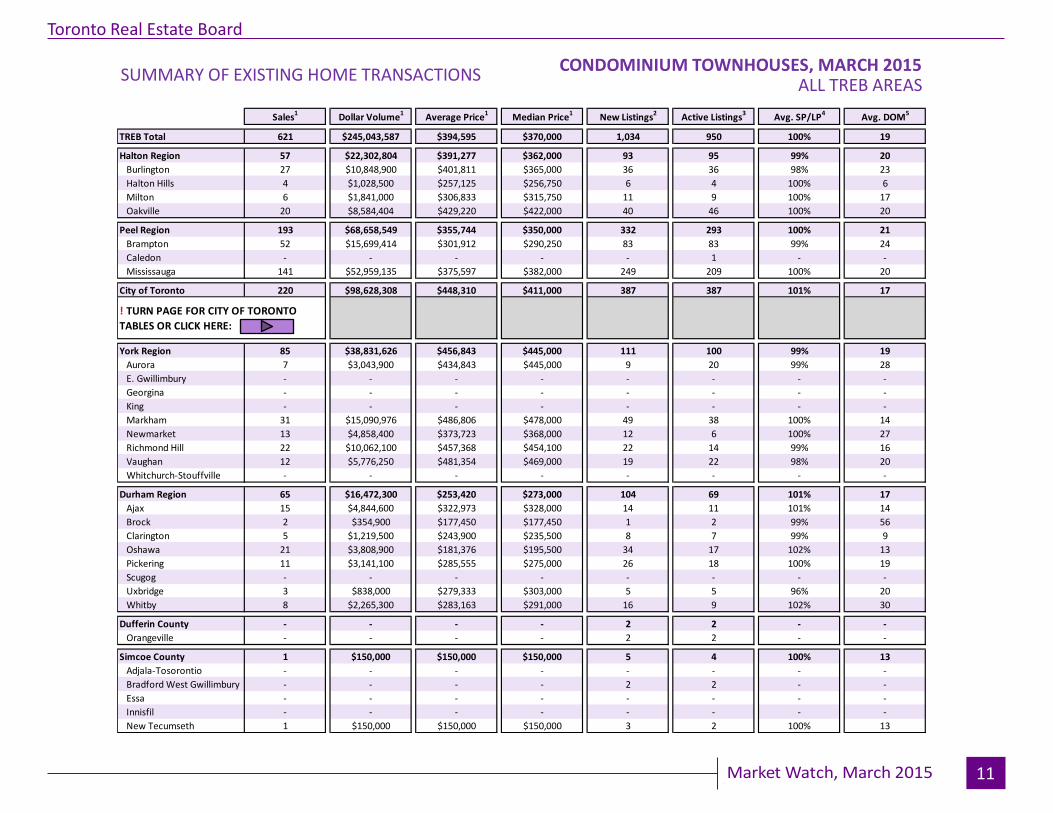
TREB Total 621 $245,043,587 $394,595 $370,000 1,034 950 100% 19- - - - - - - -
Halton Region 57 $22,302,804 $391,277 $362,000 93 95 99% 20
Burlington 27 $10,848,900 $401,811 $365,000 36 36 98% 23
Halton Hills 4 $1,028,500 $257,125 $256,750 6 4 100% 6
Milton 6 $1,841,000 $306,833 $315,750 11 9 100% 17
Oakville 20 $8,584,404 $429,220 $422,000 40 46 100% 20- - - - - - - -
Peel Region 193 $68,658,549 $355,744 $350,000 332 293 100% 21
Brampton 52 $15,699,414 $301,912 $290,250 83 83 99% 24
Caledon - - - - - 1 - -
Mississauga 141 $52,959,135 $375,597 $382,000 249 209 100% 20- - - - - - - -
City of Toronto 220 $98,628,308 $448,310 $411,000 387 387 101% 17
- - - - - - - -
York Region 85 $38,831,626 $456,843 $445,000 111 100 99% 19
Aurora 7 $3,043,900 $434,843 $445,000 9 20 99% 28
E. Gwillimbury - - - - - - - -
Georgina - - - - - - - -
King - - - - - - - -
Markham 31 $15,090,976 $486,806 $478,000 49 38 100% 14
Newmarket 13 $4,858,400 $373,723 $368,000 12 6 100% 27
Richmond Hill 22 $10,062,100 $457,368 $454,100 22 14 99% 16
Vaughan 12 $5,776,250 $481,354 $469,000 19 22 98% 20
Whitchurch-Stouffville - - - - - - - -- - - - - - - -
Durham Region 65 $16,472,300 $253,420 $273,000 104 69 101% 17
Ajax 15 $4,844,600 $322,973 $328,000 14 11 101% 14
Brock 2 $354,900 $177,450 $177,450 1 2 99% 56
Clarington 5 $1,219,500 $243,900 $235,500 8 7 99% 9
Oshawa 21 $3,808,900 $181,376 $195,500 34 17 102% 13
Pickering 11 $3,141,100 $285,555 $275,000 26 18 100% 19
Scugog - - - - - - - -
Uxbridge 3 $838,000 $279,333 $303,000 5 5 96% 20
Whitby 8 $2,265,300 $283,163 $291,000 16 9 102% 30- - - - - - - -
Dufferin County - - - - 2 2 - -
Orangeville - - - - 2 2 - -- - - - - - - -
Simcoe County 1 $150,000 $150,000 $150,000 5 4 100% 13
Adjala-Tosorontio - - - - - - - -
Bradford West Gwillimbury - - - - 2 2 - -
Essa - - - - - - - -
Innisfil - - - - - - - -
New Tecumseth 1 $150,000 $150,000 $150,000 3 2 100% 13
! TURN PAGE FOR CITY OF TORONTO
TABLES OR CLICK HERE:
SUMMARY OF EXISTING HOME TRANSACTIONSCONDOMINIUM TOWNHOUSES, MARCH 2015
11
Page 12
Industrial Leasing
July 2010 Page 3
Toronto Real Estate Board
Market Watch, March 2015 12
CITY OF TORONTO MUNICIPAL BREAKDOWN
Sales1 Dollar Volume1 Average Price1 Median Price1 New Listings2 Active Listings3 Avg. SP/LP4 Avg. DOM5
TREB Total 621 $245,043,587 $394,595 $370,000 1,034 950 100% 19
City of Toronto Total 220 $98,628,308 $448,310 $411,000 387 387 101% 17
Toronto West 61 $22,562,239 $369,873 $339,900 110 108 99% 21
Toronto W01 4 $1,785,400 $446,350 $402,700 11 8 99% 14
Toronto W02 11 $5,648,500 $513,500 $499,000 13 10 100% 23
Toronto W03 - - - - 1 1 - -
Toronto W04 8 $2,589,900 $323,738 $304,500 10 9 99% 19
Toronto W05 16 $4,474,001 $279,625 $279,500 35 38 99% 23
Toronto W06 5 $2,767,538 $553,508 $533,000 7 9 101% 18
Toronto W07 - - - - - - - -
Toronto W08 4 $1,367,000 $341,750 $303,000 14 13 100% 21
Toronto W09 3 $1,231,400 $410,467 $433,000 4 6 100% 22
Toronto W10 10 $2,698,500 $269,850 $309,250 15 14 97% 24
Toronto Central 86 $50,718,089 $589,745 $487,000 165 183 101% 14
Toronto C01 22 $11,061,089 $502,777 $455,500 44 52 102% 14
Toronto C02 1 $1,150,000 $1,150,000 $1,150,000 5 5 99% 18
Toronto C03 - - - - 2 5 - -
Toronto C04 - - - - 1 4 - -
Toronto C06 1 $525,000 $525,000 $525,000 3 5 107% 19
Toronto C07 4 $1,581,000 $395,250 $427,000 15 20 100% 16
Toronto C08 1 $423,000 $423,000 $423,000 6 9 101% 14
Toronto C09 2 $2,935,000 $1,467,500 $1,467,500 3 2 100% 13
Toronto C10 6 $5,159,900 $859,983 $898,450 3 6 100% 29
Toronto C11 - - - - 4 4 - -
Toronto C12 7 $6,203,000 $886,143 $853,000 16 16 100% 9
Toronto C13 2 $1,038,600 $519,300 $519,300 4 5 103% 8
Toronto C14 16 $8,441,400 $527,588 $470,400 24 33 99% 16
Toronto C15 24 $12,200,100 $508,338 $490,000 35 17 102% 12
Toronto East 73 $25,347,980 $347,233 $365,000 112 96 103% 15
Toronto E01 3 $1,203,100 $401,033 $420,000 7 9 102% 10
Toronto E02 4 $2,000,000 $500,000 $516,500 9 8 108% 4
Toronto E03 1 $214,000 $214,000 $214,000 3 3 97% 54
Toronto E04 11 $4,264,500 $387,682 $395,000 14 12 99% 16
Toronto E05 17 $6,925,280 $407,369 $412,000 20 13 106% 12
Toronto E06 - - - - - - - -
Toronto E07 2 $943,000 $471,500 $471,500 11 8 107% 5
Toronto E08 7 $2,074,400 $296,343 $357,500 9 7 99% 18
Toronto E09 8 $2,284,500 $285,563 $305,000 9 6 99% 12
Toronto E10 12 $3,162,300 $263,525 $273,500 9 6 104% 23
Toronto E11 8 $2,276,900 $284,613 $252,500 21 24 102% 15
SUMMARY OF EXISTING HOME TRANSACTIONSCONDOMINIUM TOWNHOUSES, MARCH 2015
Page 13
Industrial Leasing
July 2010 Page 3
Toronto Real Estate Board
Market Watch, March 2015
ALL TREB AREAS
Sales1 Dollar Volume1 Average Price1 Median Price1 New Listings2 Active Listings3 Avg. SP/LP4 Avg. DOM5
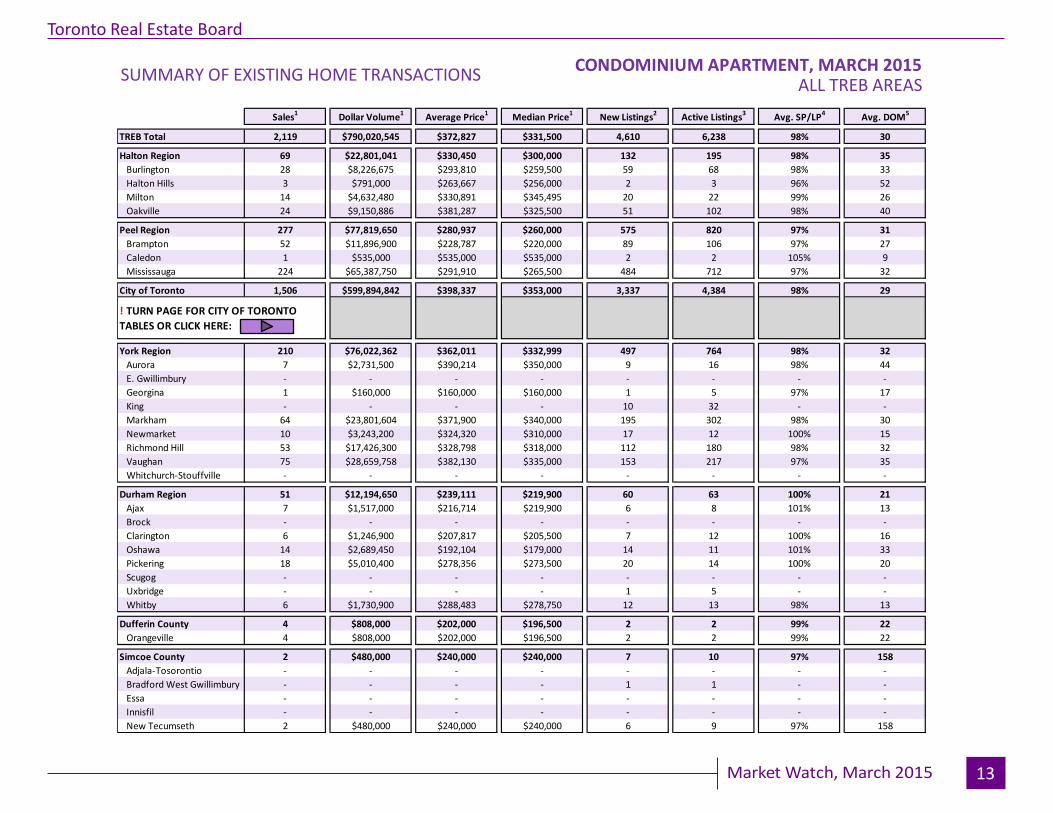
TREB Total 2,119 $790,020,545 $372,827 $331,500 4,610 6,238 98% 30- - - - - - - -
Halton Region 69 $22,801,041 $330,450 $300,000 132 195 98% 35
Burlington 28 $8,226,675 $293,810 $259,500 59 68 98% 33
Halton Hills 3 $791,000 $263,667 $256,000 2 3 96% 52
Milton 14 $4,632,480 $330,891 $345,495 20 22 99% 26
Oakville 24 $9,150,886 $381,287 $325,500 51 102 98% 40- - - - - - - -
Peel Region 277 $77,819,650 $280,937 $260,000 575 820 97% 31
Brampton 52 $11,896,900 $228,787 $220,000 89 106 97% 27
Caledon 1 $535,000 $535,000 $535,000 2 2 105% 9
Mississauga 224 $65,387,750 $291,910 $265,500 484 712 97% 32- - - - - - - -
City of Toronto 1,506 $599,894,842 $398,337 $353,000 3,337 4,384 98% 29
- - - - - - - -
York Region 210 $76,022,362 $362,011 $332,999 497 764 98% 32
Aurora 7 $2,731,500 $390,214 $350,000 9 16 98% 44
E. Gwillimbury - - - - - - - -
Georgina 1 $160,000 $160,000 $160,000 1 5 97% 17
King - - - - 10 32 - -
Markham 64 $23,801,604 $371,900 $340,000 195 302 98% 30
Newmarket 10 $3,243,200 $324,320 $310,000 17 12 100% 15
Richmond Hill 53 $17,426,300 $328,798 $318,000 112 180 98% 32
Vaughan 75 $28,659,758 $382,130 $335,000 153 217 97% 35
Whitchurch-Stouffville - - - - - - - -- - - - - - - -
Durham Region 51 $12,194,650 $239,111 $219,900 60 63 100% 21
Ajax 7 $1,517,000 $216,714 $219,900 6 8 101% 13
Brock - - - - - - - -
Clarington 6 $1,246,900 $207,817 $205,500 7 12 100% 16
Oshawa 14 $2,689,450 $192,104 $179,000 14 11 101% 33
Pickering 18 $5,010,400 $278,356 $273,500 20 14 100% 20
Scugog - - - - - - - -
Uxbridge - - - - 1 5 - -
Whitby 6 $1,730,900 $288,483 $278,750 12 13 98% 13- - - - - - - -
Dufferin County 4 $808,000 $202,000 $196,500 2 2 99% 22
Orangeville 4 $808,000 $202,000 $196,500 2 2 99% 22- - - - - - - -
Simcoe County 2 $480,000 $240,000 $240,000 7 10 97% 158
Adjala-Tosorontio - - - - - - - -
Bradford West Gwillimbury - - - - 1 1 - -
Essa - - - - - - - -
Innisfil - - - - - - - -
New Tecumseth 2 $480,000 $240,000 $240,000 6 9 97% 158
! TURN PAGE FOR CITY OF TORONTO
TABLES OR CLICK HERE:
SUMMARY OF EXISTING HOME TRANSACTIONSCONDOMINIUM APARTMENT, MARCH 2015
13
Page 14
Industrial Leasing
July 2010 Page 3
Toronto Real Estate Board
Market Watch, March 2015 14
CITY OF TORONTO MUNICIPAL BREAKDOWN
Sales1 Dollar Volume1 Average Price1 Median Price1 New Listings2 Active Listings3 Avg. SP/LP4 Avg. DOM5
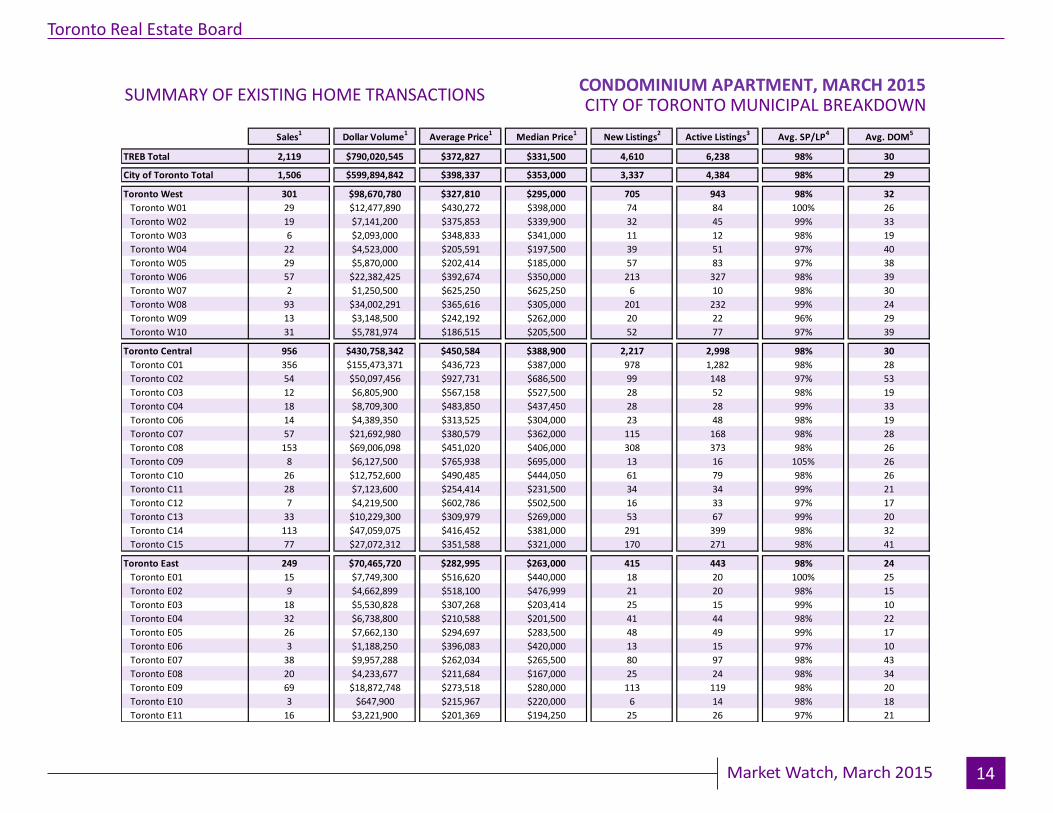
TREB Total 2,119 $790,020,545 $372,827 $331,500 4,610 6,238 98% 30
City of Toronto Total 1,506 $599,894,842 $398,337 $353,000 3,337 4,384 98% 29
Toronto West 301 $98,670,780 $327,810 $295,000 705 943 98% 32
Toronto W01 29 $12,477,890 $430,272 $398,000 74 84 100% 26
Toronto W02 19 $7,141,200 $375,853 $339,900 32 45 99% 33
Toronto W03 6 $2,093,000 $348,833 $341,000 11 12 98% 19
Toronto W04 22 $4,523,000 $205,591 $197,500 39 51 97% 40
Toronto W05 29 $5,870,000 $202,414 $185,000 57 83 97% 38
Toronto W06 57 $22,382,425 $392,674 $350,000 213 327 98% 39
Toronto W07 2 $1,250,500 $625,250 $625,250 6 10 98% 30
Toronto W08 93 $34,002,291 $365,616 $305,000 201 232 99% 24
Toronto W09 13 $3,148,500 $242,192 $262,000 20 22 96% 29
Toronto W10 31 $5,781,974 $186,515 $205,500 52 77 97% 39
Toronto Central 956 $430,758,342 $450,584 $388,900 2,217 2,998 98% 30
Toronto C01 356 $155,473,371 $436,723 $387,000 978 1,282 98% 28
Toronto C02 54 $50,097,456 $927,731 $686,500 99 148 97% 53
Toronto C03 12 $6,805,900 $567,158 $527,500 28 52 98% 19
Toronto C04 18 $8,709,300 $483,850 $437,450 28 28 99% 33
Toronto C06 14 $4,389,350 $313,525 $304,000 23 48 98% 19
Toronto C07 57 $21,692,980 $380,579 $362,000 115 168 98% 28
Toronto C08 153 $69,006,098 $451,020 $406,000 308 373 98% 26
Toronto C09 8 $6,127,500 $765,938 $695,000 13 16 105% 26
Toronto C10 26 $12,752,600 $490,485 $444,050 61 79 98% 26
Toronto C11 28 $7,123,600 $254,414 $231,500 34 34 99% 21
Toronto C12 7 $4,219,500 $602,786 $502,500 16 33 97% 17
Toronto C13 33 $10,229,300 $309,979 $269,000 53 67 99% 20
Toronto C14 113 $47,059,075 $416,452 $381,000 291 399 98% 32
Toronto C15 77 $27,072,312 $351,588 $321,000 170 271 98% 41
Toronto East 249 $70,465,720 $282,995 $263,000 415 443 98% 24
Toronto E01 15 $7,749,300 $516,620 $440,000 18 20 100% 25
Toronto E02 9 $4,662,899 $518,100 $476,999 21 20 98% 15
Toronto E03 18 $5,530,828 $307,268 $203,414 25 15 99% 10
Toronto E04 32 $6,738,800 $210,588 $201,500 41 44 98% 22
Toronto E05 26 $7,662,130 $294,697 $283,500 48 49 99% 17
Toronto E06 3 $1,188,250 $396,083 $420,000 13 15 97% 10
Toronto E07 38 $9,957,288 $262,034 $265,500 80 97 98% 43
Toronto E08 20 $4,233,677 $211,684 $167,000 25 24 98% 34
Toronto E09 69 $18,872,748 $273,518 $280,000 113 119 98% 20
Toronto E10 3 $647,900 $215,967 $220,000 6 14 98% 18
Toronto E11 16 $3,221,900 $201,369 $194,250 25 26 97% 21
SUMMARY OF EXISTING HOME TRANSACTIONSCONDOMINIUM APARTMENT, MARCH 2015
Page 15
Industrial Leasing
July 2010 Page 3
Toronto Real Estate Board
Market Watch, March 2015
ALL TREB AREAS
Sales1 Dollar Volume1 Average Price1 Median Price1 New Listings2 Active Listings3 Avg. SP/LP4 Avg. DOM5
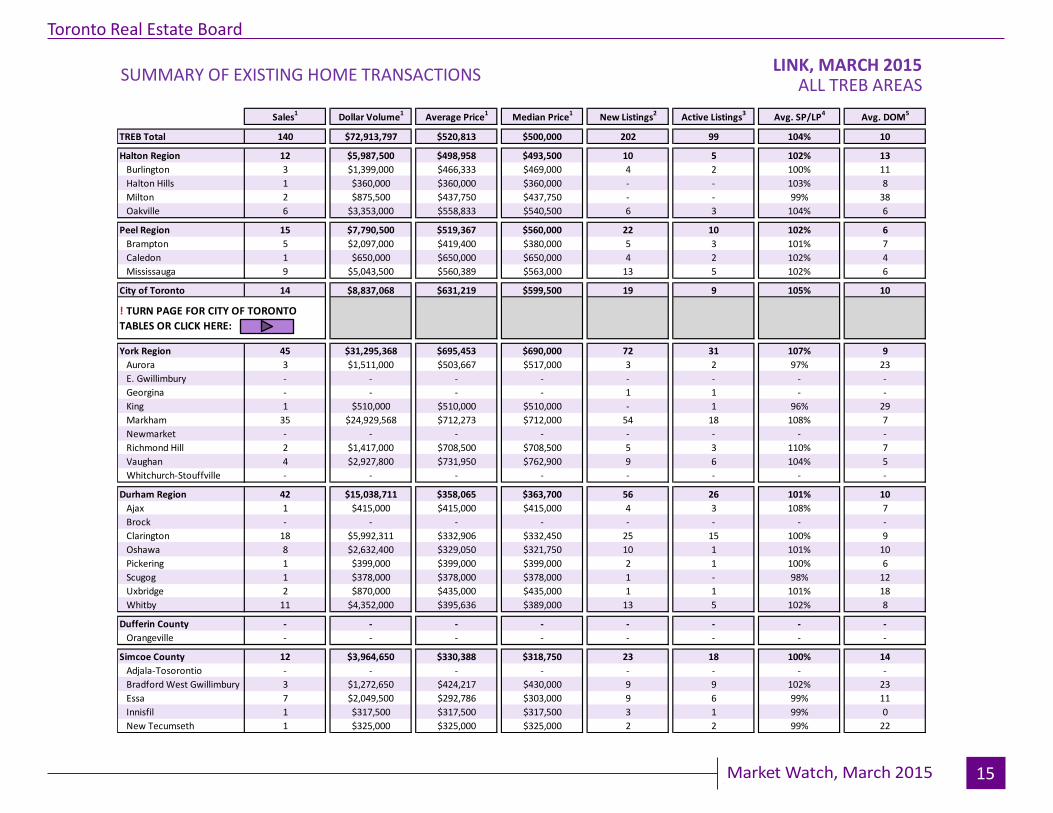
TREB Total 140 $72,913,797 $520,813 $500,000 202 99 104% 10- - - - - - - -
Halton Region 12 $5,987,500 $498,958 $493,500 10 5 102% 13
Burlington 3 $1,399,000 $466,333 $469,000 4 2 100% 11
Halton Hills 1 $360,000 $360,000 $360,000 - - 103% 8
Milton 2 $875,500 $437,750 $437,750 - - 99% 38
Oakville 6 $3,353,000 $558,833 $540,500 6 3 104% 6- - - - - - - -
Peel Region 15 $7,790,500 $519,367 $560,000 22 10 102% 6
Brampton 5 $2,097,000 $419,400 $380,000 5 3 101% 7
Caledon 1 $650,000 $650,000 $650,000 4 2 102% 4
Mississauga 9 $5,043,500 $560,389 $563,000 13 5 102% 6- - - - - - - -
City of Toronto 14 $8,837,068 $631,219 $599,500 19 9 105% 10
- - - - - - - -
York Region 45 $31,295,368 $695,453 $690,000 72 31 107% 9
Aurora 3 $1,511,000 $503,667 $517,000 3 2 97% 23
E. Gwillimbury - - - - - - - -
Georgina - - - - 1 1 - -
King 1 $510,000 $510,000 $510,000 - 1 96% 29
Markham 35 $24,929,568 $712,273 $712,000 54 18 108% 7
Newmarket - - - - - - - -
Richmond Hill 2 $1,417,000 $708,500 $708,500 5 3 110% 7
Vaughan 4 $2,927,800 $731,950 $762,900 9 6 104% 5
Whitchurch-Stouffville - - - - - - - -- - - - - - - -
Durham Region 42 $15,038,711 $358,065 $363,700 56 26 101% 10
Ajax 1 $415,000 $415,000 $415,000 4 3 108% 7
Brock - - - - - - - -
Clarington 18 $5,992,311 $332,906 $332,450 25 15 100% 9
Oshawa 8 $2,632,400 $329,050 $321,750 10 1 101% 10
Pickering 1 $399,000 $399,000 $399,000 2 1 100% 6
Scugog 1 $378,000 $378,000 $378,000 1 - 98% 12
Uxbridge 2 $870,000 $435,000 $435,000 1 1 101% 18
Whitby 11 $4,352,000 $395,636 $389,000 13 5 102% 8- - - - - - - -
Dufferin County - - - - - - - -
Orangeville - - - - - - - -- - - - - - - -
Simcoe County 12 $3,964,650 $330,388 $318,750 23 18 100% 14
Adjala-Tosorontio - - - - - - - -
Bradford West Gwillimbury 3 $1,272,650 $424,217 $430,000 9 9 102% 23
Essa 7 $2,049,500 $292,786 $303,000 9 6 99% 11
Innisfil 1 $317,500 $317,500 $317,500 3 1 99% 0
New Tecumseth 1 $325,000 $325,000 $325,000 2 2 99% 22
SUMMARY OF EXISTING HOME TRANSACTIONSLINK, MARCH 2015
! TURN PAGE FOR CITY OF TORONTO
TABLES OR CLICK HERE:
15
Page 16
Industrial Leasing
July 2010 Page 3
Toronto Real Estate Board
Market Watch, March 2015 16
CITY OF TORONTO MUNICIPAL BREAKDOWN
Sales1 Dollar Volume1 Average Price1 Median Price1 New Listings2 Active Listings3 Avg. SP/LP4 Avg. DOM5
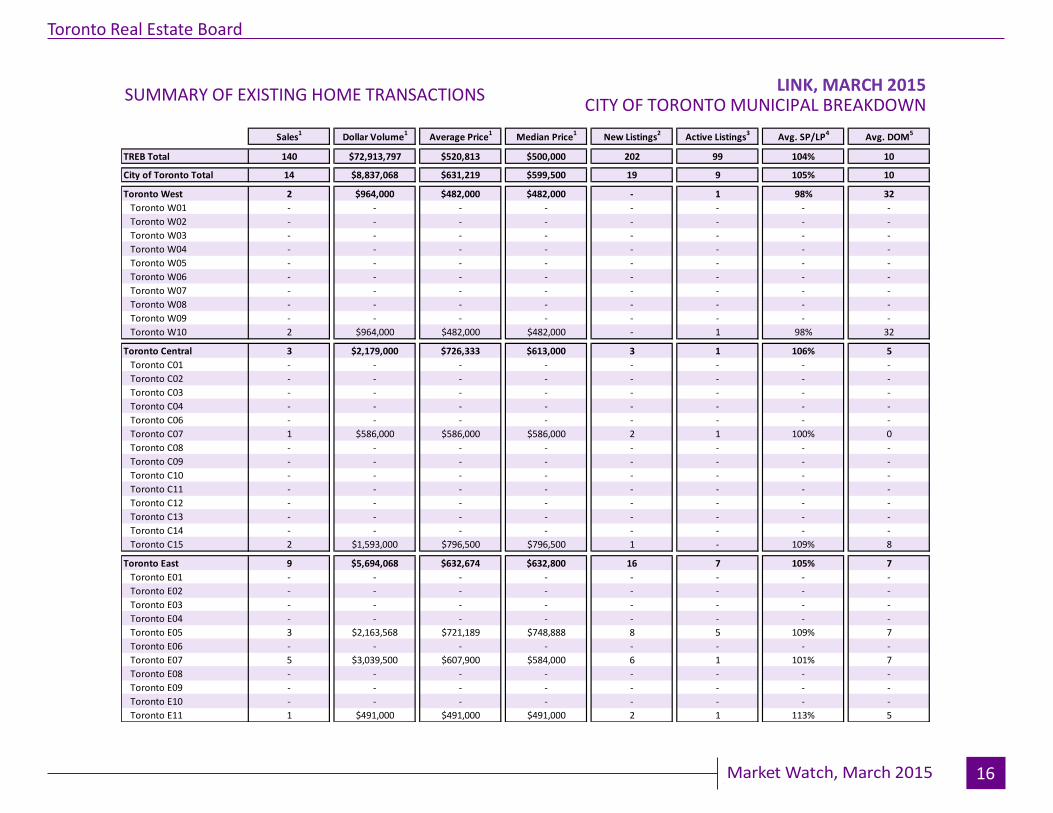
TREB Total 140 $72,913,797 $520,813 $500,000 202 99 104% 10
City of Toronto Total 14 $8,837,068 $631,219 $599,500 19 9 105% 10
Toronto West 2 $964,000 $482,000 $482,000 - 1 98% 32
Toronto W01 - - - - - - - -
Toronto W02 - - - - - - - -
Toronto W03 - - - - - - - -
Toronto W04 - - - - - - - -
Toronto W05 - - - - - - - -
Toronto W06 - - - - - - - -
Toronto W07 - - - - - - - -
Toronto W08 - - - - - - - -
Toronto W09 - - - - - - - -
Toronto W10 2 $964,000 $482,000 $482,000 - 1 98% 32
Toronto Central 3 $2,179,000 $726,333 $613,000 3 1 106% 5
Toronto C01 - - - - - - - -
Toronto C02 - - - - - - - -
Toronto C03 - - - - - - - -
Toronto C04 - - - - - - - -
Toronto C06 - - - - - - - -
Toronto C07 1 $586,000 $586,000 $586,000 2 1 100% 0
Toronto C08 - - - - - - - -
Toronto C09 - - - - - - - -
Toronto C10 - - - - - - - -
Toronto C11 - - - - - - - -
Toronto C12 - - - - - - - -
Toronto C13 - - - - - - - -
Toronto C14 - - - - - - - -
Toronto C15 2 $1,593,000 $796,500 $796,500 1 - 109% 8
Toronto East 9 $5,694,068 $632,674 $632,800 16 7 105% 7
Toronto E01 - - - - - - - -
Toronto E02 - - - - - - - -
Toronto E03 - - - - - - - -
Toronto E04 - - - - - - - -
Toronto E05 3 $2,163,568 $721,189 $748,888 8 5 109% 7
Toronto E06 - - - - - - - -
Toronto E07 5 $3,039,500 $607,900 $584,000 6 1 101% 7
Toronto E08 - - - - - - - -
Toronto E09 - - - - - - - -
Toronto E10 - - - - - - - -
Toronto E11 1 $491,000 $491,000 $491,000 2 1 113% 5
SUMMARY OF EXISTING HOME TRANSACTIONSLINK, MARCH 2015
Page 17
Industrial Leasing
July 2010 Page 3
Toronto Real Estate Board
Market Watch, March 2015
ALL TREB AREAS
Sales1 Dollar Volume1 Average Price1 Median Price1 New Listings2 Active Listings3 Avg. SP/LP4 Avg. DOM5
TREB Total 747 $390,413,130 $522,641 $476,000 1,023 590 102% 12- - - - - - - -
Halton Region 136 $67,005,688 $492,689 $455,500 189 126 100% 14
Burlington 22 $10,349,700 $470,441 $463,500 32 24 101% 15
Halton Hills 9 $3,830,000 $425,556 $428,000 4 3 102% 20
Milton 57 $24,061,100 $422,125 $424,000 76 32 100% 10
Oakville 48 $28,764,888 $599,269 $573,500 77 67 99% 16- - - - - - - -
Peel Region 147 $63,364,051 $431,048 $427,000 193 97 100% 11
Brampton 94 $37,222,681 $395,986 $399,500 125 63 100% 11
Caledon 12 $5,193,990 $432,833 $432,000 13 10 99% 13
Mississauga 41 $20,947,380 $510,912 $515,000 55 24 101% 8- - - - - - - -
City of Toronto 108 $80,785,295 $748,012 $660,000 164 114 103% 16
- - - - - - - -
York Region 218 $129,595,016 $594,473 $590,500 325 186 103% 11
Aurora 9 $4,469,000 $496,556 $485,000 14 6 106% 6
E. Gwillimbury 5 $1,976,900 $395,380 $369,000 5 2 100% 14
Georgina 4 $1,357,000 $339,250 $334,750 6 6 98% 17
King 4 $2,702,000 $675,500 $666,500 5 8 98% 22
Markham 49 $30,396,540 $620,338 $605,000 91 53 106% 13
Newmarket 15 $7,156,000 $477,067 $465,000 22 13 101% 11
Richmond Hill 65 $42,999,896 $661,537 $675,000 89 42 102% 11
Vaughan 56 $33,197,180 $592,807 $584,500 74 48 101% 10
Whitchurch-Stouffville 11 $5,340,500 $485,500 $487,000 19 8 102% 7- - - - - - - -
Durham Region 117 $43,207,030 $369,291 $368,000 128 49 103% 9
Ajax 27 $11,040,400 $408,904 $425,000 33 10 104% 8
Brock - - - - - - - -
Clarington 23 $6,869,900 $298,691 $286,100 19 6 101% 9
Oshawa 11 $3,321,330 $301,939 $297,000 13 6 101% 10
Pickering 16 $6,758,000 $422,375 $392,000 18 10 102% 17
Scugog - - - - - - - -
Uxbridge 1 $319,900 $319,900 $319,900 3 2 100% 3
Whitby 39 $14,897,500 $381,987 $379,500 42 15 103% 7- - - - - - - -
Dufferin County 4 $1,257,000 $314,250 $317,000 6 4 99% 19
Orangeville 4 $1,257,000 $314,250 $317,000 6 4 99% 19- - - - - - - -
Simcoe County 17 $5,199,050 $305,826 $300,000 18 14 99% 18
Adjala-Tosorontio - - - - - - - -
Bradford West Gwillimbury 3 $1,218,250 $406,083 $410,000 4 2 99% 7
Essa 3 $710,500 $236,833 $237,500 4 3 99% 18
Innisfil 6 $1,792,300 $298,717 $305,750 6 6 98% 31
New Tecumseth 5 $1,478,000 $295,600 $296,000 4 3 99% 10
! TURN PAGE FOR CITY OF TORONTO
TABLES OR CLICK HERE:
SUMMARY OF EXISTING HOME TRANSACTIONSATTACHED/ROW/TOWNHOUSE, MARCH 2015
17
Page 18
Industrial Leasing
July 2010 Page 3
Toronto Real Estate Board
Market Watch, March 2015 18
CITY OF TORONTO MUNICIPAL BREAKDOWN
Sales1 Dollar Volume1 Average Price1 Median Price1 New Listings2 Active Listings3 Avg. SP/LP4 Avg. DOM5
TREB Total 747 $390,413,130 $522,641 $476,000 1,023 590 102% 12
City of Toronto Total 108 $80,785,295 $748,012 $660,000 164 114 103% 16
Toronto West 24 $16,413,063 $683,878 $687,500 43 31 100% 15
Toronto W01 1 $793,000 $793,000 $793,000 2 3 94% 36
Toronto W02 2 $1,631,913 $815,957 $815,957 1 - 96% 13
Toronto W03 - - - - 5 5 - -
Toronto W04 2 $950,000 $475,000 $475,000 2 2 100% 10
Toronto W05 6 $2,879,150 $479,858 $478,500 10 6 100% 17
Toronto W06 3 $2,005,000 $668,333 $660,000 10 7 105% 6
Toronto W07 8 $6,269,000 $783,625 $741,500 8 2 100% 15
Toronto W08 2 $1,885,000 $942,500 $942,500 4 5 99% 15
Toronto W09 - - - - - - - -
Toronto W10 - - - - 1 1 - -
Toronto Central 37 $37,570,432 $1,015,417 $873,000 54 52 102% 23
Toronto C01 10 $8,968,507 $896,851 $864,350 20 18 108% 8
Toronto C02 7 $10,974,125 $1,567,732 $1,360,125 5 6 97% 78
Toronto C03 - - - - 1 1 - -
Toronto C04 1 $755,000 $755,000 $755,000 1 1 99% 49
Toronto C06 - - - - - - - -
Toronto C07 5 $5,117,800 $1,023,560 $873,000 4 4 102% 14
Toronto C08 6 $5,333,000 $888,833 $876,000 15 11 106% 5
Toronto C09 1 $1,350,000 $1,350,000 $1,350,000 - - 97% 10
Toronto C10 1 $992,000 $992,000 $992,000 - - 105% 2
Toronto C11 1 $786,000 $786,000 $786,000 1 - 105% 4
Toronto C12 - - - - - 1 - -
Toronto C13 4 $2,481,000 $620,250 $592,500 2 - 98% 10
Toronto C14 1 $813,000 $813,000 $813,000 5 10 98% 6
Toronto C15 - - - - - - - -
Toronto East 47 $26,801,800 $570,251 $543,000 67 31 105% 11
Toronto E01 7 $4,636,000 $662,286 $650,000 14 7 111% 6
Toronto E02 5 $4,062,000 $812,400 $842,000 3 1 102% 9
Toronto E03 2 $1,165,000 $582,500 $582,500 2 - 117% 7
Toronto E04 8 $4,862,900 $607,863 $600,000 17 12 104% 20
Toronto E05 1 $523,800 $523,800 $523,800 1 1 95% 34
Toronto E06 - - - - - - - -
Toronto E07 4 $2,134,000 $533,500 $545,000 4 - 106% 8
Toronto E08 2 $966,500 $483,250 $483,250 1 - 97% 30
Toronto E09 1 $463,000 $463,000 $463,000 1 - 103% 5
Toronto E10 2 $1,030,000 $515,000 $515,000 5 3 104% 1
Toronto E11 15 $6,958,600 $463,907 $490,000 19 7 105% 9
SUMMARY OF EXISTING HOME TRANSACTIONSATTACHED/ROW/TOWNHOUSE, MARCH 2015
Page 19
Industrial Leasing
July 2010 Page 3
Toronto Real Estate Board
Market Watch, March 2015
ALL TREB AREAS
Sales1 Dollar Volume1 Average Price1 Median Price1 New Listings2 Active Listings3 Avg. SP/LP4 Avg. DOM5
TREB Total 8 $2,507,900 $313,488 $185,000 20 32 98% 23- - - - - - - -
Halton Region 1 $185,000 $185,000 $185,000 - 2 95% 23
Burlington 1 $185,000 $185,000 $185,000 - - 95% 23
Halton Hills - - - - - - - -
Milton - - - - - - - -
Oakville - - - - - 2 - -- - - - - - - -
Peel Region - - - - - 1 - -
Brampton - - - - - - - -
Caledon - - - - - - - -
Mississauga - - - - - 1 - -- - - - - - - -
City of Toronto 7 $2,322,900 $331,843 $185,000 20 28 99% 23
- - - - - - - -
York Region - - - - - 1 - -
Aurora - - - - - - - -
E. Gwillimbury - - - - - - - -
Georgina - - - - - - - -
King - - - - - - - -
Markham - - - - - 1 - -
Newmarket - - - - - - - -
Richmond Hill - - - - - - - -
Vaughan - - - - - - - -
Whitchurch-Stouffville - - - - - - - -- - - - - - - -
Durham Region - - - - - - - -
Ajax - - - - - - - -
Brock - - - - - - - -
Clarington - - - - - - - -
Oshawa - - - - - - - -
Pickering - - - - - - - -
Scugog - - - - - - - -
Uxbridge - - - - - - - -
Whitby - - - - - - - -- - - - - - - -
Dufferin County - - - - - - - -
Orangeville - - - - - - - -- - - - - - - -
Simcoe County - - - - - - - -
Adjala-Tosorontio - - - - - - - -
Bradford West Gwillimbury - - - - - - - -
Essa - - - - - - - -
Innisfil - - - - - - - -
New Tecumseth - - - - - - - -
SUMMARY OF EXISTING HOME TRANSACTIONSCO-OP APARTMENT, MARCH 2015
! TURN PAGE FOR CITY OF TORONTO
TABLES OR CLICK HERE:
19
Page 20
Industrial Leasing
July 2010 Page 3
Toronto Real Estate Board
Market Watch, March 2015 20
CITY OF TORONTO MUNICIPAL BREAKDOWN
Sales1 Dollar Volume1 Average Price1 Median Price1 New Listings2 Active Listings3 Avg. SP/LP4 Avg. DOM5
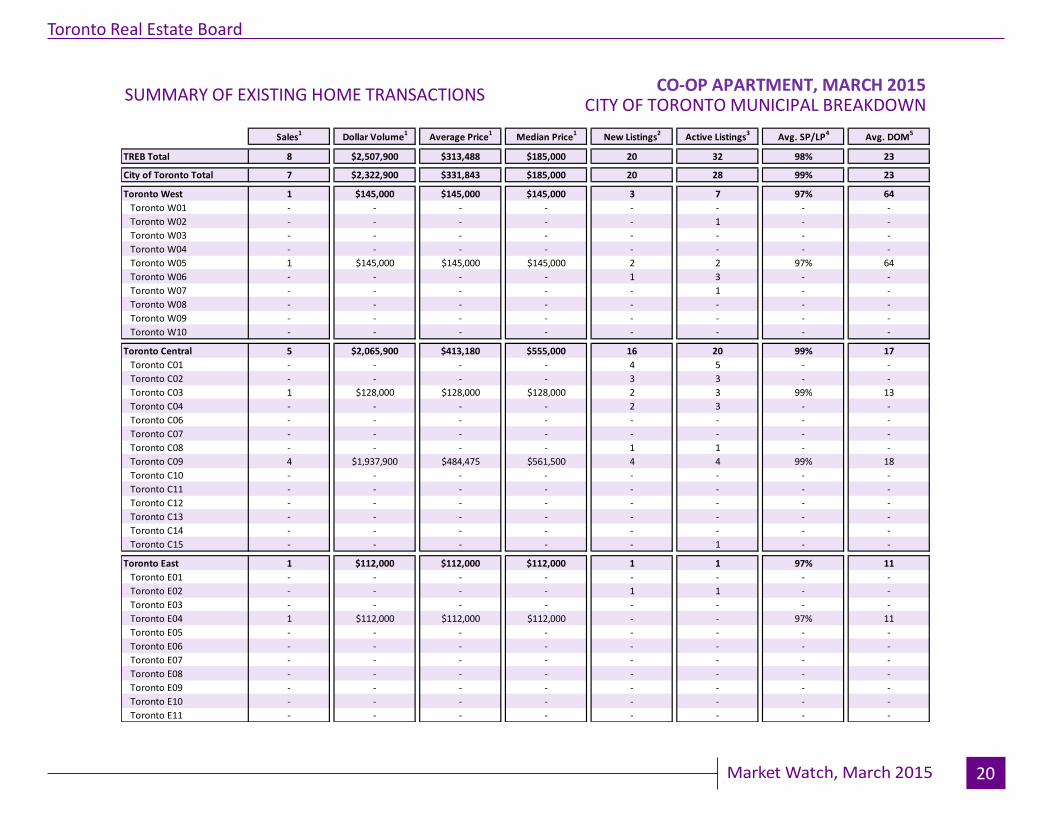
TREB Total 8 $2,507,900 $313,488 $185,000 20 32 98% 23
City of Toronto Total 7 $2,322,900 $331,843 $185,000 20 28 99% 23
Toronto West 1 $145,000 $145,000 $145,000 3 7 97% 64
Toronto W01 - - - - - - - -
Toronto W02 - - - - - 1 - -
Toronto W03 - - - - - - - -
Toronto W04 - - - - - - - -
Toronto W05 1 $145,000 $145,000 $145,000 2 2 97% 64
Toronto W06 - - - - 1 3 - -
Toronto W07 - - - - - 1 - -
Toronto W08 - - - - - - - -
Toronto W09 - - - - - - - -
Toronto W10 - - - - - - - -
Toronto Central 5 $2,065,900 $413,180 $555,000 16 20 99% 17
Toronto C01 - - - - 4 5 - -
Toronto C02 - - - - 3 3 - -
Toronto C03 1 $128,000 $128,000 $128,000 2 3 99% 13
Toronto C04 - - - - 2 3 - -
Toronto C06 - - - - - - - -
Toronto C07 - - - - - - - -
Toronto C08 - - - - 1 1 - -
Toronto C09 4 $1,937,900 $484,475 $561,500 4 4 99% 18
Toronto C10 - - - - - - - -
Toronto C11 - - - - - - - -
Toronto C12 - - - - - - - -
Toronto C13 - - - - - - - -
Toronto C14 - - - - - - - -
Toronto C15 - - - - - 1 - -
Toronto East 1 $112,000 $112,000 $112,000 1 1 97% 11
Toronto E01 - - - - - - - -
Toronto E02 - - - - 1 1 - -
Toronto E03 - - - - - - - -
Toronto E04 1 $112,000 $112,000 $112,000 - - 97% 11
Toronto E05 - - - - - - - -
Toronto E06 - - - - - - - -
Toronto E07 - - - - - - - -
Toronto E08 - - - - - - - -
Toronto E09 - - - - - - - -
Toronto E10 - - - - - - - -
Toronto E11 - - - - - - - -
SUMMARY OF EXISTING HOME TRANSACTIONSCO-OP APARTMENT, MARCH 2015
Page 21
Industrial Leasing
July 2010 Page 3
Toronto Real Estate Board
Market Watch, March 2015
ALL TREB AREAS
Sales1 Dollar Volume1 Average Price1 Median Price1 New Listings2 Active Listings3 Avg. SP/LP4 Avg. DOM5
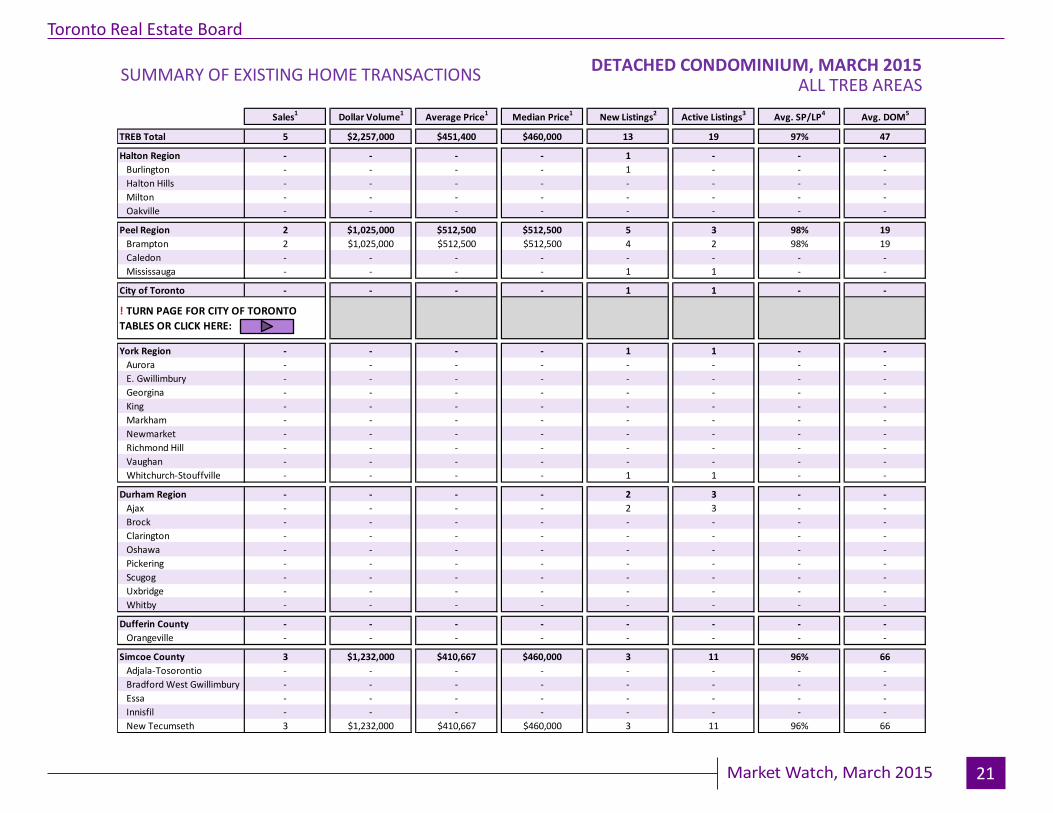
TREB Total 5 $2,257,000 $451,400 $460,000 13 19 97% 47- - - - - - - -
Halton Region - - - - 1 - - -
Burlington - - - - 1 - - -
Halton Hills - - - - - - - -
Milton - - - - - - - -
Oakville - - - - - - - -- - - - - - - -
Peel Region 2 $1,025,000 $512,500 $512,500 5 3 98% 19
Brampton 2 $1,025,000 $512,500 $512,500 4 2 98% 19
Caledon - - - - - - - -
Mississauga - - - - 1 1 - -- - - - - - - -
City of Toronto - - - - 1 1 - -
- - - - - - - -
York Region - - - - 1 1 - -
Aurora - - - - - - - -
E. Gwillimbury - - - - - - - -
Georgina - - - - - - - -
King - - - - - - - -
Markham - - - - - - - -
Newmarket - - - - - - - -
Richmond Hill - - - - - - - -
Vaughan - - - - - - - -
Whitchurch-Stouffville - - - - 1 1 - -- - - - - - - -
Durham Region - - - - 2 3 - -
Ajax - - - - 2 3 - -
Brock - - - - - - - -
Clarington - - - - - - - -
Oshawa - - - - - - - -
Pickering - - - - - - - -
Scugog - - - - - - - -
Uxbridge - - - - - - - -
Whitby - - - - - - - -- - - - - - - -
Dufferin County - - - - - - - -
Orangeville - - - - - - - -- - - - - - - -
Simcoe County 3 $1,232,000 $410,667 $460,000 3 11 96% 66
Adjala-Tosorontio - - - - - - - -
Bradford West Gwillimbury - - - - - - - -
Essa - - - - - - - -
Innisfil - - - - - - - -
New Tecumseth 3 $1,232,000 $410,667 $460,000 3 11 96% 66
! TURN PAGE FOR CITY OF TORONTO
TABLES OR CLICK HERE:
SUMMARY OF EXISTING HOME TRANSACTIONSDETACHED CONDOMINIUM, MARCH 2015
21
Page 22
Industrial Leasing
July 2010 Page 3
Toronto Real Estate Board
Market Watch, March 2015 22
CITY OF TORONTO MUNICIPAL BREAKDOWN
Sales1 Dollar Volume1 Average Price1 Median Price1 New Listings2 Active Listings3 Avg. SP/LP4 Avg. DOM5
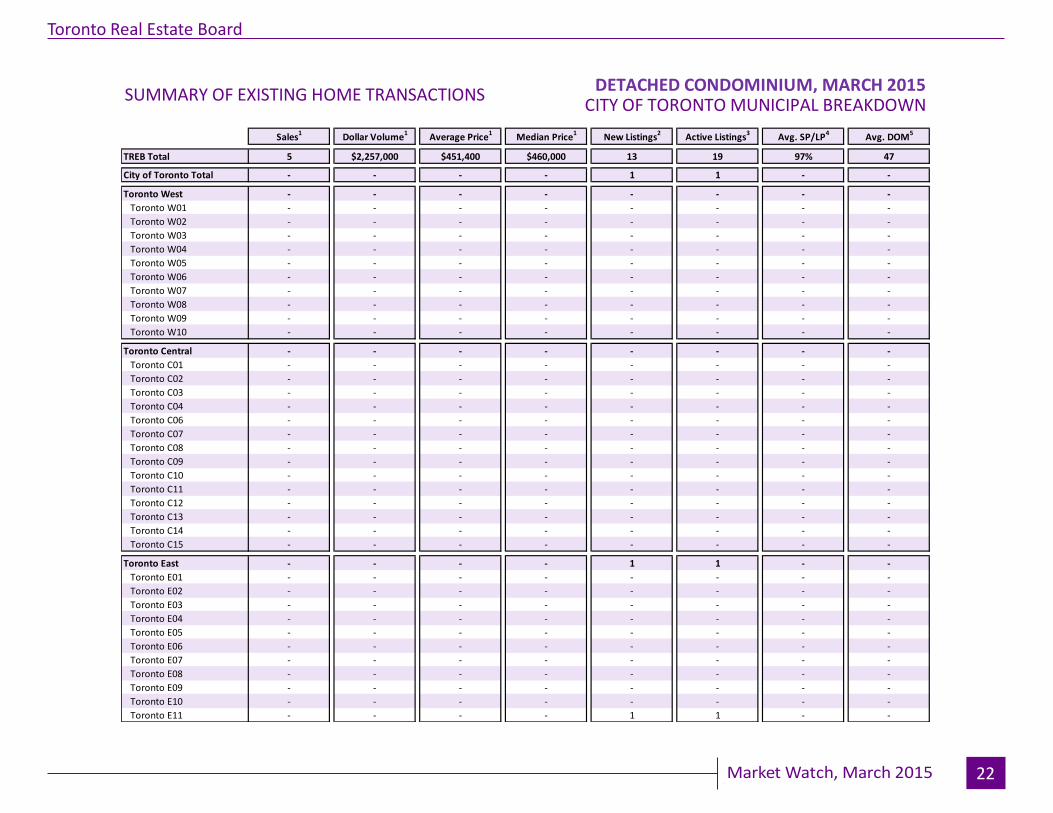
TREB Total 5 $2,257,000 $451,400 $460,000 13 19 97% 47
City of Toronto Total - - - - 1 1 - -
Toronto West - - - - - - - -
Toronto W01 - - - - - - - -
Toronto W02 - - - - - - - -
Toronto W03 - - - - - - - -
Toronto W04 - - - - - - - -
Toronto W05 - - - - - - - -
Toronto W06 - - - - - - - -
Toronto W07 - - - - - - - -
Toronto W08 - - - - - - - -
Toronto W09 - - - - - - - -
Toronto W10 - - - - - - - -
Toronto Central - - - - - - - -
Toronto C01 - - - - - - - -
Toronto C02 - - - - - - - -
Toronto C03 - - - - - - - -
Toronto C04 - - - - - - - -
Toronto C06 - - - - - - - -
Toronto C07 - - - - - - - -
Toronto C08 - - - - - - - -
Toronto C09 - - - - - - - -
Toronto C10 - - - - - - - -
Toronto C11 - - - - - - - -
Toronto C12 - - - - - - - -
Toronto C13 - - - - - - - -
Toronto C14 - - - - - - - -
Toronto C15 - - - - - - - -
Toronto East - - - - 1 1 - -
Toronto E01 - - - - - - - -
Toronto E02 - - - - - - - -
Toronto E03 - - - - - - - -
Toronto E04 - - - - - - - -
Toronto E05 - - - - - - - -
Toronto E06 - - - - - - - -
Toronto E07 - - - - - - - -
Toronto E08 - - - - - - - -
Toronto E09 - - - - - - - -
Toronto E10 - - - - - - - -
Toronto E11 - - - - 1 1 - -
SUMMARY OF EXISTING HOME TRANSACTIONSDETACHED CONDOMINIUM, MARCH 2015
Page 23
Industrial Leasing
July 2010 Page 3
Toronto Real Estate Board
Market Watch, March 2015 23
ALL TREB AREAS
Sales1 Dollar Volume1 Average Price1 Median Price1 New Listings2 Active Listings3 Avg. SP/LP4 Avg. DOM5
TREB Total 4 $1,051,000 $262,750 $255,000 9 17 94% 22- - - - - - - -
Halton Region - - - - - - - -
Burlington - - - - - - - -
Halton Hills - - - - - - - -
Milton - - - - - - - -
Oakville - - - - - - - -- - - - - - - -
Peel Region - - - - - - - -
Brampton - - - - - - - -
Caledon - - - - - - - -
Mississauga - - - - - - - -- - - - - - - -
City of Toronto 4 $1,051,000 $262,750 $255,000 9 17 94% 22
- - - - - - - -
York Region - - - - - - - -
Aurora - - - - - - - -
E. Gwillimbury - - - - - - - -
Georgina - - - - - - - -
King - - - - - - - -
Markham - - - - - - - -
Newmarket - - - - - - - -
Richmond Hill - - - - - - - -
Vaughan - - - - - - - -
Whitchurch-Stouffville - - - - - - - -- - - - - - - -
Durham Region - - - - - - - -
Ajax - - - - - - - -
Brock - - - - - - - -
Clarington - - - - - - - -
Oshawa - - - - - - - -
Pickering - - - - - - - -
Scugog - - - - - - - -
Uxbridge - - - - - - - -
Whitby - - - - - - - -- - - - - - - -
Dufferin County - - - - - - - -
Orangeville - - - - - - - -- - - - - - - -
Simcoe County - - - - - - - -
Adjala-Tosorontio - - - - - - - -
Bradford West Gwillimbury - - - - - - - -
Essa - - - - - - - -
Innisfil - - - - - - - -
New Tecumseth - - - - - - - -
! TURN PAGE FOR CITY OF TORONTO
TABLES OR CLICK HERE:
SUMMARY OF EXISTING HOME TRANSACTIONSCO-OWNERSHIP APARTMENT, MARCH 2015
Page 24
Industrial Leasing
July 2010 Page 3
Toronto Real Estate Board
Market Watch, March 2015 24
CITY OF TORONTO MUNICIPAL BREAKDOWN
Sales1 Dollar Volume1 Average Price1 Median Price1 New Listings2 Active Listings3 Avg. SP/LP4 Avg. DOM5
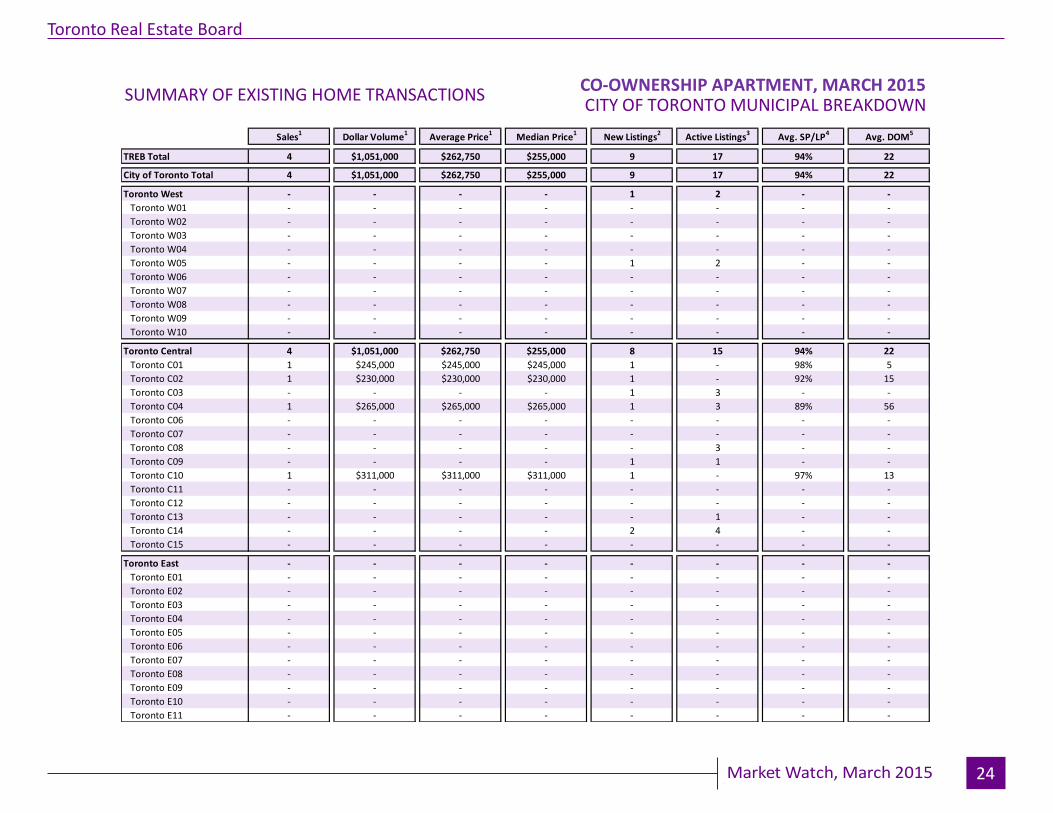
TREB Total 4 $1,051,000 $262,750 $255,000 9 17 94% 22
City of Toronto Total 4 $1,051,000 $262,750 $255,000 9 17 94% 22
Toronto West - - - - 1 2 - -
Toronto W01 - - - - - - - -
Toronto W02 - - - - - - - -
Toronto W03 - - - - - - - -
Toronto W04 - - - - - - - -
Toronto W05 - - - - 1 2 - -
Toronto W06 - - - - - - - -
Toronto W07 - - - - - - - -
Toronto W08 - - - - - - - -
Toronto W09 - - - - - - - -
Toronto W10 - - - - - - - -
Toronto Central 4 $1,051,000 $262,750 $255,000 8 15 94% 22
Toronto C01 1 $245,000 $245,000 $245,000 1 - 98% 5
Toronto C02 1 $230,000 $230,000 $230,000 1 - 92% 15
Toronto C03 - - - - 1 3 - -
Toronto C04 1 $265,000 $265,000 $265,000 1 3 89% 56
Toronto C06 - - - - - - - -
Toronto C07 - - - - - - - -
Toronto C08 - - - - - 3 - -
Toronto C09 - - - - 1 1 - -
Toronto C10 1 $311,000 $311,000 $311,000 1 - 97% 13
Toronto C11 - - - - - - - -
Toronto C12 - - - - - - - -
Toronto C13 - - - - - 1 - -
Toronto C14 - - - - 2 4 - -
Toronto C15 - - - - - - - -
Toronto East - - - - - - - -
Toronto E01 - - - - - - - -
Toronto E02 - - - - - - - -
Toronto E03 - - - - - - - -
Toronto E04 - - - - - - - -
Toronto E05 - - - - - - - -
Toronto E06 - - - - - - - -
Toronto E07 - - - - - - - -
Toronto E08 - - - - - - - -
Toronto E09 - - - - - - - -
Toronto E10 - - - - - - - -
Toronto E11 - - - - - - - -
SUMMARY OF EXISTING HOME TRANSACTIONSCO-OWNERSHIP APARTMENT, MARCH 2015
Page 25
Industrial Leasing
July 2010 Page 3
Toronto Real Estate Board
Market Watch, March 2015 25
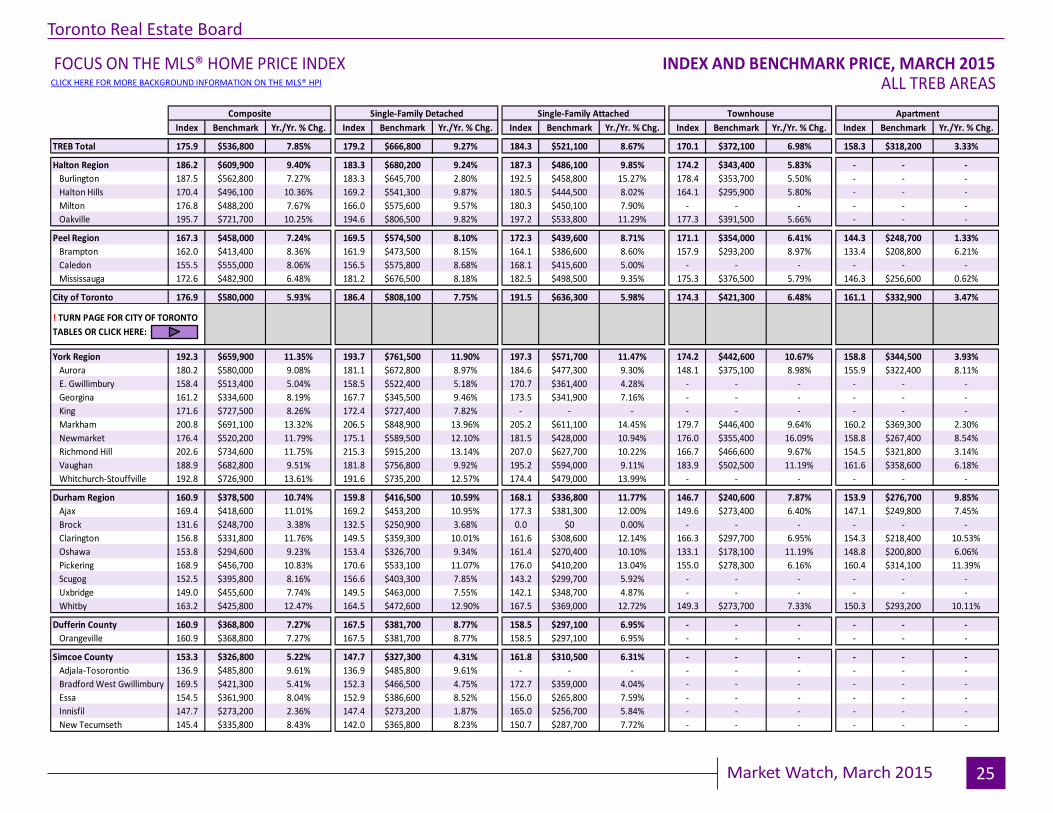
FOCUS ON THE MLS® HOME PRICE INDEX INDEX AND BENCHMARK PRICE, MARCH 2015ALL TREB AREAS
Index Benchmark Yr./Yr. % Chg. Index Benchmark Yr./Yr. % Chg. Index Benchmark Yr./Yr. % Chg. Index Benchmark Yr./Yr. % Chg. Index Benchmark Yr./Yr. % Chg.
TREB Total 175.9 $536,800 7.85% 179.2 $666,800 9.27% 184.3 $521,100 8.67% 170.1 $372,100 6.98% 158.3 $318,200 3.33%
Halton Region 186.2 $609,900 9.40% 183.3 $680,200 9.24% 187.3 $486,100 9.85% 174.2 $343,400 5.83% - - -
Burlington 187.5 $562,800 7.27% 183.3 $645,700 2.80% 192.5 $458,800 15.27% 178.4 $353,700 5.50% - - -
Halton Hills 170.4 $496,100 10.36% 169.2 $541,300 9.87% 180.5 $444,500 8.02% 164.1 $295,900 5.80% - - -
Milton 176.8 $488,200 7.67% 166.0 $575,600 9.57% 180.3 $450,100 7.90% - - - - - -
Oakville 195.7 $721,700 10.25% 194.6 $806,500 9.82% 197.2 $533,800 11.29% 177.3 $391,500 5.66% - - -
Peel Region 167.3 $458,000 7.24% 169.5 $574,500 8.10% 172.3 $439,600 8.71% 171.1 $354,000 6.41% 144.3 $248,700 1.33%
Brampton 162.0 $413,400 8.36% 161.9 $473,500 8.15% 164.1 $386,600 8.60% 157.9 $293,200 8.97% 133.4 $208,800 6.21%
Caledon 155.5 $555,000 8.06% 156.5 $575,800 8.68% 168.1 $415,600 5.00% - - - - - -
Mississauga 172.6 $482,900 6.48% 181.2 $676,500 8.18% 182.5 $498,500 9.35% 175.3 $376,500 5.79% 146.3 $256,600 0.62%
City of Toronto 176.9 $580,000 5.93% 186.4 $808,100 7.75% 191.5 $636,300 5.98% 174.3 $421,300 6.48% 161.1 $332,900 3.47%
York Region 192.3 $659,900 11.35% 193.7 $761,500 11.90% 197.3 $571,700 11.47% 174.2 $442,600 10.67% 158.8 $344,500 3.93%
Aurora 180.2 $580,000 9.08% 181.1 $672,800 8.97% 184.6 $477,300 9.30% 148.1 $375,100 8.98% 155.9 $322,400 8.11%
E. Gwillimbury 158.4 $513,400 5.04% 158.5 $522,400 5.18% 170.7 $361,400 4.28% - - - - - -
Georgina 161.2 $334,600 8.19% 167.7 $345,500 9.46% 173.5 $341,900 7.16% - - - - - -
King 171.6 $727,500 8.26% 172.4 $727,400 7.82% - - - - - - - - -
Markham 200.8 $691,100 13.32% 206.5 $848,900 13.96% 205.2 $611,100 14.45% 179.7 $446,400 9.64% 160.2 $369,300 2.30%
Newmarket 176.4 $520,200 11.79% 175.1 $589,500 12.10% 181.5 $428,000 10.94% 176.0 $355,400 16.09% 158.8 $267,400 8.54%
Richmond Hill 202.6 $734,600 11.75% 215.3 $915,200 13.14% 207.0 $627,700 10.22% 166.7 $466,600 9.67% 154.5 $321,800 3.14%
Vaughan 188.9 $682,800 9.51% 181.8 $756,800 9.92% 195.2 $594,000 9.11% 183.9 $502,500 11.19% 161.6 $358,600 6.18%
Whitchurch-Stouffville 192.8 $726,900 13.61% 191.6 $735,200 12.57% 174.4 $479,000 13.99% - - - - - -
Durham Region 160.9 $378,500 10.74% 159.8 $416,500 10.59% 168.1 $336,800 11.77% 146.7 $240,600 7.87% 153.9 $276,700 9.85%
Ajax 169.4 $418,600 11.01% 169.2 $453,200 10.95% 177.3 $381,300 12.00% 149.6 $273,400 6.40% 147.1 $249,800 7.45%
Brock 131.6 $248,700 3.38% 132.5 $250,900 3.68% 0.0 $0 0.00% - - - - - -
Clarington 156.8 $331,800 11.76% 149.5 $359,300 10.01% 161.6 $308,600 12.14% 166.3 $297,700 6.95% 154.3 $218,400 10.53%
Oshawa 153.8 $294,600 9.23% 153.4 $326,700 9.34% 161.4 $270,400 10.10% 133.1 $178,100 11.19% 148.8 $200,800 6.06%
Pickering 168.9 $456,700 10.83% 170.6 $533,100 11.07% 176.0 $410,200 13.04% 155.0 $278,300 6.16% 160.4 $314,100 11.39%
Scugog 152.5 $395,800 8.16% 156.6 $403,300 7.85% 143.2 $299,700 5.92% - - - - - -
Uxbridge 149.0 $455,600 7.74% 149.5 $463,000 7.55% 142.1 $348,700 4.87% - - - - - -
Whitby 163.2 $425,800 12.47% 164.5 $472,600 12.90% 167.5 $369,000 12.72% 149.3 $273,700 7.33% 150.3 $293,200 10.11%
Dufferin County 160.9 $368,800 7.27% 167.5 $381,700 8.77% 158.5 $297,100 6.95% - - - - - -
Orangeville 160.9 $368,800 7.27% 167.5 $381,700 8.77% 158.5 $297,100 6.95% - - - - - -
Simcoe County 153.3 $326,800 5.22% 147.7 $327,300 4.31% 161.8 $310,500 6.31% - - - - - -
Adjala-Tosorontio 136.9 $485,800 9.61% 136.9 $485,800 9.61% - - - - - - - - -
Bradford West Gwillimbury 169.5 $421,300 5.41% 152.3 $466,500 4.75% 172.7 $359,000 4.04% - - - - - -
Essa 154.5 $361,900 8.04% 152.9 $386,600 8.52% 156.0 $265,800 7.59% - - - - - -
Innisfil 147.7 $273,200 2.36% 147.4 $273,200 1.87% 165.0 $256,700 5.84% - - - - - -
New Tecumseth 145.4 $335,800 8.43% 142.0 $365,800 8.23% 150.7 $287,700 7.72% - - - - - -
Townhouse Apartment
! TURN PAGE FOR CITY OF TORONTO
TABLES OR CLICK HERE:
Composite Single-Family Detached Single-Family Attached
CLICK HERE FOR MORE BACKGROUND INFORMATION ON THE MLS® HPI
Page 26
Industrial Leasing
July 2010 Page 3
Toronto Real Estate Board
Market Watch, March 2015 26
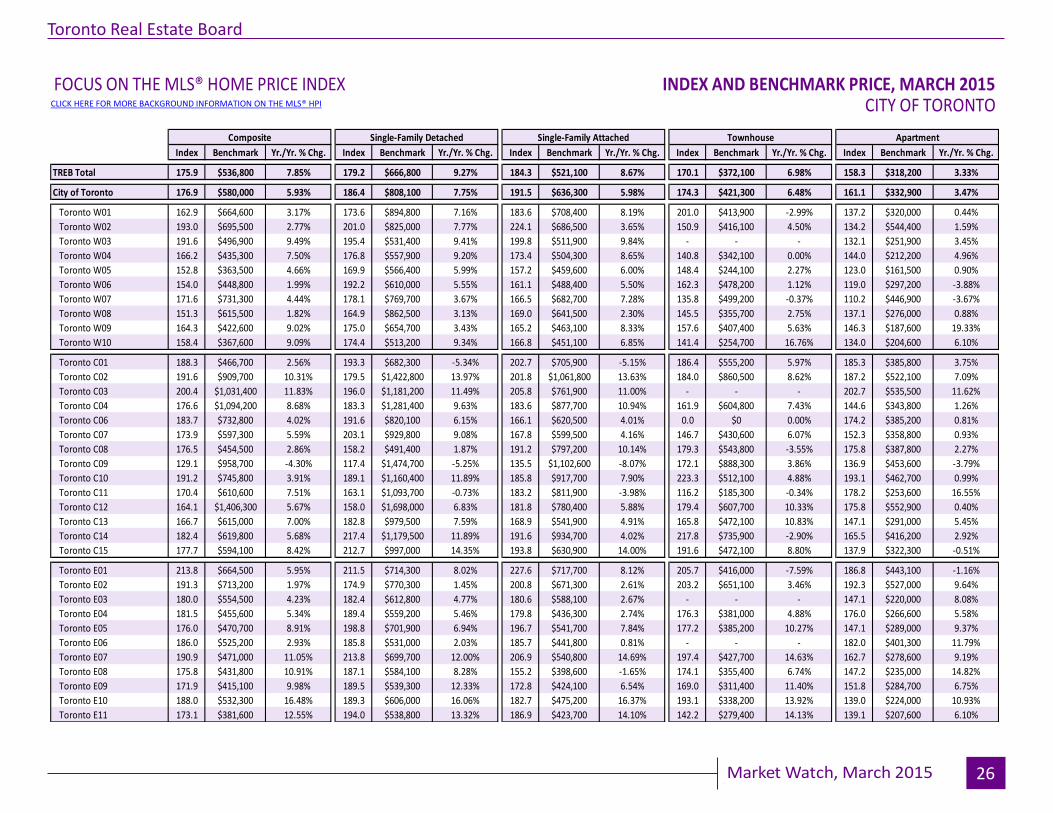
FOCUS ON THE MLS® HOME PRICE INDEX INDEX AND BENCHMARK PRICE, MARCH 2015CITY OF TORONTO
Index Benchmark Yr./Yr. % Chg. Index Benchmark Yr./Yr. % Chg. Index Benchmark Yr./Yr. % Chg. Index Benchmark Yr./Yr. % Chg. Index Benchmark Yr./Yr. % Chg.
TREB Total 175.9 $536,800 7.85% 179.2 $666,800 9.27% 184.3 $521,100 8.67% 170.1 $372,100 6.98% 158.3 $318,200 3.33%
City of Toronto 176.9 $580,000 5.93% 186.4 $808,100 7.75% 191.5 $636,300 5.98% 174.3 $421,300 6.48% 161.1 $332,900 3.47%
Toronto W01 162.9 $664,600 3.17% 173.6 $894,800 7.16% 183.6 $708,400 8.19% 201.0 $413,900 -2.99% 137.2 $320,000 0.44%
Toronto W02 193.0 $695,500 2.77% 201.0 $825,000 7.77% 224.1 $686,500 3.65% 150.9 $416,100 4.50% 134.2 $544,400 1.59%
Toronto W03 191.6 $496,900 9.49% 195.4 $531,400 9.41% 199.8 $511,900 9.84% - - - 132.1 $251,900 3.45%
Toronto W04 166.2 $435,300 7.50% 176.8 $557,900 9.20% 173.4 $504,300 8.65% 140.8 $342,100 0.00% 144.0 $212,200 4.96%
Toronto W05 152.8 $363,500 4.66% 169.9 $566,400 5.99% 157.2 $459,600 6.00% 148.4 $244,100 2.27% 123.0 $161,500 0.90%
Toronto W06 154.0 $448,800 1.99% 192.2 $610,000 5.55% 161.1 $488,400 5.50% 162.3 $478,200 1.12% 119.0 $297,200 -3.88%
Toronto W07 171.6 $731,300 4.44% 178.1 $769,700 3.67% 166.5 $682,700 7.28% 135.8 $499,200 -0.37% 110.2 $446,900 -3.67%
Toronto W08 151.3 $615,500 1.82% 164.9 $862,500 3.13% 169.0 $641,500 2.30% 145.5 $355,700 2.75% 137.1 $276,000 0.88%
Toronto W09 164.3 $422,600 9.02% 175.0 $654,700 3.43% 165.2 $463,100 8.33% 157.6 $407,400 5.63% 146.3 $187,600 19.33%
Toronto W10 158.4 $367,600 9.09% 174.4 $513,200 9.34% 166.8 $451,100 6.85% 141.4 $254,700 16.76% 134.0 $204,600 6.10%
Toronto C01 188.3 $466,700 2.56% 193.3 $682,300 -5.34% 202.7 $705,900 -5.15% 186.4 $555,200 5.97% 185.3 $385,800 3.75%
Toronto C02 191.6 $909,700 10.31% 179.5 $1,422,800 13.97% 201.8 $1,061,800 13.63% 184.0 $860,500 8.62% 187.2 $522,100 7.09%
Toronto C03 200.4 $1,031,400 11.83% 196.0 $1,181,200 11.49% 205.8 $761,900 11.00% - - - 202.7 $535,500 11.62%
Toronto C04 176.6 $1,094,200 8.68% 183.3 $1,281,400 9.63% 183.6 $877,700 10.94% 161.9 $604,800 7.43% 144.6 $343,800 1.26%
Toronto C06 183.7 $732,800 4.02% 191.6 $820,100 6.15% 166.1 $620,500 4.01% 0.0 $0 0.00% 174.2 $385,200 0.81%
Toronto C07 173.9 $597,300 5.59% 203.1 $929,800 9.08% 167.8 $599,500 4.16% 146.7 $430,600 6.07% 152.3 $358,800 0.93%
Toronto C08 176.5 $454,500 2.86% 158.2 $491,400 1.87% 191.2 $797,200 10.14% 179.3 $543,800 -3.55% 175.8 $387,800 2.27%
Toronto C09 129.1 $958,700 -4.30% 117.4 $1,474,700 -5.25% 135.5 $1,102,600 -8.07% 172.1 $888,300 3.86% 136.9 $453,600 -3.79%
Toronto C10 191.2 $745,800 3.91% 189.1 $1,160,400 11.89% 185.8 $917,700 7.90% 223.3 $512,100 4.88% 193.1 $462,700 0.99%
Toronto C11 170.4 $610,600 7.51% 163.1 $1,093,700 -0.73% 183.2 $811,900 -3.98% 116.2 $185,300 -0.34% 178.2 $253,600 16.55%
Toronto C12 164.1 $1,406,300 5.67% 158.0 $1,698,000 6.83% 181.8 $780,400 5.88% 179.4 $607,700 10.33% 175.8 $552,900 0.40%
Toronto C13 166.7 $615,000 7.00% 182.8 $979,500 7.59% 168.9 $541,900 4.91% 165.8 $472,100 10.83% 147.1 $291,000 5.45%
Toronto C14 182.4 $619,800 5.68% 217.4 $1,179,500 11.89% 191.6 $934,700 4.02% 217.8 $735,900 -2.90% 165.5 $416,200 2.92%
Toronto C15 177.7 $594,100 8.42% 212.7 $997,000 14.35% 193.8 $630,900 14.00% 191.6 $472,100 8.80% 137.9 $322,300 -0.51%
Toronto E01 213.8 $664,500 5.95% 211.5 $714,300 8.02% 227.6 $717,700 8.12% 205.7 $416,000 -7.59% 186.8 $443,100 -1.16%
Toronto E02 191.3 $713,200 1.97% 174.9 $770,300 1.45% 200.8 $671,300 2.61% 203.2 $651,100 3.46% 192.3 $527,000 9.64%
Toronto E03 180.0 $554,500 4.23% 182.4 $612,800 4.77% 180.6 $588,100 2.67% - - - 147.1 $220,000 8.08%
Toronto E04 181.5 $455,600 5.34% 189.4 $559,200 5.46% 179.8 $436,300 2.74% 176.3 $381,000 4.88% 176.0 $266,600 5.58%
Toronto E05 176.0 $470,700 8.91% 198.8 $701,900 6.94% 196.7 $541,700 7.84% 177.2 $385,200 10.27% 147.1 $289,000 9.37%
Toronto E06 186.0 $525,200 2.93% 185.8 $531,000 2.03% 185.7 $441,800 0.81% - - - 182.0 $401,300 11.79%
Toronto E07 190.9 $471,000 11.05% 213.8 $699,700 12.00% 206.9 $540,800 14.69% 197.4 $427,700 14.63% 162.7 $278,600 9.19%
Toronto E08 175.8 $431,800 10.91% 187.1 $584,100 8.28% 155.2 $398,600 -1.65% 174.1 $355,400 6.74% 147.2 $235,000 14.82%
Toronto E09 171.9 $415,100 9.98% 189.5 $539,300 12.33% 172.8 $424,100 6.54% 169.0 $311,400 11.40% 151.8 $284,700 6.75%
Toronto E10 188.0 $532,300 16.48% 189.3 $606,000 16.06% 182.7 $475,200 16.37% 193.1 $338,200 13.92% 139.0 $224,000 10.93%
Toronto E11 173.1 $381,600 12.55% 194.0 $538,800 13.32% 186.9 $423,700 14.10% 142.2 $279,400 14.13% 139.1 $207,600 6.10%
ApartmentComposite Single-Family Detached Single-Family Attached Townhouse
CLICK HERE FOR MORE BACKGROUND INFORMATION ON THE MLS® HPI
Page 27
July 2010 Page 3
Toronto Real Estate Board
Market Watch, March 2015 27
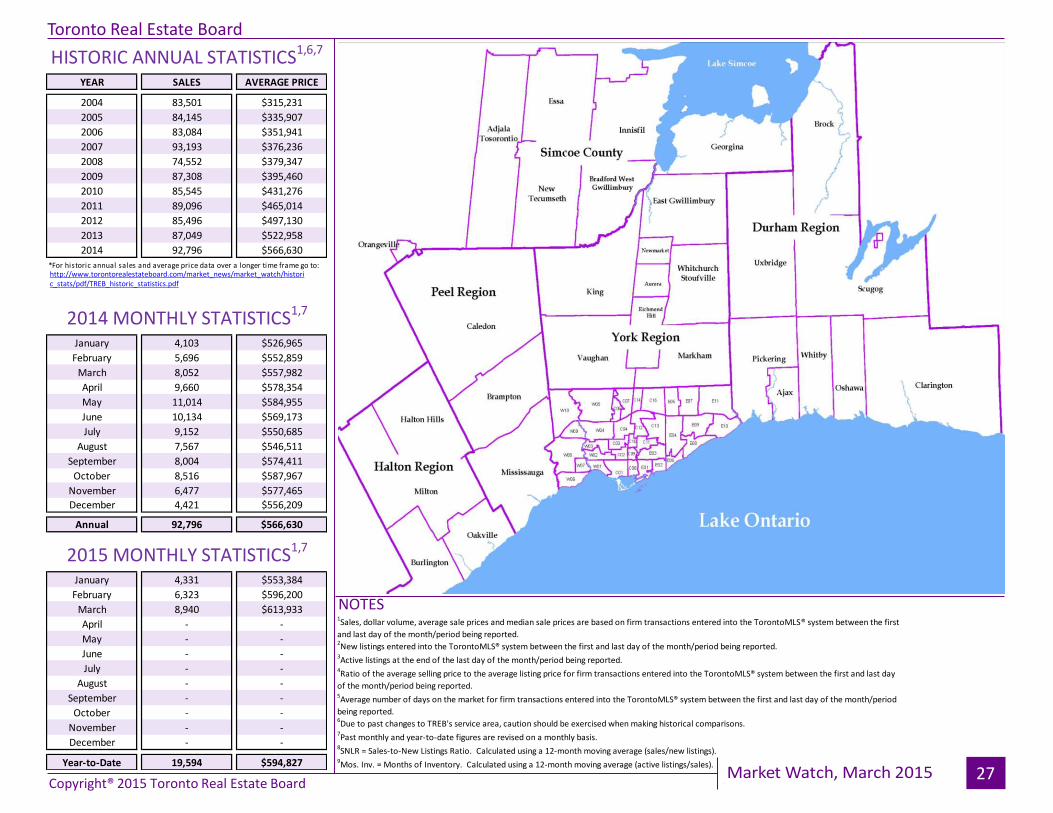
YEAR SALES AVERAGE PRICE
2004 83,501 $315,231
2005 84,145 $335,907
2006 83,084 $351,941
2007 93,193 $376,236
2008 74,552 $379,347
2009 87,308 $395,460
2010 85,545 $431,276
2011 89,096 $465,014
2012 85,496 $497,130
2013 87,049 $522,958
2014 92,796 $566,630
January 4,103 $526,965
February 5,696 $552,859
March 8,052 $557,982
April 9,660 $578,354
May 11,014 $584,955
June 10,134 $569,173
July 9,152 $550,685
August 7,567 $546,511
September 8,004 $574,411
October 8,516 $587,967
November 6,477 $577,465
December 4,421 $556,209
Annual 92,796 $566,630
January 4,331 $553,384
February 6,323 $596,200
March 8,940 $613,933
April - -
May - -
June - -
July - -
August - -
September - -
October - -
November - -
December - -
Year-to-Date 19,594 $594,827
HISTORIC ANNUAL STATISTICS1,6,7
2015 MONTHLY STATISTICS1,7
2014 MONTHLY STATISTICS1,7
*For historic annual sales and average price data over a longer time frame go to:http://www.torontorealestateboard.com/market_news/market_watch/historic_stats/pdf/TREB_historic_statistics.pdf
NOTES
8SNLR = Sales-to-New Listings Ratio. Calculated using a 12-month moving average (sales/new listings).
9Mos. Inv. = Months of Inventory. Calculated using a 12-month moving average (active listings/sales).
7Past monthly and year-to-date figures are revised on a monthly basis.
1Sales, dollar volume, average sale prices and median sale prices are based on firm transactions entered into the TorontoMLS® system between the first
and last day of the month/period being reported.2New listings entered into the TorontoMLS® system between the first and last day of the month/period being reported.
3Active listings at the end of the last day of the month/period being reported.
4Ratio of the average selling price to the average listing price for firm transactions entered into the TorontoMLS® system between the first and last day
of the month/period being reported.5Average number of days on the market for firm transactions entered into the TorontoMLS® system between the first and last day of the month/period
being reported.6Due to past changes to TREB's service area, caution should be exercised when making historical comparisons.
Copyright® 2015 Toronto Real Estate Board