+ All Categories
Home > Documents > marketfield asset management Marketfield Fund · Industrials 25.89% ... concept within the mutual...

marketfield asset management Marketfield Fund · Industrials 25.89% ... concept within the mutual...

Date post: 28-Jun-2018
Category:
Upload: vannguyet
View: 214 times
Download: 0 times
Share this document with a friend
2
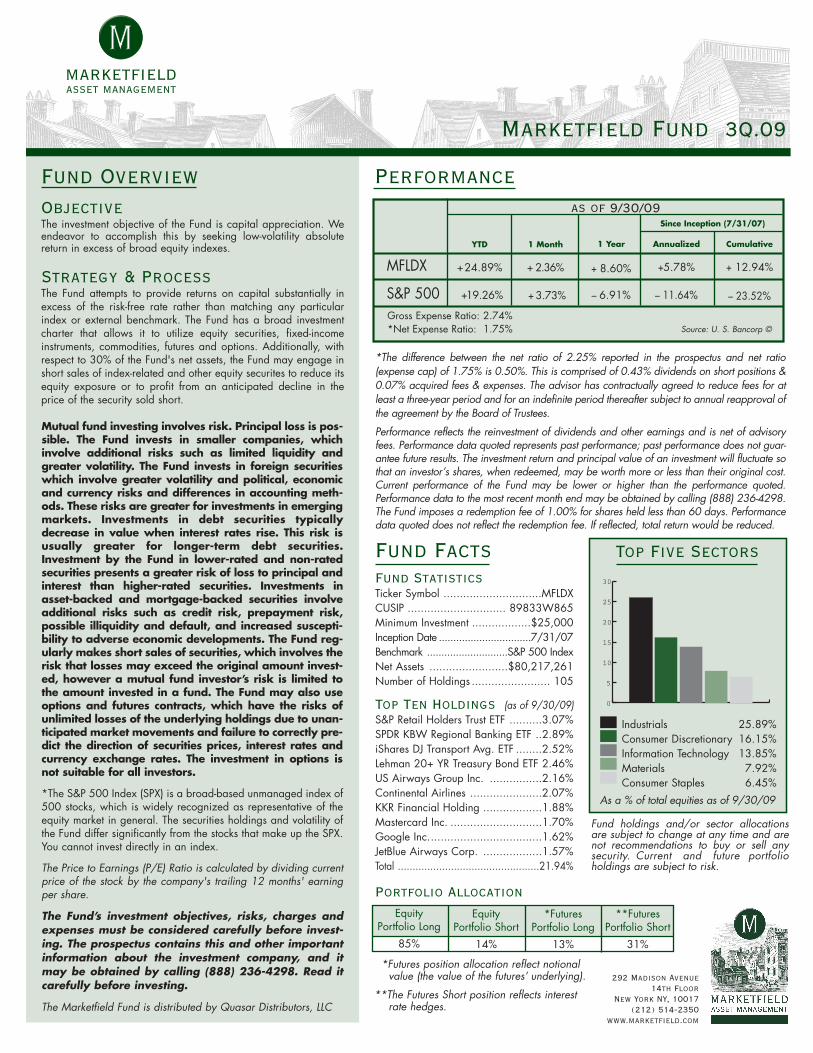
Fund Facts Fund Statistics Ticker Symbol ..............................MFLDX CUSIP .............................. 89833W865 Minimum Investment ..................$25,000 Inception Date ................................ 7/31/07 Benchmark ............................S&P 500 Index Net Assets ........................$80,217,261 Number of Holdings ........................ 105 Top Ten Holdings (as of 9/30/09) S&P Retail Holders Trust ETF ..........3.07% SPDR KBW Regional Banking ETF ..2.89% iShares DJ Transport Avg. ETF ........2.52% Lehman 20+ YR Treasury Bond ETF 2.46% US Airways Group Inc. ................2.16% Continental Airlines ......................2.07% KKR Financial Holding ..................1.88% Mastercard Inc. ............................1.70% Google Inc...................................1.62% JetBlue Airways Corp. ..................1.57% Total ................................................21.94% *The difference between the net ratio of 2.25% reported in the prospectus and net ratio (expense cap) of 1.75% is 0.50%. This is comprised of 0.43% dividends on short positions & 0.07% acquired fees & expenses. The advisor has contractually agreed to reduce fees for at least a three-year period and for an indefinite period thereafter subject to annual reapproval of the agreement by the Board of Trustees. Performance reflects the reinvestment of dividends and other earnings and is net of advisory fees. Performance data quoted represents past performance; past performance does not guar- antee future results. The investment return and principal value of an investment will fluctuate so that an investor’s shares, when redeemed, may be worth more or less than their original cost. Current performance of the Fund may be lower or higher than the performance quoted. Performance data to the most recent month end may be obtained by calling (888) 236-4298. The Fund imposes a redemption fee of 1.00% for shares held less than 60 days. Performance data quoted does not reflect the redemption fee. If reflected, total return would be reduced. 292 Madison Avenue 14th Floor New York NY, 10017 (212) 514-2350 www.marketfield.com Top Five Sectors As a % of total equities as of 9/30/09 marketfield asset management Marketfield Fund 3Q.09 Performance Mutual fund investing involves risk. Principal loss is pos- sible. The Fund invests in smaller companies, which involve additional risks such as limited liquidity and greater volatility. The Fund invests in foreign securities which involve greater volatility and political, economic and currency risks and differences in accounting meth- ods. These risks are greater for investments in emerging markets. Investments in debt securities typically decrease in value when interest rates rise. This risk is usually greater for longer-term debt securities. Investment by the Fund in lower-rated and non-rated securities presents a greater risk of loss to principal and interest than higher-rated securities. Investments in asset-backed and mortgage-backed securities involve additional risks such as credit risk, prepayment risk, possible illiquidity and default, and increased suscepti- bility to adverse economic developments. The Fund reg- ularly makes short sales of securities, which involves the risk that losses may exceed the original amount invest- ed, however a mutual fund investor’s risk is limited to the amount invested in a fund. The Fund may also use options and futures contracts, which have the risks of unlimited losses of the underlying holdings due to unan- ticipated market movements and failure to correctly pre- dict the direction of securities prices, interest rates and currency exchange rates. The investment in options is not suitable for all investors. *The S&P 500 Index (SPX) is a broad-based unmanaged index of 500 stocks, which is widely recognized as representative of the equity market in general. The securities holdings and volatility of the Fund differ significantly from the stocks that make up the SPX. You cannot invest directly in an index. The Price to Earnings (P/E) Ratio is calculated by dividing current price of the stock by the company's trailing 12 months' earning per share. The Fund’s investment objectives, risks, charges and expenses must be considered carefully before invest- ing. The prospectus contains this and other important information about the investment company, and it may be obtained by calling (888) 236-4298. Read it carefully before investing. The Marketfield Fund is distributed by Quasar Distributors, LLC Fund holdings and/or sector allocations are subject to change at any time and are not recommendations to buy or sell any security. Current and future portfolio holdings are subject to risk. Industrials 25.89% Consumer Discretionary 16.15% Information Technology 13.85% Materials 7.92% Consumer Staples 6.45% 1 Equity Portfolio Long 85% Equity Portfolio Short 14% *Futures Portfolio Long 13% Portfolio Allocation **Futures Portfolio Short 31% *Futures position allocation reflect notional value (the value of the futures’ underlying). **The Futures Short position reflects interest rate hedges. 0 5 10 15 20 25 30 Fund Overview Objective The investment objective of the Fund is capital appreciation. We endeavor to accomplish this by seeking low-volatility absolute return in excess of broad equity indexes. Strategy & Process The Fund attempts to provide returns on capital substantially in excess of the risk-free rate rather than matching any particular index or external benchmark. The Fund has a broad investment charter that allows it to utilize equity securities, fixed-income instruments, commodities, futures and options. Additionally, with respect to 30% of the Fund's net assets, the Fund may engage in short sales of index-related and other equity securites to reduce its equity exposure or to profit from an anticipated decline in the price of the security sold short. Source: U. S. Bancorp © Gross Expense Ratio: 2.74% *Net Expense Ratio: 1.75% MFLDX S&P 500 1 Year + 8.60% 6.91% Annualized +5.78% – 11.64% 1 Month + 2.36% + 3.73% YTD +24.89% +19.26% as of 9/30/09 Since Inception (7/31/07) Cumulative + 12.94% – 23.52%
Transcript

Fund FactsFund StatisticsTicker Symbol ..............................MFLDXCUSIP .............................. 89833W865Minimum Investment ..................$25,000Inception Date ................................7/31/07Benchmark ............................S&P 500 IndexNet Assets ........................$80,217,261Number of Holdings ........................ 105

Top Ten Holdings (as of 9/30/09)S&P Retail Holders Trust ETF ..........3.07%SPDR KBW Regional Banking ETF ..2.89%iShares DJ Transport Avg. ETF ........2.52%Lehman 20+ YR Treasury Bond ETF 2.46%US Airways Group Inc. ................2.16%Continental Airlines ......................2.07%KKR Financial Holding ..................1.88%Mastercard Inc. ............................1.70%Google Inc...................................1.62%JetBlue Airways Corp. ..................1.57%Total ................................................21.94%

*The difference between the net ratio of 2.25% reported in the prospectus and net ratio(expense cap) of 1.75% is 0.50%. This is comprised of 0.43% dividends on short positions &0.07% acquired fees & expenses. The advisor has contractually agreed to reduce fees for atleast a three-year period and for an indefinite period thereafter subject to annual reapproval ofthe agreement by the Board of Trustees.

Performance reflects the reinvestment of dividends and other earnings and is net of advisoryfees. Performance data quoted represents past performance; past performance does not guar-antee future results. The investment return and principal value of an investment will fluctuate sothat an investor’s shares, when redeemed, may be worth more or less than their original cost.Current performance of the Fund may be lower or higher than the performance quoted.Performance data to the most recent month end may be obtained by calling (888) 236-4298.The Fund imposes a redemption fee of 1.00% for shares held less than 60 days. Performancedata quoted does not reflect the redemption fee. If reflected, total return would be reduced.

292 Madison Avenue 14th Floor

New York NY, 10017(212) 514-2350

www.marketfield.com

Top Five Sectors

As a % of total equities as of 9/30/09

marketfieldasset management

Marketfield Fund 3Q.09

Performance

Mutual fund investing involves risk. Principal loss is pos-sible. The Fund invests in smaller companies, whichinvolve additional risks such as limited liquidity andgreater volatility. The Fund invests in foreign securitieswhich involve greater volatility and political, economicand currency risks and differences in accounting meth-ods. These risks are greater for investments in emergingmarkets. Investments in debt securities typicallydecrease in value when interest rates rise. This risk isusually greater for longer-term debt securities.Investment by the Fund in lower-rated and non-ratedsecurities presents a greater risk of loss to principal andinterest than higher-rated securities. Investments inasset-backed and mortgage-backed securities involveadditional risks such as credit risk, prepayment risk,possible illiquidity and default, and increased suscepti-bility to adverse economic developments. The Fund reg-ularly makes short sales of securities, which involves therisk that losses may exceed the original amount invest-ed, however a mutual fund investor’s risk is limited tothe amount invested in a fund. The Fund may also useoptions and futures contracts, which have the risks ofunlimited losses of the underlying holdings due to unan-ticipated market movements and failure to correctly pre-dict the direction of securities prices, interest rates andcurrency exchange rates. The investment in options isnot suitable for all investors.

*The S&P 500 Index (SPX) is a broad-based unmanaged index of500 stocks, which is widely recognized as representative of theequity market in general. The securities holdings and volatility ofthe Fund differ significantly from the stocks that make up the SPX.You cannot invest directly in an index.

The Price to Earnings (P/E) Ratio is calculated by dividing currentprice of the stock by the company's trailing 12 months' earningper share.

The Fund’s investment objectives, risks, charges andexpenses must be considered carefully before invest-ing. The prospectus contains this and other importantinformation about the investment company, and itmay be obtained by calling (888) 236-4298. Read itcarefully before investing.

The Marketfield Fund is distributed by Quasar Distributors, LLC

Fund holdings and/or sector allocationsare subject to change at any time and arenot recommendations to buy or sell anysecurity. Current and future portfolioholdings are subject to risk.

Industrials 25.89%Consumer Discretionary 16.15%Information Technology 13.85%Materials 7.92%Consumer Staples 6.45%

1

Equity Portfolio Long

85%

Equity Portfolio Short

14%

*Futures Portfolio Long

13%

Portfolio Allocation**Futures

Portfolio Short31%

*Futures position allocation reflect notional value (the value of the futures’ underlying).

**The Futures Short position reflects interest rate hedges.

0

5

10

15

20

25

30

Fund OverviewObjectiveThe investment objective of the Fund is capital appreciation. Weendeavor to accomplish this by seeking low-volatility absolutereturn in excess of broad equity indexes.

Strategy & ProcessThe Fund attempts to provide returns on capital substantially inexcess of the risk-free rate rather than matching any particularindex or external benchmark. The Fund has a broad investmentcharter that allows it to utilize equity securities, fixed-incomeinstruments, commodities, futures and options. Additionally, withrespect to 30% of the Fund's net assets, the Fund may engage inshort sales of index-related and other equity securites to reduce itsequity exposure or to profit from an anticipated decline in theprice of the security sold short.

Source: U. S. Bancorp © Gross Expense Ratio: 2.74%*Net Expense Ratio: 1.75%

MFLDX

S&P 500

1 Year

+ 8.60%

– 6.91%

Annualized

+5.78%

– 11.64%

1 Month

+ 2.36%

+ 3.73%

YTD

+24.89%

+19.26%

as of 9/30/09Since Inception (7/31/07)

Cumulative

+ 12.94%

– 23.52%

Exactly two years have passed since the S&P 500 Index reached its all time high andembarked on a decline of historic dimensions. Given the fact that Marketfield Fund hasmanaged to deliver comfortably positive returns in the face of global equity markets thatremain well below their peaks, we look at this period as a validation of the absolute returnconcept within the mutual fund format. In this regard the latitude afforded by our prospec-tus has been of great importance to us in trying to navigate during a harrowing two years.

The recovery in markets continued in September and became increasingly justified byimprovement in portions of the real economy. We have contended for months that we arein the early stages of a normal, powerful business cycle recovery driven by the recordexpansion of liquidity in global capital markets. Nothing that has occurred during the pastmonth has altered that view. Record issuance of corporate and public sector debt hascontinued, with absolute levels of interest rates remaining at historic lows. The financingboom has been of greatest benefit to larger corporate entities but should begin filteringthrough to smaller business within the next two quarters.

Much has been made over the lack of top line growth in corporate reports of late, despiteprofits coming along at higher than anticipated levels. This is perfectly normal during earlystages of recovery. The next significant boost to profits should be prompted by increasedpricing power, particularly in industries involved in globally traded goods and thosewhere capacity has been reduced.

Employment is one variable about which we are questioned at some point in every clientdiscussion. We look at employment as a close correlate of production, which remainssubdued as reflected by the continuing drawdown of inventories. Once business man-agers feel comfortable with their liquidity positions, a willingness to hold more assets inthe form of inventory should prompt a pick up in hiring and output. We would expect tosee evidence of this process underway in the next 90 days. In summary we continue tosee the consensus viewpoint as significantly more downbeat than is justified and aretherefore willing to stay invested at the current time.

Management TeamMichael C. AronsteinPresident, Chief Executive Officer, and Portfolio Manager

Michael C. Aronstein is Portfolio Manager of theMarketfield Fund. He is also Chief Investment

Strategist for Oscar Gruss & Son Incorporated, a NYSE memberfirm that provides research and investment advice to institutionalmanagers. Prior to joining Oscar Gruss in 2004, Mr. Aronsteinwas Chief Investment Strategist at Preservation Group, a providerof independent macroeconomic and strategic advice to profes-sional investors. Mr. Aronstein began his investment career in1979 at Merrill Lynch, serving positions as Senior Market Analyst, Senior Investment Strategist, and Manager of Global InvestmentStrategy. Mr. Aronstein spent six years as President of ComstockPartners, a diversified investment advisor, and left to found WestCourse Capital, a discretionary commodity management firm. Mr. Aronstein graduated from Yale College with a Bachelor of Arts in1974. His views on macroeconomic and strategic issues areregularly sought by and disseminated through the financial printand visual media. Mr. Aronstein manages $80 million in MFLDXand $198 million in MKTFLDA; total assets under managment are$278 million.

Michael ShaoulChairman

Michael Shaoul also serves as Chief ExecutiveOfficer of Oscar Gruss and Son Incorporated, a position he has held since December 2001. Hejoined Oscar Gruss in 1996 as Chief Operating

Officer. Between 1992 and 1996, Mr. Shaoul ran Park SquareAssociates, a Manhattan-based real estate investment andmanagement company. He was awarded a Ph.D. in Accountingand Finance in 1992 from Manchester University (UK). Mr. Shaoulhas written articles on behalf of Barron’s and has been regularlyquoted in The Wall Street Journal and Dow Jones Newswiresregarding his opinions on the investment markets.

Myles D. Gillespie Chief Operating Officer

Myles D. Gillespie joined Marketfield AssetManagement as Chief Operating Officer in2007. Myles is a graduate of The HotchkissSchool and holds a Bachelor of Arts degree from

Franklin and Marshall College (Class of 1983). From 1983 to1986, he worked as a stock index futures trader with HendersonBrothers and in 1986 became a NYSE Specialist at Quick &Reilly. He was appointed Executive Vice President of JCCSpecialist Corp., the successor firm to Quick and Reilly, in 1989.In 1999 he became President of Fleet Specialist, Inc., the succes-sor firm to JCC Specialist Corp., retiring from this position in2004. During his time at the NYSE, Myles served as a NYSE floorOfficial (1993-1999) and NYSE floor Governor (2001-2004).

Commentary

marketfieldasset management

Marketfield Fund 3Q.09

292 Madison Avenue 14th Floor

New York NY, 10017(212) 514-2350

www.marketfield.com2MAMFS10.09


Recommended