27
Analytic Plan & Dashboard Shock Top Team 6 - SynchroThink
Analytic Plan & DashboardShock Top
Team 6 - SynchroThink

Agenda
Introduction
✓
ObjectivesPrimary
ResearchSecondary Research Dashboard
‣ Who we are?
‣ Shock Top Introduction
‣ Identify the problem
✓
Introduction

✓
Introduction
Who We are?
Shock Top
Identify the problem

‣ Survey Research
‣ In bar research
✓
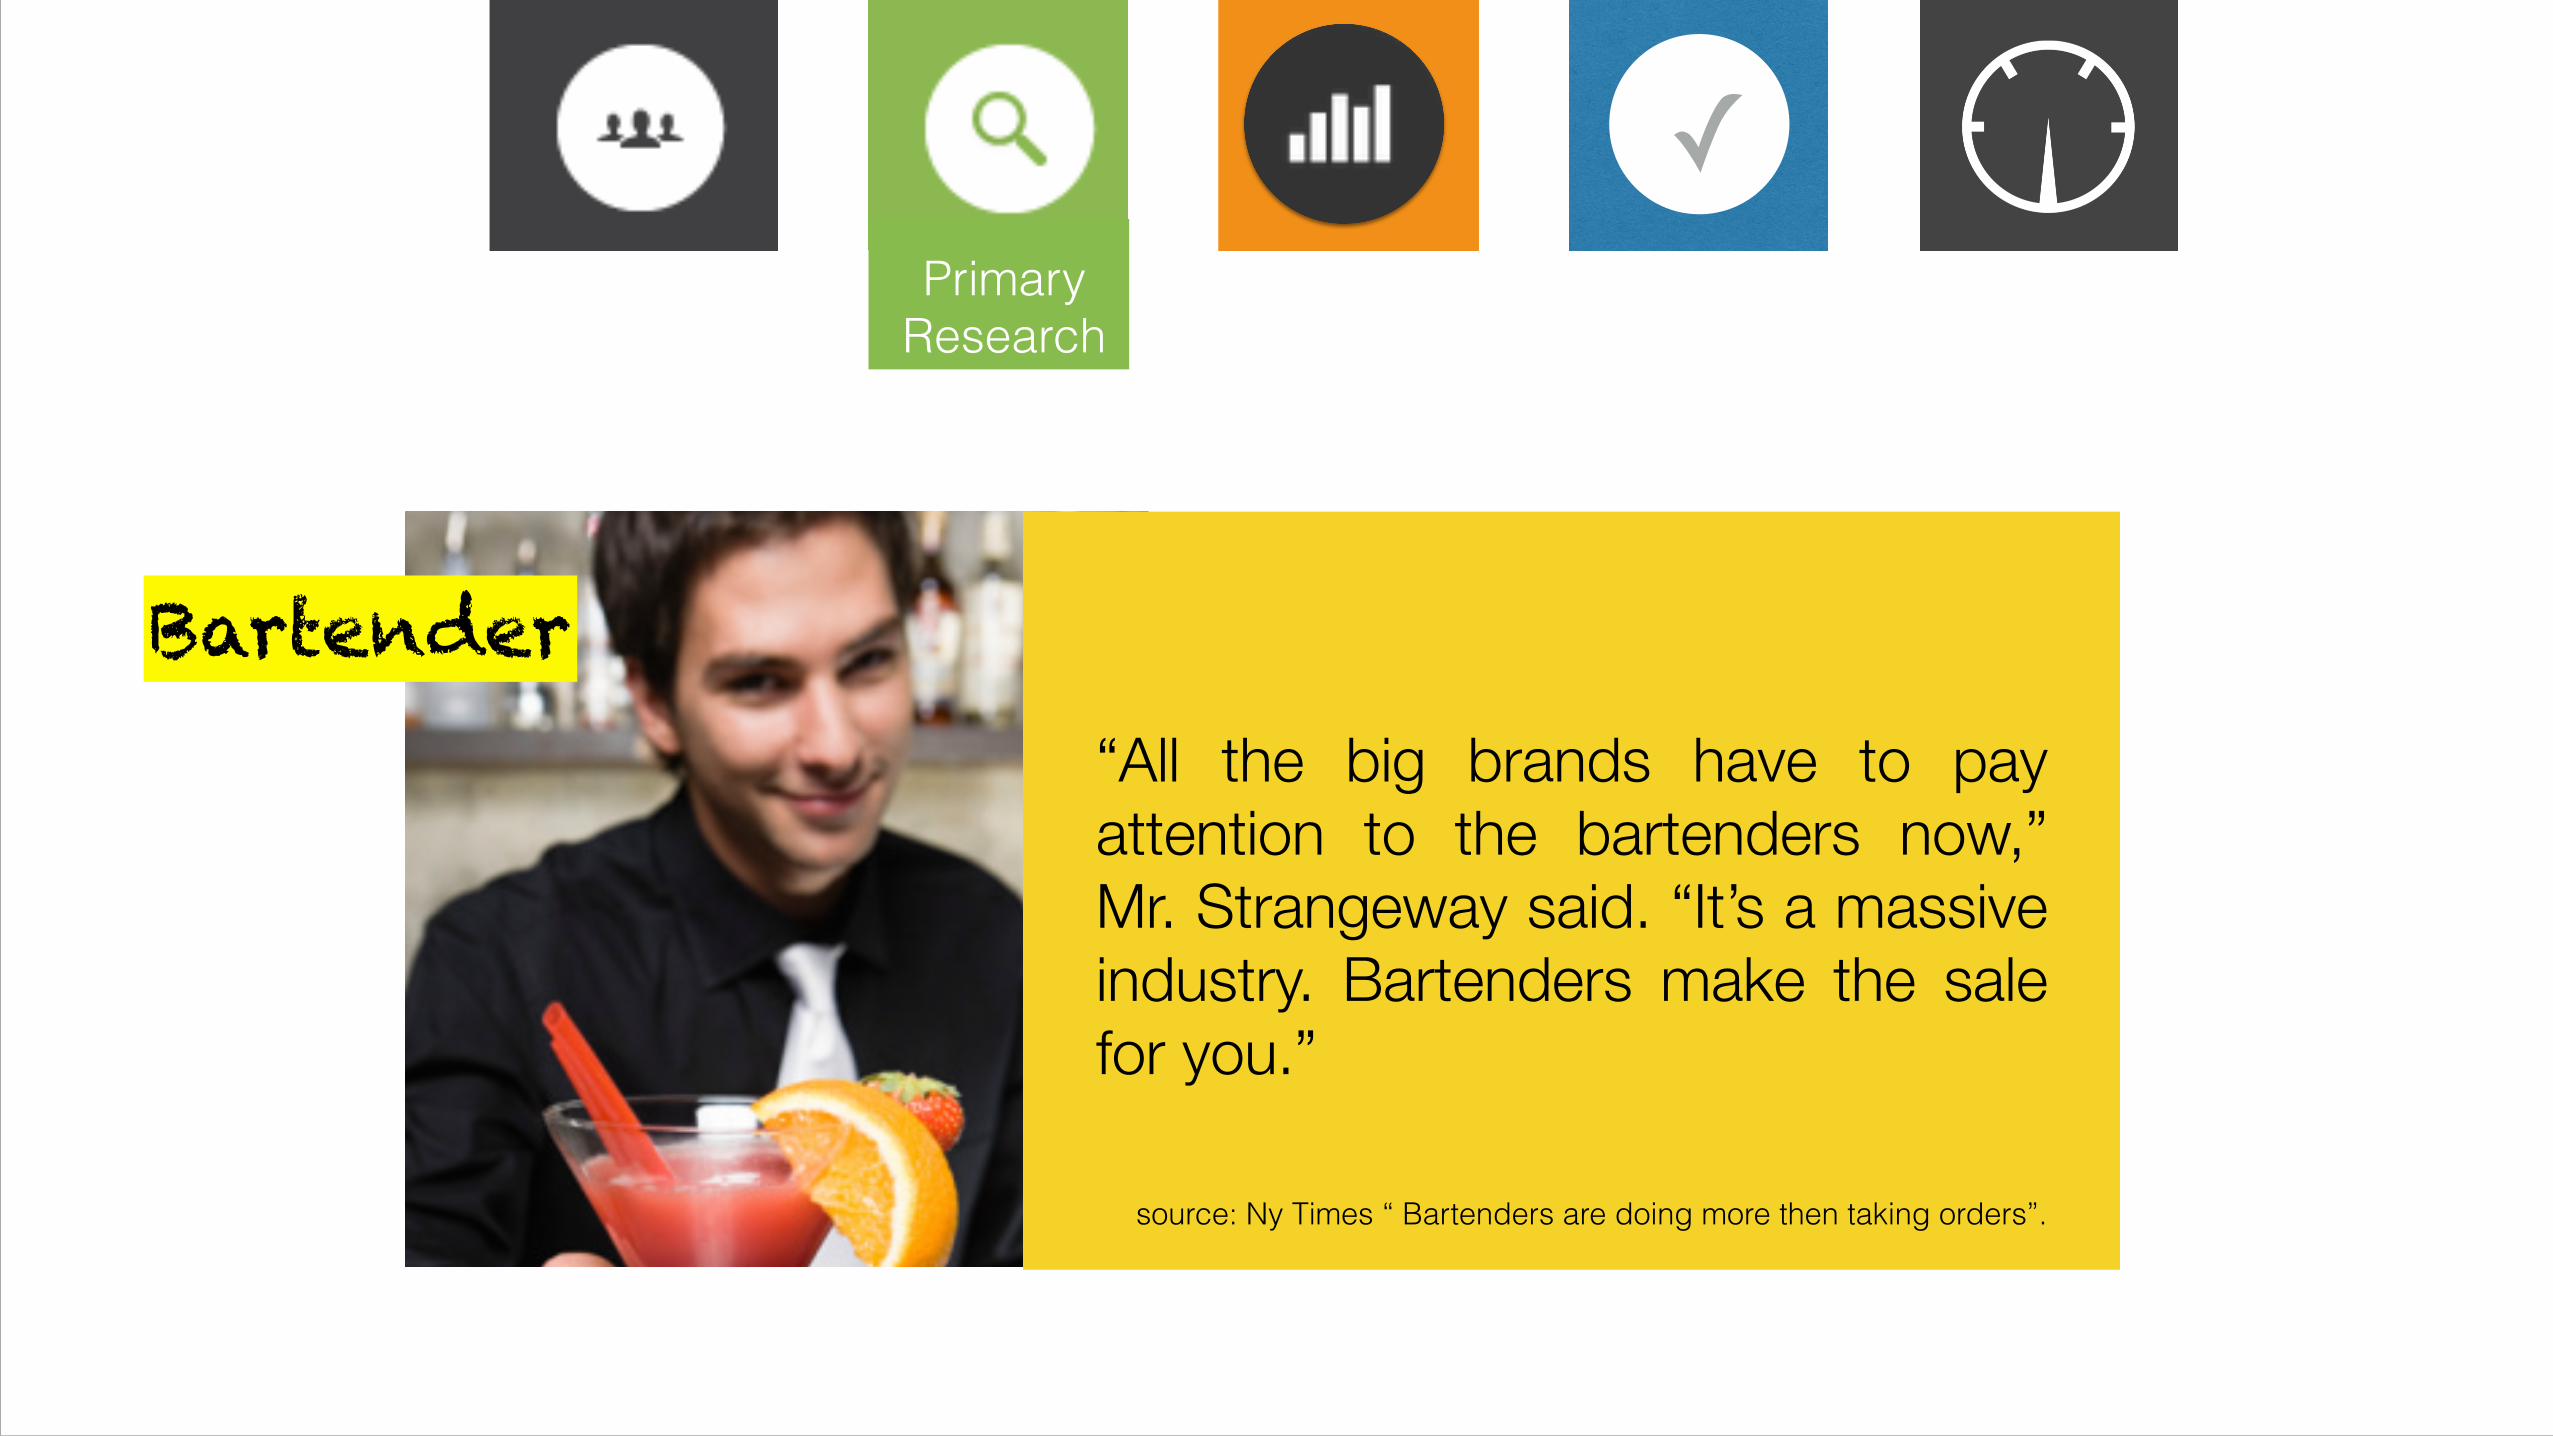
Primary Research

Which distribution channels should we focus on?
Research Scope
What is the awareness level for Shock Top?
How do we get people to try Shock Top?
✓ Primary
Research

✓ Primary
Research
Blue Moon
Shock Top
Don't know either
0 10 20 30 40 50 60 70 80 90 100
Brand Awareness
# of people
✓ Primary
Research
“All the big brands have to pay attention to the bartenders now,” Mr. Strangeway said. “It’s a massive industry. Bartenders make the sale for you.”
Bartender
source: Ny Times “ Bartenders are doing more then taking orders”.

✓ Primary
Research
Bar owner
✓ Decision makers
✓ Relationship with distributors
✓ High profit margin
✓ Incentives

✓ Primary
Research
customers
✓ Price
✓ Catchy designs
✓ In store promotion

✓
Secondary Research
‣ U.S beer industry overview
‣ Bar penetration
‣ Profit Margin

✓ Secondary Research
• 7.9 billion dollar beer industry
• 45,000 Bars in United States
• 1000 bars in San Francisco
• $177,777& per bar/year
• $14800 per bar/month
• Average cost of beer in bars: $5
• Comes down to 99 beers per day

✓ Secondary Research
Sell Price $5
Retail Price $2
Profit Margin $3
Sell Price $5
Retail Price $1
Profit Margin $4

✓ Secondary Research
# of bars
0 100 200 300 400 500 600 700 800 900 1000
Blue Moon Shock Top Others
Bar Penetration
‣ Introduction of objective
‣ Feasibility
‣ Financial statement
✓
Objectives
INCREASE BRAND AWARENESS
✓ Objectives

✓ Objectives
FEASIBILITY

✓ Objectives
Income StatementRevenue & gains $
Sales Revenes 26,640,000Interest Revenues 532,800
Total Revenues 27,172,800
Expenses & LossesCOGS 3,729,600
Commissions Expense 532,800Office Supplies Expense 2,536,941
Office Equipment Expense 2,788,397Admin & General 1,357,500
Marketing 4,072,500Interest Expense 665,700Total Expenses 15,683,438
Net income 11,489,362

‣ Marketing Campaign scope
‣ KPI
‣ Dashboard
✓
Dashboard

✓ Dashboard

✓ Dashboard

ActivityContent
Engagement TargetPhotos
Likes received
CommentsFollowers
#150
8268329
2399
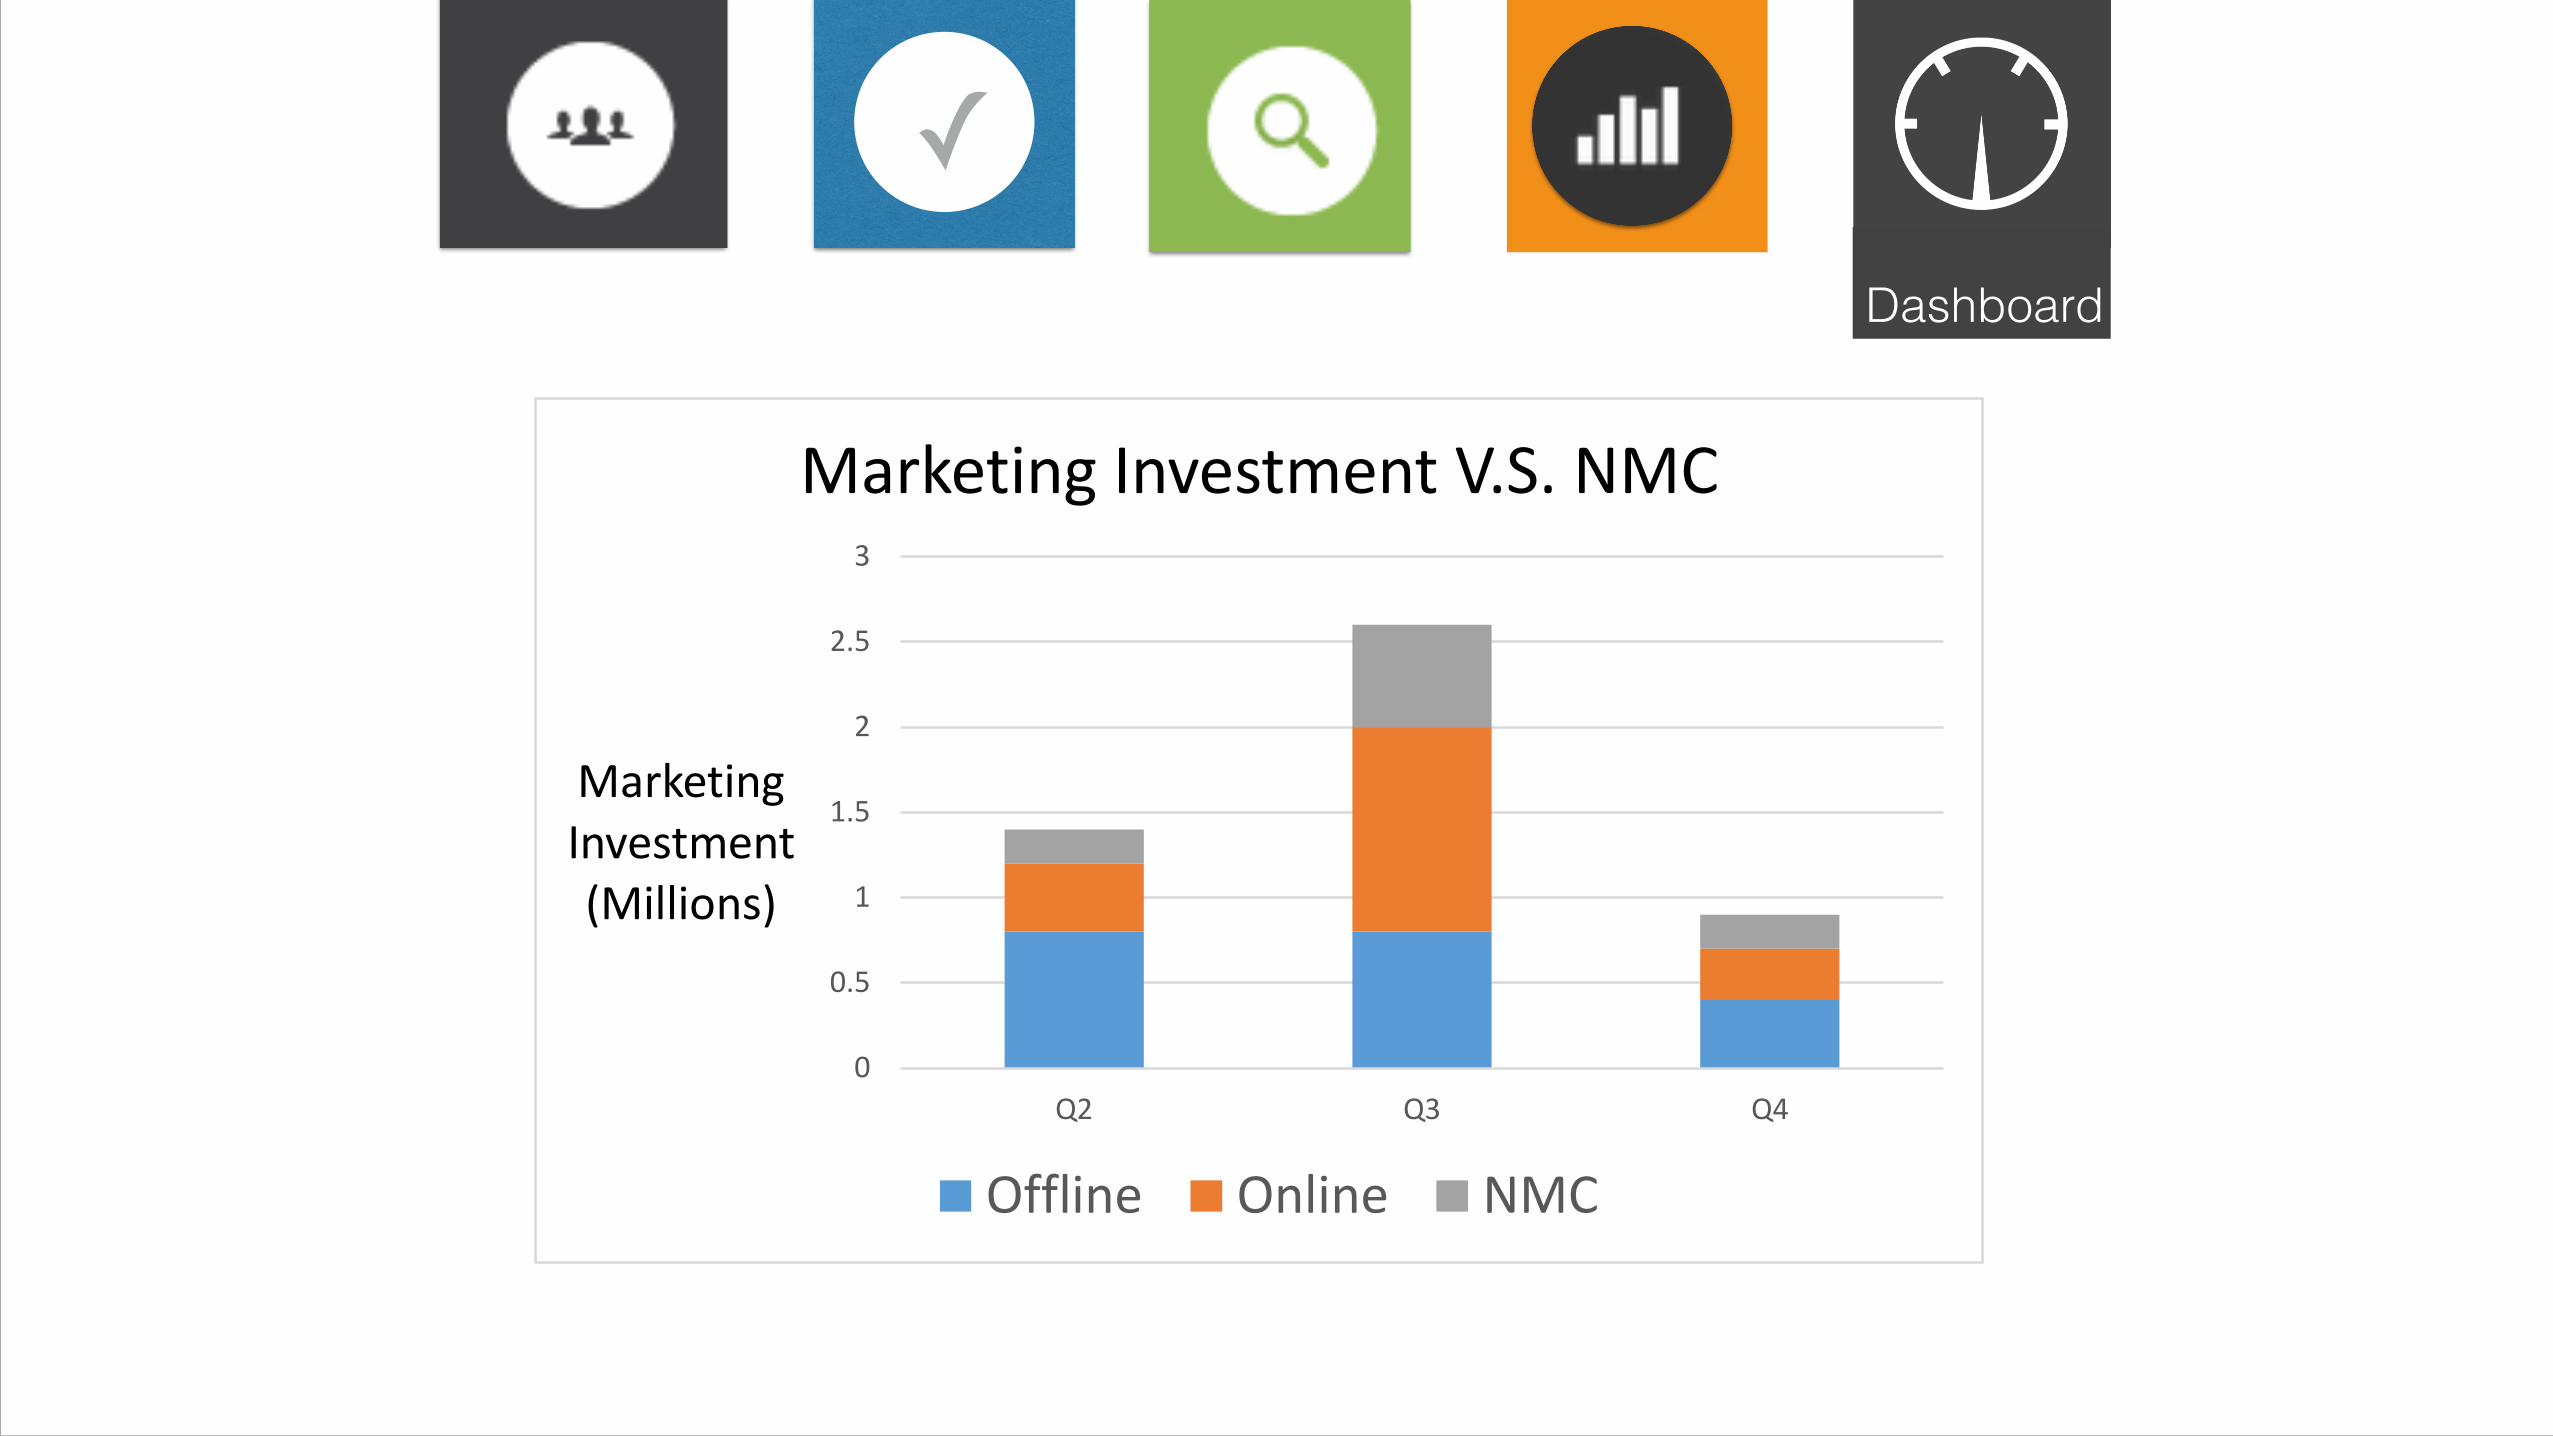
✓ Dashboard
0
0.5
1
1.5
2
2.5
3
Q2 Q3 Q4
Marketing Investment (Millions)
Marketing Investment V.S. NMC
Offline Online NMC
✓ Dashboard

Increase ERA (EdgeRank Action) by 40%
Reach
Shares
Comments
Likes
%
0 3 6 9 12
April May June July August SeptemberOctober November December
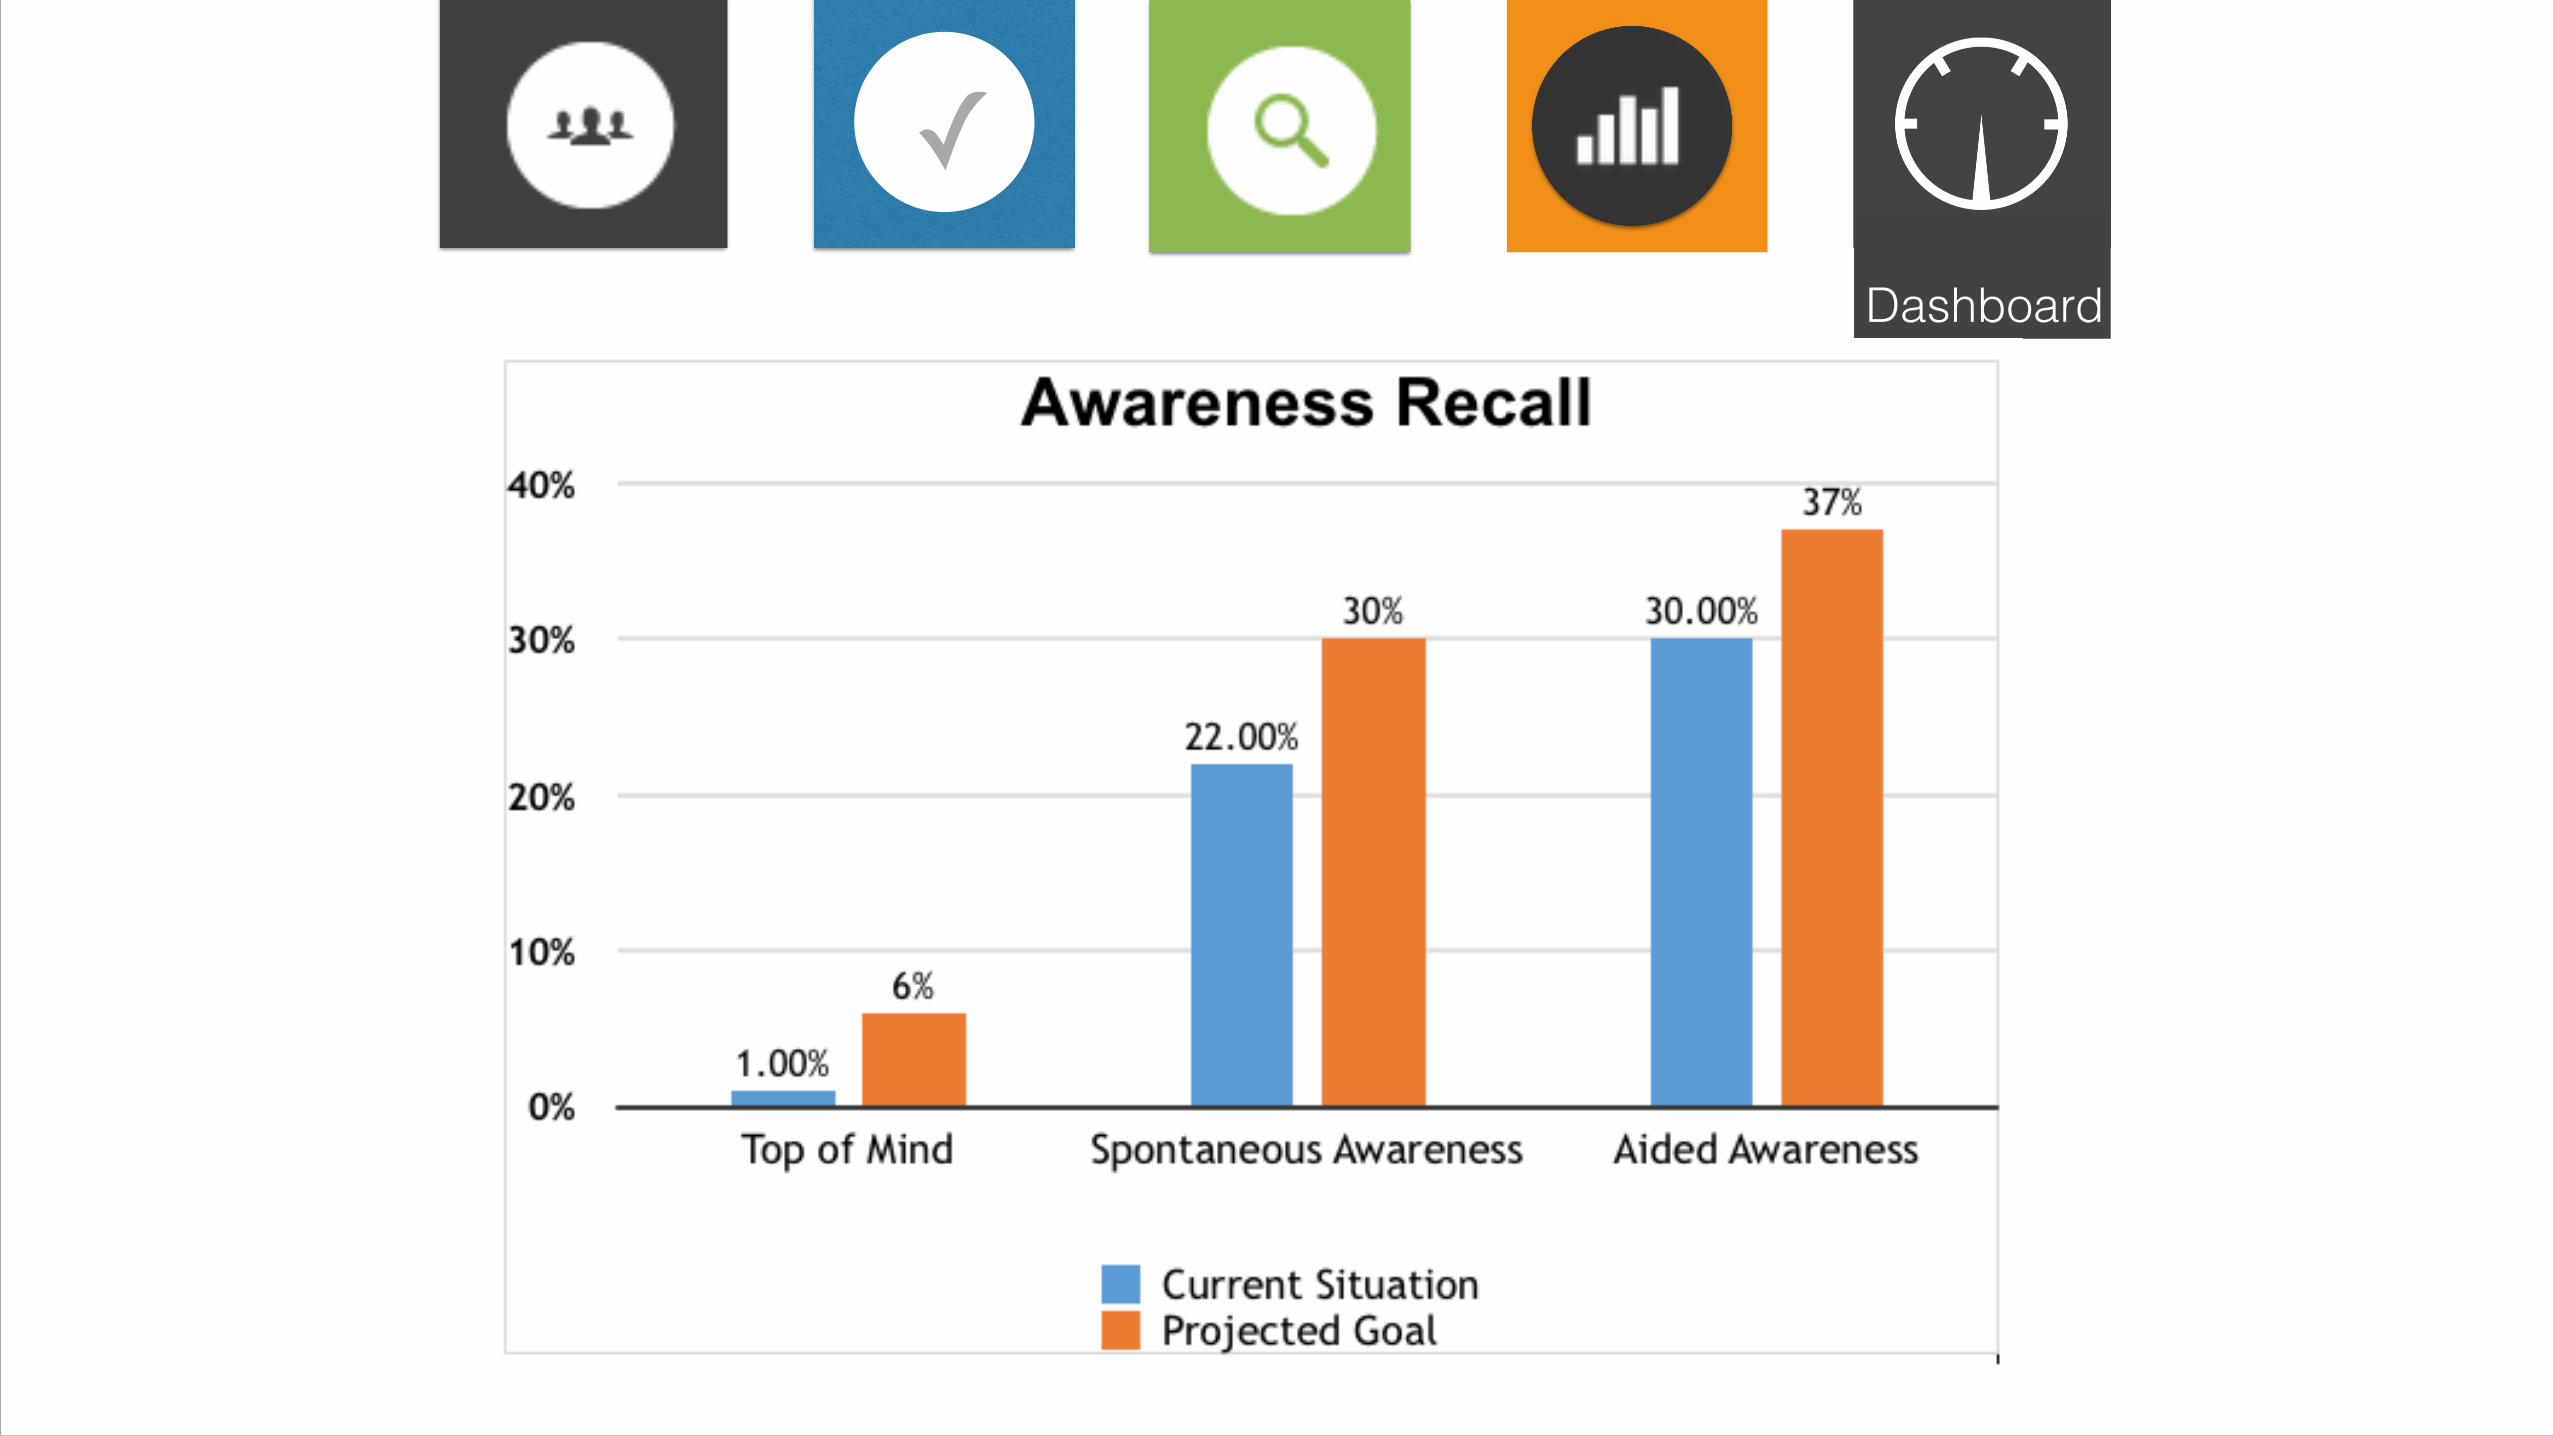
Online DashboardAwareness Recall
0%
10%
20%
30%
40%
Top of Mind Spontaneous Awareness Aided Awareness
37%
30%
6%
30.00%
22.00%
1.00%
Current Situation Projected Goal
Brand DashboardMarketing Cost Dashboard
Brand Distribution
Dashboard Reports
0
0.5
1
1.5
2
2.5
3
Q2 Q3 Q4
Marketing Investment (Millions)
Marketing Investment V.S. NMC
Offline Online NMC

✓
Q&A

✓
Thank you!


![PEP Web - The Analytic Third: Working with Intersubjective ... … · analytic third'. This third subjectivity, the intersubjective analytic third Green's [1975] 'analytic object'),](https://static.documents.pub/doc/80x56/6099619e2d4b51336024f694/pep-web-the-analytic-third-working-with-intersubjective-analytic-third.jpg)
