Marketing Intelligence & Planning Emerald Article: Do switching costs really provide a first-mover advantage? Francisco-Jose Molina-Castillo, Ana-Isabel Rodriguez-Escudero, Jose-Luis Munuera-Aleman Article information: To cite this document: Francisco-Jose Molina-Castillo, Ana-Isabel Rodriguez-Escudero, Jose-Luis Munuera-Aleman, (2012),"Do switching costs really provide a first-mover advantage?", Marketing Intelligence & Planning, Vol. 30 Iss: 2 pp. 165 - 187 Permanent link to this document: http://dx.doi.org/10.1108/02634501211211966 Downloaded on: 14-05-2012 References: This document contains references to 84 other documents To copy this document: [email protected]This document has been downloaded 34 times. Access to this document was granted through an Emerald subscription provided by Emerald Author Access For Authors: If you would like to write for this, or any other Emerald publication, then please use our Emerald for Authors service. Information about how to choose which publication to write for and submission guidelines are available for all. Additional help for authors is available for Emerald subscribers. Please visit www.emeraldinsight.com/authors for more information. About Emerald www.emeraldinsight.com With over forty years' experience, Emerald Group Publishing is a leading independent publisher of global research with impact in business, society, public policy and education. In total, Emerald publishes over 275 journals and more than 130 book series, as well as an extensive range of online products and services. Emerald is both COUNTER 3 and TRANSFER compliant. The organization is a partner of the Committee on Publication Ethics (COPE) and also works with Portico and the LOCKSS initiative for digital archive preservation. *Related content and download information correct at time of download.
Transcript
Marketing Intelligence & PlanningEmerald Article: Do switching costs really provide a first-mover advantage?Francisco-Jose Molina-Castillo, Ana-Isabel Rodriguez-Escudero, Jose-Luis Munuera-Aleman
Article information:
To cite this document: Francisco-Jose Molina-Castillo, Ana-Isabel Rodriguez-Escudero, Jose-Luis Munuera-Aleman, (2012),"Do switching costs really provide a first-mover advantage?", Marketing Intelligence & Planning, Vol. 30 Iss: 2 pp. 165 - 187
Permanent link to this document: http://dx.doi.org/10.1108/02634501211211966
Downloaded on: 14-05-2012
References: This document contains references to 84 other documents
Access to this document was granted through an Emerald subscription provided by Emerald Author Access
For Authors: If you would like to write for this, or any other Emerald publication, then please use our Emerald for Authors service. Information about how to choose which publication to write for and submission guidelines are available for all. Additional help for authors is available for Emerald subscribers. Please visit www.emeraldinsight.com/authors for more information.
About Emerald www.emeraldinsight.comWith over forty years' experience, Emerald Group Publishing is a leading independent publisher of global research with impact in business, society, public policy and education. In total, Emerald publishes over 275 journals and more than 130 book series, as well as an extensive range of online products and services. Emerald is both COUNTER 3 and TRANSFER compliant. The organization is a partner of the Committee on Publication Ethics (COPE) and also works with Portico and the LOCKSS initiative for digital archive preservation.
*Related content and download information correct at time of download.
Do switching costs really providea first-mover advantage?
Francisco-Jose Molina-CastilloDepartment of Marketing, University of Murcia, Murcia, Spain
Ana-Isabel Rodriguez-EscuderoDepartment of Marketing, University of Valladolid, Valladolid, Spain, and
Jose-Luis Munuera-AlemanDepartment of Marketing, University of Murcia, Murcia, Spain
Abstract
Purpose – The purpose of this article is to present a model that compares the switching costs thatconsumers face when they buy pioneering and follower products.
Design/methodology/approach – A study of 255 new products indicates that switching costs areactually higher when switching from an existing product to a pioneering product.
Findings – The study shows that people who buy a pioneering product may also face switchingcosts, if the pioneering product is launched in an existing category where consumers are alreadyfamiliar with similar products.
Research limitations/implications – The results help to reinforce the view that first movers haveadvantages and demonstrate that switching costs do not lead to a higher level of consumer retention.
Practical implications – This study provides interesting managerial implications on how to launchnew products more effectively when they suffer from switching costs..
Originality/value – Researchers commonly view switching costs as a barrier to market entry thatprotects enterprises that launch pioneering products and gives them a competitive advantage overthose that launch follower products. The underlying idea is that people only experience switchingcosts when they change to a different follower product, rather than when they purchase a pioneeringproduct instead of the product that they usually purchase.
Keywords Order of entry, Switching costs, Speed to market, Market performance,Financial performance, Consumers
Paper type Research paper
1. IntroductionIn the dynamic and turbulent environment in which firms compete, the successfulmarketing of new products is a critical factor for their survival and growth (Iyer et al.,2006). Surprisingly, the analysis of success factors has traditionally been confined tolarge enterprises. This small number of studies focusing on SMEs contrasts with theeconomic and social significance of SMEs. SMEs make up more than 99 percent of thetotal number of firms in Europe and are a key element when it comes to the creation ofjobs and wealth. As a result, there has been increasing interest in SMEs in recent years
The current issue and full text archive of this journal is available at
www.emeraldinsight.com/0263-4503.htm
The authors acknowledge the funding received from the Education and Science Ministry(research project SEJ2006-08854/ECON), Fundacion Cajamurcia and the Seneca Foundation –Science and Technology Agency from the Region of Murcia (research project 03119/PHCS/05) toundertake this research.
(Bagchi-Sen, 2001; O’Regan et al., 2005). Moreover, and despite their public prominenceand political influence, the economic impact of large business is about equal to that ofsmall business (Hausman, 2005). SMEs account for over 99 percent of businesses,create roughly 50 percent of the total value added worldwide and, depending on thecountry, generate between 60 percent and 90 percent of all new jobs (Knight, 2001).Pissarides (1999) argues that SMEs potentially constitute the most dynamic firms in anemerging economy, and according to other authors (Qian, 2002), not only in domesticmarkets, but also in international ones. As a result, it is widely acknowledged thatgrowing small businesses have a positive economic impact in terms of generatingwealth, innovation and jobs (Doern, 2009). However, in spite of their prevalence, SMEscontinue to face numerous challenges in managing their resources (Edelman et al.,2005), while academics and managers demand an explanation regarding their impacton new product performance. This paper focuses on a specific aspect of launchingstrategies, the order of entry (Langerak et al., 2008) and the role that switching costs(Dube et al. 2009) have on market and financial performance of firms.
Pioneering products are, broadly speaking, products that introduce newfunctionality and/or improvements to existing functionality in the market.Numerous studies have examined how launching pioneering products may givefirms a competitive advantage over those that launch new follower products (Bowmanand Gatignon, 1996; Carpenter and Nakamoto, 1989; Kerin et al., 1992; Rodriguez-Pintoet al., 2008). Broadly speaking, two schools of thought exist regarding first-moveradvantages with respect to follower products:
(1) some studies emphasize the cognitive, attitudinal, and behavioral aspects ofconsumers, which may favor pioneering brands or products (Alpert and Kammis,1994; Carpenter and Nakamoto, 1989; Kardes and Kalyanaram, 1992); and
(2) other studies draw attention to the advantages of creating barriers to marketentry (Kerin et al., 1992).
However, the benefit of launching pioneering products might also depend on whetheror not the product category is also new. When a pioneering product falls into a newcategory, consumers do not have any similar substitute product to compare thepioneering product with.
In contrast, when a firm launches a pioneering product in an existing category,consumers can easily compare the benefits that the pioneering product offers withthose that related products in the category offer. This study examines the costs ofswitching from an existing product to a pioneering product when the pioneeringproduct falls into an existing category.
Switching costs are the one-time costs that consumers incur when they switch fromone product to another (Bell et al., 2005) and include:
. the cost of searching out, evaluating, and learning about new products; and
. the perceived uncertainty or psychological costs involved in breaking with asupplier (Burnham et al., 2003).
Some researchers argue that consumers’ unwillingness to switch products because ofthe costs that they incur when doing so is one of the main barriers to entry that newcompetitors face (Karakaya and Stahl, 1989; Lieberman and Montgomery, 1998; Porter,1980). Even in cases where consumers are unhappy with their current product,
MIP30,2
166
switching costs may prevent them from switching to another one (Heide and Weiss,1995; Kohli, 1999), simply because of the perceived disadvantages of changing(Hendricks and Singhal, 1997). In markets where switching costs are high, firms thatalready have pioneering products on the market and that already have a consumerbase are more likely to retain their competitive edge with respect to firms that launchnew follower products (Krishnan et al., 2000), because the consumers are unwilling toswitch from using the pioneering products to using new follower products because ofthe costs that they incur when doing so (Kerin et al., 1992).
This paper adopts a new perspective to learn the extent to which consumersexperience switching costs when they switch from buying an existing product to apioneering product. The analysis focuses on whether switching costs really constitutea first-mover advantage or whether they reduce the performance of pioneer products.In spite of the generally accepted view that switching costs act as an entry barrier tofirms that launch new follower products and provide those that launch pioneeringproducts with a competitive edge, few empirical studies have provided results thatconfirm this theoretical view. This study contributes to the existing research byproviding new insight into the relationship between order of entry, switching costs,and the performance of new pioneering products.
The organization of the remainder of the paper is as follows. Section 2 presents thetheoretical background. Section 3 motivates and presents the hypotheses. Section 4describes the methods for collecting the data and testing the hypotheses. Section 5presents the results. Section 6 presents conclusions, discusses the implications of thefindings, and states the limitations of the study.
2. Theoretical backgroundConsumers frequently face switching costs because they have already made acommitment to using a particular product. These switching costs need not be limited toobjective or so-called economic costs. Consumers can experience procedural, financial,and relational costs when switching to from one product to another (Burnham et al.,2003). When consumers say that switching products is not worth the effort, the barriersto switching that they perceive may be any combination of the following:
. search costs;
. transaction costs;
. learning costs;
. loyal consumer discounts;
. consumer habit;
. emotional costs and cognitive effort; and
. financial, social, and psychological risk on the part of the buyer (Fornell, 1992).
The literature on economics, marketing, and strategy emphasizes the importance ofswitching costs. Studies in the literature on economics emphasize that switching costsprovide enterprises with market power, which allows them to fix prices abovemarginal costs and realize extraordinary profits (Farrell and Klemperer, 2002). Studiesin the literature on marketing claim that when they face switching costs, consumerstend to be more reluctant to change their product and are more likely to continue to use
Switching costs
167
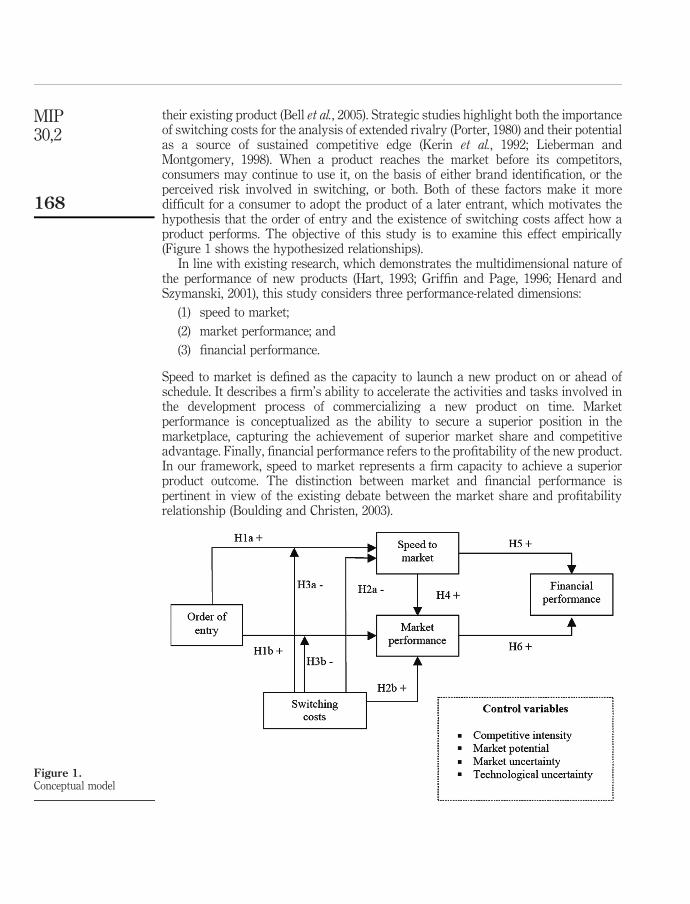
their existing product (Bell et al., 2005). Strategic studies highlight both the importanceof switching costs for the analysis of extended rivalry (Porter, 1980) and their potentialas a source of sustained competitive edge (Kerin et al., 1992; Lieberman andMontgomery, 1998). When a product reaches the market before its competitors,consumers may continue to use it, on the basis of either brand identification, or theperceived risk involved in switching, or both. Both of these factors make it moredifficult for a consumer to adopt the product of a later entrant, which motivates thehypothesis that the order of entry and the existence of switching costs affect how aproduct performs. The objective of this study is to examine this effect empirically(Figure 1 shows the hypothesized relationships).
In line with existing research, which demonstrates the multidimensional nature ofthe performance of new products (Hart, 1993; Griffin and Page, 1996; Henard andSzymanski, 2001), this study considers three performance-related dimensions:
(1) speed to market;
(2) market performance; and
(3) financial performance.
Speed to market is defined as the capacity to launch a new product on or ahead ofschedule. It describes a firm’s ability to accelerate the activities and tasks involved inthe development process of commercializing a new product on time. Marketperformance is conceptualized as the ability to secure a superior position in themarketplace, capturing the achievement of superior market share and competitiveadvantage. Finally, financial performance refers to the profitability of the new product.In our framework, speed to market represents a firm capacity to achieve a superiorproduct outcome. The distinction between market and financial performance ispertinent in view of the existing debate between the market share and profitabilityrelationship (Boulding and Christen, 2003).
Figure 1.Conceptual model
MIP30,2
168
3. Hypotheses3.1 Effect of order of entry on the performance of new productsCarpenter and Nakamoto (1989) indicate that a pioneering brand can influenceconsumer preferences. Kardes and Kalyanaram (1992) argue that consumers tend todevelop favorable attitudes toward the first brands to enter a market. Findings fromresearch in psychology suggest that consumers fix pioneering new products in theirminds (Lukas and Menon, 2004). That is to say, products that the consumer encountersfirst have an anchoring effect on the consumer. Given this anchoring effect, firms havea motivation to speed up the development process for a new product when they have achance to launch that product before the competition (Lambert and Slater, 1999). On theother hand, firms that launch their products at a later date will place greater emphasison such attributes as service and quality, rather than on speed-to-market (Coeurderoyand Durand, 2004):
H1a. An early market entry has a positive effect on speed-to-market of newproducts.
The literature contains many studies on the effects of first-mover advantages onmarket performance (Langerak et al., 2008). The main factors that these studies cite toexplain these advantages are the creation of entry barriers (Kerin et al., 1992) and thepositive effects on the cognitive, attitudinal, and behavioral aspects of consumers andretailers (Alpert and Kammis, 1994). In general, consumers recognize pioneeringbrands easily once these brands are established; hence, pioneering brands have anadvantage over follower brands. Schmalensee (1982) argues that, when consumers aresatisfied with a product, they tend to be loyal rather than try other brands. Similarly,Kalyanaram et al. (1995) and Szymanski et al. (1993) present explicitly the empiricalhypothesis that first movers obtain good results in terms of market share. Recentresearch confirms this relationship (Rodriguez-Pinto et al., 2008). Other studies suggestthat follower advantages should not be ignored (Coeurderoy and Durand, 2004; Golderand Tellis, 1993; Shankar et al., 1998). However, most studies emphasize theadvantages of moving first, rather than following:
H1b. An early market entry has a positive effect on the market performance of newproducts.
3.2 Effect of switching costs on the performance of new productsShepherd (1979) states that barriers to market entry delay potential competitors’entry. When switching costs are relatively high, firms perceive that entry to themarket will be difficult, which means that speed-to-market becomes less importantto them (Langerak et al., 2008). When switching costs are relatively high, firmstend to focus more on offering extra features in an attempt to attract consumersaway from the competition (Holak and Lehmann, 1990), even if doing so meansthat the firm needs more time to finish the new product (Lukas and Menon, 2004).Thus, when switching costs are relatively high, firms launch new products moreslowly:
H2a. Switching costs have a negative effect on speed-to-market of new products.
From a theoretical standpoint, switching costs decreases effort to understand why andto predict when consumers continue to use an existing product ( Jones et al., 2002). To
Switching costs
169
the extent that consumers perceive costs when switching products, they shouldcontinue using the same product. Generally speaking, switching costs are disutilitiesthat consumers would rather not incur. The presence of switching costs reflects thepresence of strong ties between the consumers and the provider of the product. Theseties, which researchers call the “lock-in effect” (Burnham et al., 2003), insulateconsumers from market competition (Bell et al., 2005) and make them less likely to payattention to competitive products (Heide and Weiss, 1995). An accumulating body ofevidence indicates that switching costs have a positive, direct effect on marketperformance (Anderson and Sullivan, 1993; Bansal et al., 2005):
H2b. Switching costs have a positive effect on the market performance of newproducts.
3.3 The moderating role of switching costsLaunching a pioneering product carries more risks than launching a follower product(Langerak et al., 2008). When consumers encounter pioneering products that fall into anentirely new category, the consumers know little about the pioneering productsbecause of those products’ degree of novelty in terms of potential usefulness and theproducts’ benefits compared to existing products and features, etc. (Lambert andSlater, 1999). However, when these pioneering products fall into an existing category,consumers can compare the novelty of these new products with previous and existingproducts in that category. Thus, when consumers perceived high switching costs withrespect to similar products in that category, the perception of an unknown negativeoutcome for adopting a pioneer new product increases (Holak and Lehmann, 1990), andin turn the benefits to firms that launch pioneering products decrease. However,because products that market followers enter the market during the mature stage of aproduct’s life cycle, consumers are already familiar with this type of product, whichmeans that the products’ benefits offset the switching costs that the consumersperceive. In the mature stages of a product’s life cycle, competition becomes moreintense. Prices gradually converge, which reduce switching costs (Heide and Weiss,1995; Jones et al., 2002), given that the alternatives are in many respects similar (Bansalet al., 2005), in part because innovation takes place at a slower pace. In addition, theswitching costs that consumers perceive decrease, due to the lower level of uncertaintythat the consumers have about the products that are available (Heide and Weiss, 1995).In short, in the mature markets in which follower enterprises operate, the switchingcosts that the consumers perceive are lower. Contrary to what researchers usuallyargue in the literature, the foregoing argument suggests that when consumers areconsidering buying pioneering products, those consumers are likely to perceive higherswitching costs. In this situation, pioneer firms are likely to be reluctant to market newproducts as quickly as possible, due to resistance on the part of their potentialconsumers:
H3a. The positive effect of an early market entry on speed-to-market of newproducts is weaker when consumers perceive high versus low switchingcosts.
H3b. The positive effect of an early market entry on market performance of newproducts is weaker when consumers perceive high versus low switchingcosts.
MIP30,2
170
3.4 Relationships between the dimensions of new product performanceA number of studies suggest the existence of a positive correlation betweenspeed-to-market and superior market performance (Carbonell and Rodrıguez, 2006), thereason for this correlation being that the market in general is likely to perceivepositively companies that are able to realize short development cycles for new products(Lukas and Menon, 2004). A short time to market also ensures that a new productembodies the most recent technological advances and follows the most recent ideas onwhat features a product of the kind in question should have, thereby providing theproduct with an advantage over competing products (Atuahene-Gima, 2003):
H4. Speed-to-market have a positive effect on market performance of newproducts.
Cooper and Kleinschmidt (1994) suggest that a positive relationship exists betweenlaunching products quickly and their financial performance. Ali et al. (1995) report thatfaster product development reduces break-even time, while Gupta and Souder (1998)indicate that companies that develop new products quickly also realize higher profitsand return on equity than companies that need more time to develop new products:
H5. Speed-to-market have a positive effect on financial performance of newproducts.
In the literature for the period from the publication of the initial results from the StrategicPlanning Institute’s PIMs Program in the 1970s to the present, controversy exists aboutfindings concerning the positive relationship between market performance and financialperformance (Buzzell, 2004). Nevertheless, most relevant studies support the hypothesisthat market share has a positive influence on profitability (Hooley et al., 2005):
H6. The market performance of new products has a positive effect on the financialperformance of new products.
4. Method4.1 Data collection and samplingThe authors collected data using a cross-sectional survey in the form of a web-basedquestionnaire. A consensus exists in the marketing and management literature to theeffect that switching costs are prevalent in a wide variety of industrial andconsumer-related contexts (Fornell, 1992; Jones et al., 2002). Accordingly, the authorstook the initial sampling frame from a database that lists the most innovative Spanishfirms in various sectors:
. chemical products (28);
. machinery (35);
. electrical and electronic machinery (36); and
. transport devices (37).
The study included a sample of 1,200 firms from a telephone pre-survey, according totwo criteria:
(1) a new product must be developed and launched within the last few years (Leeand O’Connor, 2003); and
Switching costs
171
(2) the product must be on the market for more than 12 months, to ensure thatsufficient data is available concerning the performance of the product(Langerak et al., 2008).
The study included construction of a questionnaire and then conducting a pre-testamong ten managers and ten academics to improve the clarity of the questionnaire andensure effective communication with the respondents. A web-based questionnaire wasthen launched and executives in the sample firms were invited to completequestionnaire. As an incentive for firms to respond, the authors promised to send thefirms a free summary of the most relevant findings of the study and a present inappreciation of their participation. Following the launch of the questionnaire, theauthors wait two weeks and then telephone non-respondents to ask whether they werein receipt of notification of the launch of the questionnaire and to remind them of thevalue of their input (Larson and Chow, 2003). In all, 255 people responded to thequestionnaire, yielding an effective response rate of 21 percent, which is consistentwith that which other authors found when conducting similar research (Sivadas andDwyer, 2000). Table I presents the population and sample composition by sectors.
Then, tests were conducted to learn differences within and between respondentsfrom the various industries. An analysis of the variance and post hoc Tukeymulti-comparison tests shows that any differences that exist are not significant. Asimilar analysis was performed to test for differences in the main variables in relationto the type of market that the new products serve (i.e. 35 percent consumer versus 65percent industrial). The results of this analysis do not reveal any significantdifferences. Together, these results suggest that industry-related and market-relatedbias is not a major limitation of the study. We tested for non-response bias bycomparing early (first quartile) with late (fourth quartile) respondents, asrecommended by Armstrong and Overton (1977). We conducted power analyses todetermine the p-values for the statistical analyses that were conducted on the data,using the G *POWER 3 software (Faul et al., 2007). In all instances, the power values fora medium effect size and Type I error (a) of 0.05 exceed Cohen’s (1988) recommendedcriterion of 0.80. Hence, an a value of 0.05 is appropriate for judging the statisticalsignificance of this analysis.
In order to assess the quality of the responses, a question was included in thequestionnaire that asked the respondents to indicate their degree of knowledge about thenew product, the new product development process, and launching activities. Thequestion was scored using a ten-point Likert scale (1 ¼ “very limited knowledge”, 10 ¼“very substantial knowledge”) (Atuahene-Gima, 2005; Langerak et al., 2008). The mean
responses were 8.46, 7.08 and 6.71, respectively, which indicates that the respondentswere sufficiently knowledgeable regarding the area of investigation. Together, theseresults suggest that industry bias, non-response bias, and respondents’ knowledge of thenew product do not pose any significant threat to the validity of the study.
4.2 Common method varianceCommon method variance is a potentially serious threat to the validity of studies inbehavioral research, especially with single-informant surveys. Two procedures help toexamine empirically the possibility that any common method bias that the dataanalysis reveals threatens the interpretation of the results:
(1) the Harman one-factor test; and
(2) the confirmatory factor-analytic approach to Harman’s one-factor test.
The emergence of a single factor from the factor analysis or the accounting for themajority of the covariance between the measures by one general factor constitutesevidence of common method bias. Harman’s one-factor test produced seven factors,with the first factor accounting for 21.1 percent of the total variance that the testexplains (the total variance that the test explains ¼ 70 percent). However, this test isweak. A confirmatory factor analysis (CFA) approach to the Harman one-factor resultsin a more sophisticated test (Podsakoff et al., 2003). A worse fit of the one-factor modelthan for the measurement model suggests that common method variance does not posea serious threat to validity. The authors conduct a CFA, which yields a x 2 ¼ 2; 351:6with 252 degrees of freedom (compared with x 2 ¼ 422:6 with 224 degrees of freedomfor the measurement model). The fit is considerably worse for the one-dimensionalmodel than for the measurement model, which suggests that common method bias isnot a serious threat to validity.
4.3 MeasuresThe scales were derived from previous studies (Table II). The construct “order ofentry” consists of four categories:
(1) “late entrant”;
(2) “early follower”;
(3) “one of the pioneers”; and
(4) “pioneer”.
This way of measuring is similar to that which research that uses the STR2 and STR4databases of the Strategic Planning Institute uses (Miller et al., 1989; Robinson andChiang, 2002). The authors borrow three items from Kohli (1999) to formulate theconstruct “switching costs”:
(1) the need for considerable advance planning to buy the product;
(2) the need for preparation time to use the product; and
(3) the effort consumers that have to make in order to adopt a product.
Kohli’s (1999) approach is also consistent with other studies on switching costs that useconsumer evaluations (Bansal et al., 2005; Pae and Hyun, 2002). “New product
Switching costs
173
performance” is a multi-dimensional construct that reflects both operationaleffectiveness (speed to market) and marketplace outcomes (market and financialperformance) (Hooley et al., 2005; Huang et al., 2004; Langerak et al., 2008; Tatikonda andMontoya-Weiss, 2001). In a way similar to which other studies use, the authors measurespeed to market using two items that bear a relation to launch time and developmentspeed. The authors also measure market performance using two indicators:
Variables Scale Mean SD
Order of entrya Our firm is one of the last to introduce the product ontothe marketOur firm is an early follower of the pioneers 2.72 1.02Our firm is one of the first to commercialize the productOur firm is the pioneer in commercializing this product
Switching costsb Consumers need considerable advance planning to buythe product 4.62 2.75Consumers need a lot of preparation time to use theproduct 3.73 2.45The effort that consumers devote to adopting the productmakes changing to a similar product less likely 3.33 2.42
Speed to marketc Launches on time 6.81 1.99Speed of the development process 6.70 1.93
Financial performancec Net income 7.38 1.66Return on investment 7.33 1.83
Competitive intensityb Promotional wars occur frequently 5.57 2.70Price competition is very high 7.17 2.51Product offerings are very similar among firms 6.53 2.32Competitors’ reactions are very frequent 6.85 2.22
Market potentialb Potential consumers have a strong need for this type ofproduct 7.37 1.95This market is potentially very profitable 6.98 2.05The market for these types of products is growing rapidly 6.72 2.16
Market turbulenceb Consumer preferences change very frequently 5.08 2.30Our clients look for new products very often 5.77 2.47The needs of our consumers are very different from thoseof traditional consumers 4.89 2.45
Technological turbulenceb Technology in this sector is changing rapidly 6.57 2.41Technological changes are a great opportunity in thissector 7.26 2.31The historical record shows a high number of recentadvanced technological products 6.47 2.28The historical record shows a recent increase intechnological development in this sector 6.70 2.38
Notes: aScale ranges from 1 to 4 (1 ¼ late entrant to 4 ¼ market pioneer). bTen-point Likert scale(1 ¼ strongly disagree to 10 ¼ strongly agree). cTen point Likert scales (1 ¼ very low to 10 ¼ very high)
Table II.Measures
MIP30,2
174
(1) market share; and
(2) competitive advantage.
In the case of financial performance, the authors ask the respondents to evaluate netrevenues and return on investment. The authors use subjective performance scalesbecause the literature indicates that a broad correlation exists between subjective andobjective performance measures (Song et al., 2005). Four different measures serve ascontrol variables:
(1) competitive intensity;
(2) market potential;
(3) market turbulence; and
(4) technological turbulence.
The authors decide to include these variables on the basis of their potential to influencethe performance of new products (Henard and Szymanski, 2001; Slater and Narver,1994). The authors derive these scales from previous research (Menguc and Auh, 2006;Slater and Narver, 1994).
4.4 Measure validationThe reliability and convergent and discriminant validity of the scales wereinvestigated by performing a confirmatory factor analysis using AMOS 16. As canbe seen in Table III, the results of the factor model suggest a good fit of thespecification for the authors’ measure of the independent and dependent variables(x 2 ¼ 422:6, df ¼ 224, CFI ¼ 0:94, IFI ¼ 0:94, RMSEA ¼ 0:05). All the loadings forthe items on their respective constructs are large and significant (smallestt-value ¼ 7:62), which indicates convergent validity for all the measures (Bagozziand Yi, 1988). The Bagozzi and Yi (1988) composite reliability index and the Fornelland Larcker (1981) average variance extracted index confirm the reliability of themulti-item scales. Two different procedures, the use of which the literaturerecommends, provide evidence of discriminant validity between the dimensions.Firstly, the 95 percent confidence interval around the correlation estimate between twolatent variables never includes the value 1 (Anderson and Gerbing, 1988). Secondly,comparing the square root of the AVE (diagonal in Table III) with the correlationsbetween constructs (i.e. off-diagonal elements) reveals that the square root of the AVEfor each component is greater than the correlation between components (Fornell andLarcker, 1981). These findings provide evidence of discriminant validity among thecomponents and the constructs and strong evidence of the scales’ reliability.
5. ResultsPath analysis (AMOS 16) was used to test the model in Figure 1. Path analysis ratherthan structural equation modeling was used due to the small sample size in relation tothe complexity of the model (Kline, 2005). The model parameters were estimated usingthe maximum-likelihood (ML) method and the assumption of multivariate normalityusing Mardia’s multivariate kurtosis statistic. The large value of Mardia’s statistic(27.95) indicates the presence of non-normality. In the absence of multivariatenormality, Yung and Bentler (1996) recommend using a bootstrap procedure to derive
Switching costs
175
Mea
nS
DC
RA
VE
12
34
56
78
9
1.O
rder
ofen
try
2.72
1.02
N/A
N/A
N/A
2.S
wit
chin
gco
sts
3.89
2.16
0.82
0.60
20.
050.
773.
Sp
eed
tom
ark
et6.
751.
780.
780.
640.
27*
*2
0.12
0.80
4.M
ark
etp
erfo
rman
ce6.
991.
300.
800.
500.
23*
*0.
040.
37*
*0.
705.
Fin
anci
alp
erfo
rman
ce7.
361.
630.
860.
760.
18*
0.09
.22
**
0.53
**
0.87
6.C
omp
etit
ive
inte
nsi
ty6.
531.
850.
770.
502
0.23
**
20.
010.
16*
20.
040.
050.
707.
Tec
hn
olog
ical
turb
ule
nce
6.77
2.04
0.90
0.71
20.
020.
27*
*0.
070.
20*
*0.
18*
0.07
0.84
8.M
ark
ettu
rbu
len
ce5.
232.
050.
820.
600.
040.
20*
*0.
19*
*0.
110.
16*
0.21
**
0.35
**
0.78
9.M
ark
etp
oten
tial
7.02
1.61
0.70
0.48
0.13
*0.
110.
13*
0.28
**
0.43
**
20.
020.
38*
*0.
25*
*0.
70
Notes:
Mea
n,t
he
aver
age
scor
efo
ral
lite
ms
incl
ud
edin
this
mea
sure
;SD
,sta
nd
ard
dev
iati
on;C
R,c
omp
osit
ere
liab
ilit
y;A
VE
,av
erag
ev
aria
nce
extr
acte
d;
N/A
,n
otap
pli
cab
le.
Th
en
um
ber
son
the
dia
gon
alar
eth
esq
uar
ero
otof
the
AV
E.
Off
-dia
gon
alel
emen
tsar
eco
rrel
atio
ns
bet
wee
nco
nst
ruct
s
Table III.Descriptive andmeasurement statistics
MIP30,2
176
confidence intervals around the parameter estimates. For this purpose, we used aprocedure to generate 2,000 samples of observations randomly from the originaldataset with replacement. Following Gatignon et al. (1990), we checked whether or notthe estimator of the parameters was sensitive to the addition or deletion of theinteraction terms. The stability of the coefficient estimates was analyzed by estimatinga main-effect-only model. The coefficients’ signs and magnitudes remained the same.Therefore, the authors report the results of the complete model with interactions.Table IV shows the path estimates and confidence intervals. The initial model is fullysaturated model, a typical case of path analysis. However, several paths in the initialmodel are non-significant. That being the case, we re-estimated the model by droppingthe insignificant paths one at a time, to reach a more parsimonious model. The ensuingmodel produces a good fit to the data (x 2 ¼ 8.5, df ¼ 12, p ¼ 0:75, CFI ¼ 1:00,IFI ¼ 1:00, RMSEA ¼ 0:00).
5.1 Main effectsThe results support H1a and H1b, which posit that order of entry has a positive directeffect on speed to market and market performance, respectively (b ¼ 0:30, p , 0:01;b ¼ 0:16, p , 0:01). The results also support H2a, which posits that switching costshave a negative effect on speed to market (b ¼ 20:14, p , 0:05). However, the resultsindicate that no relationship exists between switching costs and market performance.The results thus warrant the rejection of H2b. With respect to the hypotheses about therelationship between performance dimensions, the results support H4 (b ¼ 0:28,p , 0:01) and H6 (b ¼ 0:45, p , 0:01), but not H5.
5.2 Interaction effectsThe interaction effect between switching costs and order of entry on speed to market issignificant and negative (b ¼ 20:15, p , 0:05), providing support for H3a. Theauthors estimate the nature of this interaction using the Aiken and West (1991)procedure, which tests for the significance of regression-coefficient estimates for theindependent variable at one standard deviation below and above the mean of theswitching costs moderator. At a low level of switching costs, the Aiken and West(1991) procedure reveals a strong relationship between order of entry and speed tomarket (b ¼ 0:45, p , 0:01). The procedure reveals a moderate relationship at a highlevel of switching costs (b ¼ 0:16, p , 0:05) (Figure 2).
The results support H3b, which posits a negative interaction effect between order ofentry and switching costs on market performance (b ¼ 20:11, p , 0:05). Use of theAiken and West (1991) procedure reveals a strong positive relationship between orderof entry and market performance (0.27, p , 0:01) at a low level of switching costs. At ahigh level of switching costs, the relationship between order of entry and marketperformance is not significant (Figure 3).
5.3 Mediation effectsThe literature offers several methods that researchers may use to test mediationeffects. MacKinnon et al. (2002) evaluate 14 methods in terms of their statistical powerand find that the method that researchers commonly use to test mediation, whichBaron and Kenny (1986) recommend, has the lowest statistical power of the 14 methodsthey examine. To develop more accurate estimates of the standard error of indirect
effects, Shrout and Bolger (2002) suggest a bootstrap procedure, which the authors usein this study (randomly generating 2,000 subsamples) to test the significance ofindirect effects.
The results of this study show that order of entry has a significant indirect effect onfinancial performance (b ¼ 0:11, confidence interval [0.06, 0.17], p , 0:01), via speed tomarket and market performance. In addition, switching costs have a significantindirect effect on market performance (b ¼ 20:04, confidence interval [20.07, 2 0.01],p , 0:05). Finally, speed to market has an indirect effect on financial performance(b ¼ 0:13, confidence interval [0.07, 0.19], p , 0:01).
Figure 2.Effect of order of entry on
speed to market underhigh, intermediate, andlow levels of switching
costs
Figure 3.Effect of order of entry onmarket performance under
high, intermediate, andlow levels switching costs
Switching costs
179
6. Discussion and managerial implicationsThe results from contrasting the model warrant the following claims:
. the advantages that academics associate with an early entry in the market arereal;
. switching costs do not improve the performance of a product; and
. the switching costs that consumers perceive with respect to pioneering productsare relatively high compared to follower products.
In addition, this study adds to the scarce literature and body of knowledge on SMEs.SME-related literature reveals that these firms face many shortcomings, including astrong short-term orientation and difficulties when it comes to delegating innovativetasks. Therefore, the results of this study may help these firms balance their resourcesand improve their business performance.
Our results are consistent with recent empirical research, for example Rosenbuschet al. (2010). SME managers who focus exclusively on creating innovative offeringsmiss important dimensions that are essential for realizing the value that innovation canprovide to their firms. Specifically, SMEs should take into account the role thatswitching costs might have in information technology resources (Chen and Hitt, 2007)or how to reduce the negative effect of switching costs (Maicas et al. 2009). To sum up,these findings underline the importance for SMEs to manage the innovation processdiligently (Hart et al., 2003).
The results of this study indicate that when a firm has an opportunity to enter amarket ahead of the competition, the firm has an incentive to speed up the developmentof new products. The advantages that researchers commonly attribute to pioneeringproducts, together with the positive effects on a firm’s image, serve as a stimulus tomeeting the launch schedule. These key competitive advantage I highly relevant forSMEs because it will be helpful to establish a standard in the market and block futurecompetitors entries in the market. In addition, pioneering products perform the best inthe market, which one may attribute to the possibility of creating entry barriers to newcompetitors and the positive effects on the cognitive, affective, and behavioral aspectsof consumers. As an indirect effect of the speed-to-market and market performance, anearly entry produces the best financial performance. These financial performancemeasures will be very helpful for SMEs as financial performance measures are amongthe most important for this type of firm.
Switching costs have a negative effect on speed to market and it is more critical forSMEs. As a consequence, firms that compete in markets where consumers experiencehigh switching costs are reluctant to enter those markets. SMEs experience manybarriers (technical, financial, etc.) when entering a new market and switching cost isanother barrier these firms need to face. Therefore, SMEs might be reluctant to enterthese markets as the turnover from them will be reduce due to the negative effect onspeed to market. The fear of firms regarding the slow adoption of new products byconsumers normally results in the firm not meeting the launching schedule. Bettermarket performance does not compensate for this negative effect of switching costs onthe speed to market. This speed to market objective is very important for SMEsbecause of their limited resources and their objective of achieving the break-even pointas soon as possible.
MIP30,2
180
However, contrary to what researchers sometimes claim, switching costs do not leadto higher levels of consumer retention. A possible reason for this state of affairs is that,although the various switching costs may act as barriers and encourages retention,they can also lead to frustration and a sense of entrapment in cases where consumersare dissatisfied. In such instances, consumers are likely to vent their dissatisfactionexternally, in the form of negative word of mouth (Lam et al., 2004). As a consequence,firms that use this type of policy may be unable to attract new consumers (Bansal et al.,2005). As a consequence, SMEs should not focus their competitive advantage only onpast gains but instead on looking into new improvements or products that can satisfiedconsumers in these markets.
In addition, switching costs constitute a form of dependence that may promptconsumers to deliberately pursue dependence-balancing strategies (Pae and Hyun,2002), for instance by remaining open to alternatives or exploring new suppliers (Heideand Weiss, 1995). In short, the sustainability of the advantage based on the switchingcosts is open to question, given that the rationality of the consumers and the firm’sreputation may remove the initial advantage.
With regard to the interaction between order of entry and switching costs, theresults of this study indicate that the positive effect of the pioneering strategy is notrelated to switching costs. On the contrary, the costs that the consumers of pioneeringproducts experience reduce the advantages of the firm that launches them to a greaterextent than the costs that the consumers of follower products face. Most studies do nottake into account the fact that the consumers of pioneering products also faceswitching costs between the different generations and types of product. These studiesmight be assuming that all pioneers launch their products to meet a need that productsthat are currently on the market are not meeting, which implies that consumers will notneed to switch at all. However, in reality, in most cases, consumers do switch, evenwhen a product can be categorized as a pioneering product.
Using the results of this study as a basis, the authors recommend that SMEs opt foran early market entry when switching costs are not high, because this strategy has apositive effect on the result of the products launched onto the market. When switchingcosts are high, this recommendation does not apply, because in this case the effortneeded to overcome the change counterbalances the intrinsic advantages of thepioneering firms and the economic results are similar to those that following firmsachieve. The results of the study indicate that using switching costs as a strategy forretaining consumers is not viable and instead SMEs should reinforce their new productofferings to the market to improve customer retention.
7. Limitations and future research guidelinesThis study has certain limitations. The study uses subjective measures that use theperceptions of managers as a basis. Despite the extensive use of such retrospectiveperceptual data in research on strategy, especially in research on new products, theauthors cannot rule out the possibility that using subjective measures is biasing theresults of the study. Consequently, the authors advise readers to use caution wheninterpreting the findings. Furthermore, although a sample of firms in a varied set ofindustries allows for the generalization of the results beyond the idiosyncratic nature ofindividual industries, studies at the level of a single industry would be useful forvalidating the results.
Switching costs
181
Secondly, in the study, one key informant provides the data for each company.Aviolo et al. (1991) note that studies that use a single-source methodology may sufferfrom bias in the form of artificially high inter-correlations that an overall, positive ornegative, response bias may cause. However, they also observe, that simply assumingthat single-source data are less valid than multi-source data is overly simplistic.Without minimizing the importance of common method bias, the different dataanalyses that the authors of the present study conduct support the relative absence ofsuch a bias. However, future research should address the single-source issue, becauseexisting studies draw attention to the diversity of goals and perceptions that the R&D,manufacturing, and marketing functions have regarding what drives the performanceof new products (Song et al., 2005).
Clearly, researchers can learn much more by expanding and refining therelationships that the current authors investigate here. Firstly, including broaderswitching cost typologies (Burnham et al., 2003) to generate additional insights wouldbe interesting. For example, cost of searching out, evaluating and learning about newproduct might have a different impact on market performance that the psychologicalcosts because they generate a different sensation of frustration. Using a global measureprovides little guidance for managing the switching costs that consumers perceive, andforces respondents to combine multi-dimensional ratings in their minds.
Secondly, this study only examines the moderating effects of one barrier to marketentry, i.e. switching costs. Future research should explore how other barriers affect therelationship between order of entry and the performance of new products. For example,cost advantages of incumbents or capital requirements might be a more powerfulbarrier to market entry of competitors than switching costs. A joint study of pioneers’advantages will help in making a more precise recommendation about the correctstrategy for firms.
A third way of developing the model that the present authors propose is todifferentiate between short-term and long-term results. Probably, pioneeringcompanies see switching costs reflected in a most negative manner in short-termrather than long-term results. Besides, with time, once market position is consolidated,the relation can become positive and follower companies are those who have to breakthe inertia of consumers and overcome the switching costs generated by pioneeringproducts on the market.
In addition, it would be interesting to gain a deeper insight into the existence of agap between innovation inputs and innovation outputs. Hence, more research is neededto explain how much of the resources dedicated to innovation are squandered and howSMEs should manage the innovation process (Rosenbusch et al., 2010). Moreover,cross-national studies should be conducted to compare the strength of the frameworkand assess its generalizability across varying business systems and organizationalforms. Thus, the extension of this study to other local, national or European areaswould allow to obtain further results and confirm the ones from this study (Massa andTesta, 2008).
References
Aiken, L.S. and West, S.G. (1991), Multiple Regression: Testing and Interpreting Interactions,Sage Publications, Thousand Oaks, CA.
MIP30,2
182
Ali, A., Krapfel, R. and LaBahn, D. (1995), “Product innovativeness and entry strategy: impact oncycle time and break-even time”, Journal of Product Innovation Management, Vol. 12 No. 1,pp. 54-69.
Alpert, F.H. and Kammis, M.A. (1994), “Pioneer brand advantage and consumer behavior:a conceptual framework and propositional inventory”, Journal of the Academy ofMarketing Science, Vol. 22 No. 3, pp. 244-53.
Anderson, E.W. and Sullivan, M.W. (1993), “The antecedents and consequences of customersatisfaction for firms”, Marketing Science, Vol. 12 No. 2, pp. 125-43.
Anderson, J.C. and Gerbing, D.W. (1988), “Structural equation modelling in practice: a review andrecommended two-step approach”, Psychological Bulletin, Vol. 103 No. 3, pp. 411-23.
Armstrong, J.S. and Overton, T.S. (1977), “Estimating nonresponse bias in mail surveys”, Journalof Marketing Research, Vol. 14 No. 3, pp. 396-402.
Atuahene-Gima, K. (2003), “The effects of centrifugal and centripetal forces on productdevelopment speed and quality: how does problem solving matter?”, Academy ofManagement Journal, Vol. 46 No. 3, pp. 359-73.
Atuahene-Gima, K. (2005), “Resolving the capability-rigidity paradox in new productinnovation”, Journal of Marketing, Vol. 69 No. 3, pp. 61-83.
Aviolo, B.J., Yammarino, F.J. and Bass, B.M. (1991), “Identifying common methods variance withdates collected from a single source: an unresolved sticky issue”, Journal of Management,Vol. 17 No. 4, pp. 571-87.
Bagchi-Sen, S. (2001), “Product innovation and competitive advantage in an area of industrialdecline, the Niagara region of Canada”, Technovation, Vol. 21 No. 1, pp. 45-54.
Bagozzi, R.P. and Yi, Y. (1988), “On the evaluation of structural equation models”, Journal of theAcademy of Marketing Science, Vol. 16 No. 1, pp. 74-94.
Bansal, H.S., Taylor, S.F. and James, Y. (2005), “Migrating to new service providers: toward aunifying framework of consumers’ switching behaviors”, Journal of the Academy ofMarketing Science, Vol. 33 No. 1, pp. 96-115.
Baron, R.M. and Kenny, D.A. (1986), “The moderator-mediator variable distinction in socialpsychological research: conceptual, strategic, and statistical considerations”, Journal ofPersonality and Social Psychology, Vol. 51 No. 6, pp. 1173-82.
Bell, S.J., Auh, S. and Smalley, K. (2005), “Customer relationship dynamics: service quality andcustomer loyalty in the context of varying levels of customer expertise and switchingcost”, Journal of the Academy of Marketing Science, Vol. 33 No. 2, pp. 169-83.
Boulding, W. and Christen, M. (2003), “Sustainable pioneering advantage? Profit implications ofthe market entry order”, Marketing Science, Vol. 22 No. 3, pp. 371-92.
Bowman, D. and Gatignon, H. (1996), “Order of entry as a moderator of the effect of themarketing mix on market share”, Marketing Science, Vol. 15 No. 3, pp. 222-42.
Burnham, T.A., Frels, J.K. and Mahajan, V. (2003), “Consumer switching costs: a typology,antecedents, and consequences”, Journal of the Academy of Marketing Science, Vol. 31No. 2, pp. 109-26.
Buzzell, R.D. (2004), “The PIMS program of strategy research: a retrospective appraisal”, Journalof Business Research, Vol. 57 No. 5, pp. 478-83.
Carbonell, P. and Rodrıguez, A.I. (2006), “Designing teams for speedy product development: themoderating effect of technological complexity”, Journal of Business Research, Vol. 59 No. 2,pp. 225-32.
Carpenter, G.S. and Nakamoto, K. (1989), “Consumer preference formation and pioneeringadvantage”, Journal of Marketing Research, Vol. 26 No. 3, pp. 285-98.
Switching costs
183
Chen, P.-Y. and Hitt, L.M. (2007), “Information technology and switching costs”, in Hendershott, T.(Ed.), Handbook on Economics and Information Systems, Elsevier, Oxford.
Coeurderoy, R. and Durand, R. (2004), “Leveraging the advantage of early entry: proprietarytechnologies versus cost leadership”, Journal of Business Research, Vol. 57 No. 6,pp. 583-90.
Cooper, R.G. and Kleinschmidt, E.J. (1994), “Determinants of timeliness in product development”,Journal of Product Innovation Management, Vol. 11 No. 5, pp. 381-96.
Doern, R. (2009), “Investigating barriers to SME growth and development in transitionenvironments”, International Small Business Journal, Vol. 27 No. 3, pp. 275-305.
Dube, J.P., Hitsch, G.J. and Rossi, P.E. (2009), “Do switching costs make markets lesscompetitive?”, Journal of Marketing Research, Vol. 46 No. 4, pp. 435-45.
Edelman, L.F., Brush, C.G. and Manolova, T. (2005), “Co-alignment in the resource-performancerelationship, strategy as mediator”, Journal of Business Venturing, Vol. 20 No. 3, pp. 359-83.
Farrell, J. and Klemperer, P. (2002), “Coordination and lock-in: competition with switching costsand network effects”, Handbook of Industrial Organization, Vol. 3, Elsevier, Oxford.
Faul, F., Erdfelder, E., Lang, A. and Buchner, A. (2007), “G *Power 3: a flexible statistical poweranalysis program for the social, behavioral and biomedical science”, Behavioral ResearchMethods, Vol. 39 No. 2, pp. 175-91.
Fornell, C. (1992), “National satisfaction barometer: the Swedish experience”, Journal ofMarketing, Vol. 56 No. 1, pp. 6-21.
Fornell, C. and Larcker, D.F. (1981), “Evaluating structural equation models with unobservablevariables and measurement error”, Journal of Marketing Research, Vol. 18 No. 1, pp. 39-50.
Gatignon, H., Weitz, B. and Bansal, P. (1990), “Brand introduction strategies and competitiveenvironments”, Journal of Marketing Research, Vol. 27 No. 4, pp. 77-90.
Golder, P.N. and Tellis, G.J. (1993), “Pioneer advantage: marketing logic or marketing legend?”,Journal of Marketing Research, Vol. 30 No. 2, pp. 158-70.
Griffin, A. and Page, A.L. (1996), “PDMA success measurement project: recommended measuresfor product development success and failure”, Journal of Product Innovation Management,Vol. 13 No. 2, pp. 478-96.
Gupta, A.K. and Souder, W.E. (1998), “Key drivers of reduced cycle time”, Research TechnologyManagement, Vol. 41 No. 4, pp. 38-43.
Hart, S. (1993), “Dimensions of success in new product development: an exploratoryinvestigation”, Journal of Marketing Management, Vol. 9 No. 1, pp. 23-41.
Hausman, A. (2005), “Innovativeness among small business, theory and propositions for futureresearch”, Industrial Marketing Management, Vol. 34 No. 8, pp. 773-82.
Heide, J.B. and Weiss, A.M. (1995), “Vendor consideration and switching behavior for buyers inhigh-technology markets”, Journal of Marketing, Vol. 59 No. 3, pp. 30-43.
Henard, D.H. and Szymanski, D.M. (2001), “Why some new products are more successful thanothers?”, Journal of Marketing Research, Vol. 38 No. 3, pp. 362-75.
Hendricks, K.B. and Singhal, V.R. (1997), “Delays in new product introductions and the marketvalue of the firm: the consequences of being late to the market”, Management Science,Vol. 43 No. 4, pp. 422-36.
Holak, S.L. and Lehmann, D.R. (1990), “Purchase intentions and the dimensions of innovation:an exploratory model”, Journal of Product Innovation Management, Vol. 7 No. 1, pp. 59-73.
Hooley, G.J., Greenley, G.E., Cadogan, J.W. and Fahy, J. (2005), “The performance impact ofmarketing resources”, Journal of Business Research, Vol. 58 No. 1, pp. 18-27.
MIP30,2
184
Huang, X., Soutar, G.N. and Brown, A. (2004), “Measuring new product success: an empiricalinvestigation of Australian SMEs”, Industrial Marketing Management, Vol. 33 No. 2,pp. 117-23.
Iyer, G.R., LaPlaca, P.J. and Sharma, A. (2006), “Innovation and new product introductions inemerging markets: strategic recommendations for the Indian market”, IndustrialMarketing Management, Vol. 35 No. 3, pp. 373-82.
Jones, M.A., Mothersbaugh, D.L. and Beatty, S.E. (2002), “Why customers stay: measuring theunderlying dimensions of services switching costs and managing their differentialstrategic outcomes”, Journal of Business Research, Vol. 55 No. 6, pp. 441-50.
Kalyanaram, G., Robinson, W. and Urban, G. (1995), “Order of market entry: establishedempirical generalizations, emerging empirical generalizations, and future research”,Marketing Science, Vol. 14 No. 3, pp. 212-21.
Karakaya, F. and Stahl, M.J. (1989), “Barriers to entry and market decisions in consumer andindustrial goods markets”, Journal of Marketing, Vol. 53 No. 2, pp. 80-91.
Kardes, F.R. and Kalyanaram, G. (1992), “Order-of-entry effects on consumer memory andjudgment: an information integration perspective”, Journal of Marketing Research, Vol. 29No. 3, pp. 343-57.
Kerin, R.A., Varadarajan, R. and Peterson, R.A. (1992), “First-mover advantage: a synthesis,conceptual framework, and research propositions”, Journal of Marketing, Vol. 56 No. 1,pp. 33-52.
Kline, R. (2005), Principles and Practice of Structural Equation Modeling, Guilford Press,New York, NY.
Knight, G. (2001), “Entrepreneurship and strategy in the international SME”, Journal ofInternational Management, Vol. 7 No. 1, pp. 155-71.
Kohli, C. (1999), “Signaling new product introductions: a framework explaining the timing ofpreannouncements”, Journal of Business Research, Vol. 46 No. 1, pp. 45-56.
Krishnan, T.V., Bass, F.M. and Kumar, V. (2000), “Impact of a late entrant on the diffusion of anew product/service”, Journal of Marketing Research, Vol. 37, May, pp. 269-78.
Lam, S.Y., Shankar, V., Erranilli, M.K. and Murthy, B. (2004), “Customer value, satisfaction,loyalty, and switching costs: an illustration from a business-to-business service context”,Journal of the Academy of Marketing Science, Vol. 32 No. 3, pp. 293-311.
Lambert, D. and Slater, S.F. (1999), “Perspective: first, fast, and on time: the path to success. Or isit?”, Journal of Product Innovation Management, Vol. 16 No. 5, pp. 427-38.
Langerak, F., Hultink, E.J. and Griffin, A. (2008), “Exploring mediating and moderatinginfluences on the links among cycle time, proficiency in entry timing, and new productprofitability”, Journal of Product Innovation Management, Vol. 25 No. 4, pp. 370-85.
Larson, P.D. and Chow, G. (2003), “Total cost/response rate trade-offs in mail survey research:impact of follow-up mailings and monetary incentives”, Industrial MarketingManagement, Vol. 37 No. 3, pp. 533-7.
Lee, Y. and O’Connor, G.C. (2003), “The impact of communication strategy on launching newproducts: the moderating role of product innovativeness”, Journal of Product InnovationManagement, Vol. 20 No. 1, pp. 4-21.
Lieberman, M.B. and Montgomery, D.B. (1998), “First-mover (dis)advantages: retrospective andlink with the resource-based view”, Strategic Management Journal, Vol. 19 No. 12,pp. 1111-25.
Lukas, B. and Menon, A. (2004), “New product quality: intended and unintended consequences ofnew product development speed”, Journal of Business Research, Vol. 57 No. 11, pp. 1258-64.
Switching costs
185
Mackinnon, D.P., Lockwood, C.M., Hoffman, J.M., West, S.G. and Sheets, V. (2002), “A comparisonof methods to test mediation and other intervening variables”, Psychological Methods,Vol. 7 No. 1, pp. 83-104.
Maicas, J.P., Polo, Y. and Sese, F.J. (2009), “Reducing the level of switching costs in mobilecommunications: the case of mobile number portability”, Telecommunications Policy,Vol. 33 No. 9, pp. 544-54.
Massa, S. and Testa, S. (2008), “Innovation and SMEs, misaligned perspectives and goals amongentrepreneurs, academics, and policy makers”, Technovation, Vol. 28 No. 7, pp. 393-407.
Menguc, B. and Auh, S. (2006), “Creating a firm-level dynamic capability through capitalizing onmarket orientation and innovativeness”, Journal of the Academy of Marketing Science,Vol. 34 No. 1, pp. 63-73.
Miller, A., Gartner, W.B. and Wilson, R. (1989), “Entry order, market share, and competitiveadvantage: a study of their relationships in new corporate ventures”, Journal of BusinessVenturing, Vol. 4 No. 2, pp. 197-209.
O’Regan, N., Ghibadian, A. and Sims, M. (2005), “Fast tracking innovation in manufacturingSMEs”, Technovation, Vol. 26 No. 2, pp. 251-61.
Pae, J.P. and Hyun, J.S. (2002), “The impact of technology advancement strategies on consumers’patronage decisions”, Journal of Product Innovation Management, Vol. 19 No. 5, pp. 375-83.
Pissarides, F. (1999), “Is lack of funds the main obstacle to growth? EBRD’s experience withsmall- and medium-sized businesses in Central and Eastern Europe”, Journal of BusinessVenturing, Vol. 14 No. 5, pp. 519-39.
Podsakoff, P.M., Mackenzie, S.B., Lee, J. and Podsakoff, N.P. (2003), “Common method biases inbehavioral research: a critical review of the literature and recommended remedies”, Journalof Applied Psychology, Vol. 20 No. 5, pp. 879-903.
Porter, M.E. (1980), Competitive Strategy, The Free Press, New York, NY.
Qian, G. (2002), “Multinationality, product diversification, and profitability of emerging USsmall- and medium-sized enterprises”, Journal of Business Venturing, Vol. 17 No. 6,pp. 611-33.
Robinson, W.T. and Chiang, J. (2002), “Product development strategies for established marketpioneers, early followers, and late entrants”, Strategic Management Journal, Vol. 23 No. 4,pp. 855-66.
Rodriguez-Pinto, J., Rodriguez-Escudero, A.I. and Gutierrez-Cillan, J. (2008), “Order, positioning,scope and outcomes of market entry”, Industrial Marketing Management, Vol. 37 No. 2,pp. 154-66.
Rosenbusch, N., Brinckmann, J. and Bausch, A. (2010), “Is innovation always beneficial?A meta-analysis of the relationship between innovation and performance in SMEs”,Journal of Business Venturing, Vol. 26 No. 4, pp. 441-57.
Schmalensee, R. (1982), “Product differentation advantages of pioneering brands”, AmericanEconomic Review, Vol. 72 No. 3, pp. 349-65.
Shankar, V., Carpenter, G.S. and Krishnamurhti, C. (1998), “Late mover advantage: howinnovative late entrants outsell pioneers”, Journal of Marketing Research, Vol. 35 No. 1,pp. 54-70.
Shepherd, W. (1979), The Economics of Industrial Organization, Prentice Hall, Englewood Cliffs,NJ.
Shrout, P.E. and Bolger, N. (2002), “Mediation in experimental and nonexperimental studies: newprocedures and recommendations”, Psychological Methods, Vol. 7 No. 3, pp. 422-45.
MIP30,2
186
Sivadas, E. and Dwyer, F.R. (2000), “An examination of organizational factors influencing newproduct success in internal and alliance-based processes”, Journal of Marketing, Vol. 64No. 1, pp. 31-49.
Slater, S.F. and Narver, J.C. (1994), “Does competitive environment moderate the marketorientation-performance relationship?”, Journal of Marketing, Vol. 58 No. 1, pp. 46-55.
Song, M., Droge, C., Hanvanich, S. and Calantone, R. (2005), “Marketing and technology resourcescomplementary: an analysis of their interaction effect in two environmental contexts”,Strategic Management Journal, Vol. 26 No. 3, pp. 35-47.
Szymanski, D.A., Bharadwaj, S.G. and Varadarajan, P.R. (1993), “An analysis of the marketshare-profitability relationship”, Journal of Marketing, Vol. 57 No. 3, pp. 1-18.
Tatikonda, M.V. and Montoya-Weiss, M.M. (2001), “Integrating operations and marketingperspectives of product innovation: the influence of organizational process factors andcapabilities on development performance”, Management Science, Vol. 47 No. 1, pp. 151-72.
Yung, Y.F. and Bentler, P.M. (1996), “Bootstrapping techniques in analysis of mean andcovariance structures”, in Marcoulides, G.A. and Schumacker, R.E. (Eds), AdvancedStructural Equation Modeling. Issues and Techniques, Lawrence Erlbaum Associates,Mahwah, NJ, pp. 125-57.
Further reading
Kessler, E.H. and Bierly, P.E. (2002), “Is faster really better? An empirical test of the implicationof innovation speed”, IEEE Transactions on Engineering Management, Vol. 49 No. 1,pp. 2-12.
About the authorsFrancisco-Jose Molina-Castillo (PhD, University of Murcia) is an Assistant Professor ofMarketing at the University of Murcia, Spain. His work has been published in IndustrialMarketing Management, Journal of Product Innovation Management, Technovation,International Journal of Information Management, Electronic Markets, Information& Management, and other journals. Francisco-Jose Molina-Castillo is the correspondingauthor and can be contacted at: [email protected]
Ana-Isabel Rodriguez-Escudero (PhD, University of Valladolid) is a Professor of Marketing atthe University of Valladolid, Spain. His work has been published in International Journal ofResearch in Marketing, Marketing Letters, Journal of Business Research, Industrial MarketingManagement, European Journal of Marketing and other journals.
Jose-Luis Munuera-Aleman (PhD, Universidad Autonoma of Madrid) is a Professor ofMarketing at the University of Murcia, Spain. His work has been published in IndustrialMarketing Management, Journal of Product Innovation Management, Technovation, Journal ofBusiness Research, Marketing Letters, Journal of Advertising, and European Journal ofMarketing.
Switching costs
187
To purchase reprints of this article please e-mail: [email protected] visit our web site for further details: www.emeraldinsight.com/reprints