47
Marketing Metrics that Matter How to Present Analytics that Speak the C-Suite’s Language Gary Druckenmiller, Jr. Marketing Practice Lead Evariant

Marketing Metrics that Matter How to Present Analytics that Speak the C-Suite’s Language
Gary Druckenmiller, Jr.Marketing Practice LeadEvariant
The leading provider of a healthcare CRM platform designed to help health systems thrive in today’s hyper-competitive and rapidly changing environment.
See all our events and get registered by visiting Evariant.com/events or email [email protected].
About Evariant

Meet your speaker
Gary Druckenmiller, Jr.Marketing Practice LeadEvariant
Agenda
› What You Think› The Dashboard Dilemma › CRM Meets Rev Cycle Meets The Street› Next Wave Executive Insight Systems› Introducing the “Executive Dashboard”› Final Thoughts

ROI is the LOWEST ranked metric currently measured. 26%.
Go figure. It’s the one metric most are looking for.

Referrals. Direct Mail. Offline ads. Spotty.
We can do better.

We share majority of our metrics with the C-Suite. But we show mainly non-financial type data (no ROI).
Perfect.

C-suite. BOD. Leading councils. Clinical Directors. Practice Leads. The President.
Ya know, just your average staff members.

92 of you answered. Almost 90% requested real life dashboard views spat out by a real life CRM analytics insight system. We can do that.

The Dashboard Dilemma

Get a Broom, Cuz it’s a Mess
› Many financial and IT execs see the dashboard as an elegant and efficient replacement for the “daily/weekly/monthly spreadsheet”
› But report users (and authors) quickly realized that the design flexibility and number-crunching capability of Excel was not easily replicated in the dashboard environment
› As a result, non-expert dashboard “users” became easily lost in the data or—more importantly—failed to garner any insight at all
› Top executives have traditionally relied on highly screened and carefully analyzed data to guide them in key decisions and day-to-day management
› Off-the-shelf dashboards lack a “smart layer” of CRM caliber data preparation and computational capability to provide these essential requirements and consequently have been unsuccessful in C-suite

Non-screened Data

Off the Shelf Dashboards
What an Executive Doesn’t Want
› For years, top managers have demonstrated a disdain for logging into business intelligence systems, learning how to use them and being faced with too many options.
› These systems don’t deliver answers in their output—they deliver simplistic “data-sets” that are highly aggregated and require the user to drill into layers of intelligence.
› Few executives have the time or interest to take deep dives into row/column detail; Answers are what executives want.
› And they expect that effort to be done for them. Executives don’t want to wait in line, wait on hold or wait for a screen to keep loading.

› Ability to extract data from existing internal systems and a fast-growing universe of high-quality external resources.
› Validate, integrate, and analyze the data using advanced analytics driven primarily through a CRM system.
› Utilize creative and highly-annotated computer graphics to intuitively reveal trends, correlations and business impact that is elusive in dashboards that are unsophisticated in their graphics capability.
› Publish the results in secure, easy-to-use snapshots that are identical on both the desktop and the mobile tablet.
Executive Insight Requirements

CRM Meets Rev Cycle Meets The Street

Executives in the Dark Peeves
› Strategic metrics typically involve querying no less than a half-dozen disconnected data sources
› Trusting a team of analysts to do the math accurately, and waiting sometimes weeks for the results
› By which time, the data is stale and the ability to act at the speed of business is significantly diminished

› What risk, economic and competitive trends are likely to impact performance
› Which marketing and promotional activities directly contribute to revenue
› How are services, brands and system strategies perceived by markets and consumers
Executives in the Dark Needs

› Specialist “users” have long enjoyed the benefits of charts and graphs that have become ubiquitous in a CRM that can undeniably reconcile downstream ROI
› But the executive “user” typically finds the simplicity and over-aggregation of these charts uninformative
› Properly designed CRM data visualizations wildly transcend the “summary chart” of a static dashboard and add trend lines, highlights, narrative and insight that the executive has come to trust and respect in slide decks and detailed analyst reports
You MUST have CRM

The Dreaded Summary Chart
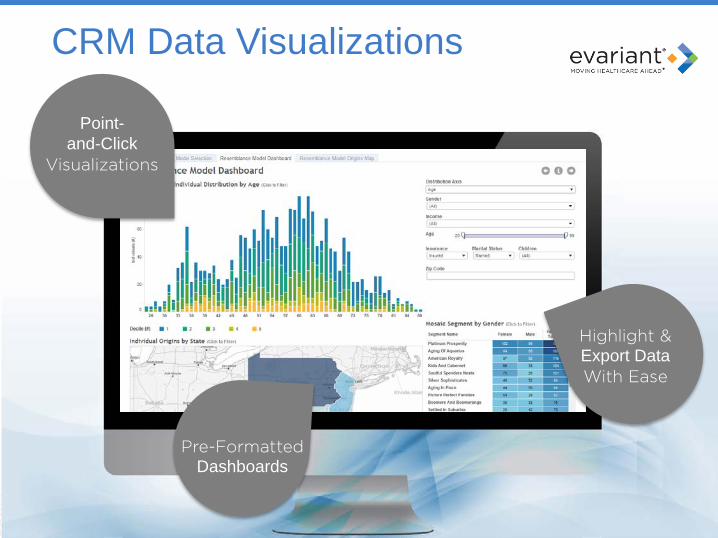
CRM Data Visualizations
Point-and-Click
Visualizations
Highlight & Export Data With Ease
Pre-Formatted Dashboards

Next Wave Executive Insight Systems

› Next-wave executive insight systems are characterized by a fusion of speed, flexibility and ease of use. Without these 3 elements, almost any approach will fail
› Dashboard vendors are primarily focused on serving large user populations and offer generic approaches that simplify dashboard design and management
› A majority of vendors lack the ability to insert an algorithm, model or process between the raw data and the end user and therefore are predestined to be robotic
› Dynamic data visualization (interactive graphics updated from streaming data and on-the-fly analytics) empowers executive insight by replicating the enlightening executive graphics that slide decks and analyst reports convey
› You need a CRM tool to supply the visualizations needed which provide on-demand analytics based on algorithmic logic and automated data
Rubber? Meet Road.

› Make it fast
› Calculate answers
› Eliminate drill downs
› Use carefully designed data visualizations
› Notify users of changes as they happen
Insight System Best Practices

Introducing the “Executive Dashboard”
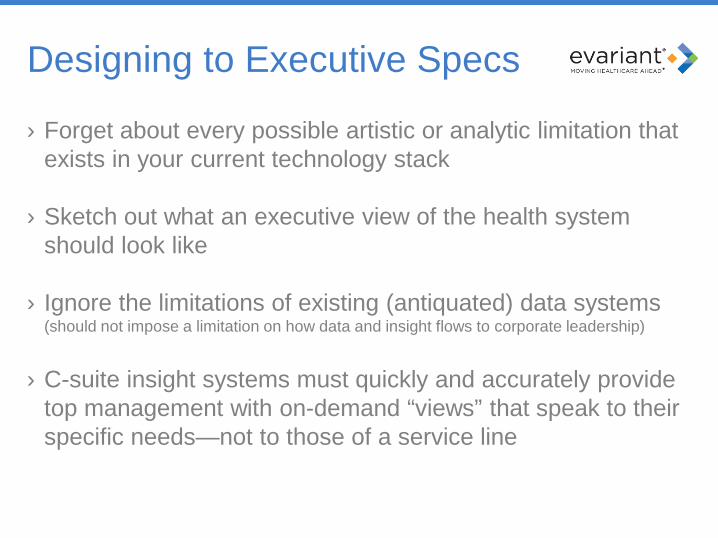
› Forget about every possible artistic or analytic limitation that exists in your current technology stack
› Sketch out what an executive view of the health system should look like
› Ignore the limitations of existing (antiquated) data systems (should not impose a limitation on how data and insight flows to corporate leadership)
› C-suite insight systems must quickly and accurately provide top management with on-demand “views” that speak to their specific needs—not to those of a service line
Designing to Executive Specs

READY?
HOW TO PRESENTTHE TOP 8
C-SUITE METRICS

Key Takeaways
Your Top 5 List
› Think…my best “highlights”› The absolute TOP numbers› Be positive AND negative› But focus on the positive› Varying data-sets› Set the tone of story

Key Takeaways

Rolling Performance
Month-to-MonthQuarter-to-Quarter
› Executive summary of data› Cuts across several areas› Demonstrate progression› Entirely quantitative› Show cumulative growth› End with ROI


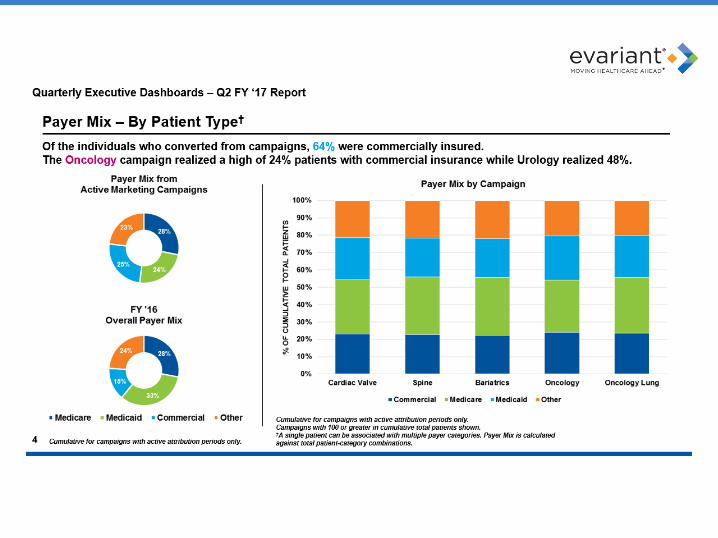
Payer Mix
By Patient Type
› Existing campaign patients› Focus on commercially insured› Cut across service lines› Plus Medicare/Medicaid› Include key highlights

Total Campaigns
Just Those in Market
› Demonstrate maturity growth› Provide completion %’s› Campaign size comparisons› By service lines› Sets the stage for other data


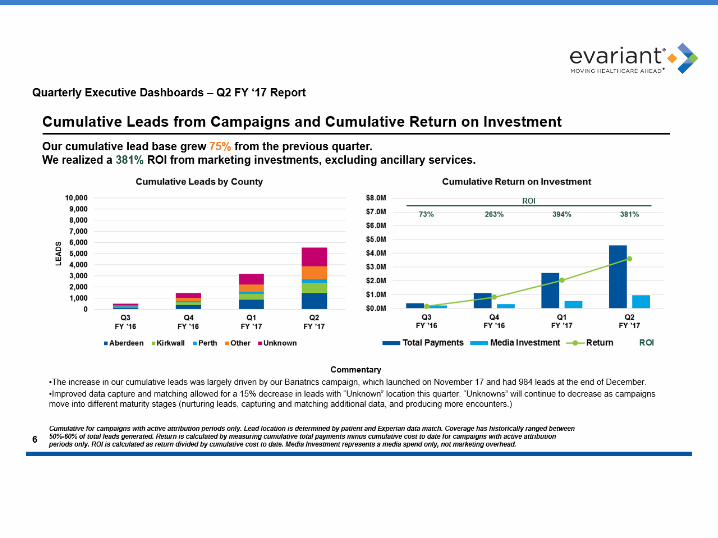
Leads and ROI
Cumulative Numbers
› Demonstrate leads by region› Rolling performance› Show top highlights for both› ROI Line: Payments vs. Expense› Shows “leads” to “$$” comparison

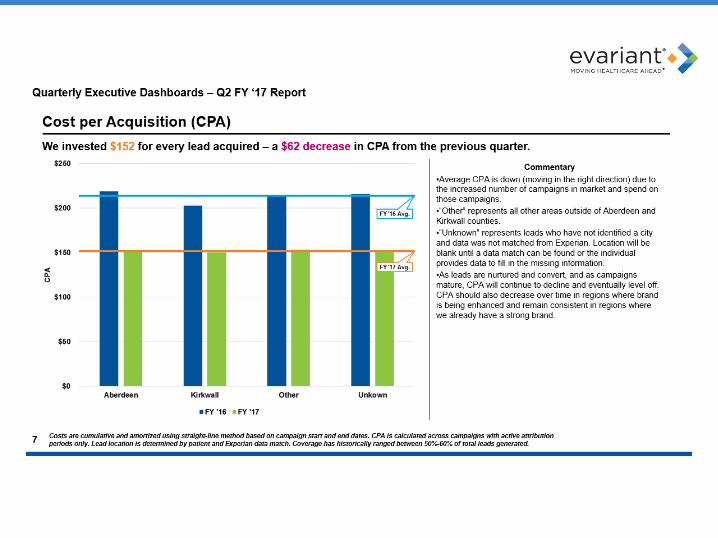
Cost Per Acquisition
The “New” ROI
› Shows how marketing “saves”› The counter measure to ROI› Per lead cost metric › Show by region› Smaller numbers win here

Campaign Metrics
Investment vs. ROI
› Compares investment to ROI › Media investment typically› Top 5 campaigns identified› Service line focus› Need patient conversion data


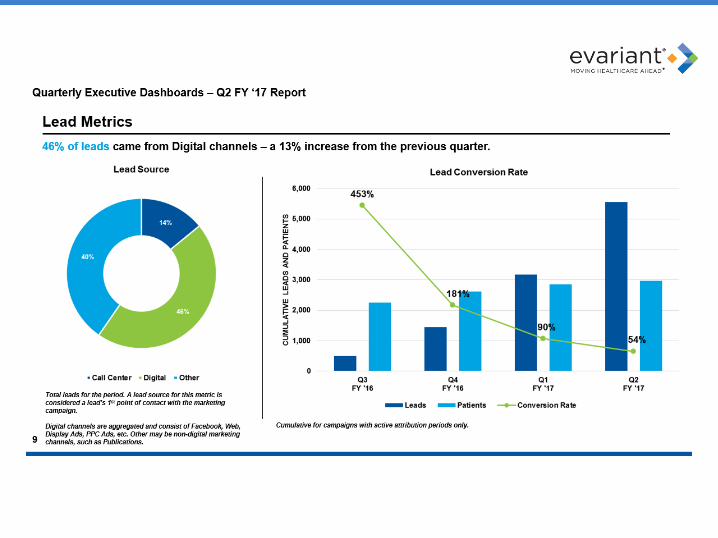
Lead Metrics
Deeper Lead Gen Analysis
› Where do leads come from?› Show top delivery “channels”› Focus on lead “conversions”› Conversion rate is top metric› Show how leads become patients

Final Thoughts
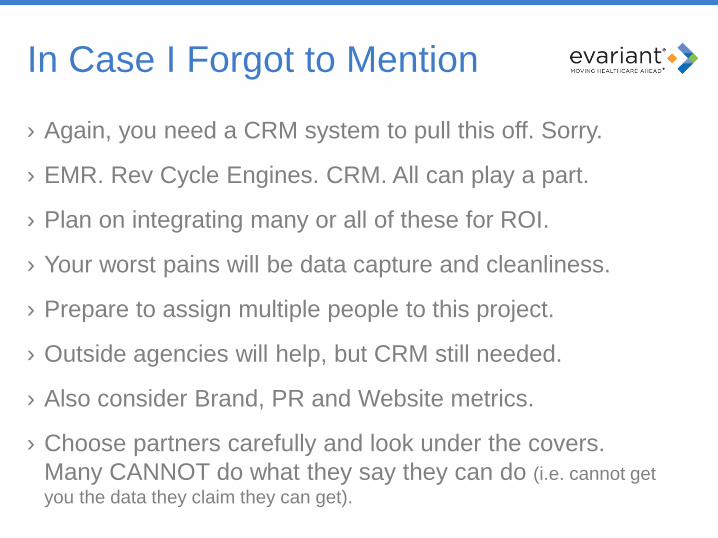
In Case I Forgot to Mention
› Again, you need a CRM system to pull this off. Sorry.
› EMR. Rev Cycle Engines. CRM. All can play a part.
› Plan on integrating many or all of these for ROI.
› Your worst pains will be data capture and cleanliness.
› Prepare to assign multiple people to this project.
› Outside agencies will help, but CRM still needed.
› Also consider Brand, PR and Website metrics.
› Choose partners carefully and look under the covers. Many CANNOT do what they say they can do (i.e. cannot get you the data they claim they can get).

Gary Druckenmiller, Jr.Marketing Practice [email protected]
Visit evariant.com/events to see our full calendar & register for upcoming events
Q&A + Contact Information


