Page 1
[email protected]
The Science & Art of Healthy
Built Environments
-
CPPWAction Institute
Washington DCJune 2010
“We few, we happy few,
we band of brothers” and
sisters . . .
(Walk audits at the
Atlanta kick-off meeting.)
Page 2
[email protected]
Topics for consideration:
• Some perspective . . .
• A brief rant.
• A question of priorities, and 5 recommendations.
• Stickier community designs.
• Putting the MAPPS strategies together.
• Why it really matters!
Page 3
[email protected]
Youthful recollections
Page 4
[email protected]
Not just my idea . . .
The Australian, 14-Oct-2009
30-Nov-2009
Page 5
[email protected]
US “Obesity Epidemic”Ogden et. al. (JAMA 288, 14; Oct. 2002)
10
15
20
25
30
35
1960 1970 1980 1990 2000 2010
% O
bese
(BM
I>30
)
The rant: America’s looming chronic disease apocalypse . . .
Page 6
[email protected]
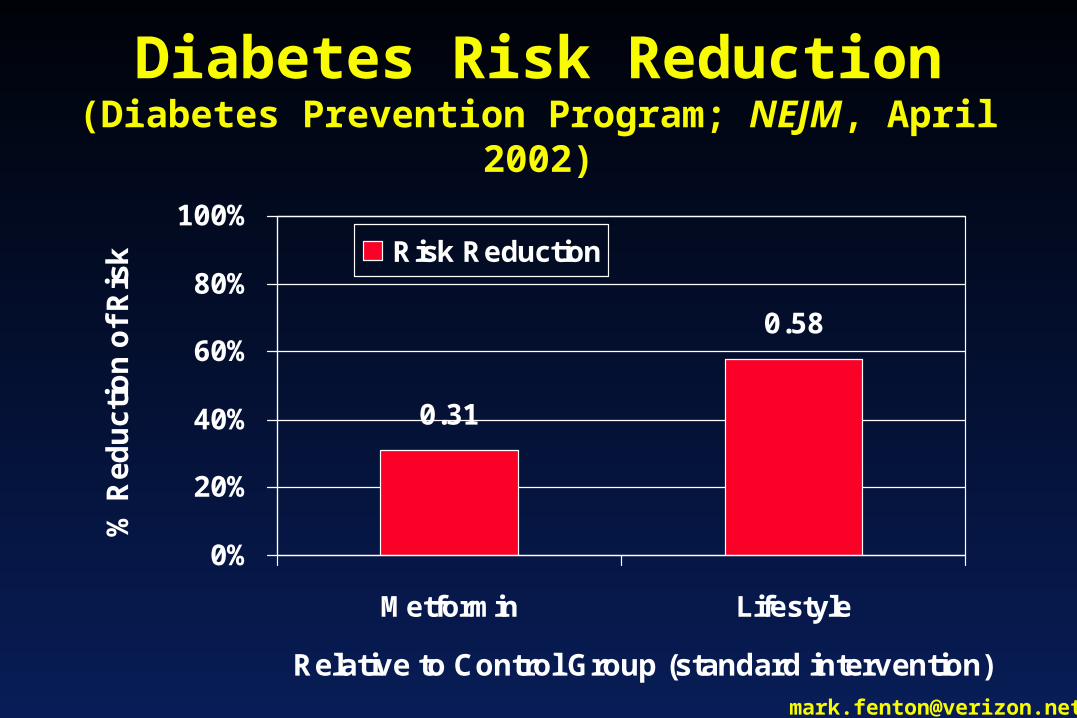
Diabetes Prevention Program(DPP; New.Eng.J.Med., April 2002)
Compared three treatments for nationwide cohort (3,000+) at risk for developing diabetes (elevated fasting glucose).
1. Control: Standard exercise and nutrition counseling; placebo.
2. Standard plus drug treatment: Metformin
3. Intensive lifestyle change: Nutritional training, 150 min./week physical activity.
Page 7
[email protected]
Diabetes Risk Reduction(Diabetes Prevention Program; NEJM, April 2002)
0.31
0.58
0%
20%
40%
60%
80%
100%
Metformin Lifestyle
Relative to Control Group (standard intervention)
% R
ed
uc
tio
n o
f R
isk Risk Reduction
Page 8
[email protected]
My Rant:Change the conversation. It’s not just an obesity epidemic. At the core it is epidemics of physical inactivity and poor
nutrition.
Page 9
[email protected]
Recommendation 1:Think about scale &
effectiveness. Ask the simple question: in how many people is this likely to
actually change behavior?
Page 10
[email protected]
The bad news in just three numbers:
30 Minutes of daily physical activity recommended by national guidelines.
% of American adults who meet the S.G. recommendation (thru LTPA).
,000 Estimated annual deaths in America due to physical inactivity & poor nutrition. (2nd only to tobacco.)
25
365
Page 11
[email protected]
Surgeon General’s Report 1996 Physical Activity Guidelines 2008
• 150 minutes/week of moderate physical activity; more is better.
• Any activity is better than none.
• Can be broken up.
• 300 min/week for children.
• Reduced risk for CVD, diabetes, osteoporosis, dementia in old age, clinical depression, a growing list of cancers, obesity.
Getting some exercise, or just
getting somewhere in Providence?
www.health.gov/paguidelines
Page 12
Leisure Time Physical Activity in the US (MMWR: 50(09), 166-9; 54(39), 991-4]
10
20
30
40
50
1985 1990 1995 2000 2005
% o
f U
S P
op
ula
tio
n
Inactive Sufficiently Active
Page 13
[email protected]
Why is it so stubborn?
I believe it’s related to the stickiness problem.
Page 14
[email protected]
Exercise ParticipationEffect of Short Bouts, Home Treadmills
(Jakicic et.al., JAMA 282, 16)
60
120
180
240
0 6 12 18
months
Ex
erc
ise
(m
in/w
ee
k)
LB
SB
SBT
?
Page 15
[email protected]
Exercise ParticipationEffect of Short Bouts, Home Treadmills
(Jakicic et.al., JAMA 282, 16)
60
120
180
240
0 6 12 18
months
Ex
erc
ise
(m
in/w
ee
k)
LB
SB
SBT
Page 16
[email protected]
Self-help vs. CommercialWeight Loss Programs
(Heshka et.al., JAMA 289, 14; April 9, 2003)
-7
-6
-5
-4
-3
-2
-1
0
0 6 12 18 24months
Wei
gh
t C
ha
ng
e, k
g
Self-help
Commercial
Page 17
[email protected]
Recommendation 2:Go for breadth—not just
“exercise” for the actively inclined. We need increases
in routine, daily physical activity for everyone.
Page 18
[email protected]
Recommendation 2 (H.E.):Go for breadth—not just
getting people onto “diets.” We need increases in routine,
daily healthy eating for everyone.
Page 19
[email protected]
Pedometer-based “lifestyle” activity promotion:
• Measure steps all day.• Determine your
average daily steps. • Increase by only10%-20% a week.• Keep gradually
increasing . . .
Key to Success: Keep a record!
Page 20
[email protected]
Energy ExpenditureLifestyle vs. Structured Activity
(Dunn et.al., JAMA 281, 4)
32
33
34
35
0 6 12 18 24months
En
erg
y E
xpen
dit
ure
(k
cal/k
g/d
ay)
Lifestyle
Structured
Page 21
[email protected]
Social Ecology ModelDeterminants of behavior change
Sallis, Owen, “Physical Activity and Behavioral Medicine.”
• Individual (readiness, efficacy)
• Interpersonal (family, friends)
• Institutional (school, work, HMO)
• Community (networks, local gov’t)
• Public Policy (transport, land use)
Page 22
[email protected]
Socio-ecological successes?
• Tobacco – Education, kids, taxes, 2nd hand smoke policies/bans.
• Seat belts, child safety restraints – Media, training, laws, enforcement.
• Recycling – Kids, facilities, fees.• Water & sewer – Education,
ordinance & design requirements, inspection/enforcement procedures.
Page 24
[email protected]
The “healthy” trip decision hierarchy*:
Walk
BikeTransit
Drive
*Nearly 25% of all trips are one mile or less; roughly
40% are two miles or less!(Nat’l Household
Transportation Survey)
Page 25
[email protected]
Recommendation 3:We have to make active living
& healthy eating the easier choices - actually safer, more convenient, less costly, and
even more fun than the alternatives.
Page 26
[email protected]
The “Toxic” Environment?(Kelly Brownell, Yale)
Middletown, RI
Page 27
[email protected]
So, what does the research say matters?
1. Destinations within walk, bike, & transit distance?
2. Sidewalks, trails, bike lanes, safe crossings?
3. Inviting settings & sites for bikes, peds, transit?
4. Safe & accessible for all ages, incomes, abilities?
Denton TX
www.thecommunityguide.orgCDC Guide to Community Preventive Services
Grapevine TX
Marshalltown, IA
Page 28
[email protected]
Or in Planner-Speak:
• Land use mix.• Network of ped,
bike, & transit facilities.
• Functional site design & details.
• Safety & universal access.
Portland, ME
Page 29
[email protected]
Compact neighborhoods
1. Land use. Schools, services near housing.
Mixed use,
multi-family.
& shared open space.
E.g. shopping, post office, library, . . .
Housing above retail
below.
Schools
Pinellas Trail
Page 30
[email protected]
In other words, create & sustain village centers.
Laramie
Mix uses: keep where we live, work, shop, play, learn, pray . . . closer together!
“It’s not a neighbor-hood if you don’t have a corner store”(Indianapolis)
Page 31
[email protected]
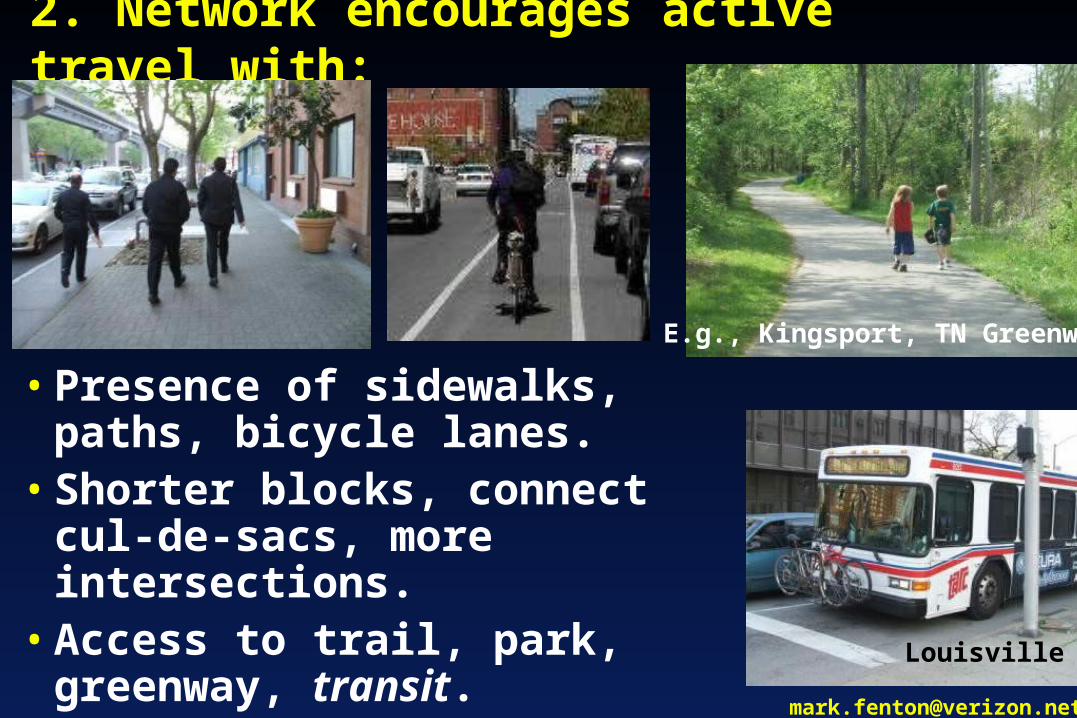
2. Network encourages active travel with:
• Presence of sidewalks, paths, bicycle lanes.
• Shorter blocks, connect cul-de-sacs, more intersections.
• Access to trail, park, greenway, transit.
E.g., Kingsport, TN Greenway
Louisville
Page 32
[email protected]
Transit riders are physically active.Besser, Dannenberg, Amer. J. Prev. Med., 29 (4), Nov. 2005.
Just during the daily walk to transit: • Half of transit riders
walk at least 19 mins.
• 29% get at least 30 mins. of activity.
• Minorities, poor (income <$15k/yr.), denser urban dwellers more likely to get 30+ mins./day.
Appleton WI
Page 33
[email protected]
3. Site design:
Market Po
Which setting is more appealing
for travel on foot and by bike?
Page 34
[email protected]
Site design?Research & practice suggest:
• Pedestrian friendly access; buildings are near the sidewalk, not set back.
• Trees, benches, water, aesthetics, lighting, scale.
• Details: bike parking, open space, plantings, materials.
Page 35
[email protected]
4. Safety. • Engineering can dramatically improve safety.
• Increasing pedestrian and bike trips decreases overall accident & fatality rates.
Curb extensions
Median islands
Roundabout (Neenah, WI)
(Jacobsen P, Injury Prevention, 2003; 9:205-209.)
Page 36
[email protected]
0
5
10
15
20
25
30
US
UK
Aus
tral
iaC
anad
aIr
elan
dIta
lyFr
ance
Nor
way
Aus
tria
Sw
itzer
land
Bel
gium
Ger
man
yS
wed
enFi
nlan
dD
enm
ark
Net
hrln
ds
% a
du
lts
BM
I>30
% of Total Trips Taken by Bicycle.Pucher J, Transport Reviews, 2008 (various sources).
Page 37
[email protected]
0
5
10
15
20
25
30
35
US
UK
Aus
tral
iaC
anad
aIr
elan
dIta
lyFr
ance
Nor
way
Aus
tria
Sw
itzer
land
Bel
gium
Ger
man
yS
wed
enFi
nlan
dD
enm
ark
Net
hrln
ds
% a
du
lts
BM
I>30
Obesity Rates, Developed CountriesOrganization for Economic Cooperation & Development; www.oecd.org
Page 38
[email protected]
Suburbanization of AmericaUS population shift, 1950-1996
(after Bowling Alone, R. Putnam, 2000)
10
20
30
40
50
1950 1960 1970 1980 1990 2000
year
% o
f T
ota
l Po
pu
lati
on
Suburb
Urban
Rural
“But what about rural areas . . . ?”
1. Suburbia is steadily consuming the landscape . . .
Page 39
[email protected]
2. Rural areas are where you can
affect the shape of development
before it’s done!
“Rural” housing in SW Illinois?
Page 40
[email protected]
Community design & nutrition?
Farmer’s markets, green grocers.
Community gardens (near schools, parks, senior housing); conserving
farmlands; Community Supported Agriculture. Regulate fast food, drive-
through locations.
Olathe, KS
Page 41
[email protected]
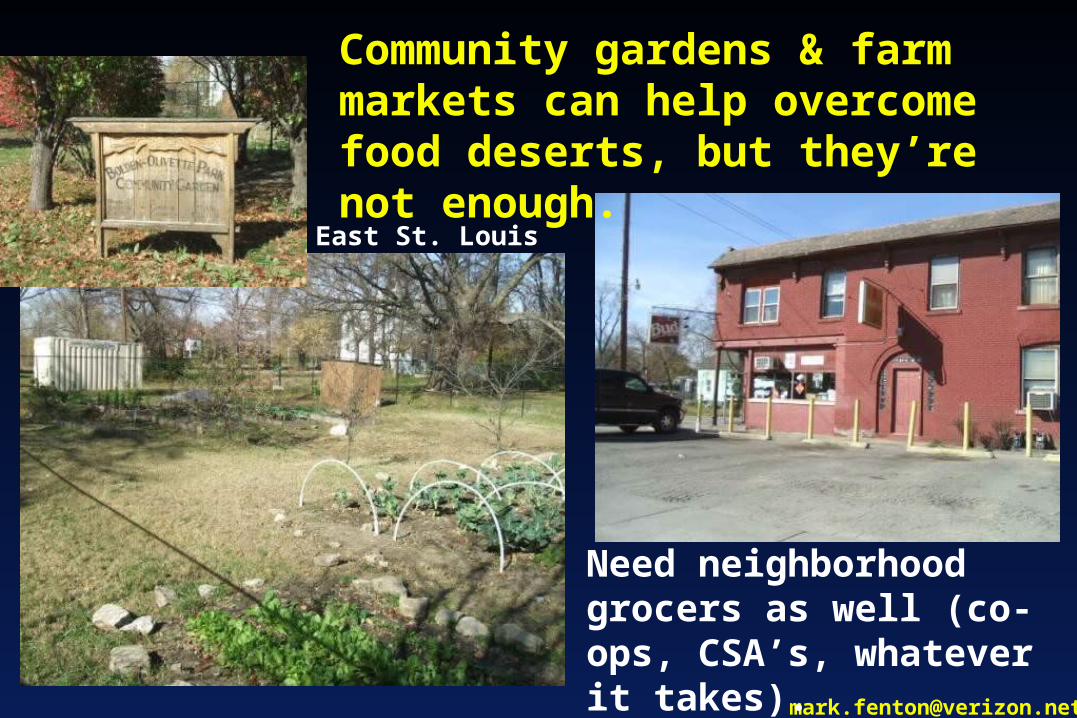
Community gardens & farm markets can help overcome food deserts, but they’re not enough.
Need neighborhood grocers as well (co-ops, CSA’s, whatever it takes).
East St. Louis
Page 42
[email protected]
0
2
4
6
8
10
12
14
No Car Owns Car
Low FF
High FF
Low FF
High FF
BMI, Fast Food Outlets & Car OwnershipInagami S, et.al., BMI, Neighborhood Fast Food and Restaurant
Concentration and Car Ownership, Journal of Urban Health, Vol 86 (5).
Estimated additional
weight (lbs.)
Density of fast food
restaurants
(Reference condition: No car, low density of fast food restaurants.)
Page 43
[email protected]
0
2
4
6
8
10
12
14
No Car Owns Car
Low FF
High FF
Low FF
High FF
BMI, Fast Food Outlets & Car OwnershipInagami S, et.al., BMI, Neighborhood Fast Food and Restaurant
Concentration and Car Ownership, Journal of Urban Health, Vol 86 (5).
Estimated additional
weight (lbs.)
Density of fast food
restaurants
(Reference condition: No car, low density of fast food restaurants.)
Page 44
[email protected]
0
2
4
6
8
10
12
14
No Car Owns Car
Low FF
High FF
Low FF
High FF
BMI, Fast Food Outlets & Car OwnershipInagami S, et.al., BMI, Neighborhood Fast Food and Restaurant
Concentration and Car Ownership, Journal of Urban Health, Vol 86 (5).
Estimated additional
weight (lbs.)
Density of fast food
restaurants
(Reference condition: No car, low density of fast food restaurants.)
Page 45
[email protected]
Recommendation 4:Both the built and social
environments of the community matter, so work on improving them. Start by helping people realize what “sticks” and what doesn’t.
Page 46
[email protected]
All the “health” benefits:Environmental
• Reduced traffic; air, water, & noise pollution.• Conserved open space, agricultural land.
Safety• Kids, elderly mobility.• Crime deterrent.
Social• Equitable transportation.• More personal connections.
Education• Increased safety.• Reduced transportation costs and infrastructure.• More community engagement; schools as neighborhood centers.
Knoxville, TN
Vernon, CT
Page 47
[email protected]
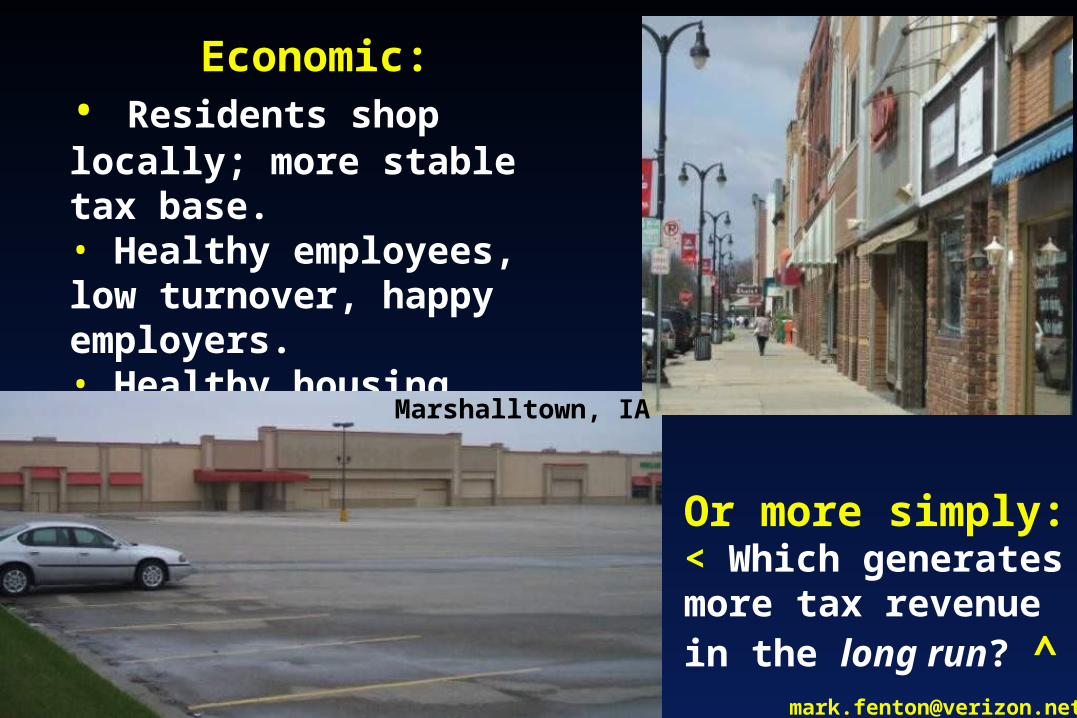
Economic:• Residents shop locally; more stable tax base.• Healthy employees, low turnover, happy employers.• Healthy housing values(NAHB & NAR surveys).
Or more simply:< Which generates more tax revenue in the long run? ^
Marshalltown, IA
Page 48
[email protected]
Rec. #5: MAPPS strategy framework
• Media: Educate & build awareness, encourage behavior change.
• Access: Create “stickier” environments.
• Point of decision prompts: Promote, “nudge” toward the healthy, active choice.
• Price: Both ways (healthy choice affordable, unhealthy choices more expensive).
• Social support: Shift social norms (think smoking); inactivity, crummy eating the exception not the rule. (The oatmeal syndrome.)
Page 49
[email protected]
Media: Washington DC Free Ride promotion
• On the surface, a short term behavior change promotion: Get people to do more active commuting.
• At the core: Get employers to make sticky changes, subsidizing employee transit, flex time, lockers & showers. >
Page 50
[email protected]
Media: Topeka, KS PHC program has focused on policy.
• Jim Ogle, PHC team member, has modeled the change (WIBW):
• Dec. ‘08 – 3,700 steps/day
• Sep. ‘09 – 15,000+ steps/day!!!!!
Page 51
[email protected]
Topeka, KS PHC team:
• Focused on supporting the city’s “Fix the Streets” campaign – policy level change!
• Half-cent sales tax increment for roadway repairs.
• Then targeted Complete Streets policy statement by city council.
• Passed in Nov. 2009!!!
Page 52
[email protected]
Accommodate all users:• Pedestrians• Bicyclists• Transit• Motor vehiclesDesign speed = posted speed.Few exceptions, clearly defined.Expand the hierarchy.
Access: Complete Streets Policy
Page 53
[email protected]
The real phases of CS policy implementation.
1. Passage of a policy resolution or executive order.
2. Adoption of DPW/engineering policy.3. Adoption of detailed roadway design
standards or guidelines. (Pirate’s code?)
4. Engineering practice (staff, consultants) actually entails routine inclusion of ped/bike/transit consideration in absolutely every project (including routine maintenance).
Page 54
[email protected]
E.g. Design guidelines affect the built environment for years to come.
X
Page 55
[email protected]
Lane re-alignments• Often called road diets,
being seen more often.
• Can reduce collisions & severity.
• Dramatically improves performance for pedestrians & cyclists.
Urbana, IL; before & after.
Page 56
[email protected]
In East St. Louis, maybe some paint can help?
State Street (to Main Street, Belleville)
Page 57
[email protected]
• Site requirements: Max. setbacks & curb-cuts; limit drive-throughs.
• Subdivision rules: Curbs, sidewalks, road widths.
Access: Change the rules & ordinances.
• Zoning codes: Mixed uses, accessory dwellings, density bonuses.
Page 58
[email protected]
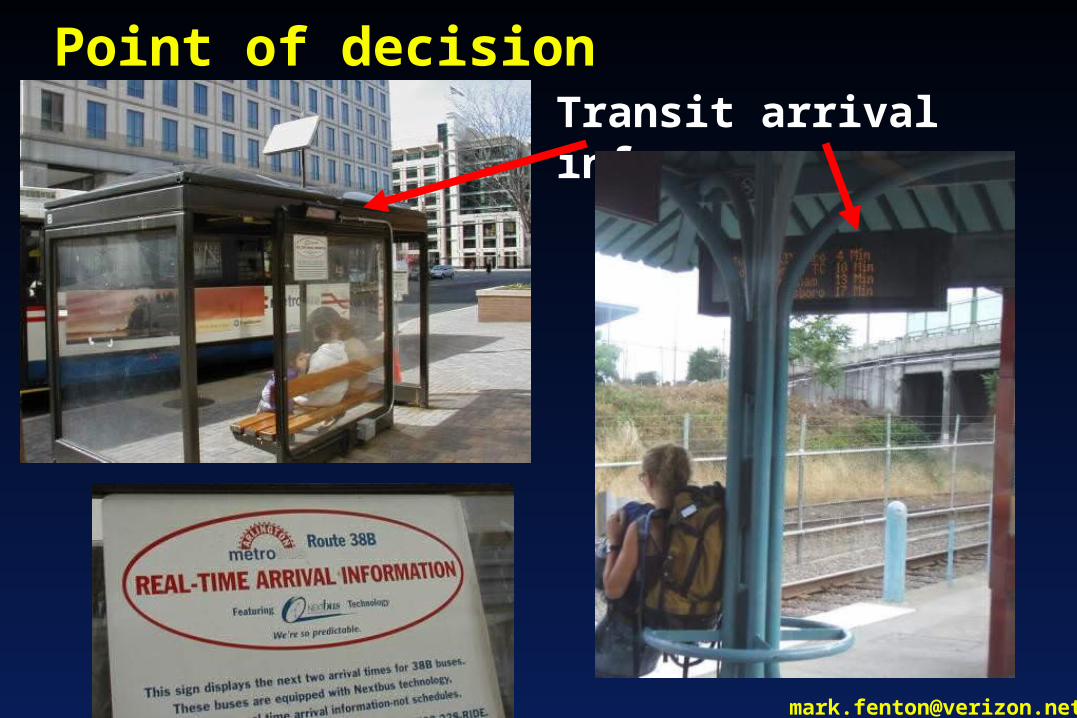
Point of decision prompts:
E.g. Stairway use efforts:• Open locked doors; signs.• Clean & paint, art, music.• Footprints, encouragement.• 3%-10% increase in stair use.
Page 59
[email protected]
Point of decision information:Transit arrival info.
Page 60
[email protected]
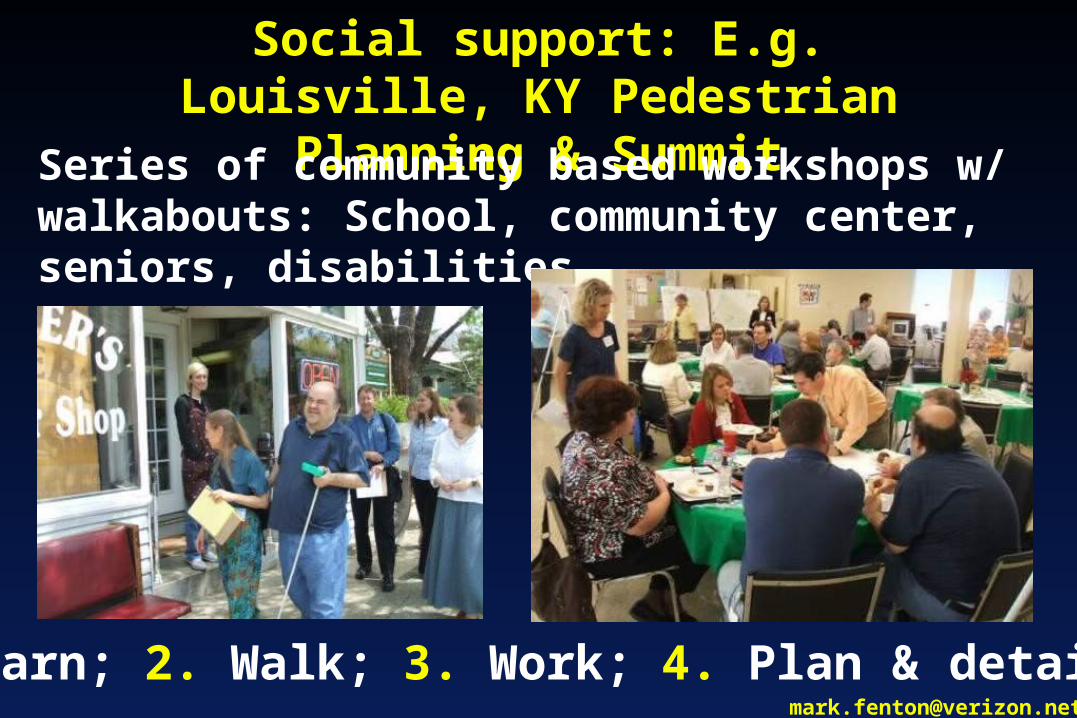
Social support: E.g. Louisville, KY Pedestrian Planning & Summit
Series of community based workshops w/ walkabouts: School, community center, seniors, disabilities . . .
1. Learn; 2. Walk; 3. Work; 4. Plan & detail.
Page 61
[email protected]
Louisville Plan Kick-off Event w/:• Mayor Abramson• Health Dir. Dr. Troutman• Sewer Dist. Dir. Schardein
Why the walkabouts?• Inspiration – get engaged• Education – learn how• Practical planning, design
Page 62
[email protected]
E.g. Bus tours with key partners . . .
Hockomock Y, southeast MA.
Lexington, KY tour w/ developers, planners, elected officials.
Page 63
[email protected]
Safe Routes to School approach.
• Social support. Walking school busses, bicycle trains, safety education, promotion.
• Access. Construct remote drop-off area at park; relocate bus pick/drop.
• Point of decision. Improve trail through park; signs.
*Begin evaluating today; figure out where kids come from, how, & why!
Columbia, MO
www.saferoutesinfo.org
Page 64
[email protected]
Let’s really talk about “price:”• Economic stimulus $.
Which infrastructure?
• Transit funding. Rail, bus, van & car pool.
• Congestion charges. Auto disincentive.
• Tolls, parking, gas taxes? Carrot & stick.
• Insurance rewards for active commuting.
• 3rd quarter 2008. Auto miles 4.6% Transit use 6.5%
www.apta.org
Page 65
[email protected]
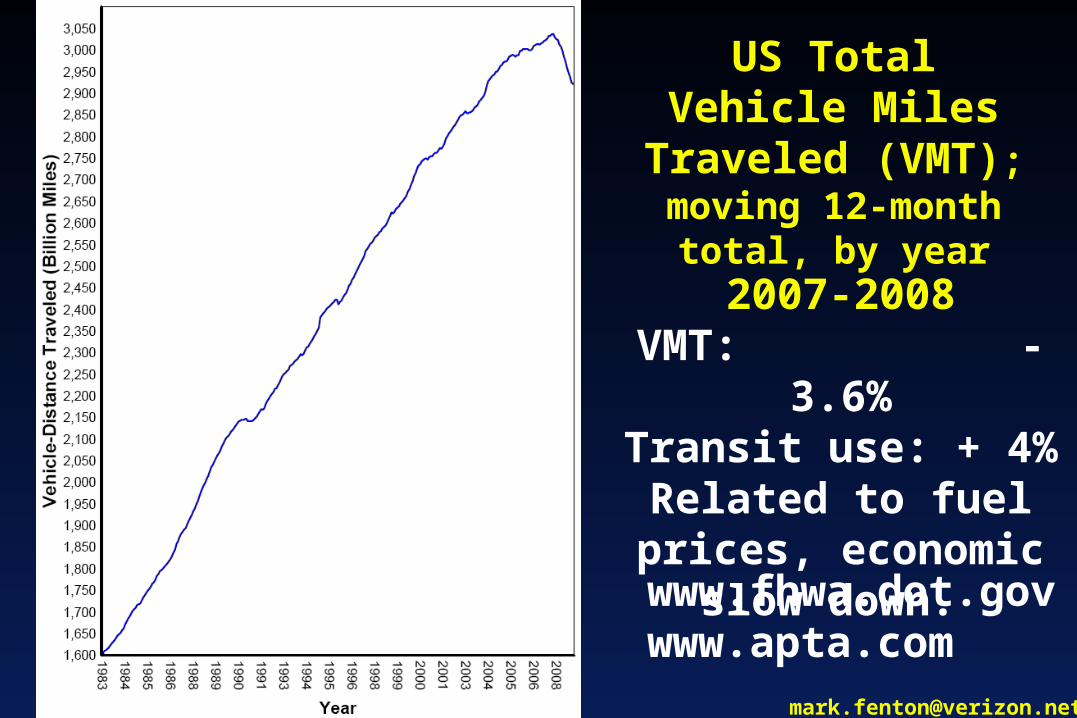
www.fhwa.dot.govwww.apta.com
US Total Vehicle Miles Traveled
(VMT); moving 12-month total, by year
2007-2008VMT: - 3.6%Transit use: + 4%
Related to fuel prices, economic
slow down.
Page 66
[email protected]
Omaha, NE health coalitionHiring an Active
Transportation Coordinator:
• First two years half-funded by Alegent Health (private sector partner).• Metropolitan Area Planning Association also funding.• Housed in City of Omaha Planning Department.
(True systems level change.)
Page 67
[email protected]
Healthy Eating tactics?
Policy: Overcoming food deserts through zoning & tax incentives to
encourage neighborhood groceries.
Access, price: Subsidized rotating farmers markets (target
at-risk neighborhoods).
PoD: Community gardens at schools.
Page 68
[email protected]
Why care about stickiness & active community design?
• The inactivity epidemic; our kids may pay!• ~4,000 pedestrian, ~40,000 motor vehicle,
~400,000 sedentary-related deaths/year.• Smog alerts, over an hour of average commute
time/day, traffic congestion and costs.• OPEC; drilling in ANWR; oil wars in Mid-east.• More eyes on the street, less crime.• Shopping locally, healthier housing values.• Higher employee retention, higher productivity,
lower health care costs.
Page 69
[email protected]
Keys to success:
• Policy, systems, and environmental change means increasing stickiness.
• Focus not on people reached and messages heard; focus ultimately on behaviors changed.
• Reach out to and fully engage (on their terms) partners in: education, planning, engineering, economic development, the business & development communities.