Marking essays on screen: an investigation into the reliability of marking extended subjective texts Martin Johnson, Rita Nádas, John F. Bell and Sylvia Green A paper presented at the IAEA conference, Brisbane, Australia 13 – 18 September 2009 Contact details Martin Johnson Sylvia Green Research Division Research Division Cambridge Assessment Cambridge Assessment 1 Hills Road 1 Hills Road Cambridge Cambridge CB1 2EU CB1 2EU Tel: +44 1223 553843 Tel: +44 1223 553844 [email protected][email protected]www.cambridgeassessment.org.uk Cambridge Assessment is the brand name of the University of Cambridge Local Examinations Syndicate, a department of the University of Cambridge. Cambridge Assessment is a not-for-profit organisation.
Transcript
Marking essays on screen: an investigation into the reliability of marking
extended subjective texts
Martin Johnson, Rita Nádas, John F. Bell and Sylvia Green
A paper presented at the IAEA conference, Brisbane, Australia 13 – 18 September 2009
Contact details Martin Johnson Sylvia Green Research Division Research Division Cambridge Assessment Cambridge Assessment 1 Hills Road 1 Hills Road Cambridge Cambridge CB1 2EU CB1 2EU Tel: +44 1223 553843 Tel: +44 1223 553844 [email protected][email protected]
www.cambridgeassessment.org.uk
Cambridge Assessment is the brand name of the University of Cambridge Local Examinations Syndicate, a department of the University of Cambridge. Cambridge Assessment is a not-for-profit organisation.
A version of this paper was published in ‘The British Journal of Educational Technology’ (2009) by the British Educational Communications and Technology Agency and Blackwell Publishing. Abstract There is a growing body of research literature that considers how the mode of assessment, either computer- or paper-based, might affect candidates’ performances (Paek, 2005). Despite this, there is a fairly narrow literature that shifts the focus of attention to those making assessment judgments and which considers issues of assessor consistency when dealing with extended textual answers in different modes. This research project explored whether the mode in which a set of extended essay texts were accessed and read systematically influenced the assessment judgments made about them. During the project twelve experienced English Literature assessors marked two matched samples of ninety essay exam scripts on screen and on paper. A variety of statistical methods were used to compare the reliability of the essay marks given by the assessors across modes. It was found that mode did not present a systematic influence on marking reliability. The analyses also compared examiners’ marks with a gold standard mark for each essay and found no shifts in the location of the standard of recognised attainment across modes. Introduction Literature suggests that the feasibility, validity and reliability of working on-screen have long been the focus of audiences from a wide range of backgrounds, ranging from studies in the contexts of education, to those in occupational and cognitive psychology, among others. This particular study sought to investigate whether the mode of marking (on-screen or paper) had any influence on essay marking reliability and markers’ leniency/rigour. Literature Review Bennett (2002) describes the rapid growth of computer technology use in workplaces and education as inexorable. Although technology offers the potential to broaden educational assessment beyond what traditional methods allow, there are inevitable concerns during a transition phase (where assessments exist in both paper- and computer-based modes) that their outcomes are not comparable. In her review of comparability studies since 1993 Paek (2005) notes that the transition from paper- to computer-based testing cannot be taken for granted and that comparability between the two testing modes needs to be established through carefully designed empirical work. She goes on to suggest that:
Comparability studies explore the possibility of differential effects due to the use of computer-based tests instead of paper-and-pencils tests. These studies help ensure that test score interpretations remain valid and that students are not disadvantaged in any way by taking a computerized test instead of the typical paper test. (p.1)
Gathering reliability measures is one significant practical step towards demonstrating the validity of computer-based testing during the transitional phase.
2
Paek suggests that there are a number of primary issues for comparability research. One of these is whether the computer introduces something unintended into the test-taking situation. In the context of assessing essays on screen this might demand an enquiry into construct validity; exploring whether the same constructs or qualitative features of essay performance are being attended to by assessors in the different modes. In the wider European educational context mode comparability studies have been of interest from as early as 1998, when Neuman and Baydoun demonstrated that computer-based and paper-pencil clerical tests had the same predictive validity. The same finding has since been reinforced; e.g., Preckel et al. (2003) found that ‘valid and reliable data can be gained through online ability assessment’ when comparing online and paper-based intelligence tests (p. 137). Arguably these issues have heightened importance since the ongoing development of the Programme for International Student Assessement (PISA), a set of international assessments of student achievement involving more than 60 countries conducted on behalf of the Organisation for Economic Co-operation and Development (OECD), aim to increasingly employ computer-based test formats to make comparative judgements about relative levels of achievement in different participant countries. Although Paek (2005) reports evidence suggesting that screen and paper versions of traditional multiple-choice tests are generally comparable across grades and academic subjects she notes in her conclusion that:
There may still be one area where these [performance] differences remain: items relating to long reading passages…it appears that tests with extended reading passages remain more difficult on computer than on paper. (p.18)
Paek suggests that such differences might relate to computers inhibiting students’ reading comprehension strategies. Johnson and Greatorex (2008) argue that this issue might also affect those assessing longer texts on screen, implying a need to carry out studies exploring how judgments about longer textual performances might be influenced when assessors read them in different modes. This concern resonates with another recent screen marking study which found correlations between re-marked essays to be significantly lower when those scripts were re-marked on screen compared with their re-mark on paper (Fowles, 2008). Literature suggests that reading extended texts might prove to be more challenging on screen than on paper due to a number of supposed cognitive and ergonomic reasons. Psychological and Human Factors (HF) literature has explored the impact of mode upon reading activities. Reviewing this literature, Dillon (1994) has identified two levels of research, with the earliest research focusing on ergonomic issues such as: screen angle and orientation; aspect ratio; dynamics [jitter/screen filling]; screen flicker; and polarity. Many of these early studies used reading speed and comprehension accuracy measures to infer readers’ cognitive processes and tended to report a large mode-related difference, with paper supporting better reading accuracy and speed (eg, Creed et al, 1987; Gould and Grischowsky, 1984; Harpster, 1989; Muter et al., 1982;
3
Weldon et al., 1985; Wilkinson, 1987; Wright and Lickorish, 1983). This weight of evidence led Mills and Weldon (1987) to state ‘All of the results comparing computer screen with paper readability suggest that there are properties of a computer screen that make reading more difficult’ (p.335). Noyes and Garland (2003) note that many of the findings from this earlier work might be difficult to interpret contemporaneously since many were affected by the technological limitations of the era, such as poor screen resolution and screen user familiarity levels. Despite this, more up to date literature still suggests the existence of mode related reading differences. Mayes et al. (2001) found that reading from screen took longer despite control of resolution, character size, colour and angle of regard. Kurniawan and Zaphiris (2001) found that reading on paper was between 10% and 30% faster for adult readers and that they were also more likely on paper to use methods to keep track of location (e.g. pointing). Wästlund et al. (2005) also reported more limited comprehension levels on computer. Explanations for these persistent mode related findings have been sought through more recent HF ergonomic research. This work has tended to focus on the cognitive aspects of reading; considering aspects of document manipulation and information structure in protracted texts. This research has drawn attention to a number of key issues, one of which is navigation. Dillon (1994), O’Hara and Sellen (1997) and Piolat et al. (1997) all suggest that cumbersome navigation can interfere with readers building a sense of meaning whilst reading on screen. Dillon notes that there is a striking degree of consensus among many researchers in the field that navigation through the text is the single greatest difficulty for readers of electronic text. O’Hara and Sellen emphasise that readers suffer from a lack of document overview and an unclear awareness of document length on screen, which in part relates to the limited degree of tangibility offered by electronic documents compared with paper. Hansen and Haas (1987) and Piolat et al. (1997) argue that low tangibility might adversely affect the ability of readers to remember the location of information in longer texts since paper provides physical and tactual cues about the position of information. Finally, there have been concerns that there are inherent features of computer screen technology that are difficult to control and which might affect readers’ cognitive processing. Wästlund et al. (2005) observe that computer-based information can involve dual task elements of both reading and technology handling and they conclude that this might lead to a delay in readers’ analysis of information and make reading on screen more cognitively demanding. Noyes and Garland (2003) note that contrast foreground to background ratio levels vary more on screen, that luminance is higher on screen, and that screen refresh rate levels and flicker have been shown to have a detrimental effect on reading. They go on to suggest that these factors interfere with readers’ cognitive processes and hinder performance through reducing working memory capacity. The issues raised in the literature are of practical importance because large scale educational assessment agencies in the UK have made significant investments in technological infrastructure over recent years. One such development has been to increase the volumes of digital script marking, where assessors remotely mark
4
electronic images of paper scripts. Using statistical analyses of marker reliability this project explores whether transferring images of extended essay scripts in a subjective domain onto screen contributes to less reliable marking. This involves establishing a numerical measure of the quality of each essay, otherwise known as a gold standard mark. For more information about the technicalities of establishing gold standard marks see Suto, Nádas and Bell (2009). Differences from the gold standard mark can then be calculated as each essay is marked in either mode to investigate whether systematic mode-related biases might exist when essays are assessed on screen compared with on paper. Method The project used an essay question from a General Certificate of Secondary Education (GCSE) examination in English Literature as a focus for study. GCSEs are the main form of Level 1 and Level 2 national examinations taken at the end of compulsory schooling in the UK. 180 essay scripts were selected and divided into two matched samples, each containing 90 scripts spread across the whole mark range (0-30 marks) of the examination mark scheme (Table 1). Table 1: Sample 1 and 2 script band profiles
Band 1 Band 2 Band 3 Band 4 Band 5 Band 6 Below 6
Sample 1 11 17 16 16 17 12 1
Sample 2 10 18 16 16 16 13 1
The scripts were then blind marked for a second time by the subject Principal Examiner (PE) and Assistant Principal Examiner (APE) to establish a gold standard mark for each script. In this project the gold standard mark is therefore defined as the consensual paper mark awarded by the PE and the APE for each answer. The marks from the PE and APE re-marking exercise validated the sample construction; with the mean scores for each sample being closely matched (Table 2). The t-test analysis showed that the small mean differences were non-significant (t (178) = 0.03, p > .05).
Table 2: Sample 1 and 2 mean re-mark scores
Sample N Mean
Std.
Deviation
Std. Error
Mean
Mark 1 90 21.32 4.86 0.51
2 90 21.30 4.88 0.52
The average essay length was 615 words, 76 lines of writing and 3.38 A4-sized pages. 12 highly graded examiners who had recently finished live operational marking agreed to take part in the study. None of the examiners had marked using the version of the marking software. Before starting their screen marking all examiners attended a one day training session to acquaint them with the marking software.
5
In this empirical situation examiners were not initially familiar with the software. They received training but not practice. This must be considered when interpreting the findings. In order to control the order of sample marking and marking mode, the examiners were allocated to one of four Examiner Marking Groups. Table 3 shows how these groupings structured the marking exercise. Table 3: Examiner Marking Groups and script allocation design
Examiner Marking
Group 1st marking 2nd marking
1 Paper Sample 1 Screen Sample 2
2 Paper Sample 2 Screen Sample 1
3 Screen Sample 1 Paper Sample 2
4 Screen Sample 2 Paper Sample 1
Usual marking practice for these examiners conforms to a devolved marking model where they receive scripts sent from the coordinating assessment agency and mark them to a deadline before returning them to the agency. In order to replicate the normal marking experience as much as possible the examiners were encouraged to complete their marking in a secure environment away from the research base. For the paper marking sessions this was possible for all examiners. Prior to the on-screen marking sessions the examiners needed to verify that the computer systems and internet connections they intended to use complied with the minimum system requirements to use the marking software. Ten examiners’ computer systems conformed to these requirements, leaving two examiners to complete their marking in the research offices. The marking software used for the project was an operational version which had already been used in live marking with short response items. However, it was not designed for or used in the marking of long essays. The software allowed the examiners to download and navigate essay scripts as scanned PDF files. Only when they had submitted the mark for a given script were they allowed to download the next script in a predefined script list. The visual pane included a thumbnail image of the whole document alongside the scanned page image and the examiners could navigate through the text documents using their mouse and/or keyboard. Examiners had access to an assortment of tools whilst marking; these included a variety of pre-specified annotation tools which could be employed by clicking and dragging them from an annotation palette to the appropriate part of the scanned image, as well as the facility to zoom in and out of the document view. The examiners were also able to access previously marked essays during the marking process. Findings Table 4 shows the mean marks and standard deviations for each examiner in both modes. Initial analyses showed that neither mode order nor sample order had significant effects on examiners’ marking.
6
Table 4: Means and Standard Deviations for each mode by examiner
Examiner Mean mark (paper) Std. Deviation Mean mark (screen) Std. Deviation
1 21.73 3.95 21.57 3.21
2 21.40 3.56 21.83 4.15
3 22.09 4.13 23.00 4.22
4 23.00 3.71 21.83 4.45
5 22.10 3.82 21.10 3.99
6 20.40 3.92 20.70 3.95
7 21.90 3.50 22.44 4.10
8 23.34 3.45 23.56 3.60
9 20.76 3.24 21.49 3.21
10 20.29 4.13 20.13 3.98
11 20.29 3.73 21.13 3.38
12 22.14 4.10 21.96 3.31
Overall 21.62 3.89 21.73 3.91
This preliminary analysis suggests little substantive mode-related differences, with five examiners tending to award higher marks on paper and seven awarding higher marks on screen. Figure 1 shows the box plots of the mark distribution by mode. For ease of interpretation, the box includes 50% of the data, and each whisker represents 25% of the data. The horizontal line within the box is the median, below and above which lie 50% of the data. If there are any points beyond the length of the whiskers they are plotted individually. Such points are referred to as outliers. The box plot in Figure 1 indicates that there was slightly greater variation in examiners’ on-screen marking compared with their paper marking. However, these analyses could mask the true level of variation in examiners’ marking because scripts that have been awarded higher marks than their gold standard mark are compensated for by other scripts that have been awarded lower marks than their gold standard.
7
Figure 1: Box plots of the mark distribution by mode
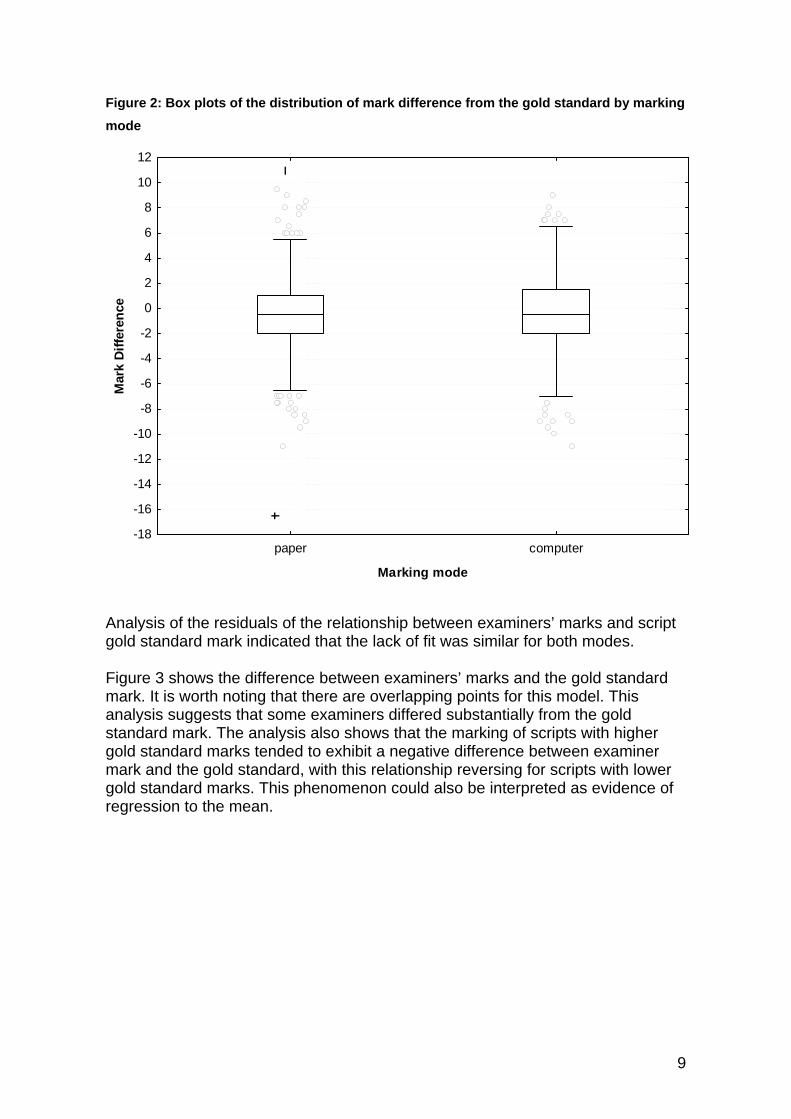
To allow for this compensation effect further analysis considered the differences between examiners’ marks and the gold standard marks awarded for the scripts. For the purposes of this analysis the chosen dependent variable was the difference between the examiners’ mark and the gold standard mark. This is known as the Mean Actual Difference, with negative values indicating that an examiner was severe and a positive value indicating that an examiner was lenient in relation to the gold standard. Figure 2 shows box plots for the distribution of the mark difference for scripts marked in both modes. Again, these data show that there was a greater variation in markers’ screen marking compared with their paper marking. The data also shows that paper marking tends to be slightly more accurate, although about half of the examiners (i.e., those within the box) showed a two–mark difference from the gold standard marks in both modes, suggesting little mode-related difference when considering examiners’ marks in relation to the gold standard marks. For the screen marking it might be noted that the outliers appear to be fewer and more bunched than for the paper marking, perhaps suggesting that the screen mode is having a differential effect on the outliers. Given that mark differences have a finite range, when the box expands in a box plot the whiskers lengthen and so reduce the number of outliers. The number of outliers is thus an artefact of the plot, explaining this apparent difference.
8
Figure 2: Box plots of the distribution of mark difference from the gold standard by marking mode
paper computer
Marking mode
-18
-16
-14
-12
-10
-8
-6
-4
-2
0
2
4
6
8
10
12
Mar
k D
iffer
ence
Analysis of the residuals of the relationship between examiners’ marks and script gold standard mark indicated that the lack of fit was similar for both modes. Figure 3 shows the difference between examiners’ marks and the gold standard mark. It is worth noting that there are overlapping points for this model. This analysis suggests that some examiners differed substantially from the gold standard mark. The analysis also shows that the marking of scripts with higher gold standard marks tended to exhibit a negative difference between examiner mark and the gold standard, with this relationship reversing for scripts with lower gold standard marks. This phenomenon could also be interpreted as evidence of regression to the mean.
9
Figure 3: The difference between examiners’ marks and the gold standard mark
Gold standard mark
Diff
eren
ce b
etw
een
exam
iner
's m
ark
and
gold
sta
ndar
d m
ark
PaperComputer10 12 14 16 18 20 22 24 26 28 30 32
-20
-15
-10
-5
0
5
10
15
Figure 4 plots the relationship between examiners’ marks and the gold standard mark for both modes. Two plots have been overlaid, one for paper marking (circle) and one for screen marking (triangle). If agreement was perfect then all scripts would be on the line of identity (dotted line with 45 degree gradient). As expected for subjective marking this is not the case. Linear fits and 95% prediction bands have also been added to the plot. This plot overlay suggests little evidence of any mode-related marking difference. This analysis does contain some features of note. The regression lines are both more tilted than the line of identity, showing that the examiners tended to be less likely to use the extremes of the mark scheme. There are also gaps in the scatter plots corresponding to a gold standard mark which coincided with the mark scheme band boundaries.
10
Figure 4: Relationship between examiner mark and gold standard mark by mode
Scatterplot of mark against GoldStandard; categorized by scriptModescriptMode: paper mark = 4.9317+0.7561*x; 0.95 Pred.Int.
scriptMode: computer mark = 5.5611+0.7333*x; 0.95 Pred.Int.
Gold Standard Mark
Exam
iner
Mar
k
PaperComputer
8 10 12 14 16 18 20 22 24 26 28 30 328
10
12
14
16
18
20
22
24
26
28
30
32
The data were then formally modelled with a general linear model to further investigate any relationships between examiners, marking mode and gold standard marks. This model is given below:
Actual difference = constant + examiner + marking mode [+ construct] + examiner*marking mode + gold standard mark + error * indicates interaction between elements.
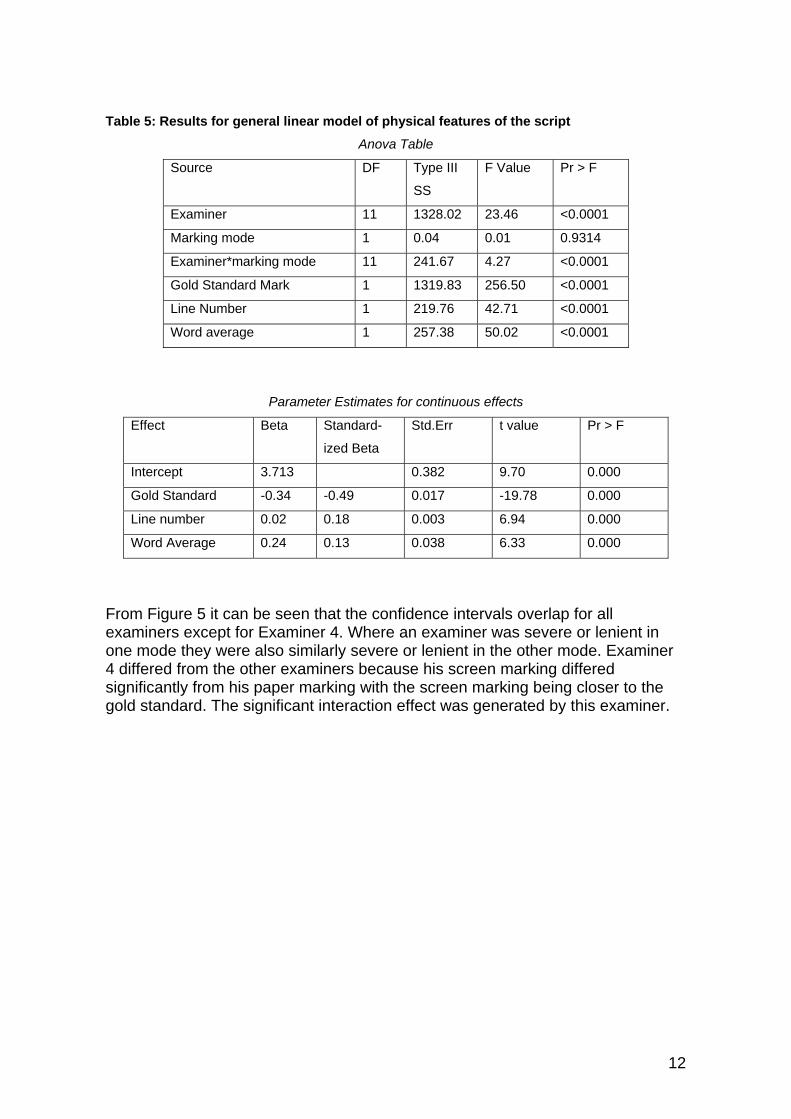
Table 5 shows the results for one of the general linear models fitted in this analysis. This showed that the marking mode was not a significant factor but that there was a significant interaction between examiners and marking mode. This difference between marking mode and examiner effect would therefore need to be investigated in more detail. The second part of the table describes the effect of gold standard mark on accuracy. As the gold standard mark increases there is a tendency for the examiner to become more severe, perhaps indicating an unwillingness to use the whole mark scale, or a regression to the mean.
11
Table 5: Results for general linear model of physical features of the script
Anova Table
Source DF Type III
SS
F Value Pr > F
Examiner 11 1328.02 23.46 <0.0001
Marking mode 1 0.04 0.01 0.9314
Examiner*marking mode 11 241.67 4.27 <0.0001
Gold Standard Mark 1 1319.83 256.50 <0.0001
Line Number 1 219.76 42.71 <0.0001
Word average 1 257.38 50.02 <0.0001
Parameter Estimates for continuous effects
Effect Beta Standard-
ized Beta
Std.Err t value Pr > F
Intercept 3.713 0.382 9.70 0.000
Gold Standard -0.34 -0.49 0.017 -19.78 0.000
Line number 0.02 0.18 0.003 6.94 0.000
Word Average 0.24 0.13 0.038 6.33 0.000
From Figure 5 it can be seen that the confidence intervals overlap for all examiners except for Examiner 4. Where an examiner was severe or lenient in one mode they were also similarly severe or lenient in the other mode. Examiner 4 differed from the other examiners because his screen marking differed significantly from his paper marking with the screen marking being closer to the gold standard. The significant interaction effect was generated by this examiner.
12
Figure 5: Least Square means for mark difference by examiner and mode
Current effect: F(11, 2133)=3.68, p=.00(Computed for covariates at their means)
Discussion This study sought to explore whether the marking of extended essay scripts from a subjective domain would affect marker reliability levels. The evidence from the statistical analyses suggests that mode presented no systematic influence on marker reliability. The project also considered whether the overall recognised standard of the essay qualities, represented by the gold standard marks for each essay, differed when marked on screen compared with paper. Again, markers’ profiles appeared largely unaffected by mode with markers who tended to be more lenient on paper also tending to be more lenient on screen (and vice versa). The data suggests that within-marker variability levels were lower than the between-marker variability levels. For assessment agencies that are responsible for administering and coordinating large groups of markers this is perhaps a positive finding since within-marker variation is more difficult to deal with than between-marker variation. Given the subjective nature of the domain in which the essays were written, between-marker variation is not a surprising finding. This type of variability reinforces the continued need for procedures, such as standardisation exercises, commonly used by assessment agencies to reduce between-examiner variation levels (QCA, 2007). This research project had a number of limitations that could have influenced the outcomes in ways that are difficult to quantify and potentially limiting its
13
generalisability. First, examiners were only standardised operationally, and not immediately prior to this marking exercise. This might have influenced their ability to deal with scripts which had extreme characteristics or may have had an effect on their sense of responsibility and urgency (although this condition was the same for the examiners when marking in either mode). Secondly, the study involved only twelve examiners who were pre-selected for participation based on their high performance profiles, and thus their behaviour might not be representative of all examiners. Thirdly, the examiners lacked practice and familiarity with the software and the software had not been used in the marking of long essays. A further limitation was that examiners had a comparatively light marking load with a generous time allowance compared with live marking. Finally, the balance of the script sample characteristics did not necessarily reflect the balance of qualities that examiners might face during a live marking session. Therefore it is recommended that further research be carried out to investigate whether any mode-related marking effects exist when more examiners (with differing levels of expertise) mark a greater number of scripts which are lengthier, and include a wider diversity of characteristics. References Bennett, R. E. (2002). Inexorable and inevitable: the continuing story of
technology and assessment. The Journal of Technology, Learning, and Assessment. Vol. 1(1), 1-24.
Creed, A., Dennis, I. and Newstead, S. (1987). Proof-reading on VDUs. Behaviour and Information Technology. Vol. 6(1), 3-13.
Dillon, A. (1994). Designing Usable Electronic Text. London: Taylor & Francis. Fowles, D. (2008). Does marking images of essays on screen retain marker
confidence and reliability? Paper presented at the International Association for Educational Assessment Annual Conference, 7-12 September, Cambridge, UK.
Gould, J. D. and Grischowsky, N. (1984). Doing the same work with hard copy and with cathode-ray tube (CRT) computer terminals. Human Factors 26, 323-337.
Hansen, W. J. and Haas, C. (1988). Reading and writing with computers: a framework for explaining differences in performance. Comm. ACM. Vol. 31(9), 1080-1089.
Harpster, J. L. (1989). Visual performance on CRT screens and hard copy displays. Human Factors. Vol. 31(3), 247-257.
Johnson, M. and Greatorex, J. (2008). Judging text presented on screen: implications for validity. E-Learning. Vol. 5(1), 40-50.
Kurniawan, S. H, and Zaphiris, P. (2001). Reading online or on paper: Which is faster? Proceedings of HCI International 2001. Mahwah, NJ: Lawrence Erbaum Associates.
Mayes, D. K., Sims, V. K. and Koonce, J. M. (2001). Comprehension and workload differences for VDT and paper-based reading. International Journal of Industrial Ergonomics. 28, 367-378.
Mills, C. B. and Weldon, L. J. (1987). Reading text from computer screens. ACM Computing Surveys. Vol. 19(4), 329-357.
Muter, P., Latremouille, S. A., Treurniet, W. C. and Beam, P. (1982). Extended reading of continuous texts on television screens. Human Factors. Vol. 24,
14
501-508. Neuman, G. and Baydoun, R. (1998). Computerization of Paper-and-Pencil Tests:
When Are They Equivalent? Applied Psychological Measurement. Vol. 22(1), 71-83.
Noyes, J. M. and Garland, K. J. (2003). VDT versus paper-based text: reply to Mayes, Sims and Koonce. International Journal of Industrial Ergonomics. Vol. 31(6), 411-423.
O’Hara, K. and Sellen, A. (1997). A comparison of reading paper and on-line documents. In Proceedings of the ACM Conference on Human Factors in Computing Systems, Atlanta, GA, S. Pemberton, Ed., ACM Press, New York, 335-342.
Paek, P. (2005). Recent Trends in Comparability Studies. PEM Research Report 05-05.
Piolat, A., Roussey, J-Y. and Thunin, O. (1997). Effects of screen presentation on text reading and revising. International Journal of Human-Computer Studies. 47, 565-589.
Preckel, F. and Thiemann, H. (2003). Online- versus paper-pencil-version of a high potential intelligence test. Swiss Journal of Psychology. Vol. 62 (2), 131-138.
QCA (2007). GCSE, GCE, GNVQ and AEA Code of Practice. London: QCA. Suto, W. M. I., Nádas, R. and Bell, J. F. (2009). Who should mark what? A study
of factors affecting marking accuracy in a biology examination. Research Papers in Education, June.
Wästlund, E., Reinikka, H., Norlander, T. and Archer, T. (2005). Effects of VDT and paper presentation on consumption and production of information: Psychological and physiological factors. Computers in Human Behavior. 21, 377–394.
Weldon, L. J., Mills, C. B., Koved, L. and Shneiderman, B. (1985). The structure of information in online and paper technical manuals. Proceedings of the Human Factors Society 29th Annual meeting: Vol. 2. R. W. Sweezy, Ed. Human Factors Society, Santa Monica, CA, pp. 1110-1113.
Wilkinson, R. T. (1987). Proof-reading: VDU and paper text compared for speed, accuracy and fatigue. Behaviour and Information Technology. Vol. 6(2), 125-133.
Wright, P. and Lickorish, A. (1983). Proof-reading texts on screen and paper. Behaviour and Information Technology. Vol. 2(3), 227-235.