60
2012 SAMSUNG ELECTRONICS ANNUAL REPORT
| Date post: | 30-Nov-2015 |
| Category: |
Documents |
| Upload: | martinengegren |
| View: | 76 times |
| Download: | 4 times |
2012 SAMSUNG ELECTRONICS ANNUAL REPORT
In a world of amazing imagination,
our reality is filled with possibilities.
On the path where no one ventures,
Samsung Electronics is striding
toward new goals. Discover with
us the happiness of new lives,
powered by creativity. Our constant
innovation and desire for positive
change brings surprising possibilities
into everyday life.
DISCOVERYINNOVATIONPOSSIBILITY
CONTENTS | 02 CEOs’ Message 04 About the Board 07 Business Overview 40 PlanetFirst 43 Financial Statements 112 Global Network
This annual report includes forward-looking statements that relate to future events and can be generally identified by phrases containing words such as “believes,” “expects,” “anticipates,” “foresees,” “forecasts,” “estimates” or other words or phrases of similar meaning. These forward-looking statements are not guarantees of future performance and may involve known and unknown risks, uncertainties and other factors that may affect our actual results, performance, achievements or financial position, making them materially different from the actual future results, performance, achievements or financial position expressed or implied by these forward-looking statements. Unless otherwise specified, all data presented in this report is from our consolidated financial statements. (※ K-IFRS standards have been applied to our data. As some business accounting standards have been revised in 2012, some statements for 2011, such as income statements, are retroactive and have been recalculated.)
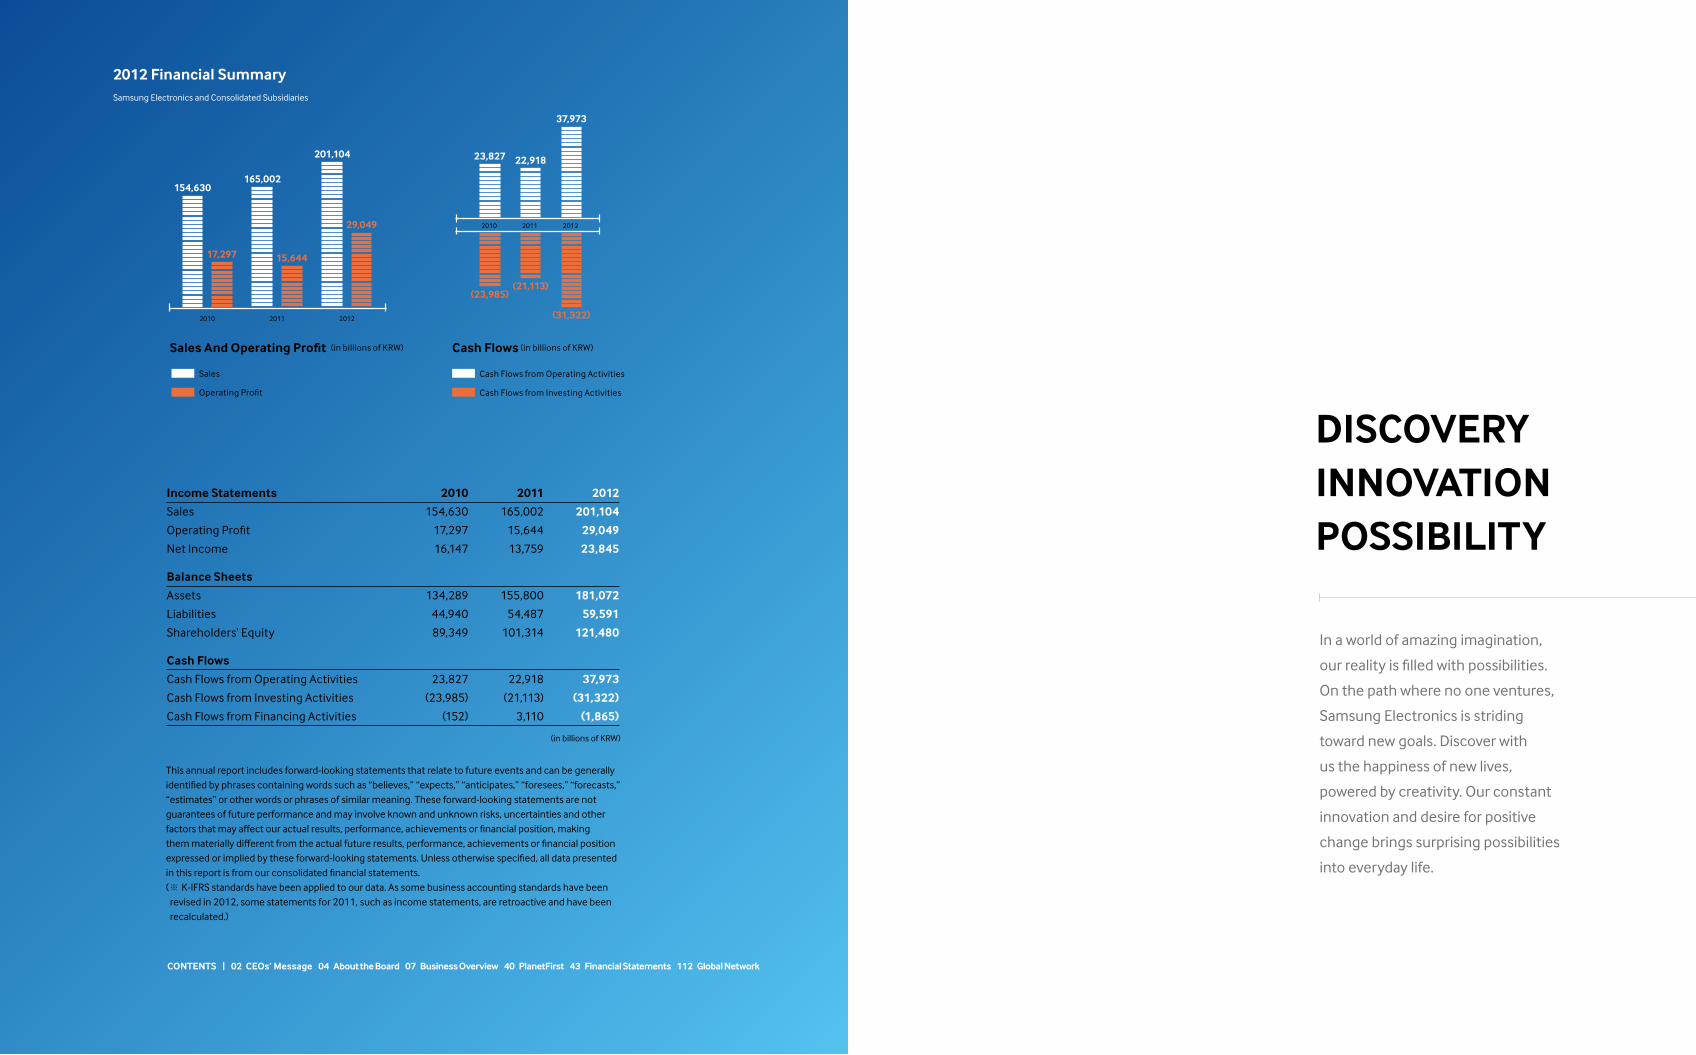
Income Statements 2010 2011 2012
Sales 154,630 165,002 201,104
Operating Profit 17,297 15,644 29,049
Net Income 16,147 13,759 23,845
Balance Sheets
Assets 134,289 155,800 181,072
Liabilities 44,940 54,487 59,591
Shareholders’ Equity 89,349 101,314 121,480
Cash Flows
Cash Flows from Operating Activities 23,827 22,918 37,973
Cash Flows from Investing Activities (23,985) (21,113) (31,322)
Cash Flows from Financing Activities (152) 3,110 (1,865)
(in billions of KRW)
2012 Financial Summary Samsung Electronics and Consolidated Subsidiaries
Sales
Operating Profit
Cash Flows (in billions of KRW)
Cash Flows from Operating Activities
Cash Flows from Investing Activities
2012
201,104
29,049
2011
165,002
15,644
2010
154,630
17,297
Sales And Operating Profit (in billions of KRW)
2010 2011 2012
37,973
22,91823,827
(31,322)
(21,113)(23,985)
0302
at CES 2013, the world’s largest consumer electronics show. We also advanced high profile and consistent global brand marketing by sponsoring a range of international sports events, including the London 2012 Summer Olympics. As a result of such efforts, we attained the No. 9 ranking on Interbrand’s Best 100 Global Brands 2012 list, with an estimated brand value of USD 32.9 billion.
Corporate citizenship that’s committed to social improvementSamsung Electronics is committed to transmitting its positive energy to society and to creating shared social value. We comply with all laws and ethical standards that safeguard markets around the world, including those for fair competition, personal data protection and anti-corruption, even as these turn more rigorous. We are increasing our social responsibility programs. In addition, we are boosting support for our worldwide partner companies to promote their global competitiveness as we expand the win-win partnerships that sustain growth. The power to keep growing is directly fueled by the trust and dedication of our customers, shareholders and society. Looking ahead in 2013, Samsung Electronics will continue to work toward the change and innovation that inspires the world and shapes new futures.
Thank you.
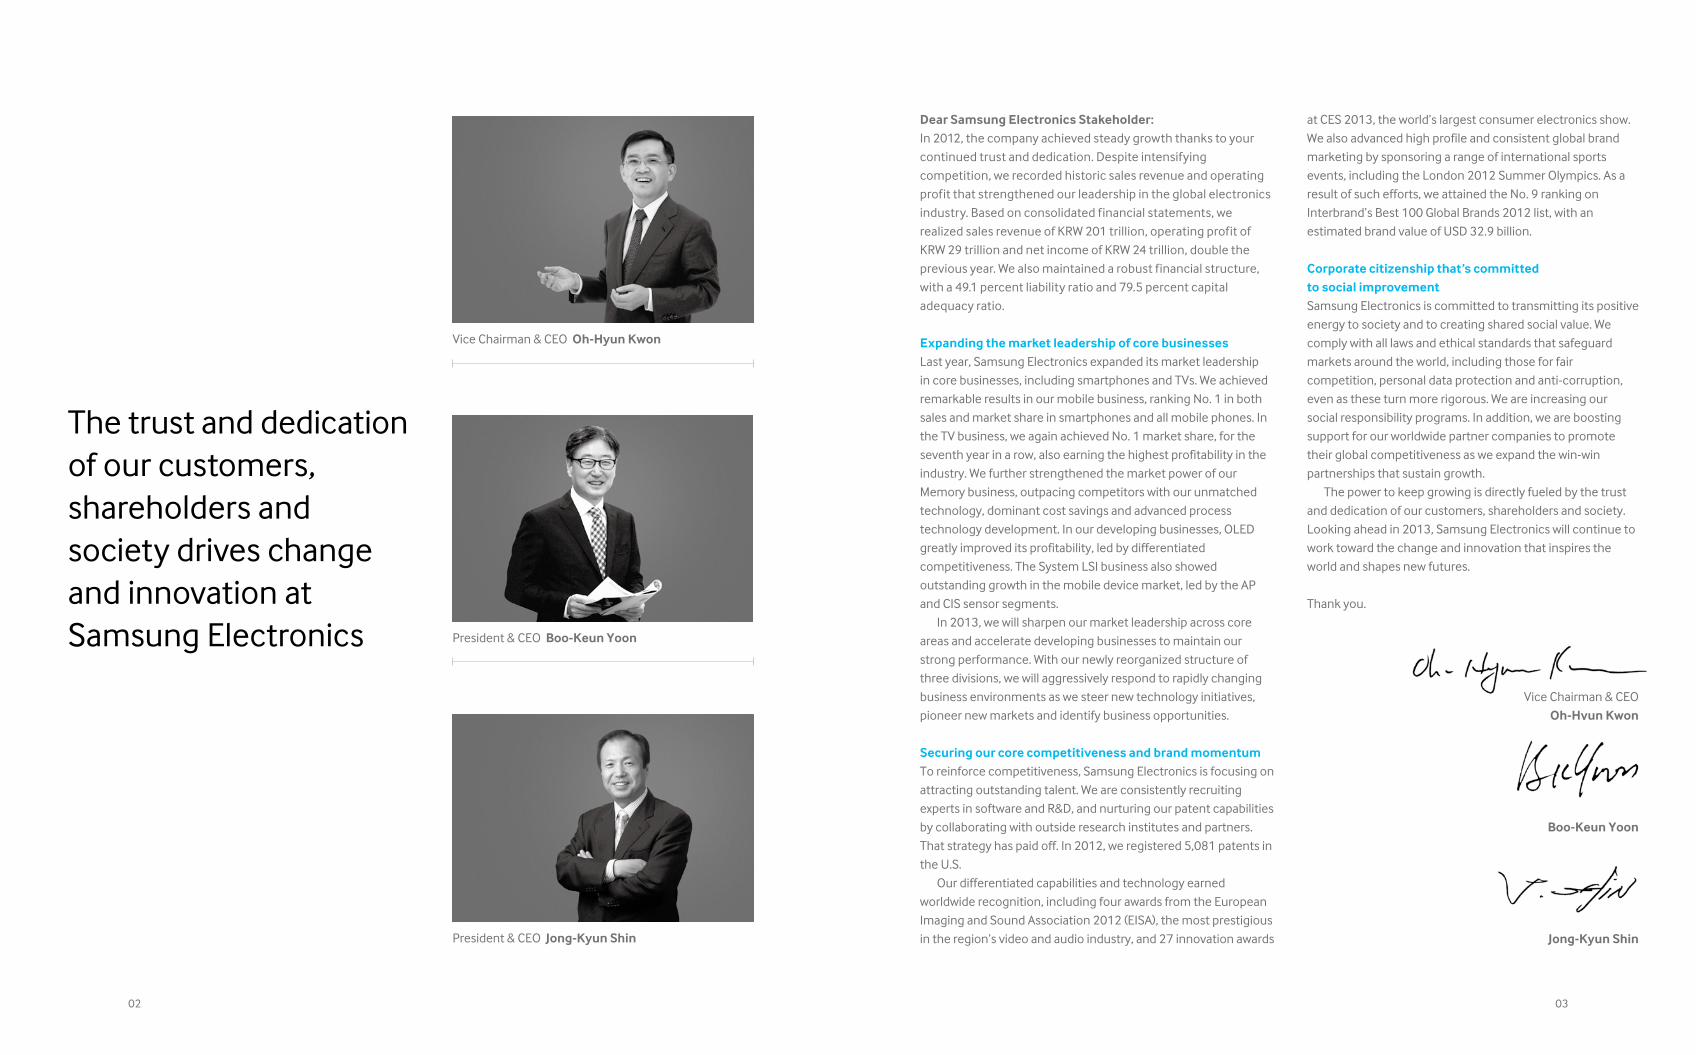
Vice Chairman & CEO Oh-Hyun Kwon
President & CEOBoo-Keun Yoon
President & CEOJong-Kyun ShinPresident & CEO Jong-Kyun Shin
Dear Samsung Electronics Stakeholder:In 2012, the company achieved steady growth thanks to your continued trust and dedication. Despite intensifying competition, we recorded historic sales revenue and operating profit that strengthened our leadership in the global electronics industry. Based on consolidated financial statements, we realized sales revenue of KRW 201 trillion, operating profit of KRW 29 trillion and net income of KRW 24 trillion, double the previous year. We also maintained a robust financial structure, with a 49.1 percent liability ratio and 79.5 percent capital adequacy ratio.
Expanding the market leadership of core businessesLast year, Samsung Electronics expanded its market leadership in core businesses, including smartphones and TVs. We achieved remarkable results in our mobile business, ranking No. 1 in both sales and market share in smartphones and all mobile phones. In the TV business, we again achieved No. 1 market share, for the seventh year in a row, also earning the highest profitability in the industry. We further strengthened the market power of our Memory business, outpacing competitors with our unmatched technology, dominant cost savings and advanced process technology development. In our developing businesses, OLED greatly improved its profitability, led by differentiated competitiveness. The System LSI business also showed outstanding growth in the mobile device market, led by the AP and CIS sensor segments. In 2013, we will sharpen our market leadership across core areas and accelerate developing businesses to maintain our strong performance. With our newly reorganized structure of three divisions, we will aggressively respond to rapidly changing business environments as we steer new technology initiatives, pioneer new markets and identify business opportunities.
Securing our core competitiveness and brand momentumTo reinforce competitiveness, Samsung Electronics is focusing on attracting outstanding talent. We are consistently recruiting experts in software and R&D, and nurturing our patent capabilities by collaborating with outside research institutes and partners. That strategy has paid off. In 2012, we registered 5,081 patents in the U.S. Our differentiated capabilities and technology earned worldwide recognition, including four awards from the European Imaging and Sound Association 2012 (EISA), the most prestigious in the region’s video and audio industry, and 27 innovation awards
The trust and dedication of our customers, shareholders and society drives change and innovation at Samsung Electronics
Vice Chairman & CEO Oh-Hyun Kwon
President & CEO Boo-Keun Yoon
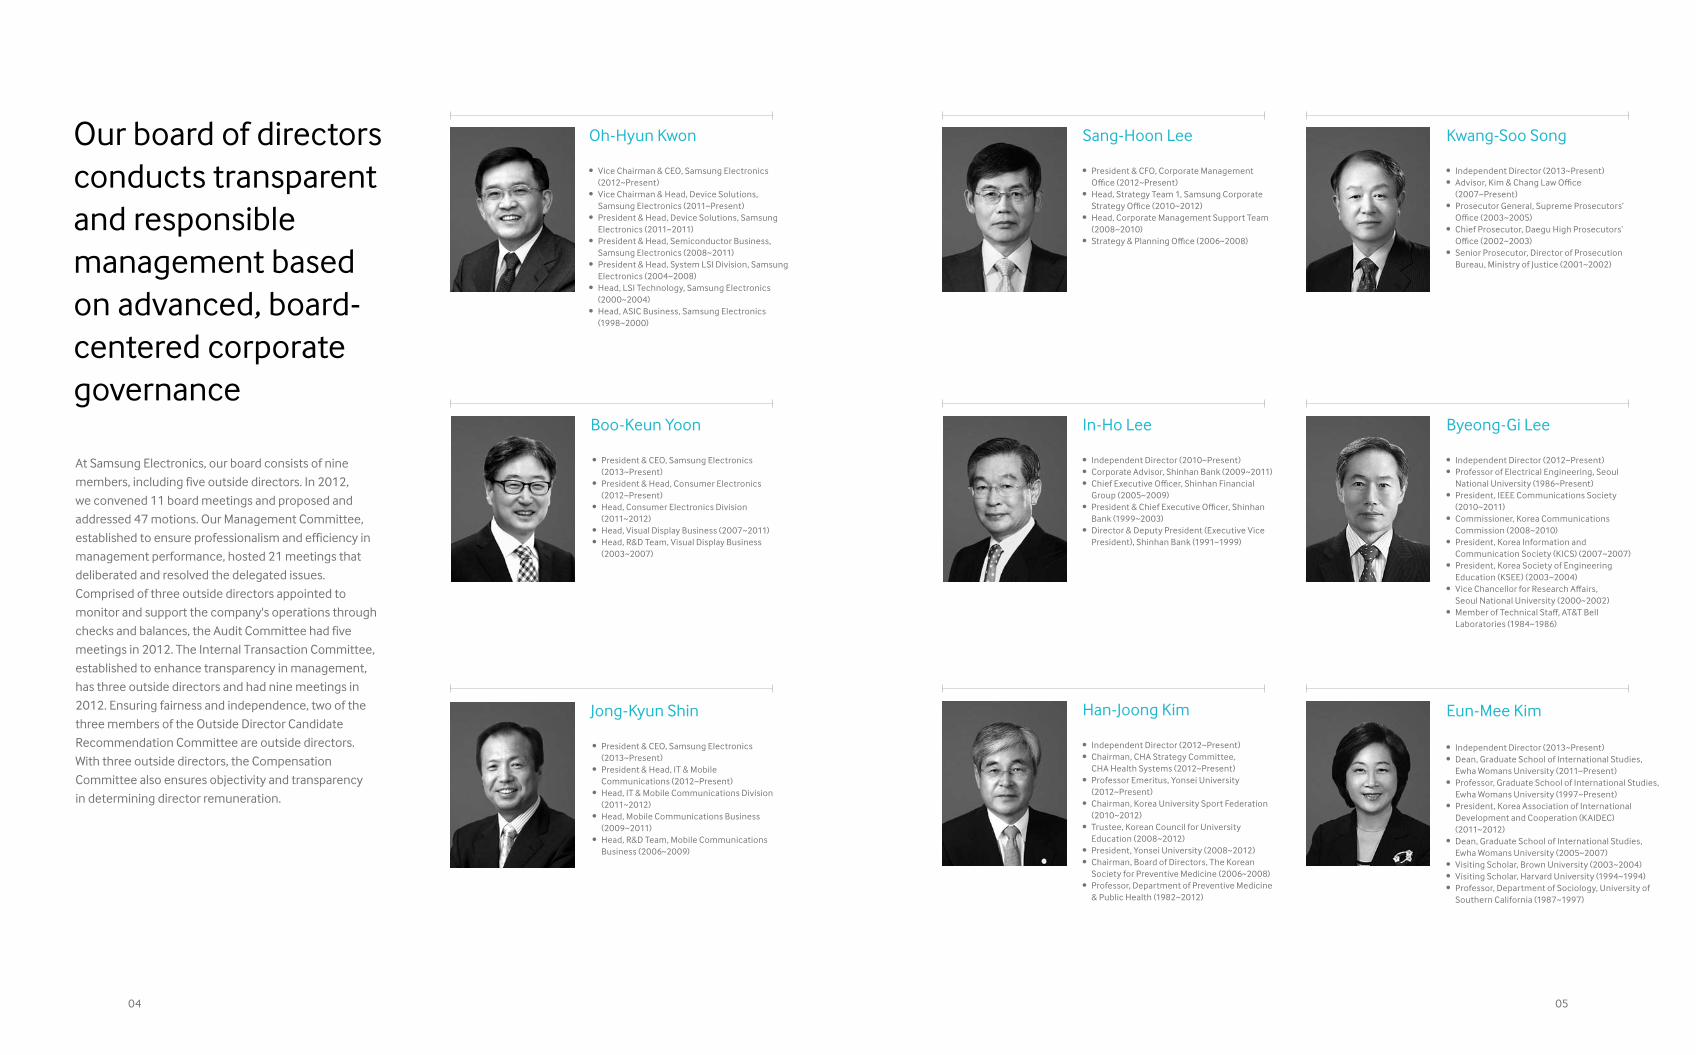
Our board of directors conducts transparent and responsible management based on advanced, board-centered corporate governance
At Samsung Electronics, our board consists of nine members, including five outside directors. In 2012, we convened 11 board meetings and proposed and addressed 47 motions. Our Management Committee, established to ensure professionalism and efficiency in management performance, hosted 21 meetings that deliberated and resolved the delegated issues. Comprised of three outside directors appointed to monitor and support the company's operations through checks and balances, the Audit Committee had five meetings in 2012. The Internal Transaction Committee, established to enhance transparency in management, has three outside directors and had nine meetings in 2012. Ensuring fairness and independence, two of the three members of the Outside Director Candidate Recommendation Committee are outside directors. With three outside directors, the Compensation Committee also ensures objectivity and transparency in determining director remuneration.
•
•
•
••
•
•
•
•
•
•
•
•
•
•
•
•
•
•
•
•
••
•
•
•
••
•
•
•
•
•
•
•••
•
•
••
•
•
•
••
•
Boo-Keun Yoon
Jong-Kyun Shin
Sang-Hoon LeeOh-Hyun Kwon Kwang-Soo Song
Byeong-Gi LeeIn-Ho Lee
Han-Joong Kim Eun-Mee Kim
President & CEO, Samsung Electronics (2013~Present)President & Head, Consumer Electronics (2012~Present)Head, Consumer Electronics Division (2011~2012)Head, Visual Display Business (2007~2011)Head, R&D Team, Visual Display Business (2003~2007)
President & CEO, Samsung Electronics (2013~Present)President & Head, IT & Mobile Communications (2012~Present)Head, IT & Mobile Communications Division (2011~2012)Head, Mobile Communications Business (2009~2011)Head, R&D Team, Mobile Communications Business (2006~2009)
President & CFO, Corporate Management Office (2012~Present)Head, Strategy Team 1, Samsung Corporate Strategy Office (2010~2012)Head, Corporate Management Support Team (2008~2010)Strategy & Planning Office (2006~2008)
Vice Chairman & CEO, Samsung Electronics (2012~Present)Vice Chairman & Head, Device Solutions, Samsung Electronics (2011~Present)President & Head, Device Solutions, Samsung Electronics (2011~2011)President & Head, Semiconductor Business, Samsung Electronics (2008~2011)President & Head, System LSI Division, Samsung Electronics (2004~2008)Head, LSI Technology, Samsung Electronics (2000~2004)Head, ASIC Business, Samsung Electronics (1998~2000)
Independent Director (2013~Present)Advisor, Kim & Chang Law Office (2007~Present)Prosecutor General, Supreme Prosecutors’ Office (2003~2005)Chief Prosecutor, Daegu High Prosecutors’ Office (2002~2003)Senior Prosecutor, Director of Prosecution Bureau, Ministry of Justice (2001~2002)
Independent Director (2012~Present)Professor of Electrical Engineering, Seoul National University (1986~Present)President, IEEE Communications Society (2010~2011)Commissioner, Korea Communications Commission (2008~2010)President, Korea Information and Communication Society (KICS) (2007~2007)President, Korea Society of Engineering Education (KSEE) (2003~2004)Vice Chancellor for Research Affairs, Seoul National University (2000~2002)Member of Technical Staff, AT&T Bell Laboratories (1984~1986)
Independent Director (2010~Present)Corporate Advisor, Shinhan Bank (2009~2011)Chief Executive Officer, Shinhan Financial Group (2005~2009)President & Chief Executive Officer, Shinhan Bank (1999~2003)Director & Deputy President (Executive Vice President), Shinhan Bank (1991~1999)
Independent Director (2012~Present)Chairman, CHA Strategy Committee, CHA Health Systems (2012~Present)Professor Emeritus, Yonsei University (2012~Present)Chairman, Korea University Sport Federation (2010~2012)Trustee, Korean Council for University Education (2008~2012)President, Yonsei University (2008~2012)Chairman, Board of Directors, The Korean Society for Preventive Medicine (2006~2008)Professor, Department of Preventive Medicine & Public Health (1982~2012)
Independent Director (2013~Present)Dean, Graduate School of International Studies, Ewha Womans University (2011~Present)Professor, Graduate School of International Studies, Ewha Womans University (1997~Present)President, Korea Association of International Development and Cooperation (KAIDEC) (2011~2012)Dean, Graduate School of International Studies, Ewha Womans University (2005~2007)Visiting Scholar, Brown University (2003~2004)Visiting Scholar, Harvard University (1994~1994)Professor, Department of Sociology, University of Southern California (1987~1997)
••
•
•
•
•••
0504
Despite the global economic recession and
rapidly changing business environment in 2012,
Samsung Electronics recorded historic sales
and profit. Our corporate and brand values also
increased significantly.
But we’re hardly resting on laurels.
We expect to strengthen competitiveness in
our core businesses, bolstering our No. 1 status
in mobile phones, TVs and memory products.
We plan to fortify key capabilities and structures
in our emerging businesses, such as digital
appliances, printers, cameras and system LSI.
We also intend to secure the base for our
new business areas in health and medical
equipment. We are preparing for the future.
06
BusinessOverview
Consumer Electronics
IT & Mobile Communications
Device Solutions
Memory
Business
System LSI
Business
LED
Business
Mobile Communications
Business
Networks
Business
Digital Imaging
Business
Visual Display
Business
Digital Appliances
Business
Printing Solutions
Business
Health & Medical
Equipment
Business

Consumer Electronics
DISCOVERYDreams are boundless. Samsung Electronics constantly reinvents tomorrow to pursue happier and richer lives. We explore the territory of the unknown to discover potential and fulfill greater promise.
We continuously develop and
expand strategic products in our
Consumer Electronics division.
Since we first won top global
market share in 2006, exceptional
technology and innovative design
have strengthened our unrivaled
leadership in flat-panel TVs and
monitors. In the Digital Appliances
business, we achieved remarkable
growth by debuting inventive
new products and differentiated
design in the premium market.
CEConsumer Electronics
Visual Display
Business
Digital Appliances
Business
Printing Solutions
Business
Health & Medical
Equipment
Business
Consumer Electronics
DISCOVERYDreams are boundless. Samsung Electronics constantly reinvents tomorrow to pursue happier and richer lives. We explore the territory of the unknown to discover potential and fulfill greater promise.
1110
Last year, after systematic market research, we
implemented our premium TV marketing and
differentiated strategy by regions. In 2013, we will
reinforce our ultra large size premium TV lineups and
enhance the premium brand image by highlighting
innovative Smart TV features.
Continuing our innovation in the AV business, last
year we launched the world’s first wireless audio dock
with a built-in vacuum tube. In 2013, we employed a
vacuum tube and wireless connection to TV to sound
bar speakers AirTrack HW-F750, ensuring our lead in the
global AV market with our new audio system.
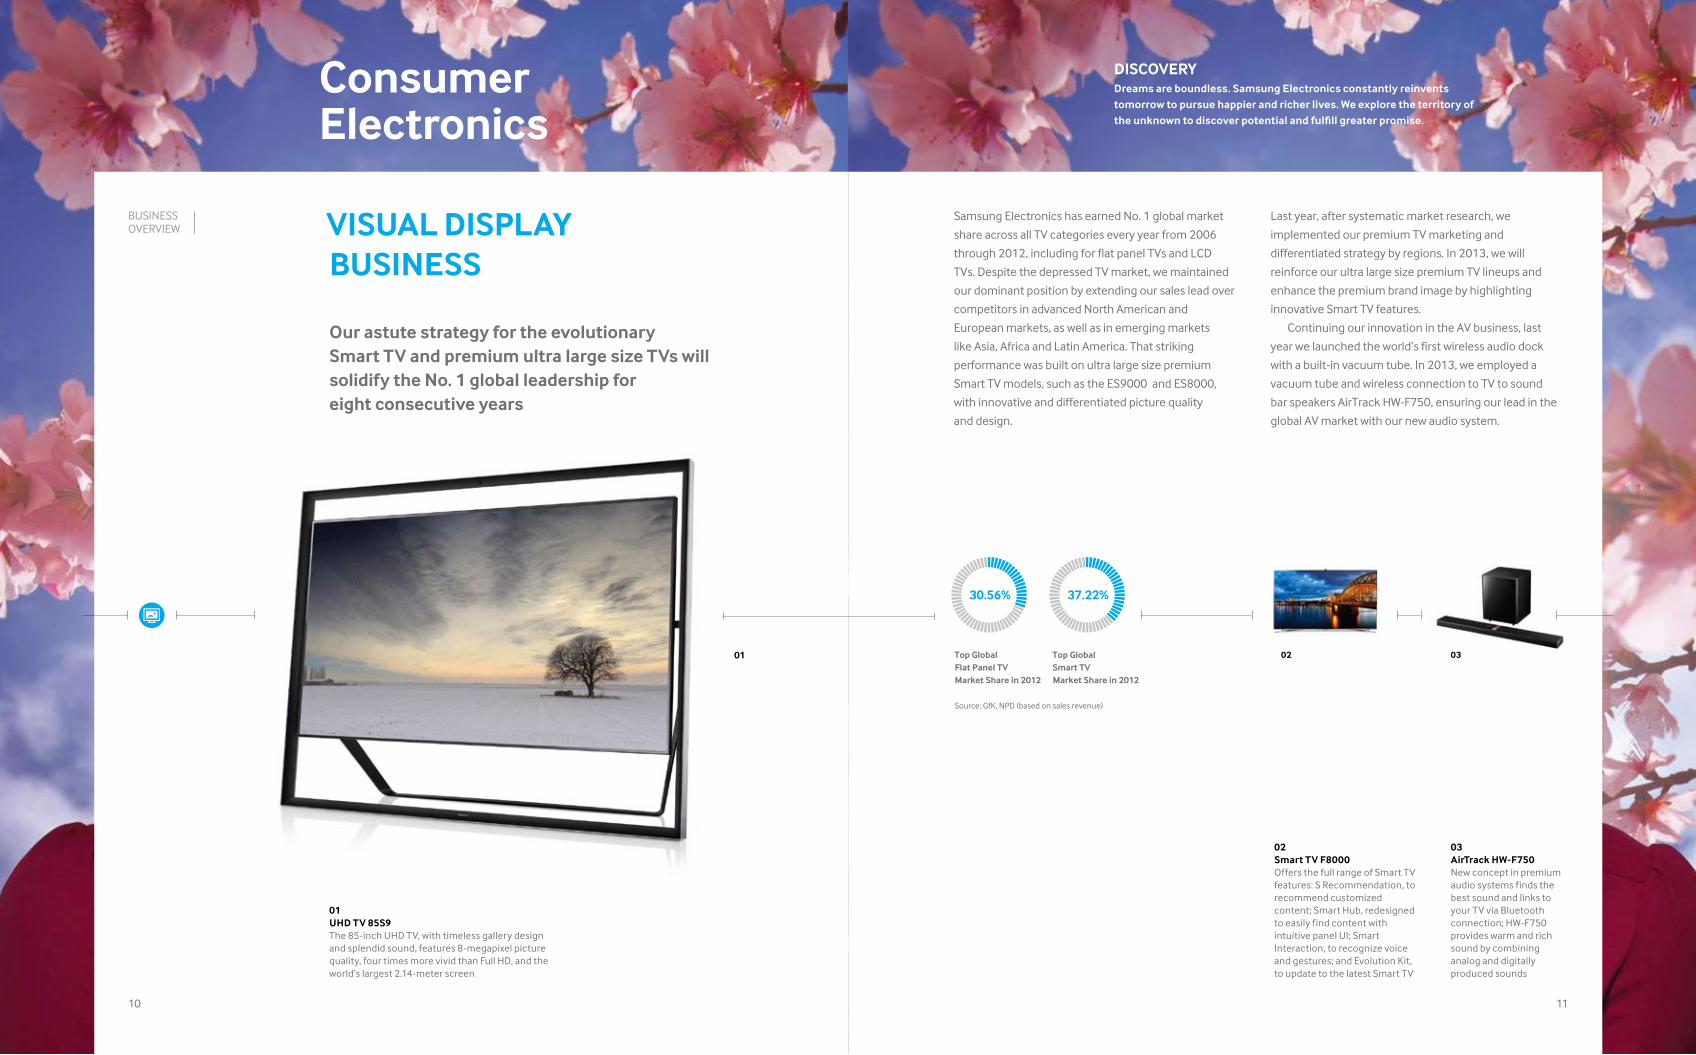
Samsung Electronics has earned No. 1 global market
share across all TV categories every year from 2006
through 2012, including for flat panel TVs and LCD
TVs. Despite the depressed TV market, we maintained
our dominant position by extending our sales lead over
competitors in advanced North American and
European markets, as well as in emerging markets
like Asia, Africa and Latin America. That striking
performance was built on ultra large size premium
Smart TV models, such as the ES9000 and ES8000,
with innovative and differentiated picture quality
and design.
03AirTrack HW-F750New concept in premium audio systems finds the best sound and links to your TV via Bluetooth connection; HW-F750 provides warm and rich sound by combining analog and digitally produced sounds
02Smart TV F8000Offers the full range of Smart TV features: S Recommendation, to recommend customized content; Smart Hub, redesigned to easily find content with intuitive panel UI; Smart Interaction, to recognize voice and gestures; and Evolution Kit, to update to the latest Smart TV
01UHD TV 85S9The 85-inch UHD TV, with timeless gallery design and splendid sound, features 8-megapixel picture quality, four times more vivid than Full HD, and the world’s largest 2.14-meter screen
01 0302
VISUAL DISPLAY BUSINESS
Our astute strategy for the evolutionarySmart TV and premium ultra large size TVs willsolidify the No. 1 global leadership for eight consecutive years
Top Global Flat Panel TV Market Share in 2012
Source: GfK, NPD (based on sales revenue)
30.56%
Top Global Smart TV Market Share in 2012
37.22%
BUSINESS OVERVIEW
Consumer Electronics
DISCOVERYDreams are boundless. Samsung Electronics constantly reinvents tomorrow to pursue happier and richer lives. We explore the territory of the unknown to discover potential and fulfill greater promise.
1312
In our Digital Appliances business, Samsung is
committed to developing eco-friendly technologies and
smart products for the home. Our premium ecobubble™
washer offers significant energy savings and superior
cleaning that’s still gentle on clothes. The new Samsung
Smart Oven provides convenience and a superlative
experience for busy households, allowing consumers to
save time and effort while preparing healthful, great-
tasting meals.
In 2013, Samsung Electronics will continue its efforts
to develop inventive products that offer true value to
customers and help them live happily and comfortably.
Samsung Electronics works to satisfy differing consumer
needs in diverse cultures around the world. We operate
five Lifestyle Research Centers to support development
of products that will bring more comfort and
convenience to customers’ lives. We also respond to
consumers’ emotional satisfaction by providing
luxuriously designed products that offer new experiences.
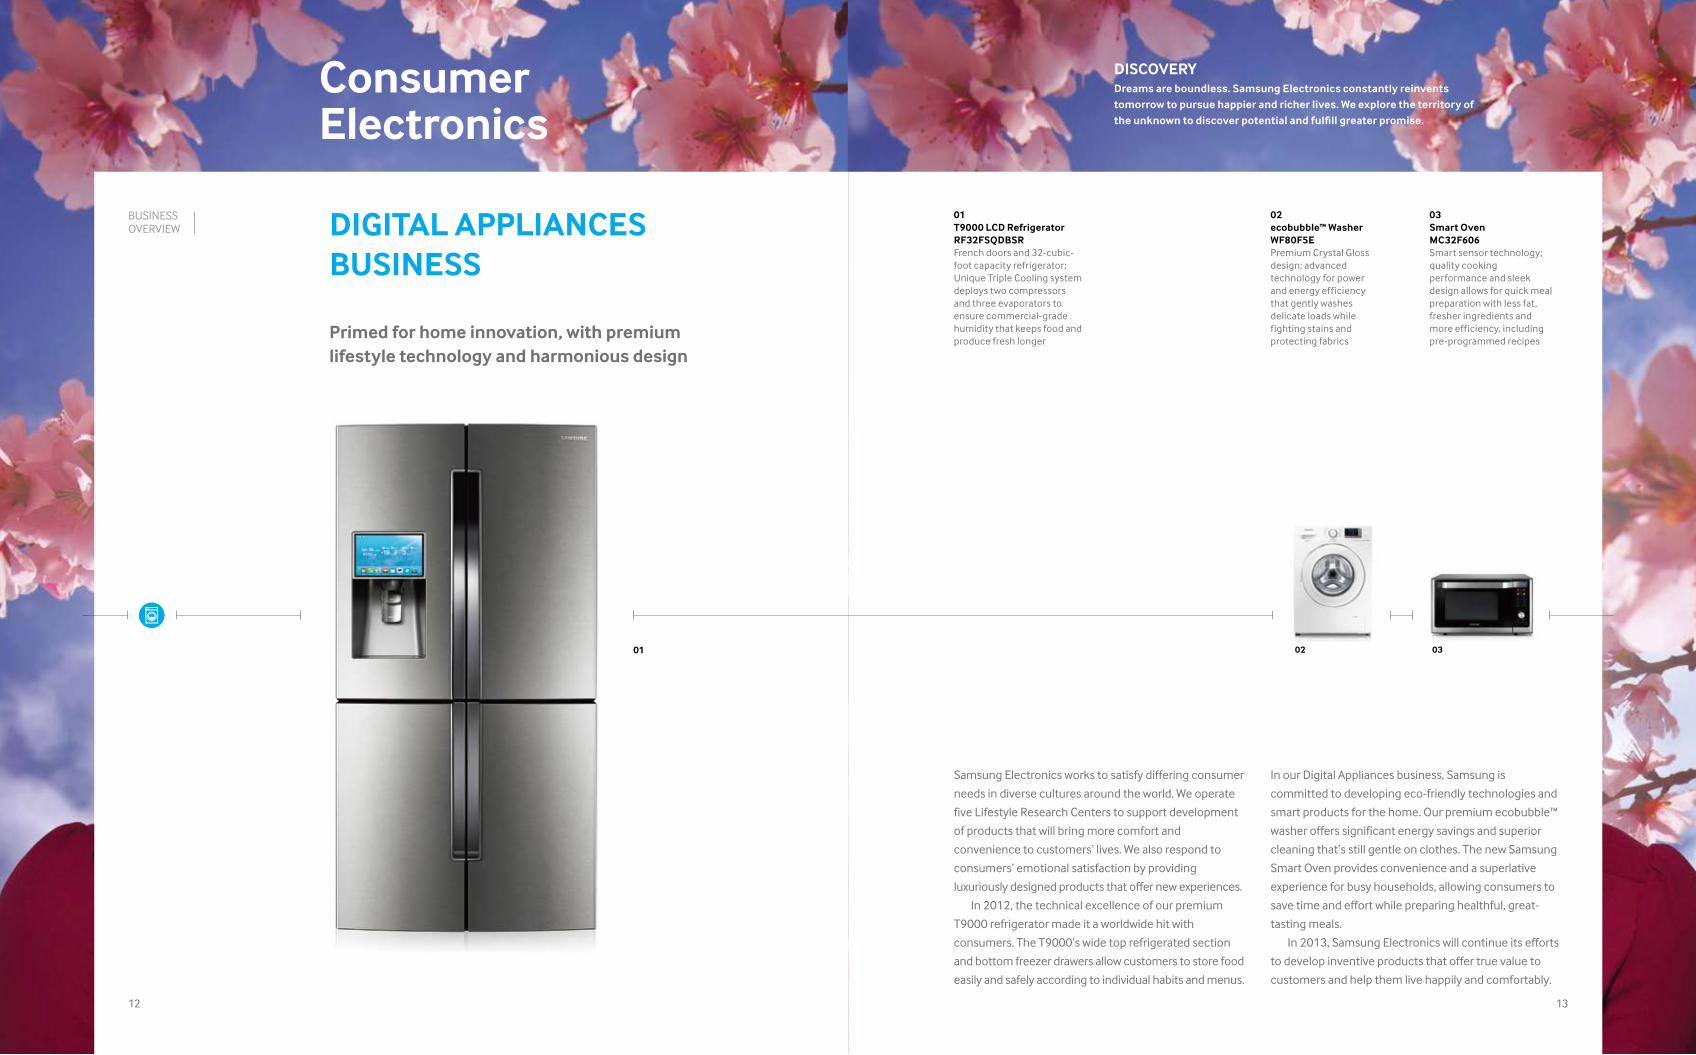
In 2012, the technical excellence of our premium
T9000 refrigerator made it a worldwide hit with
consumers. The T9000’s wide top refrigerated section
and bottom freezer drawers allow customers to store food
easily and safely according to individual habits and menus.
02 0301
01T9000 LCD Refrigerator RF32FSQDBSRFrench doors and 32-cubic-foot capacity refrigerator; Unique Triple Cooling system deploys two compressors and three evaporators to ensure commercial-grade humidity that keeps food and produce fresh longer
DIGITAL APPLIANCES BUSINESS
Primed for home innovation, with premium lifestyle technology and harmonious design
03Smart Oven MC32F606Smart sensor technology; quality cooking performance and sleek design allows for quick meal preparation with less fat, fresher ingredients and more efficiency, including pre-programmed recipes
02ecobubble™ Washer WF80F5EPremium Crystal Gloss design; advanced technology for power and energy efficiency that gently washes delicate loads while fighting stains and protecting fabrics
BUSINESS OVERVIEW
Consumer Electronics
DISCOVERYDreams are boundless. Samsung Electronics constantly reinvents tomorrow to pursue happier and richer lives. We explore the territory of the unknown to discover potential and fulfill greater promise.
1514
02 0301
PRINTING SOLUTIONS BUSINESS
Providing total printing solutions with first-class products and technology
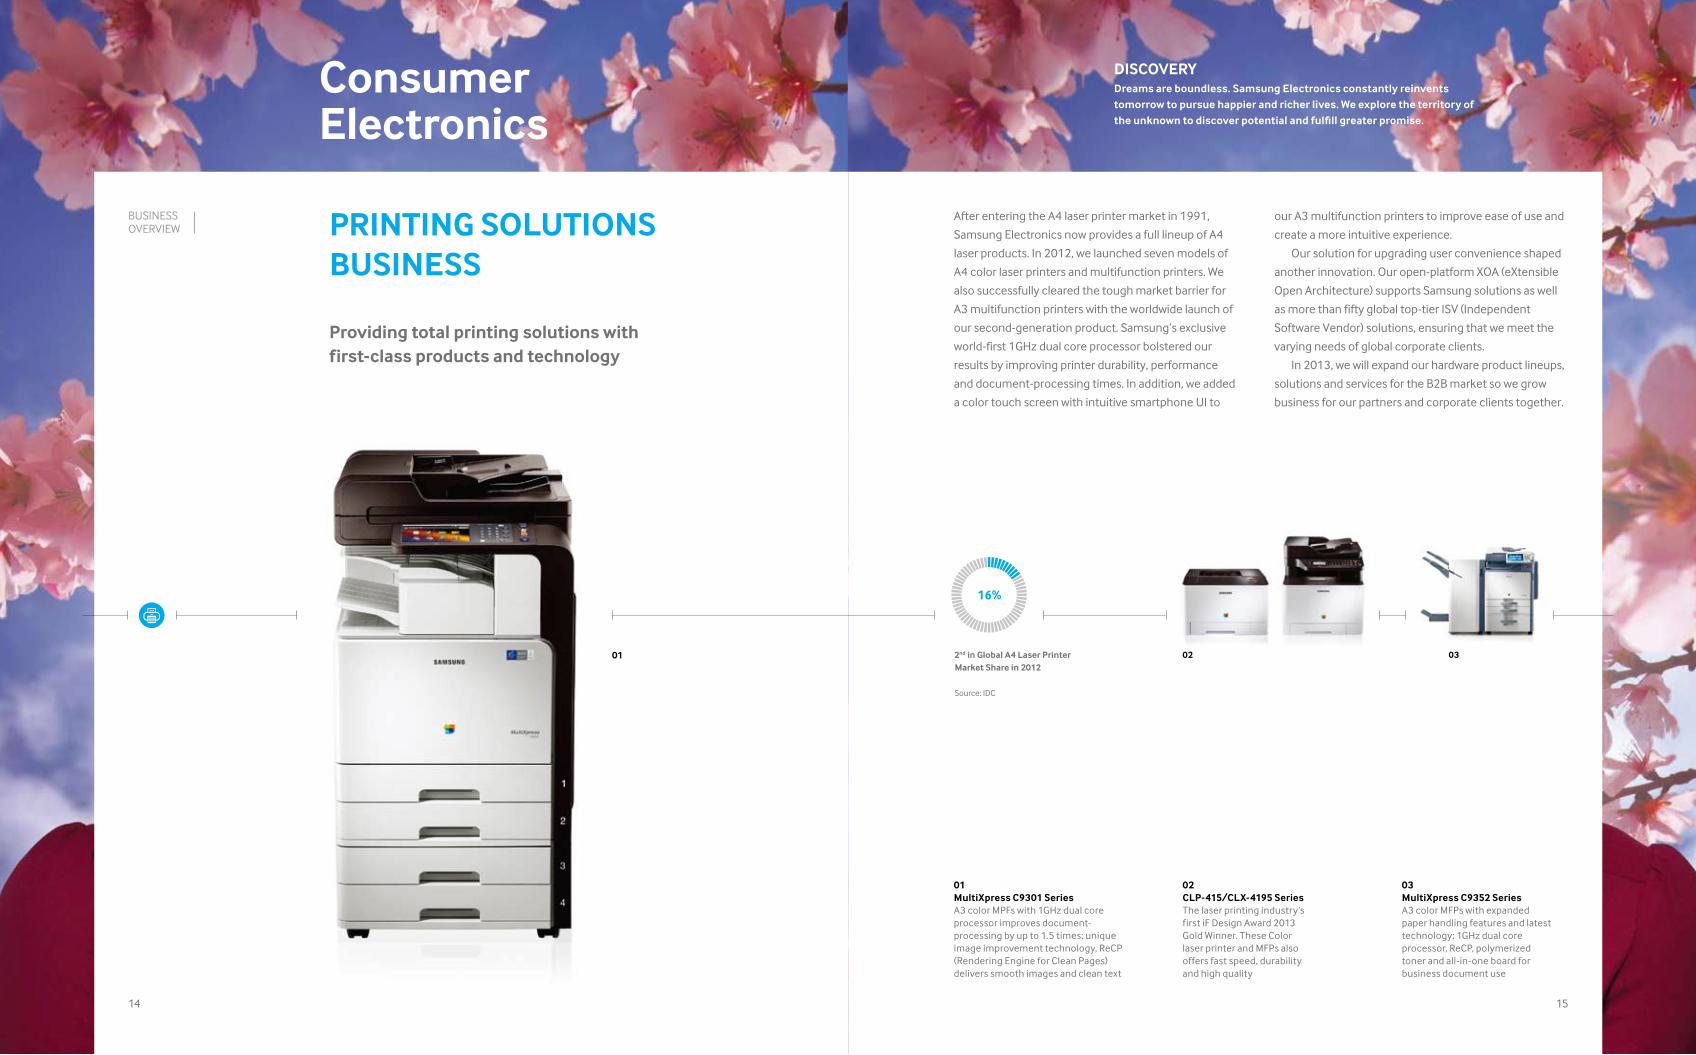
After entering the A4 laser printer market in 1991,
Samsung Electronics now provides a full lineup of A4
laser products. In 2012, we launched seven models of
A4 color laser printers and multifunction printers. We
also successfully cleared the tough market barrier for
A3 multifunction printers with the worldwide launch of
our second-generation product. Samsung’s exclusive
world-first 1GHz dual core processor bolstered our
results by improving printer durability, performance
and document-processing times. In addition, we added
a color touch screen with intuitive smartphone UI to
our A3 multifunction printers to improve ease of use and
create a more intuitive experience.
Our solution for upgrading user convenience shaped
another innovation. Our open-platform XOA (eXtensible
Open Architecture) supports Samsung solutions as well
as more than fifty global top-tier ISV (Independent
Software Vendor) solutions, ensuring that we meet the
varying needs of global corporate clients.
In 2013, we will expand our hardware product lineups,
solutions and services for the B2B market so we grow
business for our partners and corporate clients together.
2nd in Global A4 Laser Printer Market Share in 2012
Source: IDC
16%
BUSINESS OVERVIEW
01MultiXpress C9301 SeriesA3 color MPFs with 1GHz dual core processor improves document-processing by up to 1.5 times; unique image improvement technology, ReCP (Rendering Engine for Clean Pages) delivers smooth images and clean text
03MultiXpress C9352 Series A3 color MFPs with expanded paper handling features and latest technology; 1GHz dual core processor, ReCP, polymerized toner and all-in-one board for business document use
02CLP-415/CLX-4195 SeriesThe laser printing industry’s first iF Design Award 2013 Gold Winner. These Color laser printer and MFPs also offers fast speed, durability and high quality
Consumer Electronics
DISCOVERYDreams are boundless. Samsung Electronics constantly reinvents tomorrow to pursue happier and richer lives. We explore the territory of the unknown to discover potential and fulfill greater promise.
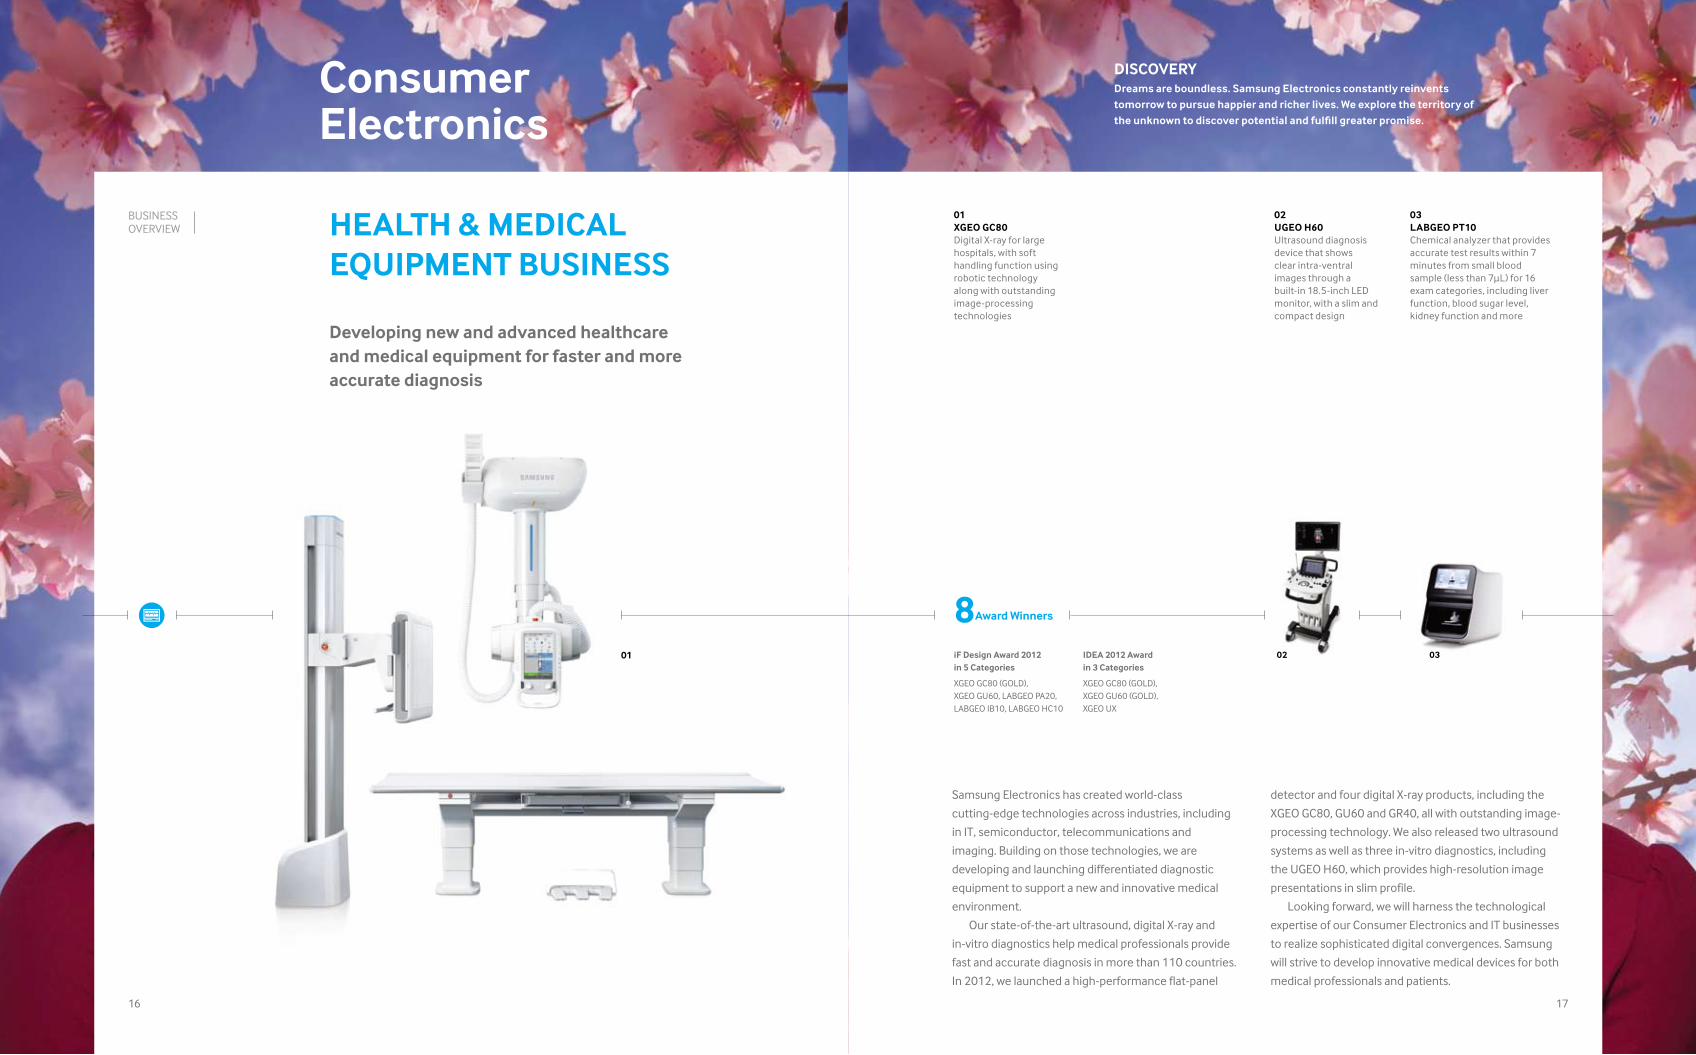
03LABGEO PT10Chemical analyzer that provides accurate test results within 7 minutes from small blood sample (less than 7μL) for 16 exam categories, including liver function, blood sugar level, kidney function and more
02UGEO H60Ultrasound diagnosisdevice that shows clear intra-ventral images through a built-in 18.5-inch LED monitor, with a slim andcompact design
02 0301
01XGEO GC80Digital X-ray for largehospitals, with softhandling function usingrobotic technology along with outstanding image-processingtechnologies
HEALTH & MEDICAL EQUIPMENT BUSINESS
Developing new and advanced healthcare and medical equipment for faster and more accurate diagnosis
detector and four digital X-ray products, including the
XGEO GC80, GU60 and GR40, all with outstanding image-
processing technology. We also released two ultrasound
systems as well as three in-vitro diagnostics, including
the UGEO H60, which provides high-resolution image
presentations in slim profile.
Looking forward, we will harness the technological
expertise of our Consumer Electronics and IT businesses
to realize sophisticated digital convergences. Samsung
will strive to develop innovative medical devices for both
medical professionals and patients.
Samsung Electronics has created world-class
cutting-edge technologies across industries, including
in IT, semiconductor, telecommunications and
imaging. Building on those technologies, we are
developing and launching differentiated diagnostic
equipment to support a new and innovative medical
environment.
Our state-of-the-art ultrasound, digital X-ray and
in-vitro diagnostics help medical professionals provide
fast and accurate diagnosis in more than 110 countries.
In 2012, we launched a high-performance flat-panel
iF Design Award 2012 in 5 Categories
XGEO GC80 (GOLD), XGEO GU60, LABGEO PA20, LABGEO IB10, LABGEO HC10
IDEA 2012 Awardin 3 Categories
XGEO GC80 (GOLD),XGEO GU60 (GOLD),XGEO UX
8Award Winners
BUSINESS OVERVIEW
1716
Consumer Electronics
DISCOVERYDreams are boundless. Samsung Electronics constantly reinvents tomorrow to pursue happier and richer lives. We explore the territory of the unknown to discover potential and fulfill greater promise.
“ Samsung Electronics is like an inventor for trends that change our lives. Its features and designs transform my days with exciting creative experiences that I never before imagined. I find new ways to live with Samsung Electronics.”
18
IT & Mobile Communications
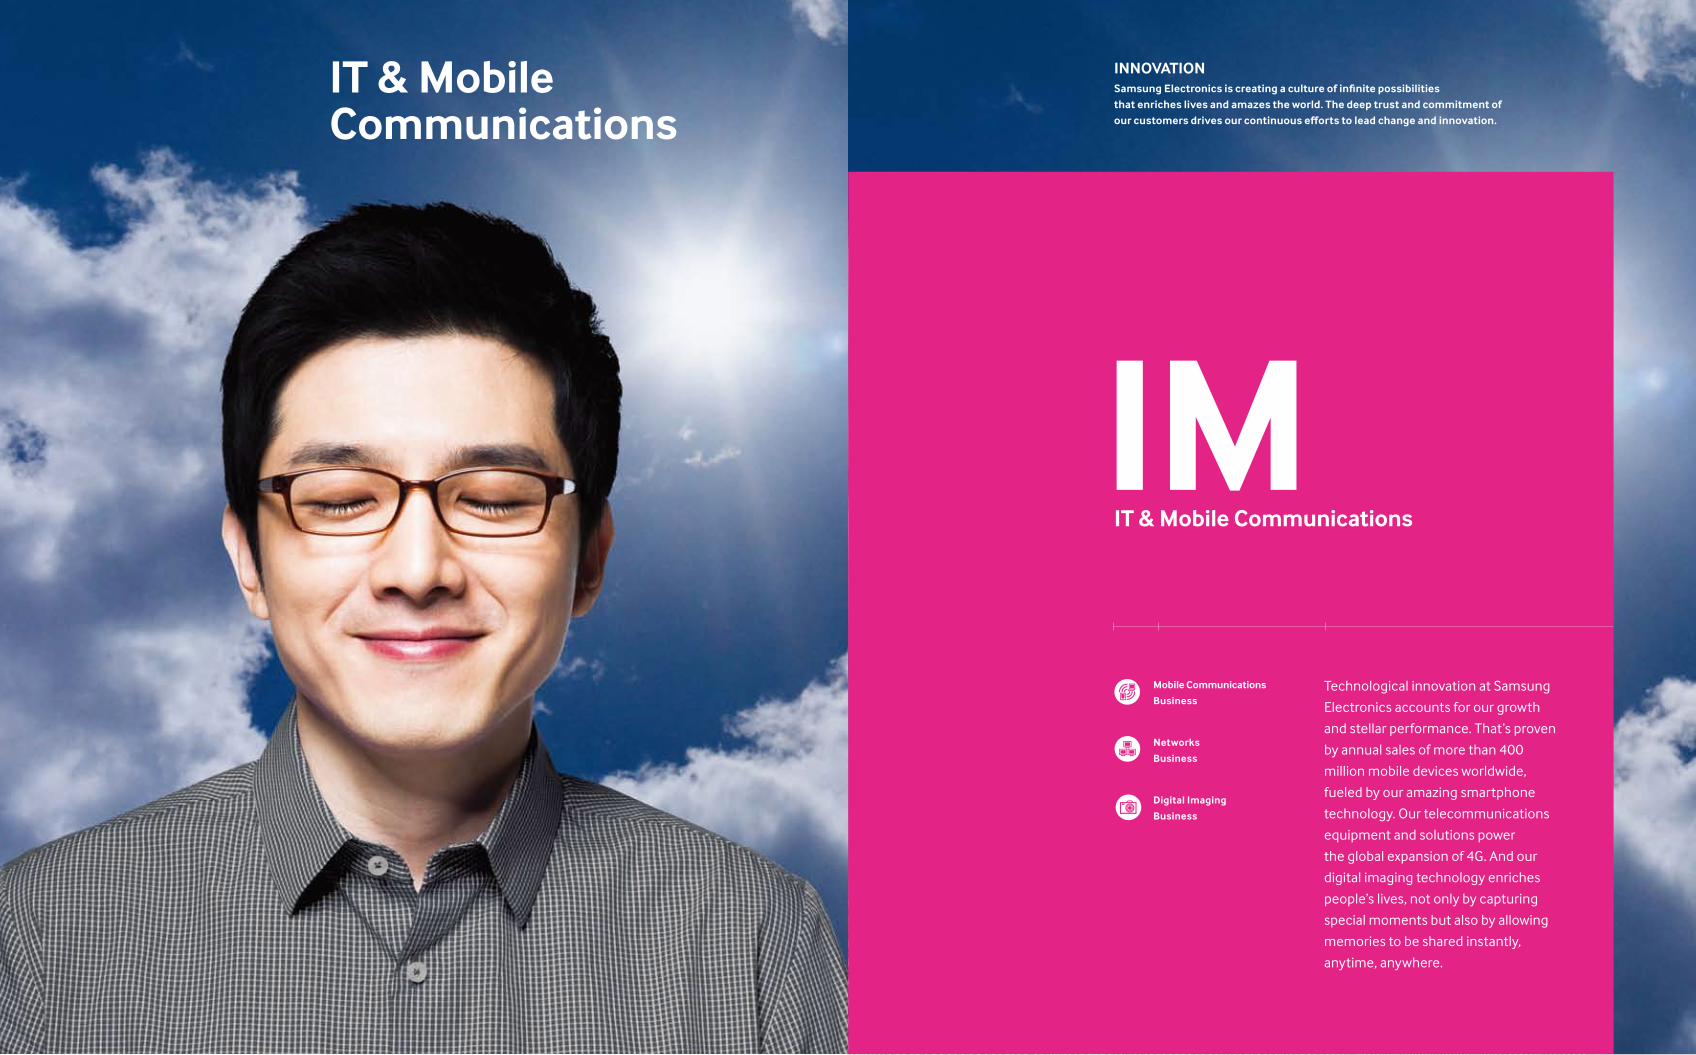
INNOVATIONSamsung Electronics is creating a culture of infinite possibilities that enriches lives and amazes the world. The deep trust and commitment of our customers drives our continuous efforts to lead change and innovation.
Technological innovation at Samsung
Electronics accounts for our growth
and stellar performance. That’s proven
by annual sales of more than 400
million mobile devices worldwide,
fueled by our amazing smartphone
technology. Our telecommunications
equipment and solutions power
the global expansion of 4G. And our
digital imaging technology enriches
people’s lives, not only by capturing
special moments but also by allowing
memories to be shared instantly,
anytime, anywhere.
IMIT & Mobile Communications
Mobile Communications
Business
Networks
Business
Digital Imaging
Business
IT & Mobile Communications
INNOVATIONSamsung Electronics is creating a culture of infinite possibilities that enriches lives and amazes the world. The deep trust and commitment of our customers drives our continuous efforts to lead change and innovation.
2322
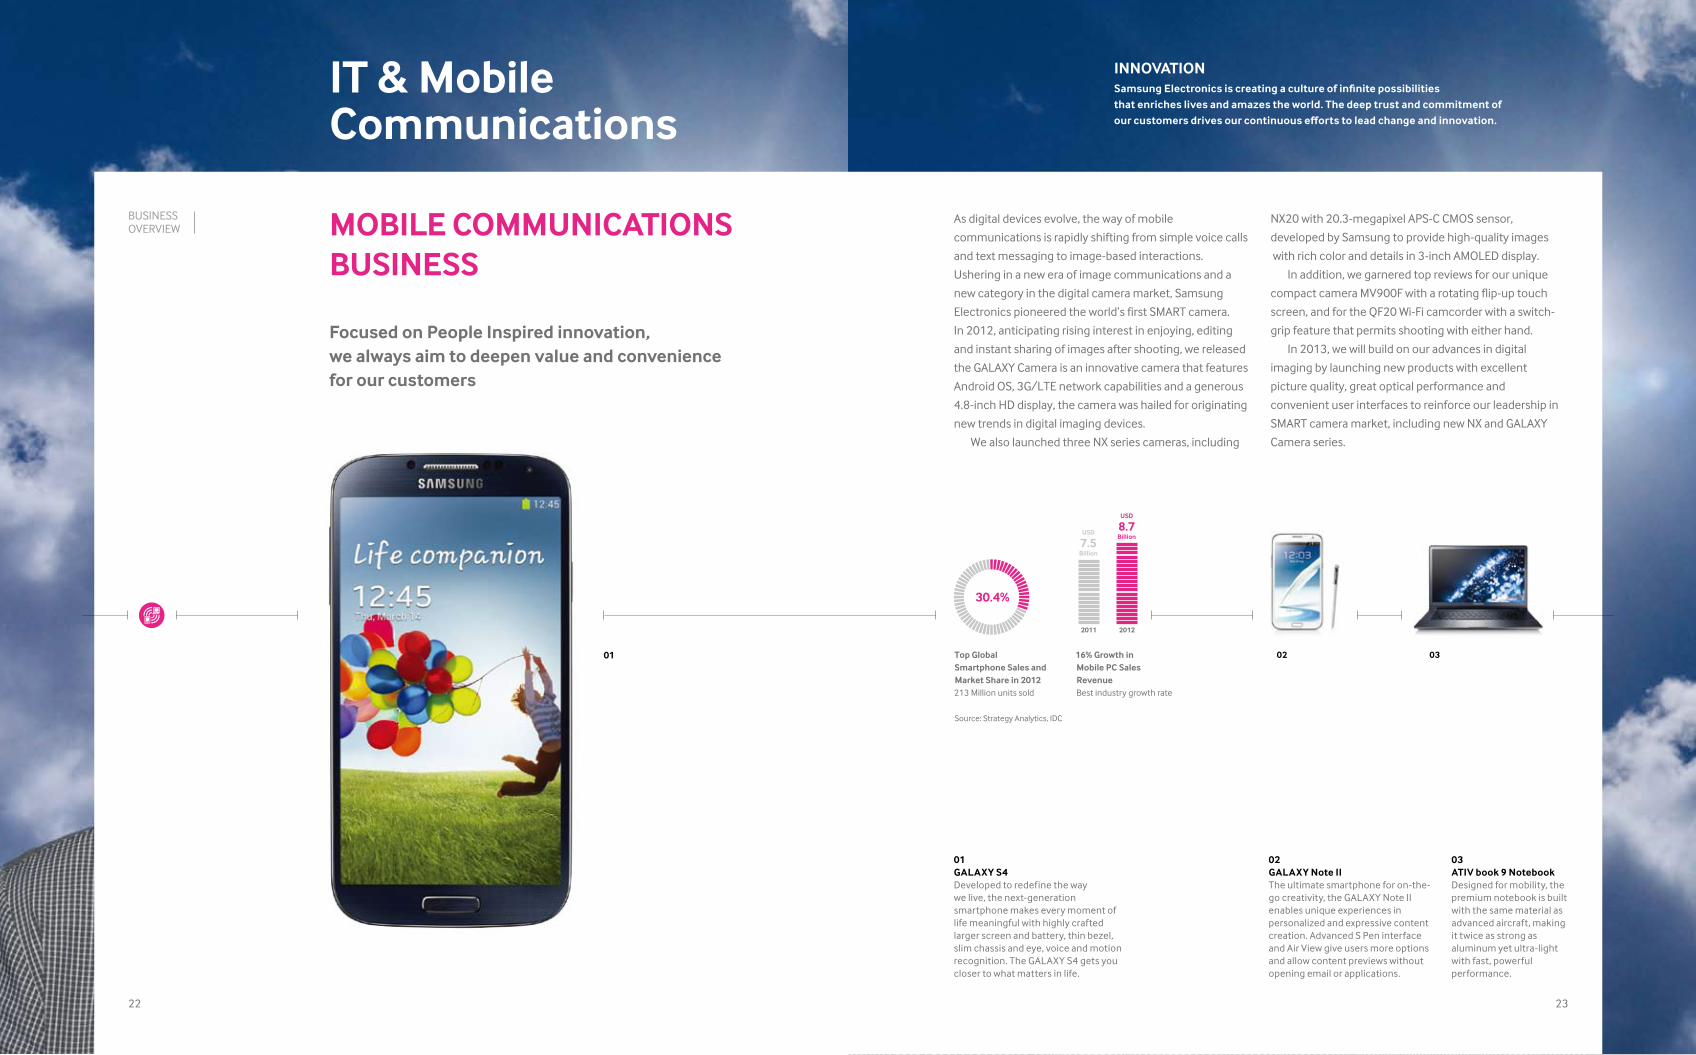
03ATIV book 9 NotebookDesigned for mobility, the premium notebook is built with the same material as advanced aircraft, making it twice as strong as aluminum yet ultra-light with fast, powerful performance.
02GALAXY Note IIThe ultimate smartphone for on-the-go creativity, the GALAXY Note II enables unique experiences in personalized and expressive content creation. Advanced S Pen interface and Air View give users more options and allow content previews without opening email or applications.
01GALAXY S4Developed to redefine the way we live, the next-generation smartphone makes every moment of life meaningful with highly crafted larger screen and battery, thin bezel, slim chassis and eye, voice and motion recognition. The GALAXY S4 gets you closer to what matters in life.
01
NX20 with 20.3-megapixel APS-C CMOS sensor,
developed by Samsung to provide high-quality images
with rich color and details in 3-inch AMOLED display.
In addition, we garnered top reviews for our unique
compact camera MV900F with a rotating flip-up touch
screen, and for the QF20 Wi-Fi camcorder with a switch-
grip feature that permits shooting with either hand.
In 2013, we will build on our advances in digital
imaging by launching new products with excellent
picture quality, great optical performance and
convenient user interfaces to reinforce our leadership in
SMART camera market, including new NX and GALAXY
Camera series.
As digital devices evolve, the way of mobile
communications is rapidly shifting from simple voice calls
and text messaging to image-based interactions.
Ushering in a new era of image communications and a
new category in the digital camera market, Samsung
Electronics pioneered the world’s first SMART camera.
In 2012, anticipating rising interest in enjoying, editing
and instant sharing of images after shooting, we released
the GALAXY Camera is an innovative camera that features
Android OS, 3G/LTE network capabilities and a generous
4.8-inch HD display, the camera was hailed for originating
new trends in digital imaging devices.
We also launched three NX series cameras, including
MOBILE COMMUNICATIONS BUSINESS
Focused on People Inspired innovation, we always aim to deepen value and convenience for our customers
02 03Top Global Smartphone Sales and Market Share in 2012213 Million units sold
Source: Strategy Analytics, IDC
16% Growth in Mobile PC Sales RevenueBest industry growth rate
BUSINESS OVERVIEW
30.4%
USD 7.5 Billion
2011 2012
USD 8.7 Billion
IT & Mobile Communications
INNOVATIONSamsung Electronics is creating a culture of infinite possibilities that enriches lives and amazes the world. The deep trust and commitment of our customers drives our continuous efforts to lead change and innovation.
2524
the contract to provide a LTE service network for the
United Kingdom.
In 2013, we expect the commercialization of LTE
service to be expanded to Europe, South America and
Asia. We are actively identifying new markets based on
successful LTE commercialization in advanced markets,
such as the U.S., Japan and Korea. We also plan to
develop and provide solutions in established markets to
generate value for telecommunications providers and
subscribers, including with such services as VoLTE (Voice
over LTE) for high-quality voice calling, and Carrier
Aggregation to double speeds for data transmission.
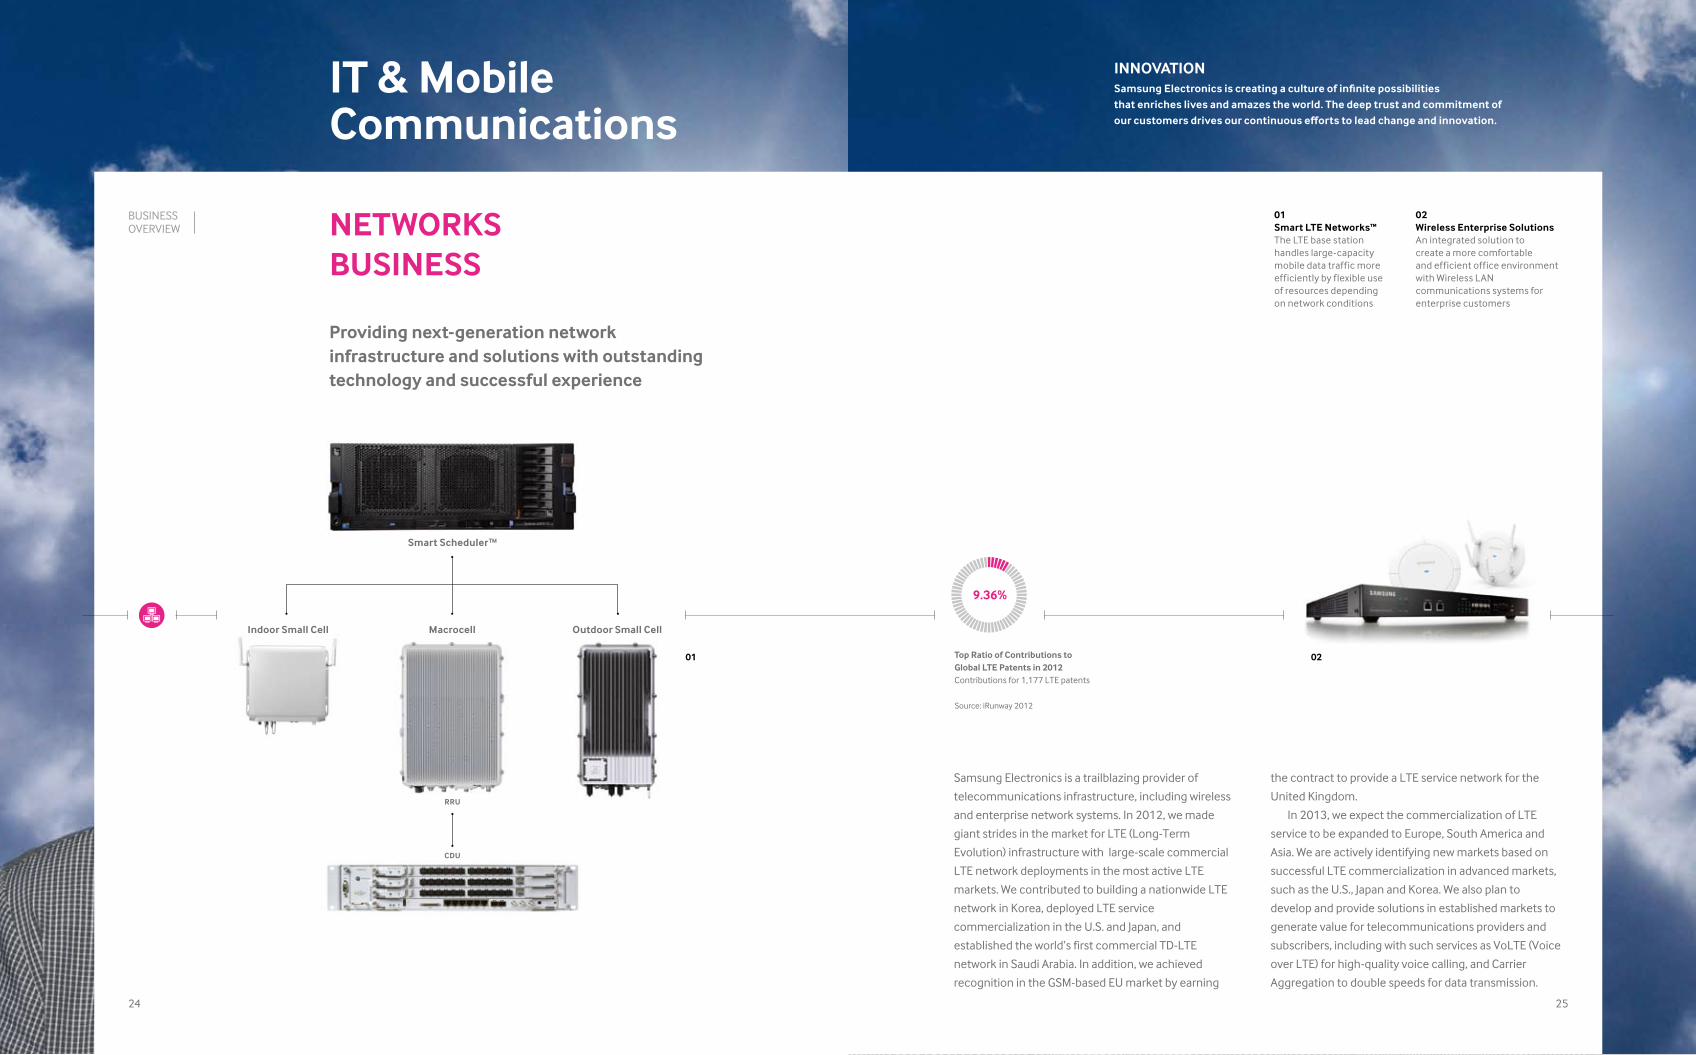
Samsung Electronics is a trailblazing provider of
telecommunications infrastructure, including wireless
and enterprise network systems. In 2012, we made
giant strides in the market for LTE (Long-Term
Evolution) infrastructure with large-scale commercial
LTE network deployments in the most active LTE
markets. We contributed to building a nationwide LTE
network in Korea, deployed LTE service
commercialization in the U.S. and Japan, and
established the world’s first commercial TD-LTE
network in Saudi Arabia. In addition, we achieved
recognition in the GSM-based EU market by earning
NETWORKS BUSINESS
Providing next-generation network infrastructure and solutions with outstanding technology and successful experience
0201 Top Ratio of Contributions to Global LTE Patents in 2012Contributions for 1,177 LTE patents
Source: iRunway 2012
9.36%
02Wireless Enterprise SolutionsAn integrated solution to create a more comfortable and efficient office environment with Wireless LAN communications systems for enterprise customers
01Smart LTE Networks™The LTE base station handles large-capacity mobile data traffic more efficiently by flexible use of resources depending on network conditions
Smart SchedulerTM
Macrocell
CDU
RRU
Indoor Small Cell Outdoor Small Cell
BUSINESS OVERVIEW
IT & Mobile Communications
INNOVATIONSamsung Electronics is creating a culture of infinite possibilities that enriches lives and amazes the world. The deep trust and commitment of our customers drives our continuous efforts to lead change and innovation.
2726
01
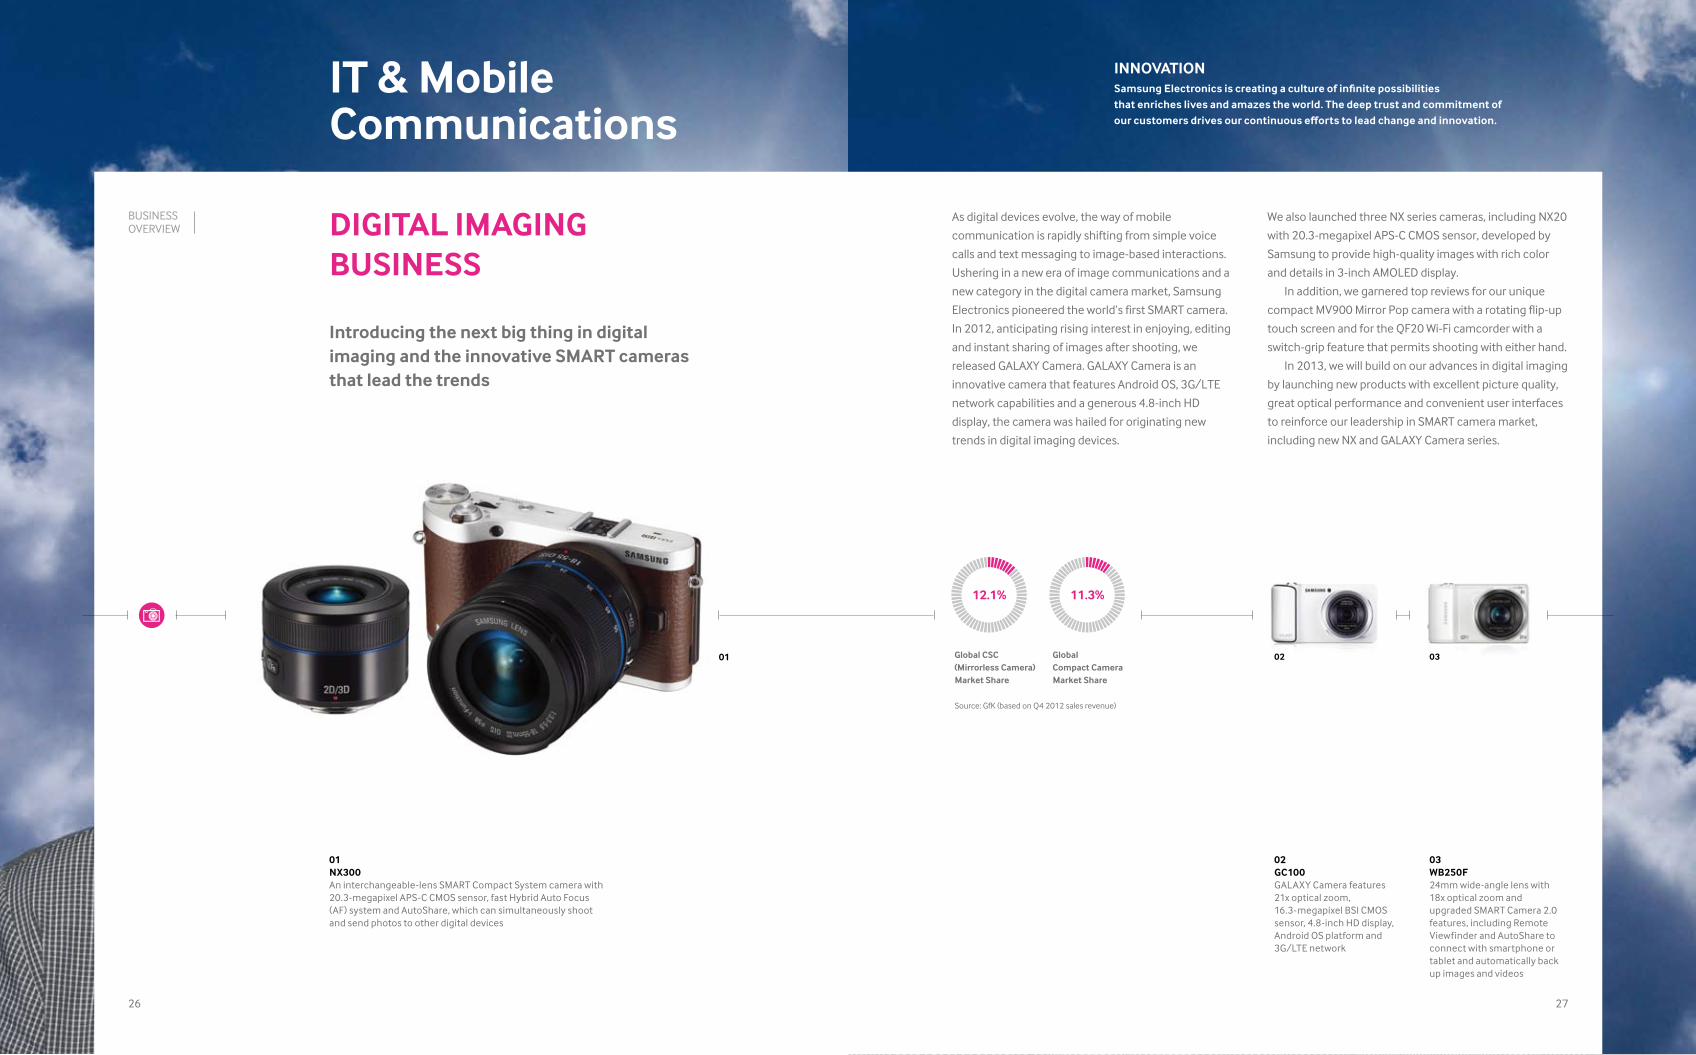
02GC100GALAXY Camera features 21x optical zoom, 16.3-megapixel BSI CMOS sensor, 4.8-inch HD display, Android OS platform and 3G/LTE network
DIGITAL IMAGING BUSINESS
Introducing the next big thing in digital imaging and the innovative SMART cameras that lead the trends
01NX300An interchangeable-lens SMART Compact System camera with 20.3-megapixel APS-C CMOS sensor, fast Hybrid Auto Focus (AF) system and AutoShare, which can simultaneously shoot and send photos to other digital devices
Global CSC (Mirrorless Camera) Market Share
Source: GfK (based on Q4 2012 sales revenue)
12.1%
Global Compact Camera Market Share
11.3%
BUSINESS OVERVIEW
0302
03WB250F24mm wide-angle lens with 18x optical zoom and upgraded SMART Camera 2.0 features, including Remote Viewfinder and AutoShare to connect with smartphone or tablet and automatically back up images and videos
We also launched three NX series cameras, including NX20
with 20.3-megapixel APS-C CMOS sensor, developed by
Samsung to provide high-quality images with rich color
and details in 3-inch AMOLED display.
In addition, we garnered top reviews for our unique
compact MV900 Mirror Pop camera with a rotating flip-up
touch screen and for the QF20 Wi-Fi camcorder with a
switch-grip feature that permits shooting with either hand.
In 2013, we will build on our advances in digital imaging
by launching new products with excellent picture quality,
great optical performance and convenient user interfaces
to reinforce our leadership in SMART camera market,
including new NX and GALAXY Camera series.
As digital devices evolve, the way of mobile
communication is rapidly shifting from simple voice
calls and text messaging to image-based interactions.
Ushering in a new era of image communications and a
new category in the digital camera market, Samsung
Electronics pioneered the world’s first SMART camera.
In 2012, anticipating rising interest in enjoying, editing
and instant sharing of images after shooting, we
released GALAXY Camera. GALAXY Camera is an
innovative camera that features Android OS, 3G/LTE
network capabilities and a generous 4.8-inch HD
display, the camera was hailed for originating new
trends in digital imaging devices.

IT & Mobile Communications
INNOVATIONSamsung Electronics is creating a culture of infinite possibilities that enriches lives and amazes the world. The deep trust and commitment of our customers drives our continuous efforts to lead change and innovation.
28
“ Passion gives us essential energy for life. With passion, we’re not so excited by success or frustrated by difficulties. The thing we must fear most is not failure after doing our best but the unwillingness to begin at all.”

Device Solutions
POSSIBILITYOur future is yet to be determined. We can’t assume tomorrow’s promise. We must shape it with our vision and effort. Samsung Electronics proposes the possibility of a positive future for us all.
Samsung Electronics is expanding
its market leadership in the memory
business by demonstrating superior
technology and dramatic cost savings.
That is generating exciting prospects.
We are expanding our highly profitable
differentiated products, mainly for
mobile devices, and accelerating process
conversion while also focusing on
developing next-generation products.
Supported by increased demand for
AP and CIS sensors, our System LSI
business showed strong growth and cost
leadership, allowing us to launch next-
generation products more quickly.
DSDevice Solutions
Memory
Business
System LSI
Business
LED
Business
Device Solutions
POSSIBILITYOur future is yet to be determined. We can’t assume tomorrow’s promise. We must shape it with our vision and effort. Samsung Electronics proposes the possibility of a positive future for us all.
3332
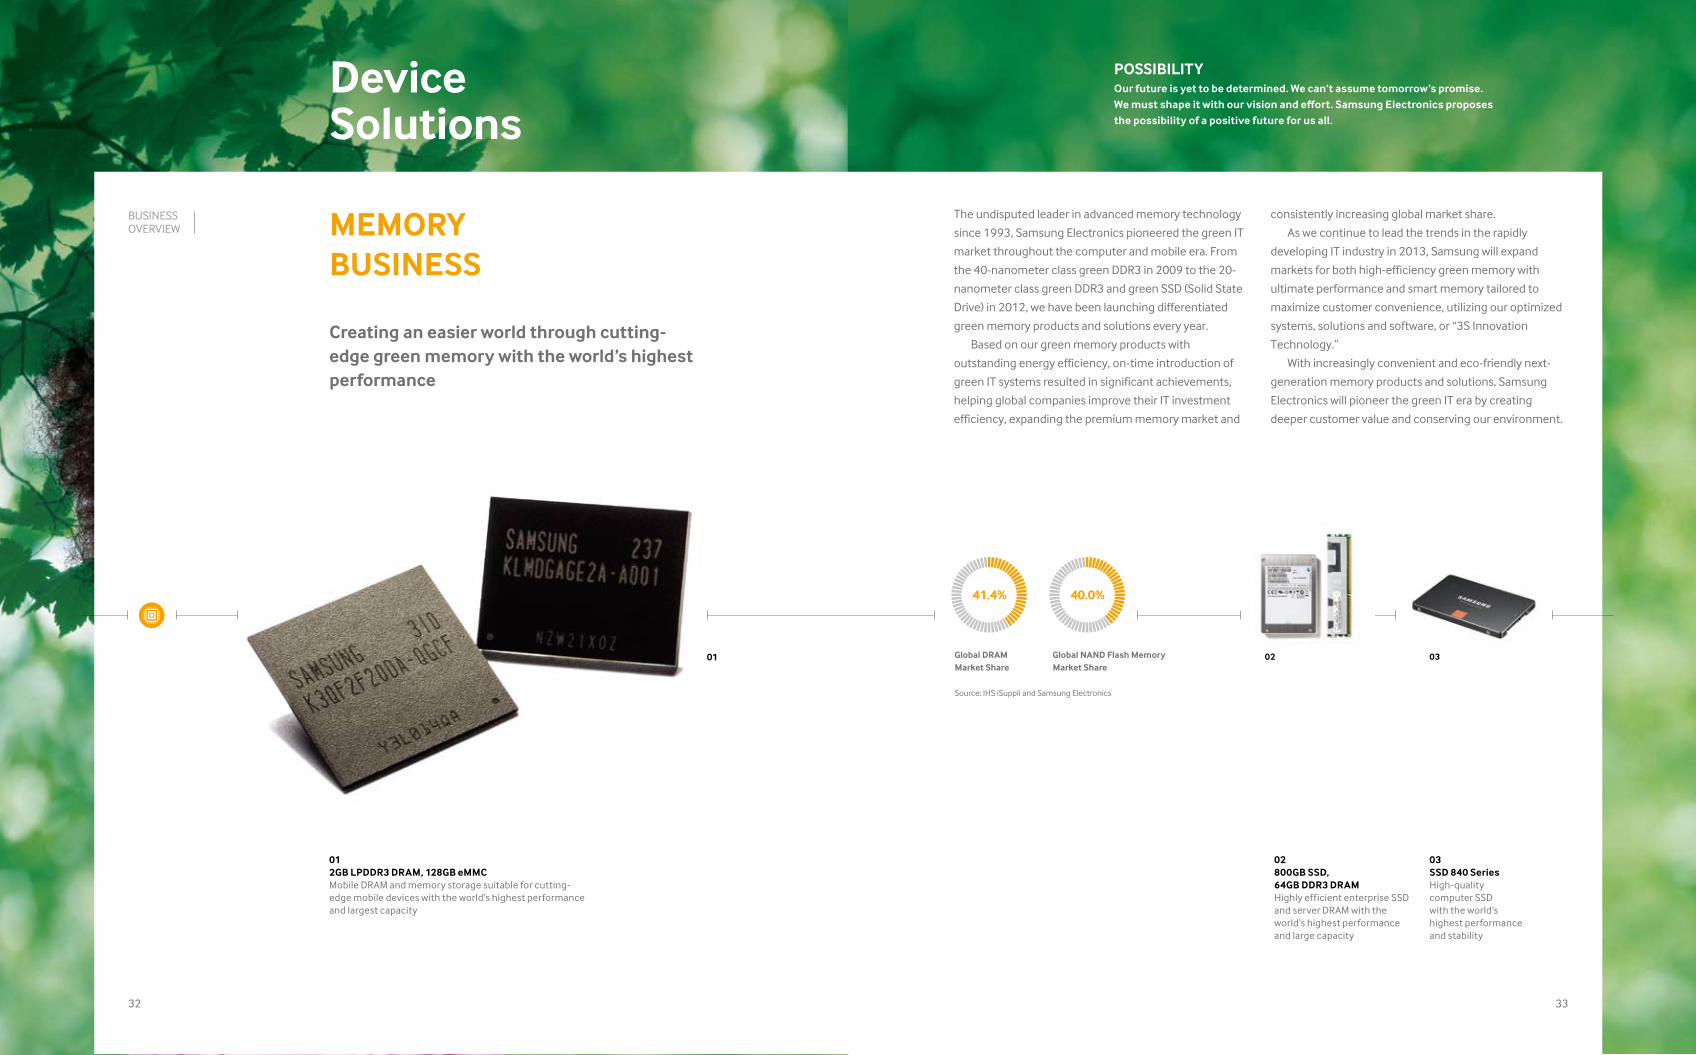
consistently increasing global market share.
As we continue to lead the trends in the rapidly
developing IT industry in 2013, Samsung will expand
markets for both high-efficiency green memory with
ultimate performance and smart memory tailored to
maximize customer convenience, utilizing our optimized
systems, solutions and software, or “3S Innovation
Technology.”
With increasingly convenient and eco-friendly next-
generation memory products and solutions, Samsung
Electronics will pioneer the green IT era by creating
deeper customer value and conserving our environment.
The undisputed leader in advanced memory technology
since 1993, Samsung Electronics pioneered the green IT
market throughout the computer and mobile era. From
the 40-nanometer class green DDR3 in 2009 to the 20-
nanometer class green DDR3 and green SSD (Solid State
Drive) in 2012, we have been launching differentiated
green memory products and solutions every year.
Based on our green memory products with
outstanding energy efficiency, on-time introduction of
green IT systems resulted in significant achievements,
helping global companies improve their IT investment
efficiency, expanding the premium memory market and
03SSD 840 SeriesHigh-quality computer SSD with the world’s highest performance and stability
02800GB SSD, 64GB DDR3 DRAMHighly efficient enterprise SSD and server DRAM with the world’s highest performance and large capacity
0302
MEMORY BUSINESS
Creating an easier world through cutting-edge green memory with the world’s highest performance
01
01 2GB LPDDR3 DRAM, 128GB eMMCMobile DRAM and memory storage suitable for cutting-edge mobile devices with the world’s highest performance and largest capacity
41.4% 40.0%
BUSINESS OVERVIEW
Global DRAM Market Share
Source: IHS iSuppli and Samsung Electronics
Global NAND Flash Memory Market Share
Device Solutions
POSSIBILITYOur future is yet to be determined. We can’t assume tomorrow’s promise. We must shape it with our vision and effort. Samsung Electronics proposes the possibility of a positive future for us all.
34
02 03
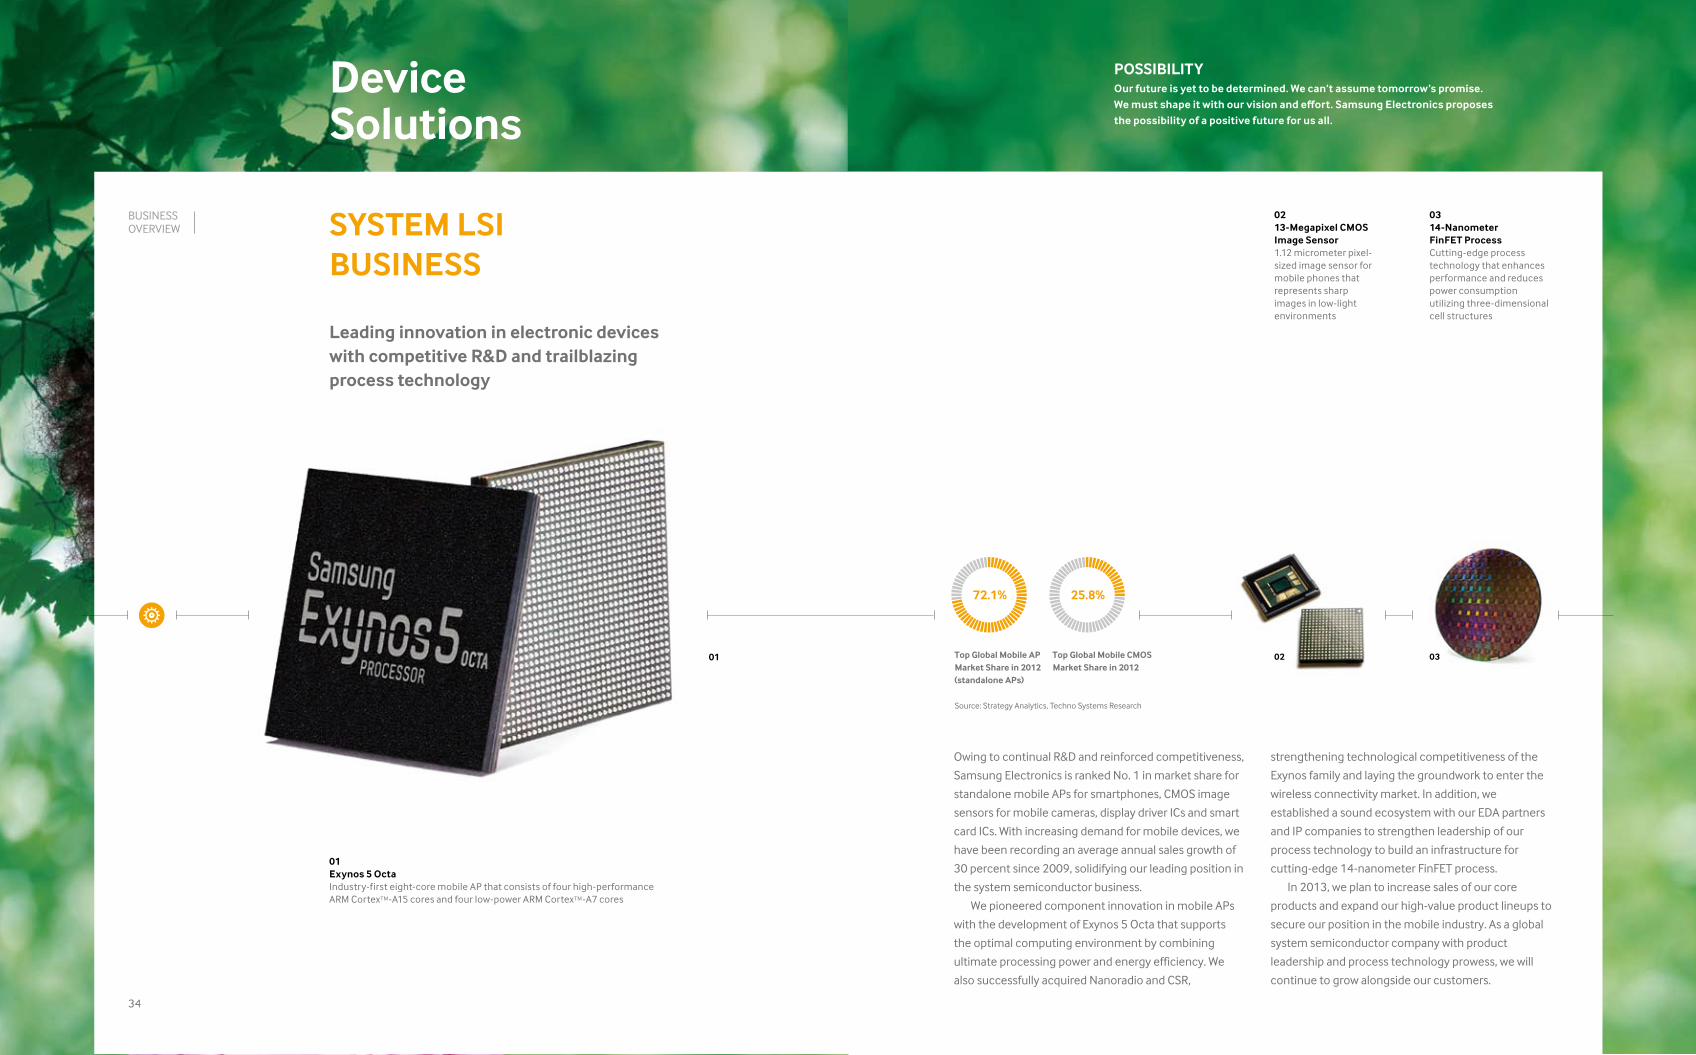
SYSTEM LSI BUSINESS
Leading innovation in electronic devices with competitive R&D and trailblazing process technology
0314-Nanometer FinFET ProcessCutting-edge process technology that enhances performance and reduces power consumption utilizing three-dimensional cell structures
0213-Megapixel CMOS Image Sensor1.12 micrometer pixel-sized image sensor for mobile phones that represents sharp images in low-light environments
strengthening technological competitiveness of the
Exynos family and laying the groundwork to enter the
wireless connectivity market. In addition, we
established a sound ecosystem with our EDA partners
and IP companies to strengthen leadership of our
process technology to build an infrastructure for
cutting-edge 14-nanometer FinFET process.
In 2013, we plan to increase sales of our core
products and expand our high-value product lineups to
secure our position in the mobile industry. As a global
system semiconductor company with product
leadership and process technology prowess, we will
continue to grow alongside our customers.
Owing to continual R&D and reinforced competitiveness,
Samsung Electronics is ranked No. 1 in market share for
standalone mobile APs for smartphones, CMOS image
sensors for mobile cameras, display driver ICs and smart
card ICs. With increasing demand for mobile devices, we
have been recording an average annual sales growth of
30 percent since 2009, solidifying our leading position in
the system semiconductor business.
We pioneered component innovation in mobile APs
with the development of Exynos 5 Octa that supports
the optimal computing environment by combining
ultimate processing power and energy efficiency. We
also successfully acquired Nanoradio and CSR,
01Exynos 5 OctaIndustry-first eight-core mobile AP that consists of four high-performance ARM CortexTM-A15 cores and four low-power ARM CortexTM-A7 cores
Top Global Mobile APMarket Share in 2012 (standalone APs)
Source: Strategy Analytics, Techno Systems Research
72.1%
Top Global Mobile CMOS Market Share in 2012
25.8%
BUSINESS OVERVIEW
01
Device Solutions
POSSIBILITYOur future is yet to be determined. We can’t assume tomorrow’s promise. We must shape it with our vision and effort. Samsung Electronics proposes the possibility of a positive future for us all.
3736
02 0301
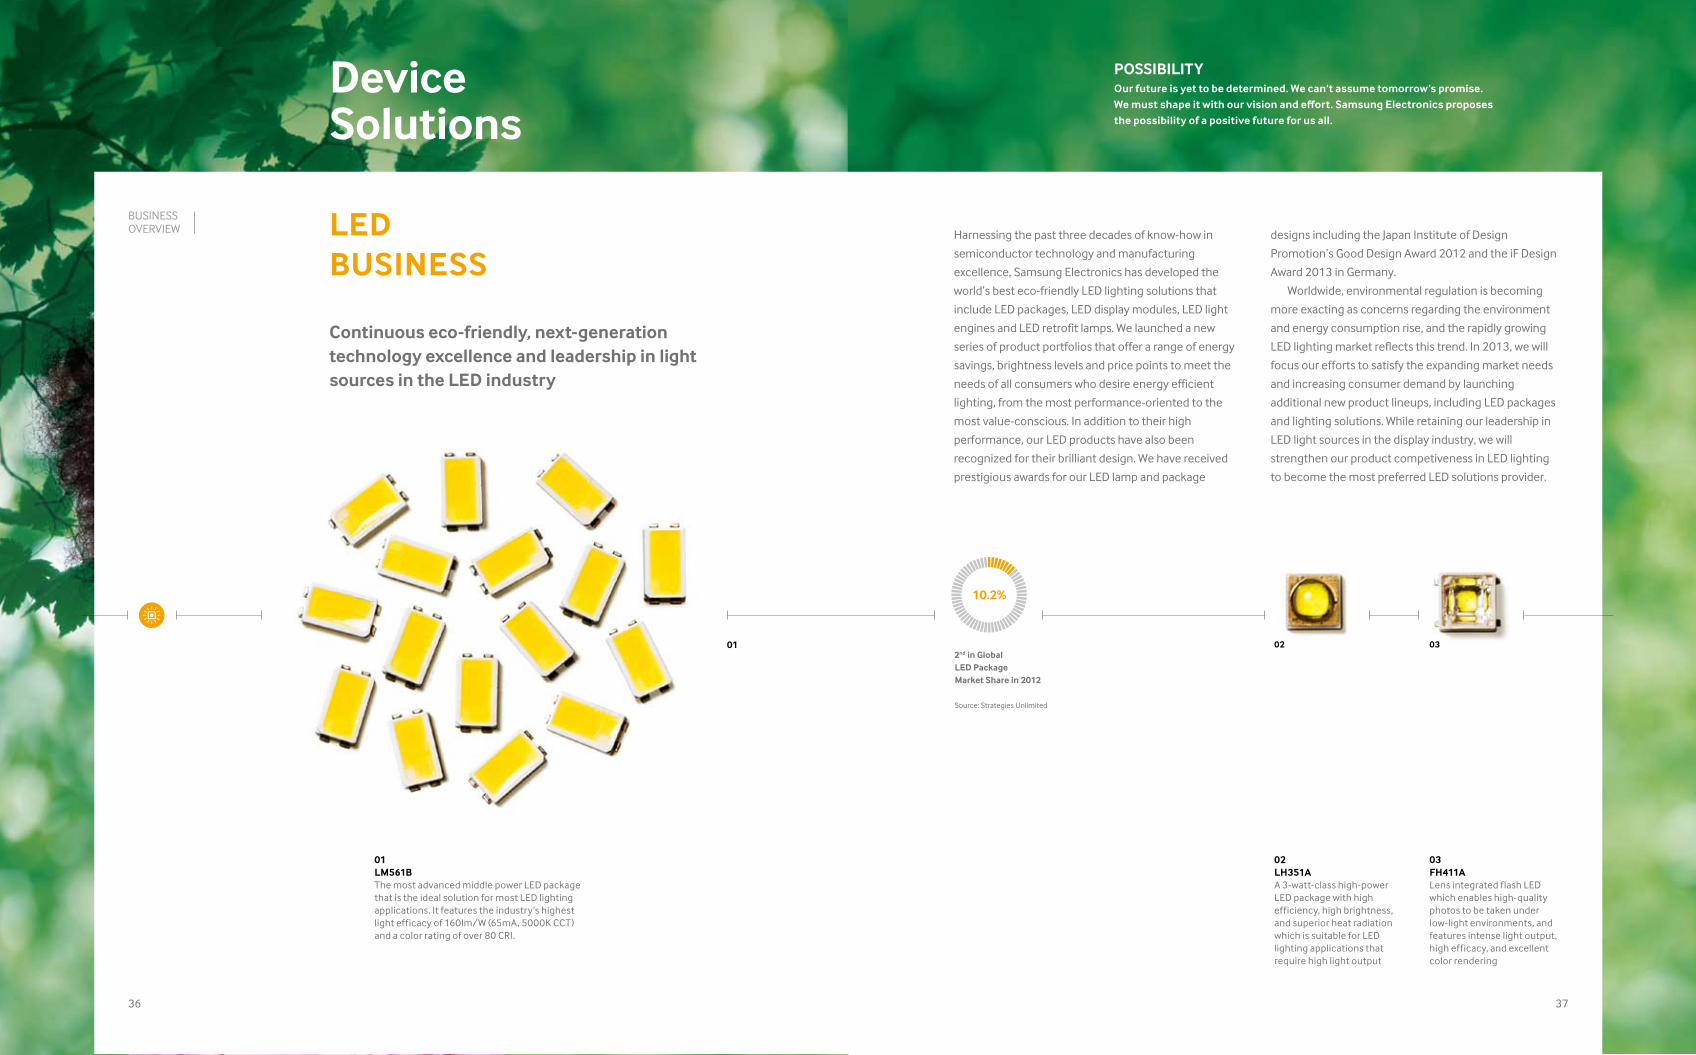
designs including the Japan Institute of Design
Promotion’s Good Design Award 2012 and the iF Design
Award 2013 in Germany.
Worldwide, environmental regulation is becoming
more exacting as concerns regarding the environment
and energy consumption rise, and the rapidly growing
LED lighting market reflects this trend. In 2013, we will
focus our efforts to satisfy the expanding market needs
and increasing consumer demand by launching
additional new product lineups, including LED packages
and lighting solutions. While retaining our leadership in
LED light sources in the display industry, we will
strengthen our product competiveness in LED lighting
to become the most preferred LED solutions provider.
Harnessing the past three decades of know-how in
semiconductor technology and manufacturing
excellence, Samsung Electronics has developed the
world’s best eco-friendly LED lighting solutions that
include LED packages, LED display modules, LED light
engines and LED retrofit lamps. We launched a new
series of product portfolios that offer a range of energy
savings, brightness levels and price points to meet the
needs of all consumers who desire energy efficient
lighting, from the most performance-oriented to the
most value-conscious. In addition to their high
performance, our LED products have also been
recognized for their brilliant design. We have received
prestigious awards for our LED lamp and package
02LH351AA 3-watt-class high-power LED package with high efficiency, high brightness, and superior heat radiation which is suitable for LED lighting applications that require high light output
LED BUSINESS
Continuous eco-friendly, next-generation technology excellence and leadership in light sources in the LED industry
2nd in Global LED Package Market Share in 2012
Source: Strategies Unlimited
BUSINESS OVERVIEW
10.2%
03FH411ALens integrated flash LED which enables high-quality photos to be taken under low-light environments, and features intense light output, high efficacy, and excellent color rendering
01LM561BThe most advanced middle power LED package that is the ideal solution for most LED lighting applications. It features the industry’s highest light efficacy of 160lm/W (65mA, 5000K CCT) and a color rating of over 80 CRI.

Device Solutions
POSSIBILITYOur future is yet to be determined. We can’t assume tomorrow’s promise. We must shape it with our vision and effort. Samsung Electronics proposes the possibility of a positive future for us all.
38
“ You help me to dream and brighten my every possibility. You recognize who I am and understand what I want now and where I want to go next. I think that must be love.”
4.75
4.34
3.66
3.13
2.54
4.20
3.44 3.29 2.93
2.34
40 41
PlanetFirst
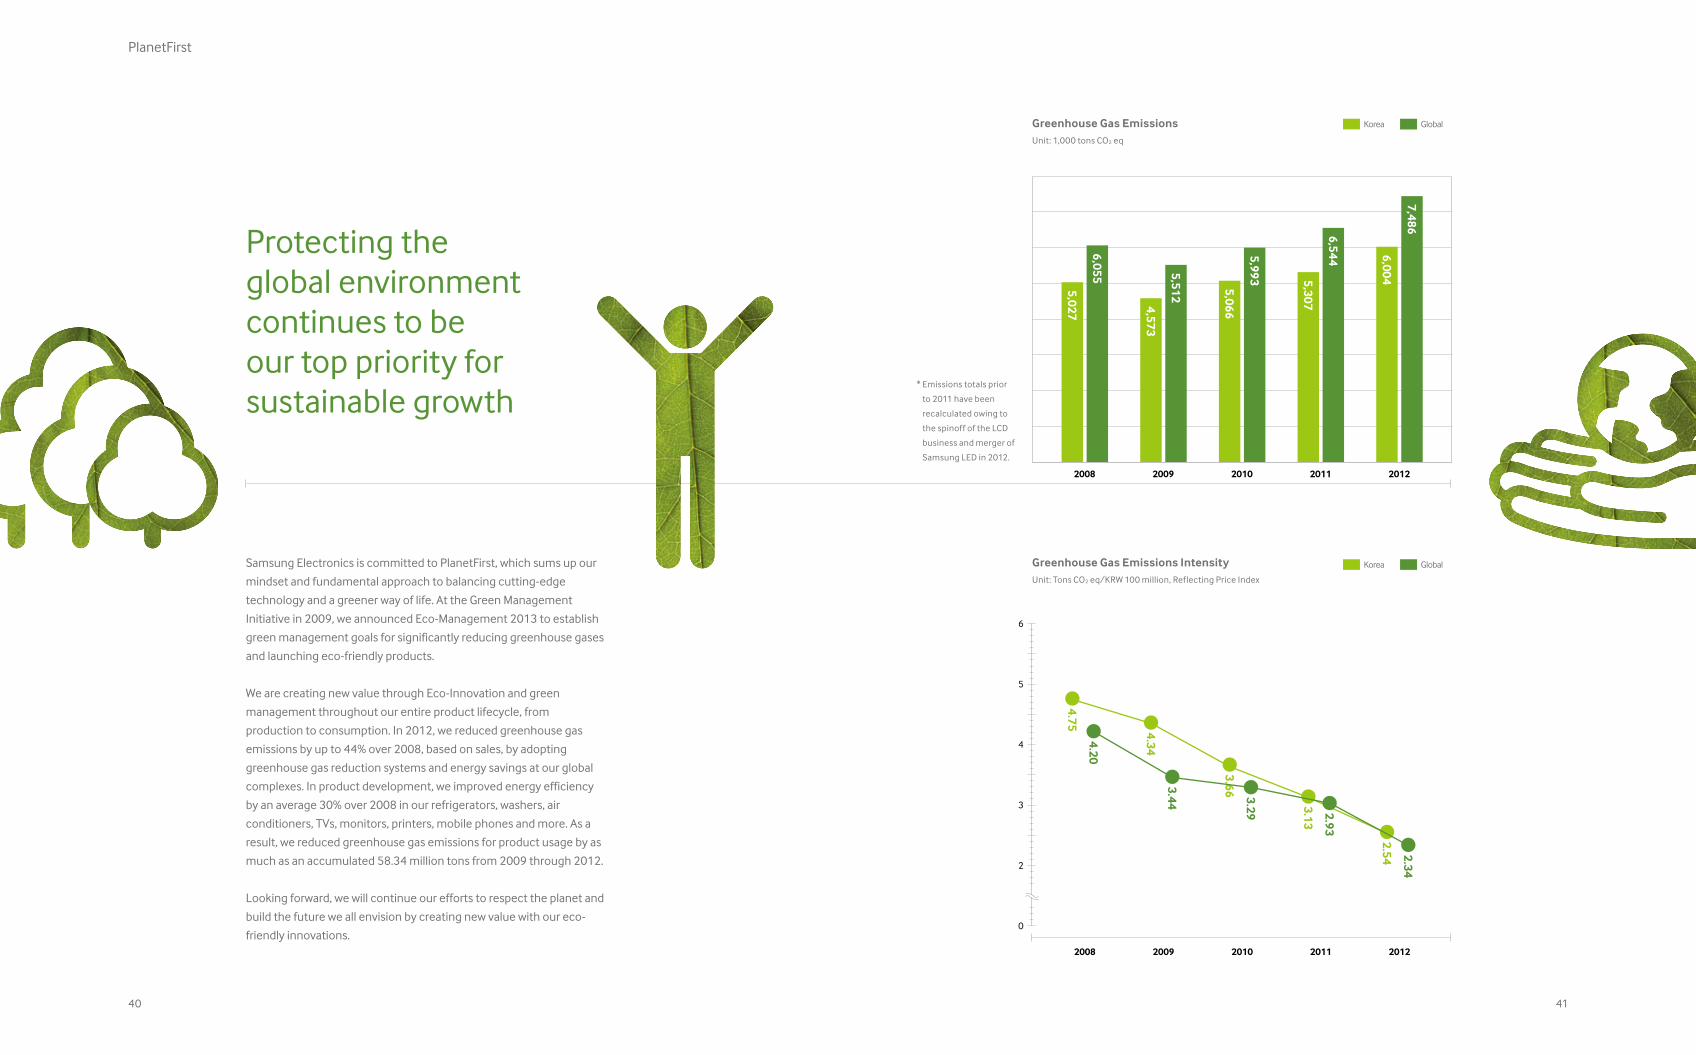
Samsung Electronics is committed to PlanetFirst, which sums up our
mindset and fundamental approach to balancing cutting-edge
technology and a greener way of life. At the Green Management
Initiative in 2009, we announced Eco-Management 2013 to establish
green management goals for significantly reducing greenhouse gases
and launching eco-friendly products.
We are creating new value through Eco-Innovation and green
management throughout our entire product lifecycle, from
production to consumption. In 2012, we reduced greenhouse gas
emissions by up to 44% over 2008, based on sales, by adopting
greenhouse gas reduction systems and energy savings at our global
complexes. In product development, we improved energy efficiency
by an average 30% over 2008 in our refrigerators, washers, air
conditioners, TVs, monitors, printers, mobile phones and more. As a
result, we reduced greenhouse gas emissions for product usage by as
much as an accumulated 58.34 million tons from 2009 through 2012.
Looking forward, we will continue our efforts to respect the planet and
build the future we all envision by creating new value with our eco-
friendly innovations.
Protecting the global environment continues to be our top priority for sustainable growth
Korea Global
4,573
5,066
5,307
5,027
6,055 5,512
5,993
6,544 6,004
7,486
2008 2009 2010 2011 2012
0
2
3
4
5
6
2008 2009 2010 2011 2012
Greenhouse Gas Emissions Intensity Unit: Tons CO2 eq/KRW 100 million, Reflecting Price Index
Greenhouse Gas Emissions Unit: 1,000 tons CO2 eq
Korea Global
* Emissions totals prior
to 2011 have been
recalculated owing to
the spinoff of the LCD
business and merger of
Samsung LED in 2012.
42
We remain thankful and grateful for the innovative
technology that helps us discover and share the joy of
each day. We are unleashing the passion and energy
that generates new possibilities for the future.
That’s how we nurture the next generation.
Samsung Electronics will never cease to take on
challenges -- for all of us here today and for all those
who will come tomorrow.
We are dedicated to creating value that society shares.
By experiencing the rich opportunities of today and the
limitless possibilities of tomorrow, we all become part
of the Samsung Electronics story.
Financial Statements
Report of Independent Auditors
Consolidated Financial Statements
Consolidated Statements of Financial Position
Consolidated Statements of Income
Consolidated Statements of Comprehensive Income
Consolidated Statements of Changes in Equity
Consolidated Statements of Cash Flows
Notes to the Consolidated Financial Statements
44
46
48
48
49
51
52
We have audited the accompanying consolidated financial
statements of Samsung Electronics Co. , Ltd. and its
subsidiaries (collectively referred to as the “Company”), which
comprise the consolidated statements of financial position
as of December 31, 2012, December 31, 2011, and January 1,
2011, the related consolidated statements of income,
comprehensive income, changes in equity and cash flow
for the years ended December 31, 2012 and 2011, and the
related notes. These financial statements are the responsibility
of the Company’s management. Our responsibility is to
express an opinion on these consolidated financial statements
based on our audit. We did not audit the financial statements
of certain subsidiaries, whose financial statements represents
7.2% and 7.6% of the consolidated total assets as of December
31, 2012 and 2011, respectively, and 22.1% and 20.4% of the
consolidated total sales for the year then ended, respectively.
Those financial statements were audited by other auditors
whose reports thereon have been furnished to us, and our
opinion expressed herein, insofar as it relates to the amounts
included for those subsidiaries, is based solely on the reports
of the other auditors.
We conducted our audits in accordance with auditing
standards generally accepted in the Republic of Korea. Those
standards require that we plan and perform the audit to
obtain reasonable assurance about whether the financial
statements are free of material misstatement. An audit
includes examining, on a test basis, evidence supporting
the amounts and disclosures in the financial statements. An
audit also includes assessing the accounting principles used
and significant estimates made by management, as well as
evaluating the overall financial statement presentation. We
believe that our audits and the reports of the other auditors
provide a reasonable basis for our opinion.
In our opinion, based on our audits, the consolidated financial
statements referred to above present fairly, in all material
respects, the financial position of Samsung Electronics Co., Ltd.
and its subsidiaries as of December 31, 2012, December 31,
2011, and January 1, 2011, and their financial performance
and cash flows for the years ended December 31, 2012 and
2011, in accordance with International Financial Reporting
Standards as adopted by the Republic of Korea.
Samil PricewaterhouseCoopers
Seoul, Korea
February 1, 2013
Report of Independent Auditors
This report is effective as of February 1, 2013, the audit report date. Certain subsequent events or circumstances, which may occur between the audit report date
and the time of reading this report, could have a material impact on the accompanying financial statements and notes thereto. Accordingly, the readers of the
audit report should understand that there is a possibility that the above audit report may have to be revised to reflect the impact of such subsequent events or
circumstances, if any.
FINANCIAL STATEMENTS
To the Board of Directors and
Shareholders of
Samsung Electronics Co., Ltd.
4544
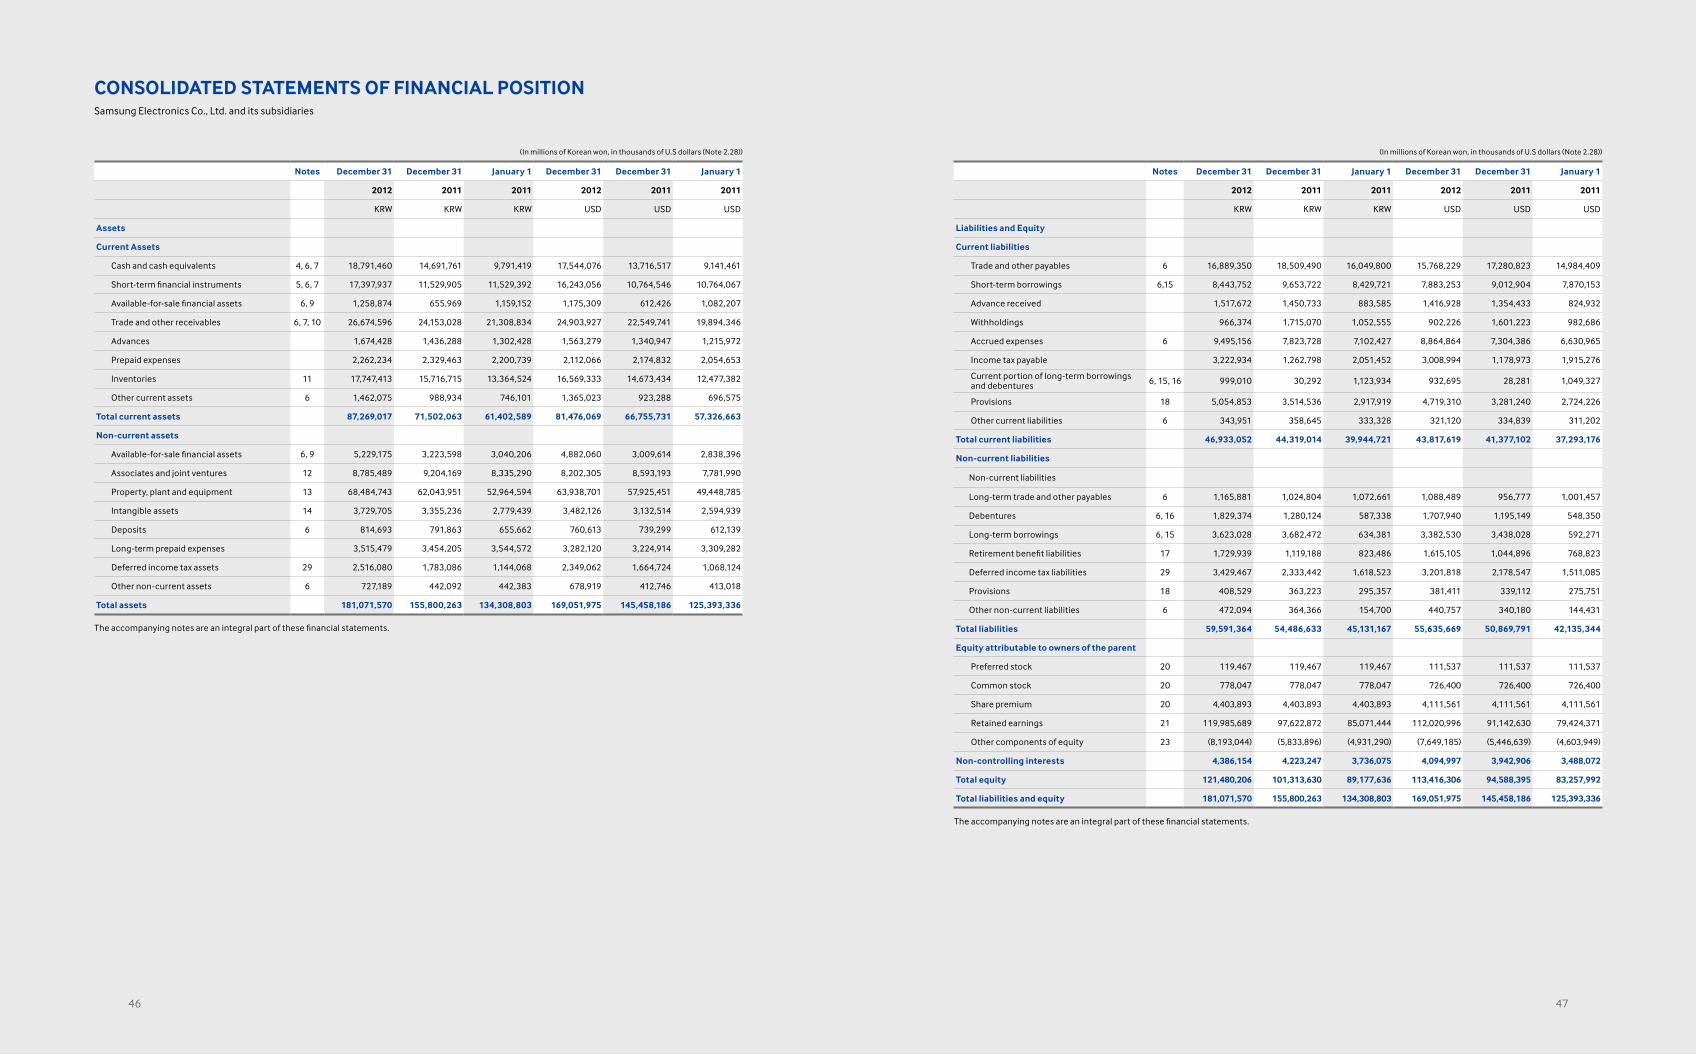
CONSOLIDATED STATEMENTS OF FINANCIAL POSITION Samsung Electronics Co., Ltd. and its subsidiaries
(In millions of Korean won, in thousands of U.S dollars (Note 2.28))
Notes December 31 December 31 January 1 December 31 December 31 January 1
2012 2011 2011 2012 2011 2011
KRW KRW KRW USD USD USD
Assets
Current Assets
Cash and cash equivalents 4, 6, 7 18,791,460 14,691,761 9,791,419 17,544,076 13,716,517 9,141,461
Short-term financial instruments 5, 6, 7 17,397,937 11,529,905 11,529,392 16,243,056 10,764,546 10,764,067
Available-for-sale financial assets 6, 9 1,258,874 655,969 1,159,152 1,175,309 612,426 1,082,207
Trade and other receivables 6, 7, 10 26,674,596 24,153,028 21,308,834 24,903,927 22,549,741 19,894,346
Advances 1,674,428 1,436,288 1,302,428 1,563,279 1,340,947 1,215,972
Prepaid expenses 2,262,234 2,329,463 2,200,739 2,112,066 2,174,832 2,054,653
Inventories 11 17,747,413 15,716,715 13,364,524 16,569,333 14,673,434 12,477,382
Other current assets 6 1,462,075 988,934 746,101 1,365,023 923,288 696,575
Total current assets 87,269,017 71,502,063 61,402,589 81,476,069 66,755,731 57,326,663
Non-current assets
Available-for-sale financial assets 6, 9 5,229,175 3,223,598 3,040,206 4,882,060 3,009,614 2,838,396
Associates and joint ventures 12 8,785,489 9,204,169 8,335,290 8,202,305 8,593,193 7,781,990
Property, plant and equipment 13 68,484,743 62,043,951 52,964,594 63,938,701 57,925,451 49,448,785
Intangible assets 14 3,729,705 3,355,236 2,779,439 3,482,126 3,132,514 2,594,939
Deposits 6 814,693 791,863 655,662 760,613 739,299 612,139
Long-term prepaid expenses 3,515,479 3,454,205 3,544,572 3,282,120 3,224,914 3,309,282
Deferred income tax assets 29 2,516,080 1,783,086 1,144,068 2,349,062 1,664,724 1,068,124
Other non-current assets 6 727,189 442,092 442,383 678,919 412,746 413,018
Total assets 181,071,570 155,800,263 134,308,803 169,051,975 145,458,186 125,393,336
The accompanying notes are an integral part of these financial statements.
(In millions of Korean won, in thousands of U.S dollars (Note 2.28))
Notes December 31 December 31 January 1 December 31 December 31 January 1
2012 2011 2011 2012 2011 2011
KRW KRW KRW USD USD USD
Liabilities and Equity
Current liabilities
Trade and other payables 6 16,889,350 18,509,490 16,049,800 15,768,229 17,280,823 14,984,409
Short-term borrowings 6,15 8,443,752 9,653,722 8,429,721 7,883,253 9,012,904 7,870,153
Advance received 1,517,672 1,450,733 883,585 1,416,928 1,354,433 824,932
Withholdings 966,374 1,715,070 1,052,555 902,226 1,601,223 982,686
Accrued expenses 6 9,495,156 7,823,728 7,102,427 8,864,864 7,304,386 6,630,965
Income tax payable 3,222,934 1,262,798 2,051,452 3,008,994 1,178,973 1,915,276
Current portion of long-term borrowings and debentures 6, 15, 16 999,010 30,292 1,123,934 932,695 28,281 1,049,327
Provisions 18 5,054,853 3,514,536 2,917,919 4,719,310 3,281,240 2,724,226
Other current liabilities 6 343,951 358,645 333,328 321,120 334,839 311,202
Total current liabilities 46,933,052 44,319,014 39,944,721 43,817,619 41,377,102 37,293,176
Non-current liabilities
Non-current liabilities
Long-term trade and other payables 6 1,165,881 1,024,804 1,072,661 1,088,489 956,777 1,001,457
Debentures 6, 16 1,829,374 1,280,124 587,338 1,707,940 1,195,149 548,350
Long-term borrowings 6, 15 3,623,028 3,682,472 634,381 3,382,530 3,438,028 592,271
Retirement benefit liabilities 17 1,729,939 1,119,188 823,486 1,615,105 1,044,896 768,823
Deferred income tax liabilities 29 3,429,467 2,333,442 1,618,523 3,201,818 2,178,547 1,511,085
Provisions 18 408,529 363,223 295,357 381,411 339,112 275,751
Other non-current liabilities 6 472,094 364,366 154,700 440,757 340,180 144,431
Total liabilities 59,591,364 54,486,633 45,131,167 55,635,669 50,869,791 42,135,344
Equity attributable to owners of the parent
Preferred stock 20 119,467 119,467 119,467 111,537 111,537 111,537
Common stock 20 778,047 778,047 778,047 726,400 726,400 726,400
Share premium 20 4,403,893 4,403,893 4,403,893 4,111,561 4,111,561 4,111,561
Retained earnings 21 119,985,689 97,622,872 85,071,444 112,020,996 91,142,630 79,424,371
Other components of equity 23 (8,193,044) (5,833,896) (4,931,290) (7,649,185) (5,446,639) (4,603,949)
Non-controlling interests 4,386,154 4,223,247 3,736,075 4,094,997 3,942,906 3,488,072
Total equity 121,480,206 101,313,630 89,177,636 113,416,306 94,588,395 83,257,992
Total liabilities and equity 181,071,570 155,800,263 134,308,803 169,051,975 145,458,186 125,393,336
The accompanying notes are an integral part of these financial statements.
4746
(In millions of Korean won, in thousands of U.S dollars (Note 2.28))
For the year ended December 31,
Notes 2012 2011 2012 2011
KRW KRW USD USD
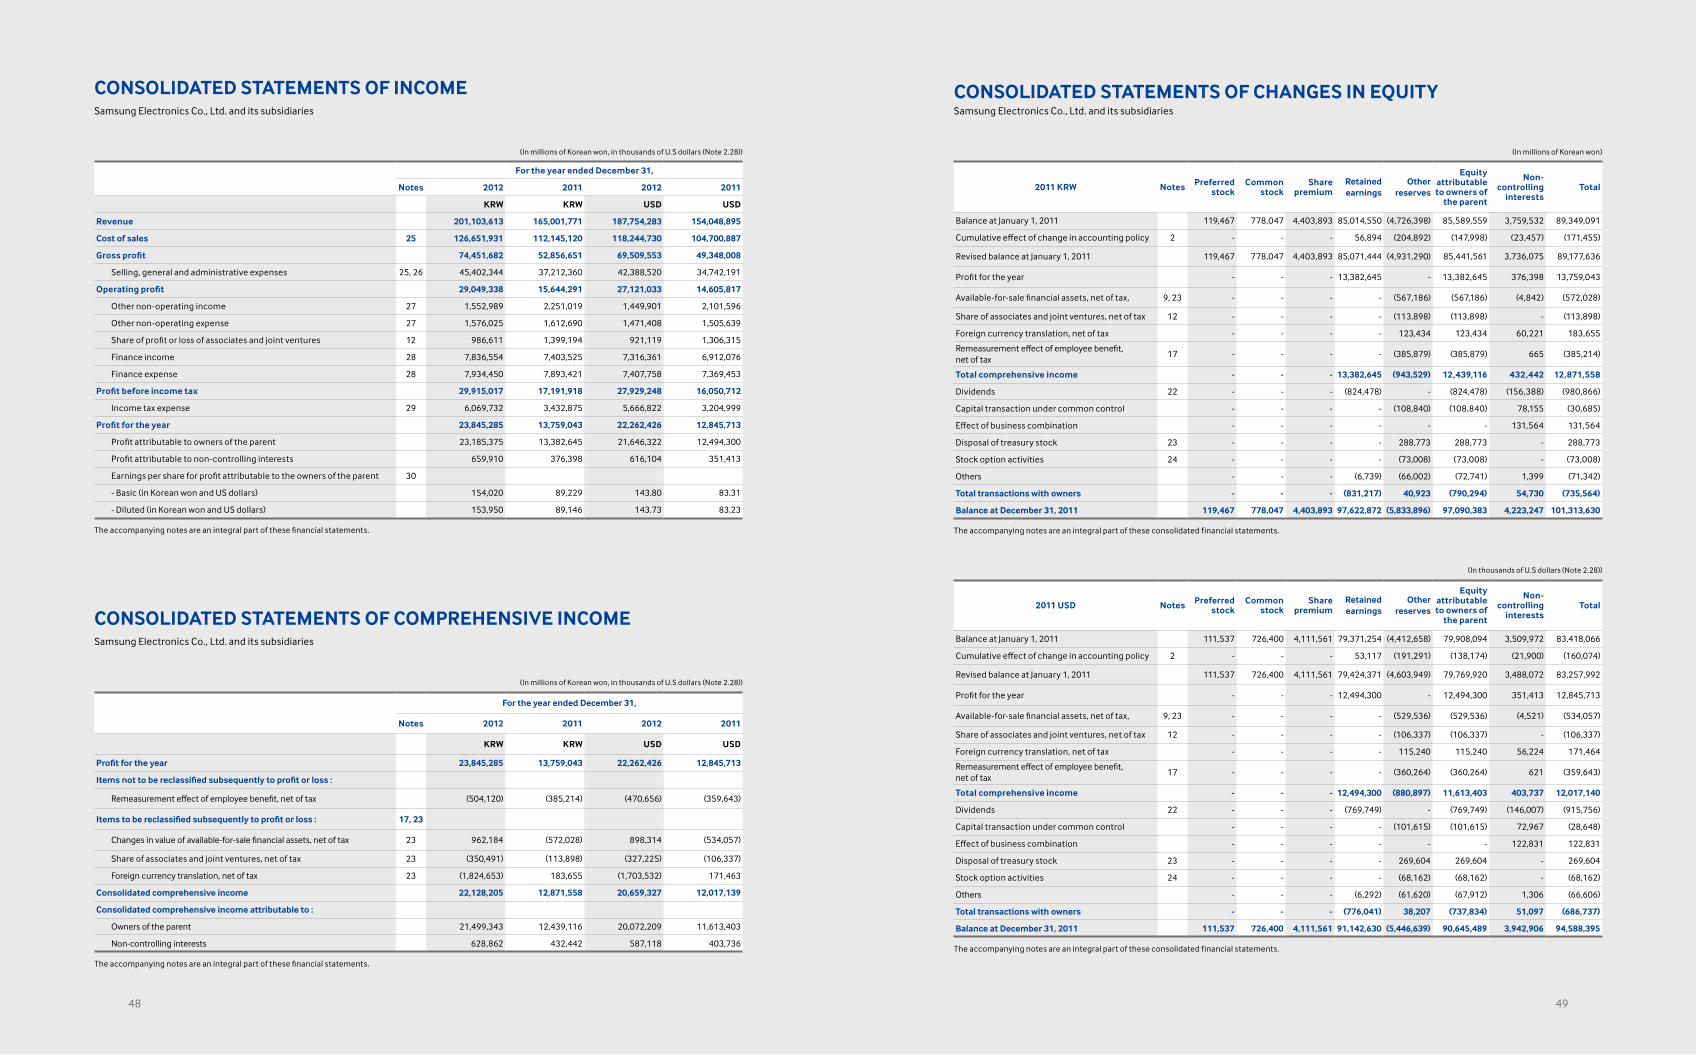
Revenue 201,103,613 165,001,771 187,754,283 154,048,895
Cost of sales 25 126,651,931 112,145,120 118,244,730 104,700,887
Gross profit 74,451,682 52,856,651 69,509,553 49,348,008
Selling, general and administrative expenses 25, 26 45,402,344 37,212,360 42,388,520 34,742,191
Operating profit 29,049,338 15,644,291 27,121,033 14,605,817
Other non-operating income 27 1,552,989 2,251,019 1,449,901 2,101,596
Other non-operating expense 27 1,576,025 1,612,690 1,471,408 1,505,639
Share of profit or loss of associates and joint ventures 12 986,611 1,399,194 921,119 1,306,315
Finance income 28 7,836,554 7,403,525 7,316,361 6,912,076
Finance expense 28 7,934,450 7,893,421 7,407,758 7,369,453
Profit before income tax 29,915,017 17,191,918 27,929,248 16,050,712
Income tax expense 29 6,069,732 3,432,875 5,666,822 3,204,999
Profit for the year 23,845,285 13,759,043 22,262,426 12,845,713
Profit attributable to owners of the parent 23,185,375 13,382,645 21,646,322 12,494,300
Profit attributable to non-controlling interests 659,910 376,398 616,104 351,413
Earnings per share for profit attributable to the owners of the parent 30
- Basic (in Korean won and US dollars) 154,020 89,229 143.80 83.31
- Diluted (in Korean won and US dollars) 153,950 89,146 143.73 83.23
The accompanying notes are an integral part of these financial statements.
CONSOLIDATED STATEMENTS OF INCOME Samsung Electronics Co., Ltd. and its subsidiaries
(In millions of Korean won, in thousands of U.S dollars (Note 2.28))
For the year ended December 31,
Notes 2012 2011 2012 2011
KRW KRW USD USD
Profit for the year 23,845,285 13,759,043 22,262,426 12,845,713
Items not to be reclassified subsequently to profit or loss :
Remeasurement effect of employee benefit, net of tax (504,120) (385,214) (470,656) (359,643)
Items to be reclassified subsequently to profit or loss : 17, 23
Changes in value of available-for-sale financial assets, net of tax 23 962,184 (572,028) 898,314 (534,057)
Share of associates and joint ventures, net of tax 23 (350,491) (113,898) (327,225) (106,337)
Foreign currency translation, net of tax 23 (1,824,653) 183,655 (1,703,532) 171,463
Consolidated comprehensive income 22,128,205 12,871,558 20,659,327 12,017,139
Consolidated comprehensive income attributable to :
Owners of the parent 21,499,343 12,439,116 20,072,209 11,613,403
Non-controlling interests 628,862 432,442 587,118 403,736
The accompanying notes are an integral part of these financial statements.
CONSOLIDATED STATEMENTS OF COMPREHENSIVE INCOME Samsung Electronics Co., Ltd. and its subsidiaries
4948
CONSOLIDATED STATEMENTS OF CHANGES IN EQUITYSamsung Electronics Co., Ltd. and its subsidiaries
(In millions of Korean won)
2011 KRW Notes Preferredstock
Commonstock
Sharepremium
Retainedearnings
Otherreserves
Equityattributableto owners of
the parent
Non- controlling
interestsTotal
Balance at January 1, 2011 119,467 778,047 4,403,893 85,014,550 (4,726,398) 85,589,559 3,759,532 89,349,091
Cumulative effect of change in accounting policy 2 - - - 56,894 (204,892) (147,998) (23,457) (171,455)
Revised balance at January 1, 2011 119,467 778,047 4,403,893 85,071,444 (4,931,290) 85,441,561 3,736,075 89,177,636
Profit for the year - - - 13,382,645 - 13,382,645 376,398 13,759,043
Available-for-sale financial assets, net of tax, 9, 23 - - - - (567,186) (567,186) (4,842) (572,028)
Share of associates and joint ventures, net of tax 12 - - - - (113,898) (113,898) - (113,898)
Foreign currency translation, net of tax - - - - 123,434 123,434 60,221 183,655
Remeasurement effect of employee benefit, net of tax
17 - - - - (385,879) (385,879) 665 (385,214)
Total comprehensive income - - - 13,382,645 (943,529) 12,439,116 432,442 12,871,558
Dividends 22 - - - (824,478) - (824,478) (156,388) (980,866)
Capital transaction under common control - - - - (108,840) (108,840) 78,155 (30,685)
Effect of business combination - - - - - - 131,564 131,564
Disposal of treasury stock 23 - - - - 288,773 288,773 - 288,773
Stock option activities 24 - - - - (73,008) (73,008) - (73,008)
Others - - - (6,739) (66,002) (72,741) 1,399 (71,342)
Total transactions with owners - - - (831,217) 40,923 (790,294) 54,730 (735,564)
Balance at December 31, 2011 119,467 778,047 4,403,893 97,622,872 (5,833,896) 97,090,383 4,223,247 101,313,630
The accompanying notes are an integral part of these consolidated financial statements.
(In thousands of U.S dollars (Note 2.28))
2011 USD Notes Preferredstock
Commonstock
Sharepremium
Retainedearnings
Otherreserves
Equityattributableto owners of
the parent
Non- controlling
interestsTotal
Balance at January 1, 2011 111,537 726,400 4,111,561 79,371,254 (4,412,658) 79,908,094 3,509,972 83,418,066
Cumulative effect of change in accounting policy 2 - - - 53,117 (191,291) (138,174) (21,900) (160,074)
Revised balance at January 1, 2011 111,537 726,400 4,111,561 79,424,371 (4,603,949) 79,769,920 3,488,072 83,257,992
Profit for the year - - - 12,494,300 - 12,494,300 351,413 12,845,713
Available-for-sale financial assets, net of tax, 9, 23 - - - - (529,536) (529,536) (4,521) (534,057)
Share of associates and joint ventures, net of tax 12 - - - - (106,337) (106,337) - (106,337)
Foreign currency translation, net of tax - - - - 115,240 115,240 56,224 171,464
Remeasurement effect of employee benefit, net of tax
17 - - - - (360,264) (360,264) 621 (359,643)
Total comprehensive income - - - 12,494,300 (880,897) 11,613,403 403,737 12,017,140
Dividends 22 - - - (769,749) - (769,749) (146,007) (915,756)
Capital transaction under common control - - - - (101,615) (101,615) 72,967 (28,648)
Effect of business combination - - - - - - 122,831 122,831
Disposal of treasury stock 23 - - - - 269,604 269,604 - 269,604
Stock option activities 24 - - - - (68,162) (68,162) - (68,162)
Others - - - (6,292) (61,620) (67,912) 1,306 (66,606)
Total transactions with owners - - - (776,041) 38,207 (737,834) 51,097 (686,737)
Balance at December 31, 2011 111,537 726,400 4,111,561 91,142,630 (5,446,639) 90,645,489 3,942,906 94,588,395
The accompanying notes are an integral part of these consolidated financial statements.
5150
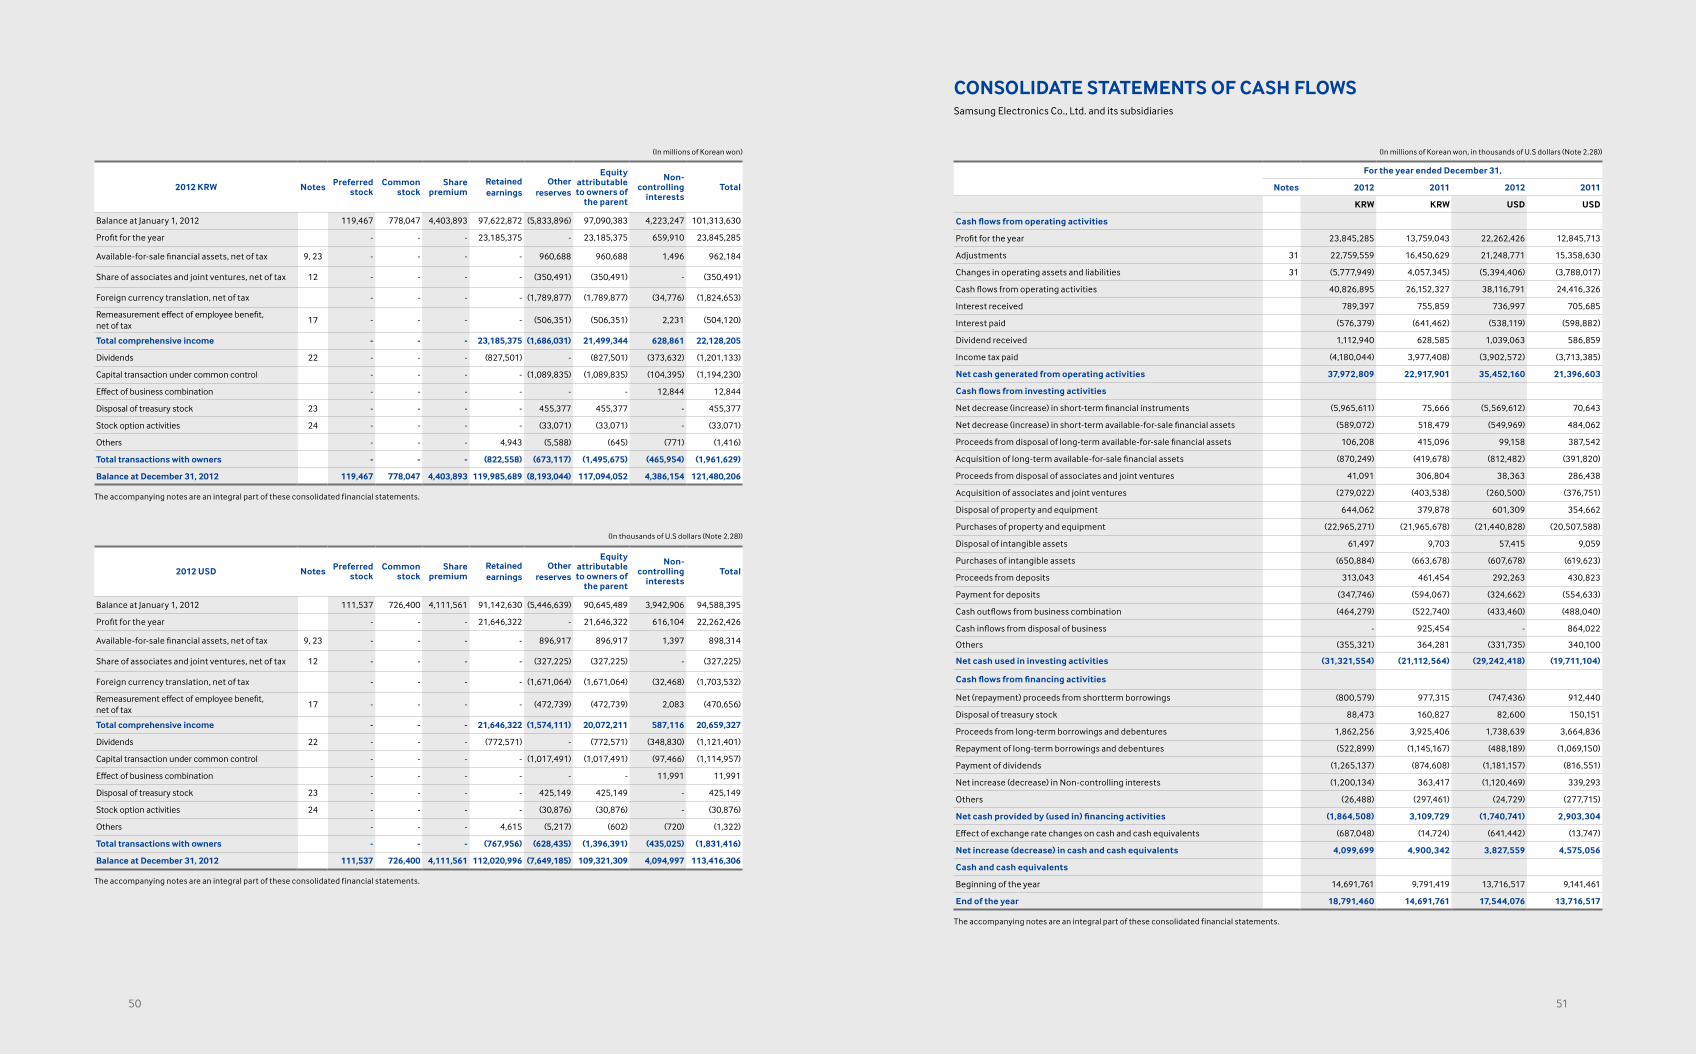
CONSOLIDATE STATEMENTS OF CASH FLOWS Samsung Electronics Co., Ltd. and its subsidiaries
(In millions of Korean won, in thousands of U.S dollars (Note 2.28))
For the year ended December 31,
Notes 2012 2011 2012 2011
KRW KRW USD USD
Cash flows from operating activities
Profit for the year 23,845,285 13,759,043 22,262,426 12,845,713
Adjustments 31 22,759,559 16,450,629 21,248,771 15,358,630
Changes in operating assets and liabilities 31 (5,777,949) 4,057,345) (5,394,406) (3,788,017)
Cash flows from operating activities 40,826,895 26,152,327 38,116,791 24,416,326
Interest received 789,397 755,859 736,997 705,685
Interest paid (576,379) (641,462) (538,119) (598,882)
Dividend received 1,112,940 628,585 1,039,063 586,859
Income tax paid (4,180,044) 3,977,408) (3,902,572) (3,713,385)
Net cash generated from operating activities 37,972,809 22,917,901 35,452,160 21,396,603
Cash flows from investing activities
Net decrease (increase) in short-term financial instruments (5,965,611) 75,666 (5,569,612) 70,643
Net decrease (increase) in short-term available-for-sale financial assets (589,072) 518,479 (549,969) 484,062
Proceeds from disposal of long-term available-for-sale financial assets 106,208 415,096 99,158 387,542
Acquisition of long-term available-for-sale financial assets (870,249) (419,678) (812,482) (391,820)
Proceeds from disposal of associates and joint ventures 41,091 306,804 38,363 286,438
Acquisition of associates and joint ventures (279,022) (403,538) (260,500) (376,751)
Disposal of property and equipment 644,062 379,878 601,309 354,662
Purchases of property and equipment (22,965,271) (21,965,678) (21,440,828) (20,507,588)
Disposal of intangible assets 61,497 9,703 57,415 9,059
Purchases of intangible assets (650,884) (663,678) (607,678) (619,623)
Proceeds from deposits 313,043 461,454 292,263 430,823
Payment for deposits (347,746) (594,067) (324,662) (554,633)
Cash outflows from business combination (464,279) (522,740) (433,460) (488,040)
Cash inflows from disposal of business - 925,454 - 864,022
Others (355,321) 364,281 (331,735) 340,100
Net cash used in investing activities (31,321,554) (21,112,564) (29,242,418) (19,711,104)
Cash flows from financing activities
Net (repayment) proceeds from shortterm borrowings (800,579) 977,315 (747,436) 912,440
Disposal of treasury stock 88,473 160,827 82,600 150,151
Proceeds from long-term borrowings and debentures 1,862,256 3,925,406 1,738,639 3,664,836
Repayment of long-term borrowings and debentures (522,899) (1,145,167) (488,189) (1,069,150)
Payment of dividends (1,265,137) (874,608) (1,181,157) (816,551)
Net increase (decrease) in Non-controlling interests (1,200,134) 363,417 (1,120,469) 339,293
Others (26,488) (297,461) (24,729) (277,715)
Net cash provided by (used in) financing activities (1,864,508) 3,109,729 (1,740,741) 2,903,304
Effect of exchange rate changes on cash and cash equivalents (687,048) (14,724) (641,442) (13,747)
Net increase (decrease) in cash and cash equivalents 4,099,699 4,900,342 3,827,559 4,575,056
Cash and cash equivalents
Beginning of the year 14,691,761 9,791,419 13,716,517 9,141,461
End of the year 18,791,460 14,691,761 17,544,076 13,716,517
The accompanying notes are an integral part of these consolidated financial statements.
(In millions of Korean won)
2012 KRW Notes Preferredstock
Commonstock
Sharepremium
Retainedearnings
Otherreserves
Equityattributableto owners of
the parent
Non- controlling
interestsTotal
Balance at January 1, 2012 119,467 778,047 4,403,893 97,622,872 (5,833,896) 97,090,383 4,223,247 101,313,630
Profit for the year - - - 23,185,375 - 23,185,375 659,910 23,845,285
Available-for-sale financial assets, net of tax 9, 23 - - - - 960,688 960,688 1,496 962,184
Share of associates and joint ventures, net of tax 12 - - - - (350,491) (350,491) - (350,491)
Foreign currency translation, net of tax - - - - (1,789,877) (1,789,877) (34,776) (1,824,653)
Remeasurement effect of employee benefit, net of tax
17 - - - - (506,351) (506,351) 2,231 (504,120)
Total comprehensive income - - - 23,185,375 (1,686,031) 21,499,344 628,861 22,128,205
Dividends 22 - - - (827,501) - (827,501) (373,632) (1,201,133)
Capital transaction under common control - - - - (1,089,835) (1,089,835) (104,395) (1,194,230)
Effect of business combination - - - - - - 12,844 12,844
Disposal of treasury stock 23 - - - - 455,377 455,377 - 455,377
Stock option activities 24 - - - - (33,071) (33,071) - (33,071)
Others - - - 4,943 (5,588) (645) (771) (1,416)
Total transactions with owners - - - (822,558) (673,117) (1,495,675) (465,954) (1,961,629)
Balance at December 31, 2012 119,467 778,047 4,403,893 119,985,689 (8,193,044) 117,094,052 4,386,154 121,480,206
The accompanying notes are an integral part of these consolidated financial statements.
(In thousands of U.S dollars (Note 2.28))
2012 USD Notes Preferredstock
Commonstock
Sharepremium
Retainedearnings
Otherreserves
Equityattributableto owners of
the parent
Non- controlling
interestsTotal
Balance at January 1, 2012 111,537 726,400 4,111,561 91,142,630 (5,446,639) 90,645,489 3,942,906 94,588,395
Profit for the year - - - 21,646,322 - 21,646,322 616,104 22,262,426
Available-for-sale financial assets, net of tax 9, 23 - - - - 896,917 896,917 1,397 898,314
Share of associates and joint ventures, net of tax 12 - - - - (327,225) (327,225) - (327,225)
Foreign currency translation, net of tax - - - - (1,671,064) (1,671,064) (32,468) (1,703,532)
Remeasurement effect of employee benefit, net of tax
17 - - - - (472,739) (472,739) 2,083 (470,656)
Total comprehensive income - - - 21,646,322 (1,574,111) 20,072,211 587,116 20,659,327
Dividends 22 - - - (772,571) - (772,571) (348,830) (1,121,401)
Capital transaction under common control - - - - (1,017,491) (1,017,491) (97,466) (1,114,957)
Effect of business combination - - - - - - 11,991 11,991
Disposal of treasury stock 23 - - - - 425,149 425,149 - 425,149
Stock option activities 24 - - - - (30,876) (30,876) - (30,876)
Others - - - 4,615 (5,217) (602) (720) (1,322)
Total transactions with owners - - - (767,956) (628,435) (1,396,391) (435,025) (1,831,416)
Balance at December 31, 2012 111,537 726,400 4,111,561 112,020,996 (7,649,185) 109,321,309 4,094,997 113,416,306
The accompanying notes are an integral part of these consolidated financial statements.
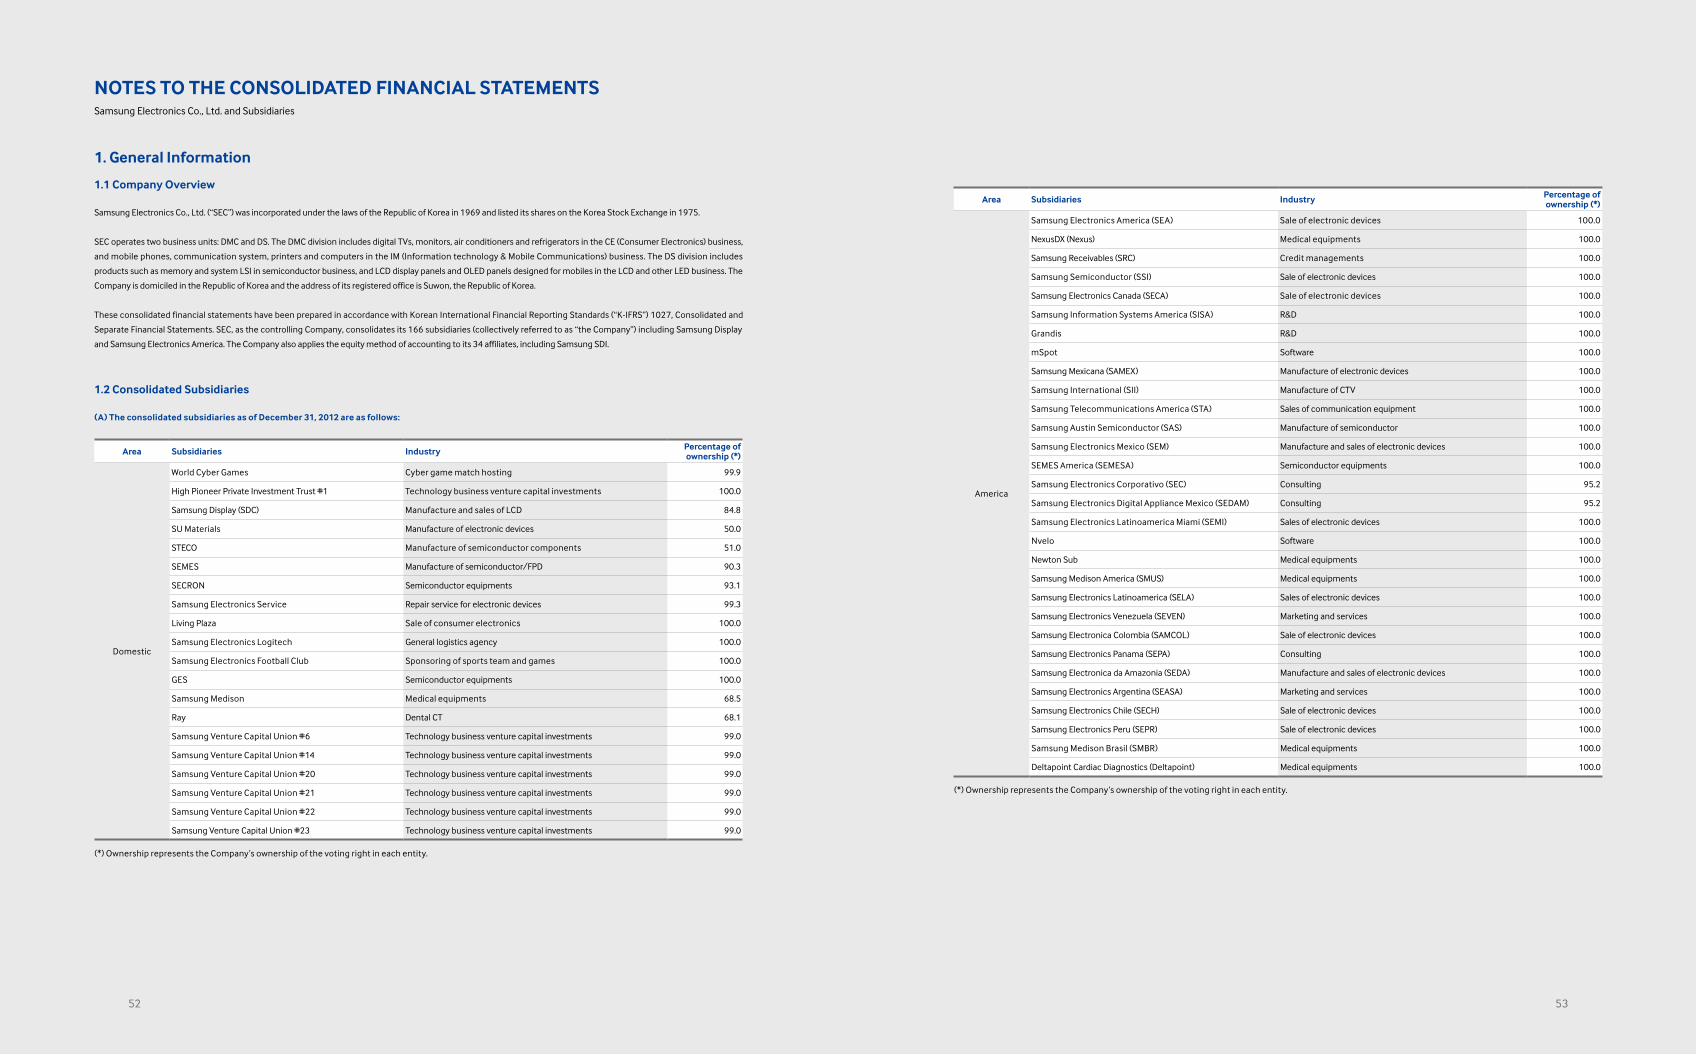
1. General Information
1.1 Company Overview
Samsung Electronics Co., Ltd. (“SEC”) was incorporated under the laws of the Republic of Korea in 1969 and listed its shares on the Korea Stock Exchange in 1975.
SEC operates two business units: DMC and DS. The DMC division includes digital TVs, monitors, air conditioners and refrigerators in the CE (Consumer Electronics) business,
and mobile phones, communication system, printers and computers in the IM (Information technology & Mobile Communications) business. The DS division includes
products such as memory and system LSI in semiconductor business, and LCD display panels and OLED panels designed for mobiles in the LCD and other LED business. The
Company is domiciled in the Republic of Korea and the address of its registered office is Suwon, the Republic of Korea.
These consolidated financial statements have been prepared in accordance with Korean International Financial Reporting Standards (“K-IFRS”) 1027, Consolidated and
Separate Financial Statements. SEC, as the controlling Company, consolidates its 166 subsidiaries (collectively referred to as “the Company”) including Samsung Display
and Samsung Electronics America. The Company also applies the equity method of accounting to its 34 affiliates, including Samsung SDI.
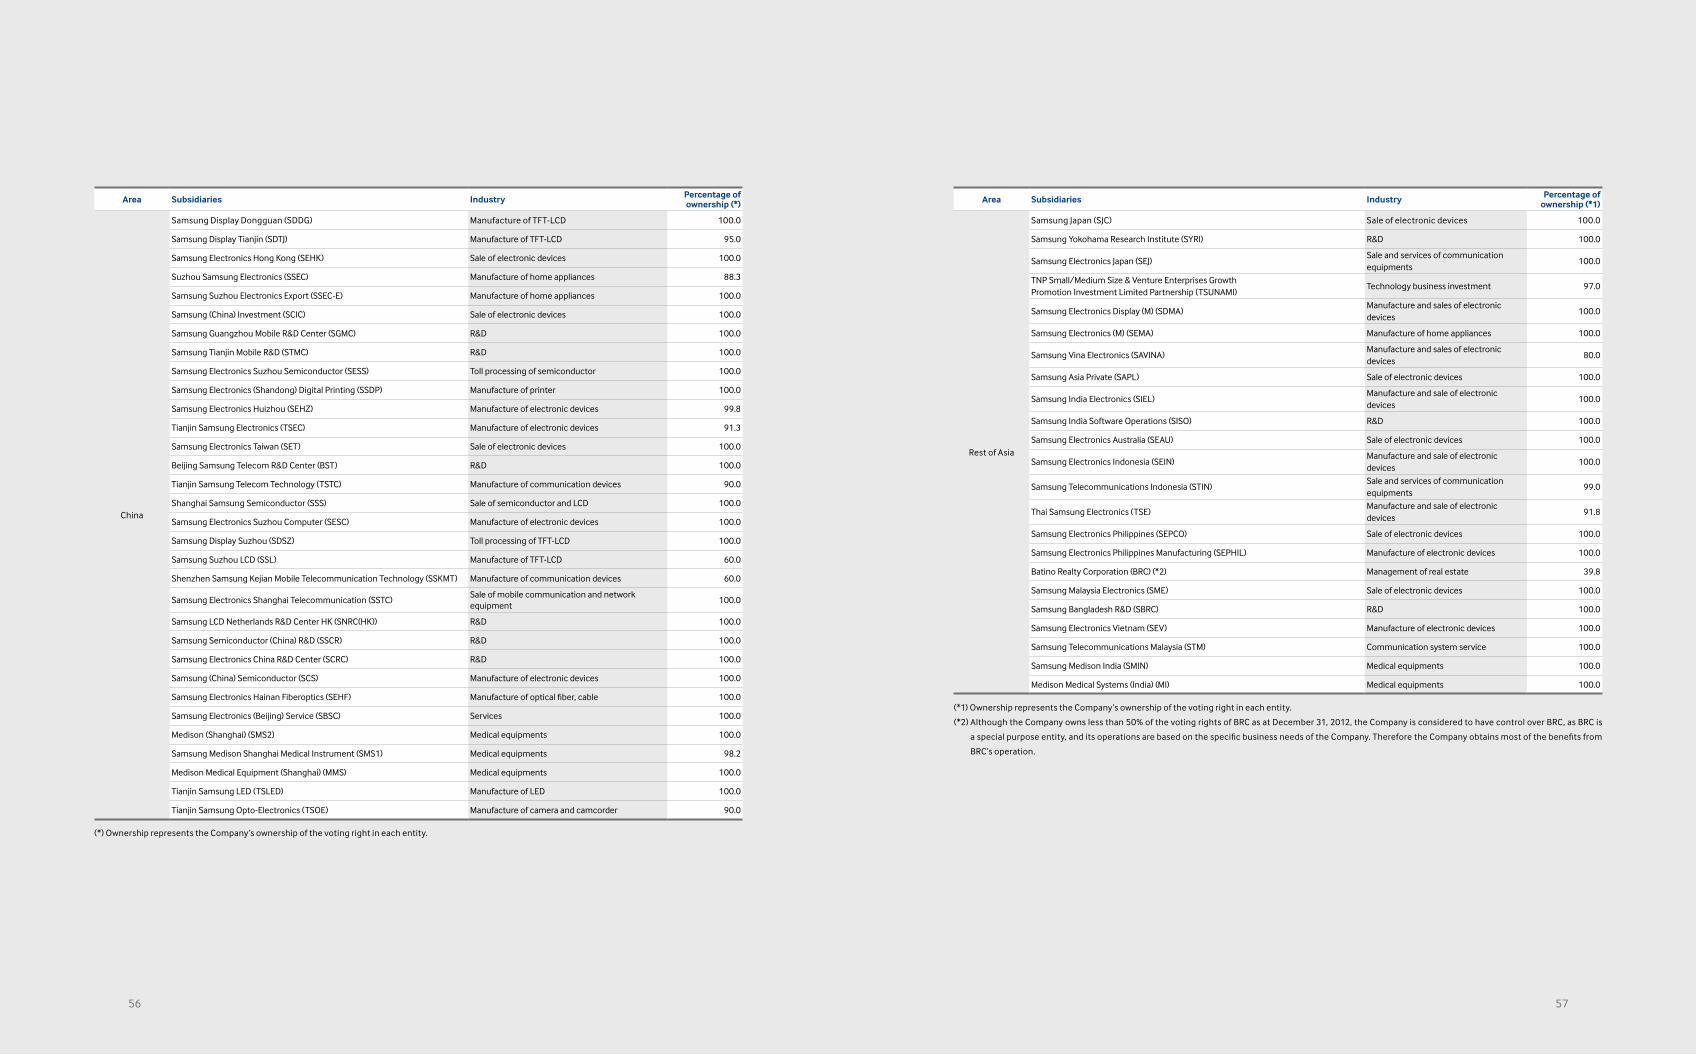
1.2 Consolidated Subsidiaries
(A) The consolidated subsidiaries as of December 31, 2012 are as follows:
Area Subsidiaries Industry Percentage ofownership (*)
Domestic
World Cyber Games Cyber game match hosting 99.9
High Pioneer Private Investment Trust #1 Technology business venture capital investments 100.0
Samsung Display (SDC) Manufacture and sales of LCD 84.8
SU Materials Manufacture of electronic devices 50.0
STECO Manufacture of semiconductor components 51.0
SEMES Manufacture of semiconductor/FPD 90.3
SECRON Semiconductor equipments 93.1
Samsung Electronics Service Repair service for electronic devices 99.3
Living Plaza Sale of consumer electronics 100.0
Samsung Electronics Logitech General logistics agency 100.0
Samsung Electronics Football Club Sponsoring of sports team and games 100.0
GES Semiconductor equipments 100.0
Samsung Medison Medical equipments 68.5
Ray Dental CT 68.1
Samsung Venture Capital Union #6 Technology business venture capital investments 99.0
Samsung Venture Capital Union #14 Technology business venture capital investments 99.0
Samsung Venture Capital Union #20 Technology business venture capital investments 99.0
Samsung Venture Capital Union #21 Technology business venture capital investments 99.0
Samsung Venture Capital Union #22 Technology business venture capital investments 99.0
Samsung Venture Capital Union #23 Technology business venture capital investments 99.0
(*) Ownership represents the Company’s ownership of the voting right in each entity.
Area Subsidiaries Industry Percentage ofownership (*)
America
Samsung Electronics America (SEA) Sale of electronic devices 100.0
NexusDX (Nexus) Medical equipments 100.0
Samsung Receivables (SRC) Credit managements 100.0
Samsung Semiconductor (SSI) Sale of electronic devices 100.0
Samsung Electronics Canada (SECA) Sale of electronic devices 100.0
Samsung Information Systems America (SISA) R&D 100.0
Grandis R&D 100.0
mSpot Software 100.0
Samsung Mexicana (SAMEX) Manufacture of electronic devices 100.0
Samsung International (SII) Manufacture of CTV 100.0
Samsung Telecommunications America (STA) Sales of communication equipment 100.0
Samsung Austin Semiconductor (SAS) Manufacture of semiconductor 100.0
Samsung Electronics Mexico (SEM) Manufacture and sales of electronic devices 100.0
SEMES America (SEMESA) Semiconductor equipments 100.0
Samsung Electronics Corporativo (SEC) Consulting 95.2
Samsung Electronics Digital Appliance Mexico (SEDAM) Consulting 95.2
Samsung Electronics Latinoamerica Miami (SEMI) Sales of electronic devices 100.0
Nvelo Software 100.0
Newton Sub Medical equipments 100.0
Samsung Medison America (SMUS) Medical equipments 100.0
Samsung Electronics Latinoamerica (SELA) Sales of electronic devices 100.0
Samsung Electronics Venezuela (SEVEN) Marketing and services 100.0
Samsung Electronica Colombia (SAMCOL) Sale of electronic devices 100.0
Samsung Electronics Panama (SEPA) Consulting 100.0
Samsung Electronica da Amazonia (SEDA) Manufacture and sales of electronic devices 100.0
Samsung Electronics Argentina (SEASA) Marketing and services 100.0
Samsung Electronics Chile (SECH) Sale of electronic devices 100.0
Samsung Electronics Peru (SEPR) Sale of electronic devices 100.0
Samsung Medison Brasil (SMBR) Medical equipments 100.0
Deltapoint Cardiac Diagnostics (Deltapoint) Medical equipments 100.0
(*) Ownership represents the Company’s ownership of the voting right in each entity.
NOTES TO THE CONSOLIDATED FINANCIAL STATEMENTS Samsung Electronics Co., Ltd. and Subsidiaries
5352
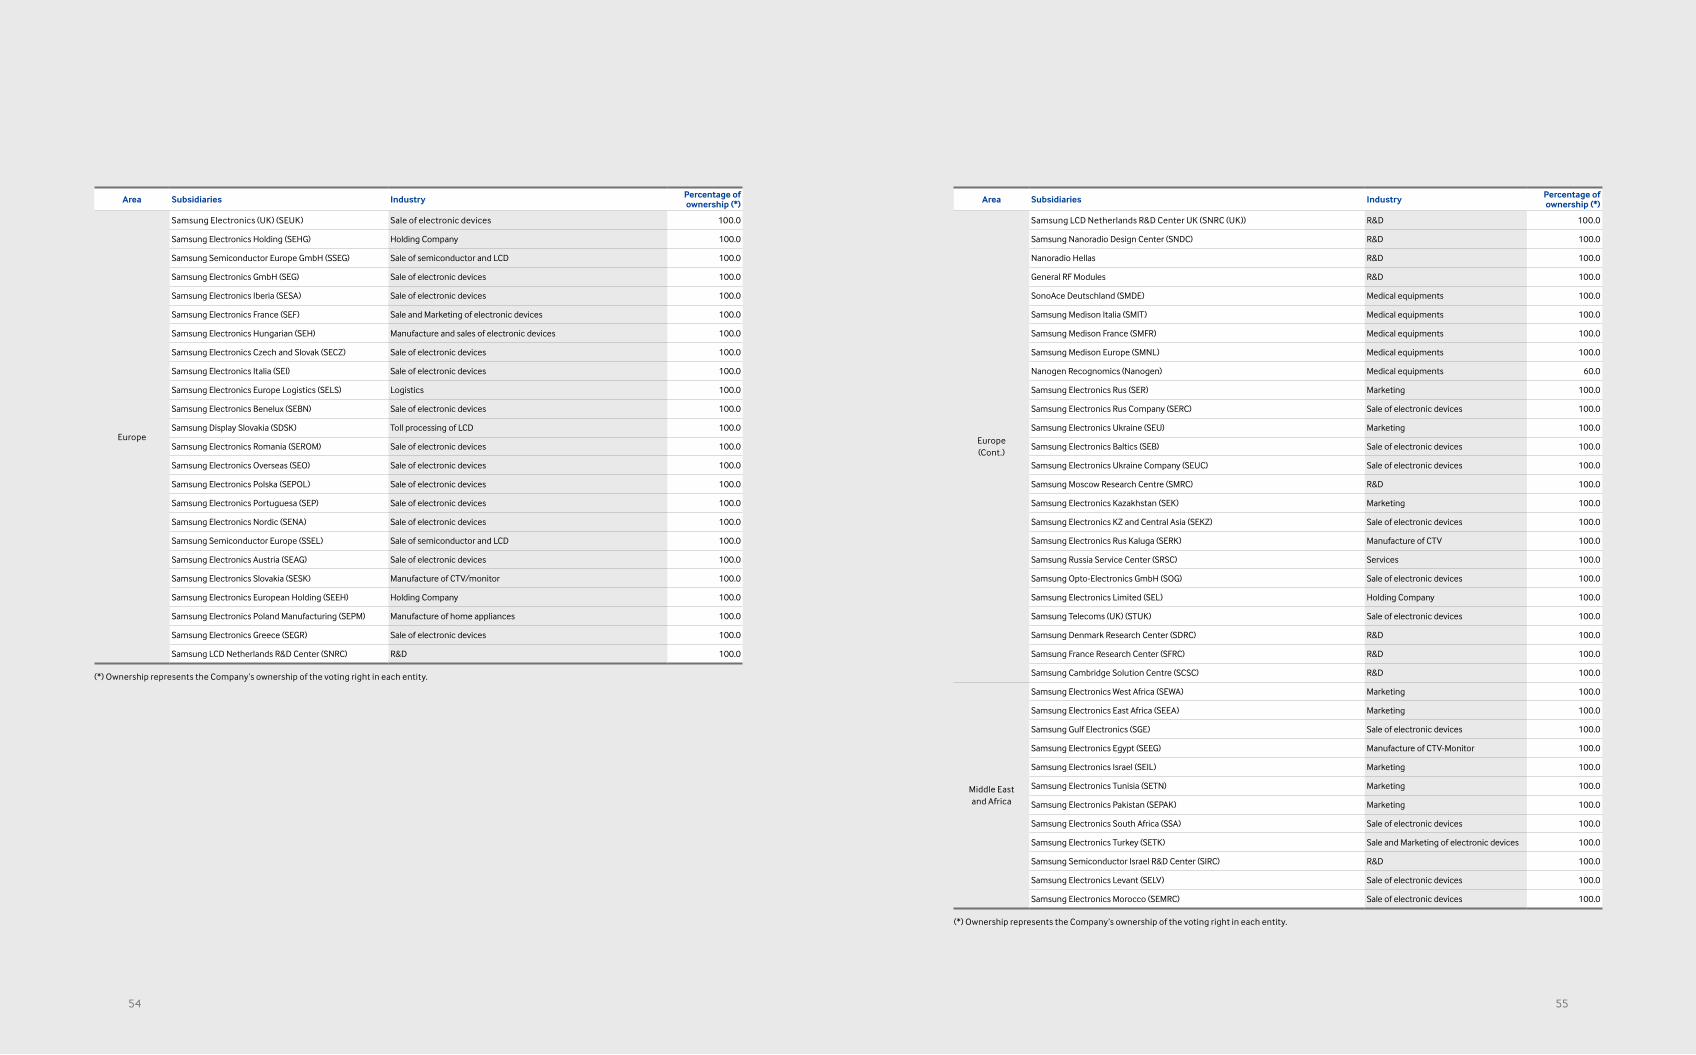
Area Subsidiaries Industry Percentage ofownership (*)
Europe(Cont.)
Samsung LCD Netherlands R&D Center UK (SNRC (UK)) R&D 100.0
Samsung Nanoradio Design Center (SNDC) R&D 100.0
Nanoradio Hellas R&D 100.0
General RF Modules R&D 100.0
SonoAce Deutschland (SMDE) Medical equipments 100.0
Samsung Medison Italia (SMIT) Medical equipments 100.0
Samsung Medison France (SMFR) Medical equipments 100.0
Samsung Medison Europe (SMNL) Medical equipments 100.0
Nanogen Recognomics (Nanogen) Medical equipments 60.0
Samsung Electronics Rus (SER) Marketing 100.0
Samsung Electronics Rus Company (SERC) Sale of electronic devices 100.0
Samsung Electronics Ukraine (SEU) Marketing 100.0
Samsung Electronics Baltics (SEB) Sale of electronic devices 100.0
Samsung Electronics Ukraine Company (SEUC) Sale of electronic devices 100.0
Samsung Moscow Research Centre (SMRC) R&D 100.0
Samsung Electronics Kazakhstan (SEK) Marketing 100.0
Samsung Electronics KZ and Central Asia (SEKZ) Sale of electronic devices 100.0
Samsung Electronics Rus Kaluga (SERK) Manufacture of CTV 100.0
Samsung Russia Service Center (SRSC) Services 100.0
Samsung Opto-Electronics GmbH (SOG) Sale of electronic devices 100.0
Samsung Electronics Limited (SEL) Holding Company 100.0
Samsung Telecoms (UK) (STUK) Sale of electronic devices 100.0
Samsung Denmark Research Center (SDRC) R&D 100.0
Samsung France Research Center (SFRC) R&D 100.0
Samsung Cambridge Solution Centre (SCSC) R&D 100.0
Middle Eastand Africa
Samsung Electronics West Africa (SEWA) Marketing 100.0
Samsung Electronics East Africa (SEEA) Marketing 100.0
Samsung Gulf Electronics (SGE) Sale of electronic devices 100.0
Samsung Electronics Egypt (SEEG) Manufacture of CTV-Monitor 100.0
Samsung Electronics Israel (SEIL) Marketing 100.0
Samsung Electronics Tunisia (SETN) Marketing 100.0
Samsung Electronics Pakistan (SEPAK) Marketing 100.0
Samsung Electronics South Africa (SSA) Sale of electronic devices 100.0
Samsung Electronics Turkey (SETK) Sale and Marketing of electronic devices 100.0
Samsung Semiconductor Israel R&D Center (SIRC) R&D 100.0
Samsung Electronics Levant (SELV) Sale of electronic devices 100.0
Samsung Electronics Morocco (SEMRC) Sale of electronic devices 100.0
(*) Ownership represents the Company’s ownership of the voting right in each entity.
Area Subsidiaries Industry Percentage ofownership (*)
Europe
Samsung Electronics (UK) (SEUK) Sale of electronic devices 100.0
Samsung Electronics Holding (SEHG) Holding Company 100.0
Samsung Semiconductor Europe GmbH (SSEG) Sale of semiconductor and LCD 100.0
Samsung Electronics GmbH (SEG) Sale of electronic devices 100.0
Samsung Electronics Iberia (SESA) Sale of electronic devices 100.0
Samsung Electronics France (SEF) Sale and Marketing of electronic devices 100.0
Samsung Electronics Hungarian (SEH) Manufacture and sales of electronic devices 100.0
Samsung Electronics Czech and Slovak (SECZ) Sale of electronic devices 100.0
Samsung Electronics Italia (SEI) Sale of electronic devices 100.0
Samsung Electronics Europe Logistics (SELS) Logistics 100.0
Samsung Electronics Benelux (SEBN) Sale of electronic devices 100.0
Samsung Display Slovakia (SDSK) Toll processing of LCD 100.0
Samsung Electronics Romania (SEROM) Sale of electronic devices 100.0
Samsung Electronics Overseas (SEO) Sale of electronic devices 100.0
Samsung Electronics Polska (SEPOL) Sale of electronic devices 100.0
Samsung Electronics Portuguesa (SEP) Sale of electronic devices 100.0
Samsung Electronics Nordic (SENA) Sale of electronic devices 100.0
Samsung Semiconductor Europe (SSEL) Sale of semiconductor and LCD 100.0
Samsung Electronics Austria (SEAG) Sale of electronic devices 100.0
Samsung Electronics Slovakia (SESK) Manufacture of CTV/monitor 100.0
Samsung Electronics European Holding (SEEH) Holding Company 100.0
Samsung Electronics Poland Manufacturing (SEPM) Manufacture of home appliances 100.0
Samsung Electronics Greece (SEGR) Sale of electronic devices 100.0
Samsung LCD Netherlands R&D Center (SNRC) R&D 100.0
(*) Ownership represents the Company’s ownership of the voting right in each entity.
5554
Area Subsidiaries Industry Percentage ofownership (*)
China
Samsung Display Dongguan (SDDG) Manufacture of TFT-LCD 100.0
Samsung Display Tianjin (SDTJ) Manufacture of TFT-LCD 95.0
Samsung Electronics Hong Kong (SEHK) Sale of electronic devices 100.0
Suzhou Samsung Electronics (SSEC) Manufacture of home appliances 88.3
Samsung Suzhou Electronics Export (SSEC-E) Manufacture of home appliances 100.0
Samsung (China) Investment (SCIC) Sale of electronic devices 100.0
Samsung Guangzhou Mobile R&D Center (SGMC) R&D 100.0
Samsung Tianjin Mobile R&D (STMC) R&D 100.0
Samsung Electronics Suzhou Semiconductor (SESS) Toll processing of semiconductor 100.0
Samsung Electronics (Shandong) Digital Printing (SSDP) Manufacture of printer 100.0
Samsung Electronics Huizhou (SEHZ) Manufacture of electronic devices 99.8
Tianjin Samsung Electronics (TSEC) Manufacture of electronic devices 91.3
Samsung Electronics Taiwan (SET) Sale of electronic devices 100.0
Beijing Samsung Telecom R&D Center (BST) R&D 100.0
Tianjin Samsung Telecom Technology (TSTC) Manufacture of communication devices 90.0
Shanghai Samsung Semiconductor (SSS) Sale of semiconductor and LCD 100.0
Samsung Electronics Suzhou Computer (SESC) Manufacture of electronic devices 100.0
Samsung Display Suzhou (SDSZ) Toll processing of TFT-LCD 100.0
Samsung Suzhou LCD (SSL) Manufacture of TFT-LCD 60.0
Shenzhen Samsung Kejian Mobile Telecommunication Technology (SSKMT) Manufacture of communication devices 60.0
Samsung Electronics Shanghai Telecommunication (SSTC)Sale of mobile communication and network equipment
100.0
Samsung LCD Netherlands R&D Center HK (SNRC(HK)) R&D 100.0
Samsung Semiconductor (China) R&D (SSCR) R&D 100.0
Samsung Electronics China R&D Center (SCRC) R&D 100.0
Samsung (China) Semiconductor (SCS) Manufacture of electronic devices 100.0
Samsung Electronics Hainan Fiberoptics (SEHF) Manufacture of optical fiber, cable 100.0
Samsung Electronics (Beijing) Service (SBSC) Services 100.0
Medison (Shanghai) (SMS2) Medical equipments 100.0
Samsung Medison Shanghai Medical Instrument (SMS1) Medical equipments 98.2
Medison Medical Equipment (Shanghai) (MMS) Medical equipments 100.0
Tianjin Samsung LED (TSLED) Manufacture of LED 100.0
Tianjin Samsung Opto-Electronics (TSOE) Manufacture of camera and camcorder 90.0
(*) Ownership represents the Company’s ownership of the voting right in each entity.
Area Subsidiaries Industry Percentage ofownership (*1)
Rest of Asia
Samsung Japan (SJC) Sale of electronic devices 100.0
Samsung Yokohama Research Institute (SYRI) R&D 100.0
Samsung Electronics Japan (SEJ)Sale and services of communication equipments
100.0
TNP Small/Medium Size & Venture Enterprises Growth Promotion Investment Limited Partnership (TSUNAMI)
Technology business investment 97.0
Samsung Electronics Display (M) (SDMA)Manufacture and sales of electronic devices
100.0
Samsung Electronics (M) (SEMA) Manufacture of home appliances 100.0
Samsung Vina Electronics (SAVINA)Manufacture and sales of electronic devices
80.0
Samsung Asia Private (SAPL) Sale of electronic devices 100.0
Samsung India Electronics (SIEL)Manufacture and sale of electronic devices
100.0
Samsung India Software Operations (SISO) R&D 100.0
Samsung Electronics Australia (SEAU) Sale of electronic devices 100.0
Samsung Electronics Indonesia (SEIN)Manufacture and sale of electronic devices
100.0
Samsung Telecommunications Indonesia (STIN)Sale and services of communication equipments
99.0
Thai Samsung Electronics (TSE)Manufacture and sale of electronic devices
91.8
Samsung Electronics Philippines (SEPCO) Sale of electronic devices 100.0
Samsung Electronics Philippines Manufacturing (SEPHIL) Manufacture of electronic devices 100.0
Batino Realty Corporation (BRC) (*2) Management of real estate 39.8
Samsung Malaysia Electronics (SME) Sale of electronic devices 100.0
Samsung Bangladesh R&D (SBRC) R&D 100.0
Samsung Electronics Vietnam (SEV) Manufacture of electronic devices 100.0
Samsung Telecommunications Malaysia (STM) Communication system service 100.0
Samsung Medison India (SMIN) Medical equipments 100.0
Medison Medical Systems (India) (MI) Medical equipments 100.0
(*1) Ownership represents the Company’s ownership of the voting right in each entity.
(*2) Although the Company owns less than 50% of the voting rights of BRC as at December 31, 2012, the Company is considered to have control over BRC, as BRC is
a special purpose entity, and its operations are based on the specific business needs of the Company. Therefore the Company obtains most of the benefits from
BRC’s operation.
5756
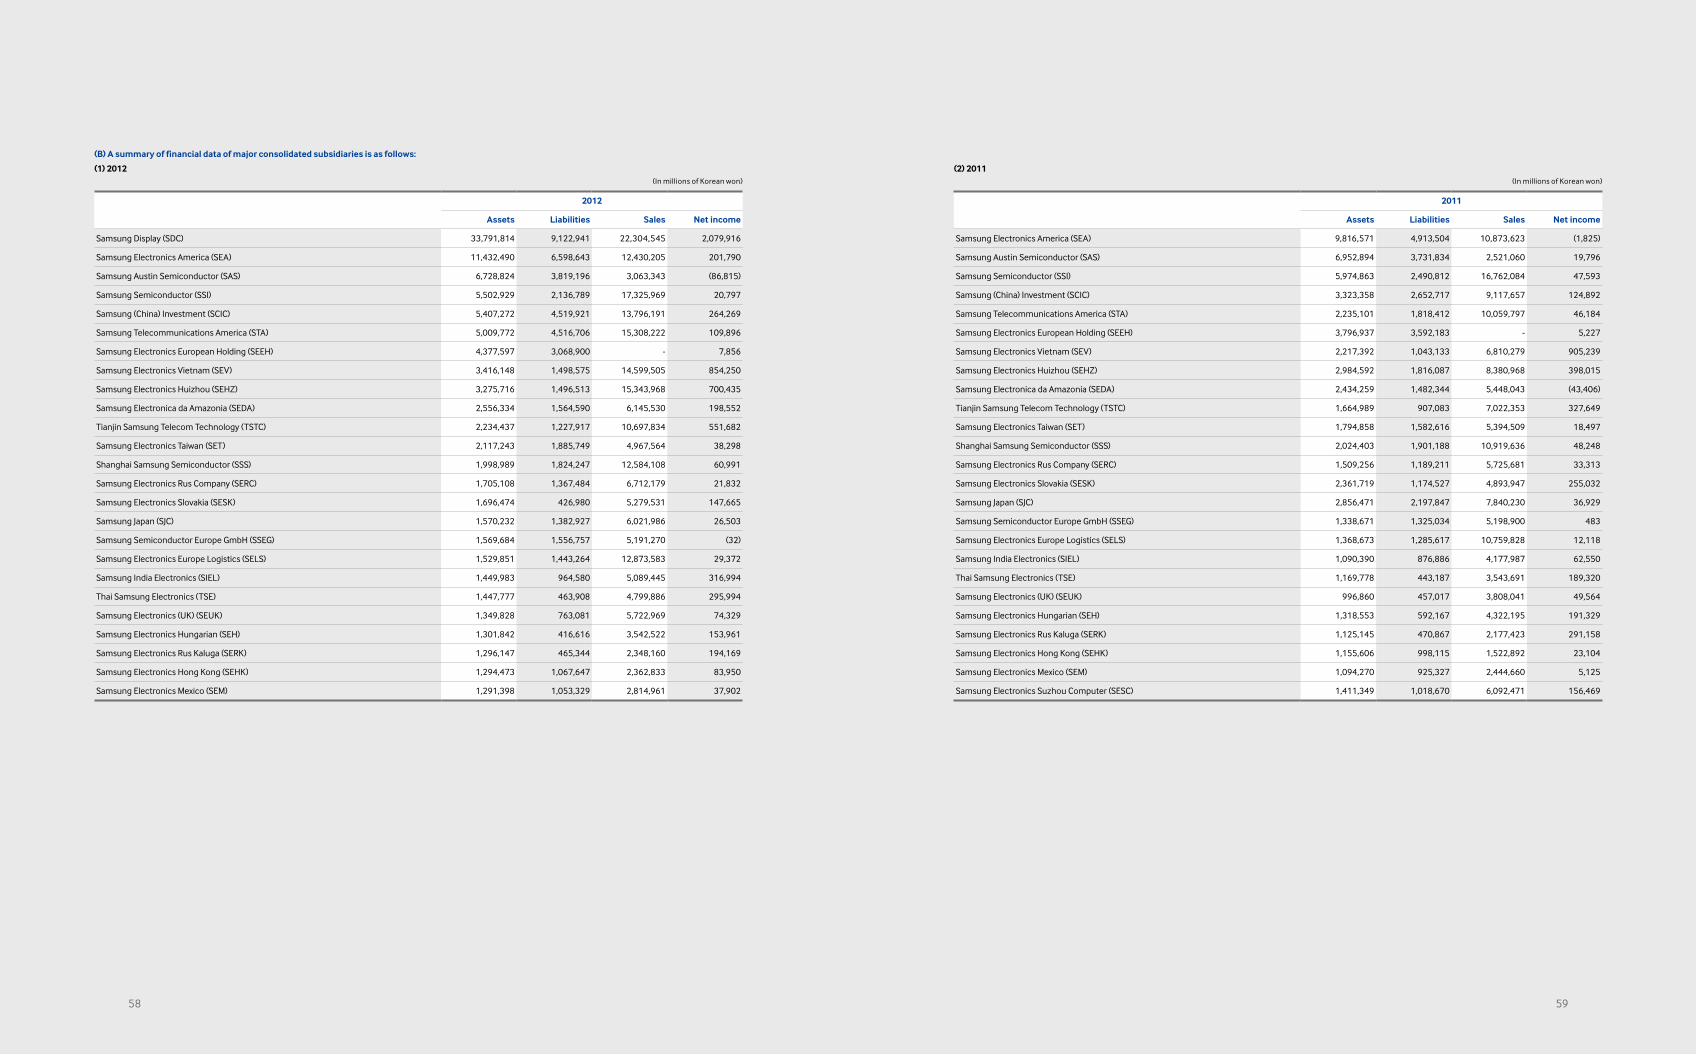
(2) 2011(In millions of Korean won)
2011
Assets Liabilities Sales Net income
Samsung Electronics America (SEA) 9,816,571 4,913,504 10,873,623 (1,825)
Samsung Austin Semiconductor (SAS) 6,952,894 3,731,834 2,521,060 19,796
Samsung Semiconductor (SSI) 5,974,863 2,490,812 16,762,084 47,593
Samsung (China) Investment (SCIC) 3,323,358 2,652,717 9,117,657 124,892
Samsung Telecommunications America (STA) 2,235,101 1,818,412 10,059,797 46,184
Samsung Electronics European Holding (SEEH) 3,796,937 3,592,183 - 5,227
Samsung Electronics Vietnam (SEV) 2,217,392 1,043,133 6,810,279 905,239
Samsung Electronics Huizhou (SEHZ) 2,984,592 1,816,087 8,380,968 398,015
Samsung Electronica da Amazonia (SEDA) 2,434,259 1,482,344 5,448,043 (43,406)
Tianjin Samsung Telecom Technology (TSTC) 1,664,989 907,083 7,022,353 327,649
Samsung Electronics Taiwan (SET) 1,794,858 1,582,616 5,394,509 18,497
Shanghai Samsung Semiconductor (SSS) 2,024,403 1,901,188 10,919,636 48,248
Samsung Electronics Rus Company (SERC) 1,509,256 1,189,211 5,725,681 33,313
Samsung Electronics Slovakia (SESK) 2,361,719 1,174,527 4,893,947 255,032
Samsung Japan (SJC) 2,856,471 2,197,847 7,840,230 36,929
Samsung Semiconductor Europe GmbH (SSEG) 1,338,671 1,325,034 5,198,900 483
Samsung Electronics Europe Logistics (SELS) 1,368,673 1,285,617 10,759,828 12,118
Samsung India Electronics (SIEL) 1,090,390 876,886 4,177,987 62,550
Thai Samsung Electronics (TSE) 1,169,778 443,187 3,543,691 189,320
Samsung Electronics (UK) (SEUK) 996,860 457,017 3,808,041 49,564
Samsung Electronics Hungarian (SEH) 1,318,553 592,167 4,322,195 191,329
Samsung Electronics Rus Kaluga (SERK) 1,125,145 470,867 2,177,423 291,158
Samsung Electronics Hong Kong (SEHK) 1,155,606 998,115 1,522,892 23,104
Samsung Electronics Mexico (SEM) 1,094,270 925,327 2,444,660 5,125
Samsung Electronics Suzhou Computer (SESC) 1,411,349 1,018,670 6,092,471 156,469
5958
(B) A summary of financial data of major consolidated subsidiaries is as follows:
(1) 2012(In millions of Korean won)
2012
Assets Liabilities Sales Net income
Samsung Display (SDC) 33,791,814 9,122,941 22,304,545 2,079,916
Samsung Electronics America (SEA) 11,432,490 6,598,643 12,430,205 201,790
Samsung Austin Semiconductor (SAS) 6,728,824 3,819,196 3,063,343 (86,815)
Samsung Semiconductor (SSI) 5,502,929 2,136,789 17,325,969 20,797
Samsung (China) Investment (SCIC) 5,407,272 4,519,921 13,796,191 264,269
Samsung Telecommunications America (STA) 5,009,772 4,516,706 15,308,222 109,896
Samsung Electronics European Holding (SEEH) 4,377,597 3,068,900 - 7,856
Samsung Electronics Vietnam (SEV) 3,416,148 1,498,575 14,599,505 854,250
Samsung Electronics Huizhou (SEHZ) 3,275,716 1,496,513 15,343,968 700,435
Samsung Electronica da Amazonia (SEDA) 2,556,334 1,564,590 6,145,530 198,552
Tianjin Samsung Telecom Technology (TSTC) 2,234,437 1,227,917 10,697,834 551,682
Samsung Electronics Taiwan (SET) 2,117,243 1,885,749 4,967,564 38,298
Shanghai Samsung Semiconductor (SSS) 1,998,989 1,824,247 12,584,108 60,991
Samsung Electronics Rus Company (SERC) 1,705,108 1,367,484 6,712,179 21,832
Samsung Electronics Slovakia (SESK) 1,696,474 426,980 5,279,531 147,665
Samsung Japan (SJC) 1,570,232 1,382,927 6,021,986 26,503
Samsung Semiconductor Europe GmbH (SSEG) 1,569,684 1,556,757 5,191,270 (32)
Samsung Electronics Europe Logistics (SELS) 1,529,851 1,443,264 12,873,583 29,372
Samsung India Electronics (SIEL) 1,449,983 964,580 5,089,445 316,994
Thai Samsung Electronics (TSE) 1,447,777 463,908 4,799,886 295,994
Samsung Electronics (UK) (SEUK) 1,349,828 763,081 5,722,969 74,329
Samsung Electronics Hungarian (SEH) 1,301,842 416,616 3,542,522 153,961
Samsung Electronics Rus Kaluga (SERK) 1,296,147 465,344 2,348,160 194,169
Samsung Electronics Hong Kong (SEHK) 1,294,473 1,067,647 2,362,833 83,950
Samsung Electronics Mexico (SEM) 1,291,398 1,053,329 2,814,961 37,902
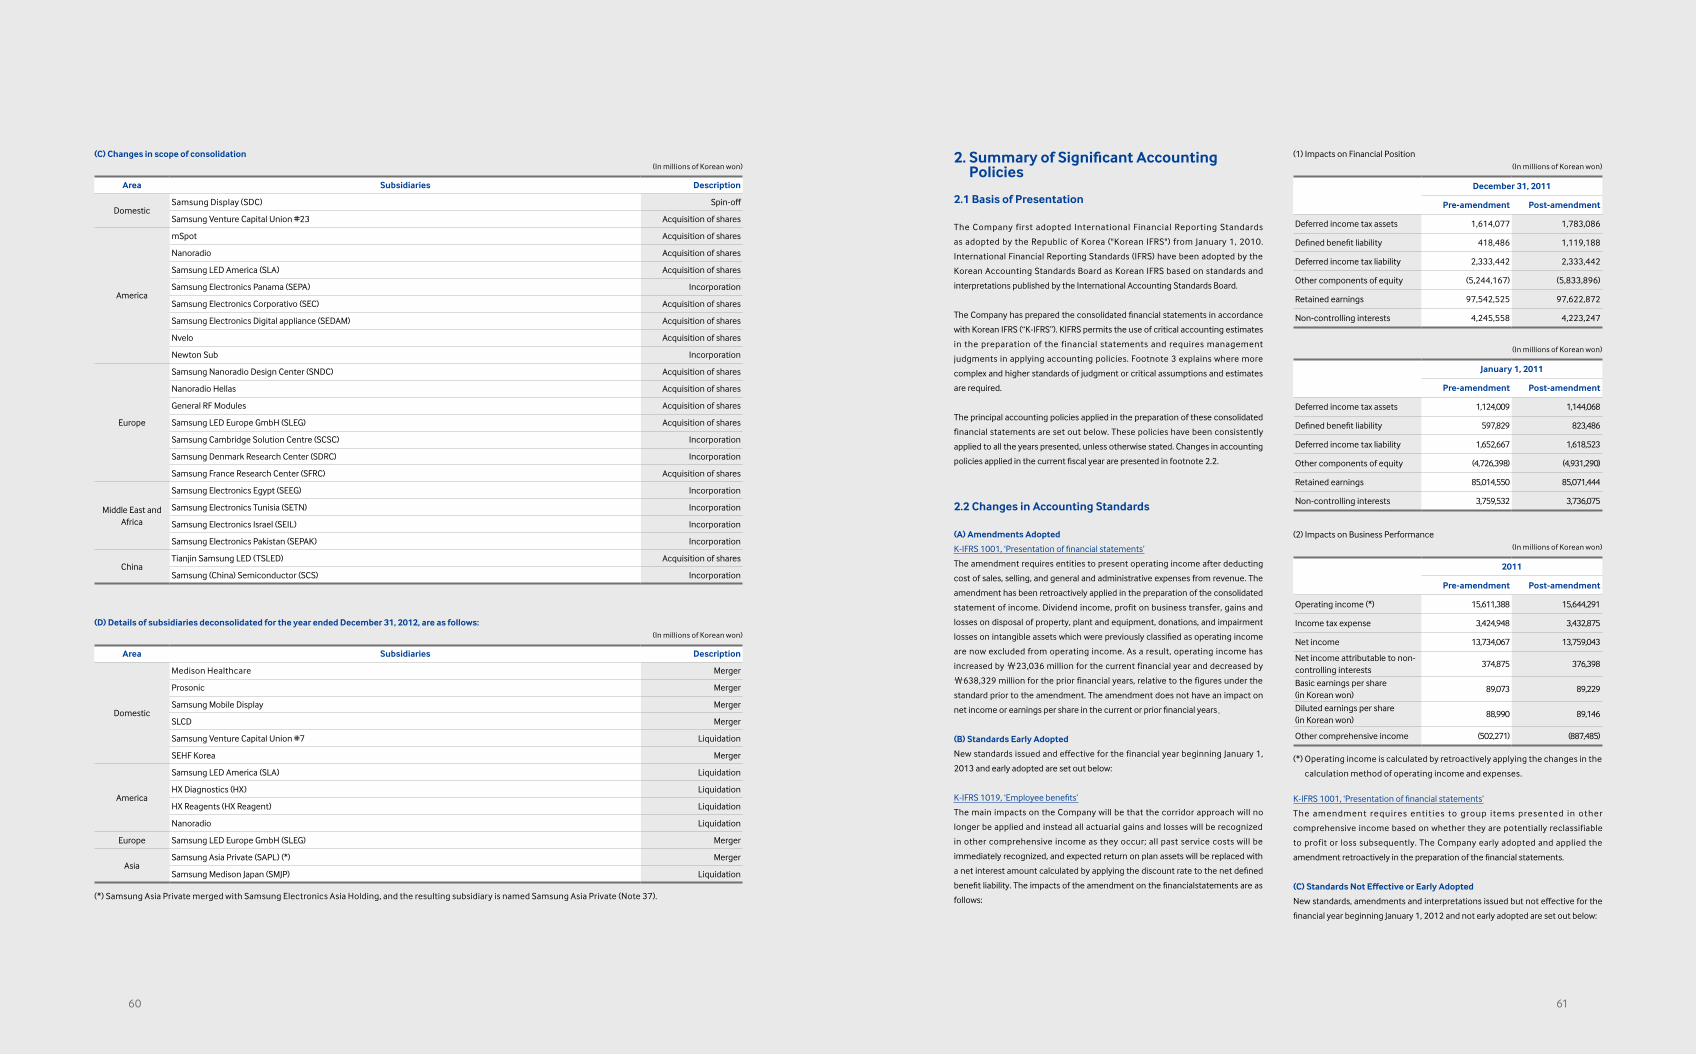
2. Summary of Significant Accounting Policies
2.1 Basis of Presentation
The Company first adopted International Financial Reporting Standards
as adopted by the Republic of Korea ("Korean IFRS") from January 1, 2010.
International Financial Reporting Standards (IFRS) have been adopted by the
Korean Accounting Standards Board as Korean IFRS based on standards and
interpretations published by the International Accounting Standards Board.
The Company has prepared the consolidated financial statements in accordance
with Korean IFRS (“K-IFRS”). KIFRS permits the use of critical accounting estimates
in the preparation of the financial statements and requires management
judgments in applying accounting policies. Footnote 3 explains where more
complex and higher standards of judgment or critical assumptions and estimates
are required.
The principal accounting policies applied in the preparation of these consolidated
financial statements are set out below. These policies have been consistently
applied to all the years presented, unless otherwise stated. Changes in accounting
policies applied in the current fiscal year are presented in footnote 2.2.
2.2 Changes in Accounting Standards
(A) Amendments Adopted
K-IFRS 1001, ‘Presentation of financial statements’
The amendment requires entities to present operating income after deducting
cost of sales, selling, and general and administrative expenses from revenue. The
amendment has been retroactively applied in the preparation of the consolidated
statement of income. Dividend income, profit on business transfer, gains and
losses on disposal of property, plant and equipment, donations, and impairment
losses on intangible assets which were previously classified as operating income
are now excluded from operating income. As a result, operating income has
increased by ₩23,036 million for the current financial year and decreased by
₩638,329 million for the prior financial years, relative to the figures under the
standard prior to the amendment. The amendment does not have an impact on
net income or earnings per share in the current or prior financial years.
(B) Standards Early Adopted
New standards issued and effective for the financial year beginning January 1,
2013 and early adopted are set out below:
K-IFRS 1019, ‘Employee benefits’
The main impacts on the Company will be that the corridor approach will no
longer be applied and instead all actuarial gains and losses will be recognized
in other comprehensive income as they occur; all past service costs will be
immediately recognized, and expected return on plan assets will be replaced with
a net interest amount calculated by applying the discount rate to the net defined
benefit liability. The impacts of the amendment on the financialstatements are as
follows:
(1) Impacts on Financial Position(In millions of Korean won)
December 31, 2011
Pre-amendment Post-amendment
Deferred income tax assets 1,614,077 1,783,086
Defined benefit liability 418,486 1,119,188
Deferred income tax liability 2,333,442 2,333,442
Other components of equity (5,244,167) (5,833,896)
Retained earnings 97,542,525 97,622,872
Non-controlling interests 4,245,558 4,223,247
(In millions of Korean won)
January 1, 2011
Pre-amendment Post-amendment
Deferred income tax assets 1,124,009 1,144,068
Defined benefit liability 597,829 823,486
Deferred income tax liability 1,652,667 1,618,523
Other components of equity (4,726,398) (4,931,290)
Retained earnings 85,014,550 85,071,444
Non-controlling interests 3,759,532 3,736,075
(2) Impacts on Business Performance(In millions of Korean won)
2011
Pre-amendment Post-amendment
Operating income (*) 15,611,388 15,644,291
Income tax expense 3,424,948 3,432,875
Net income 13,734,067 13,759,043
Net income attributable to non-controlling interests
374,875 376,398
Basic earnings per share (in Korean won)
89,073 89,229
Diluted earnings per share (in Korean won)
88,990 89,146
Other comprehensive income (502,271) (887,485)
(*) Operating income is calculated by retroactively applying the changes in the
calculation method of operating income and expenses.
K-IFRS 1001, ‘Presentation of financial statements’
The amendment requires entit ies to group items presented in other
comprehensive income based on whether they are potentially reclassifiable
to profit or loss subsequently. The Company early adopted and applied the
amendment retroactively in the preparation of the financial statements.
(C) Standards Not Effective or Early Adopted
New standards, amendments and interpretations issued but not effective for the
financial year beginning January 1, 2012 and not early adopted are set out below:
6160
(C) Changes in scope of consolidation(In millions of Korean won)
Area Subsidiaries Description
DomesticSamsung Display (SDC) Spin-off
Samsung Venture Capital Union #23 Acquisition of shares
America
mSpot Acquisition of shares
Nanoradio Acquisition of shares
Samsung LED America (SLA) Acquisition of shares
Samsung Electronics Panama (SEPA) Incorporation
Samsung Electronics Corporativo (SEC) Acquisition of shares
Samsung Electronics Digital appliance (SEDAM) Acquisition of shares
Nvelo Acquisition of shares
Newton Sub Incorporation
Europe
Samsung Nanoradio Design Center (SNDC) Acquisition of shares
Nanoradio Hellas Acquisition of shares
General RF Modules Acquisition of shares
Samsung LED Europe GmbH (SLEG) Acquisition of shares
Samsung Cambridge Solution Centre (SCSC) Incorporation
Samsung Denmark Research Center (SDRC) Incorporation
Samsung France Research Center (SFRC) Acquisition of shares
Middle East andAfrica
Samsung Electronics Egypt (SEEG) Incorporation
Samsung Electronics Tunisia (SETN) Incorporation
Samsung Electronics Israel (SEIL) Incorporation
Samsung Electronics Pakistan (SEPAK) Incorporation
ChinaTianjin Samsung LED (TSLED) Acquisition of shares
Samsung (China) Semiconductor (SCS) Incorporation
(D) Details of subsidiaries deconsolidated for the year ended December 31, 2012, are as follows:(In millions of Korean won)
Area Subsidiaries Description
Domestic
Medison Healthcare Merger
Prosonic Merger
Samsung Mobile Display Merger
SLCD Merger
Samsung Venture Capital Union #7 Liquidation
SEHF Korea Merger
America
Samsung LED America (SLA) Liquidation
HX Diagnostics (HX) Liquidation
HX Reagents (HX Reagent) Liquidation
Nanoradio Liquidation
Europe Samsung LED Europe GmbH (SLEG) Merger
AsiaSamsung Asia Private (SAPL) (*) Merger
Samsung Medison Japan (SMJP) Liquidation
(*) Samsung Asia Private merged with Samsung Electronics Asia Holding, and the resulting subsidiary is named Samsung Asia Private (Note 37).
K-IFRS 1113, ‘Fair value measurement’
The standard aims to improve consistency and reduce complexity by providing
a precise definition of fair value and a single source of fair value measurement
and disclosure requirements for use across Financial Reporting Standards. The
requirements, which are largely aligned between IFRS and US GAAP, do not extend
the use of fair value accounting but provide guidance on how it should be applied
where its use is already required or permitted by other standards within IFRS or US
GAAP. The Company is still in the process of assessing the impact of the amendment
on the consolidated financial statements and intends to adopt K-IFRS 1113 no later
than the accounting period beginning January 1, 2013.
K-IFRS 1110, ‘Consolidated financial statements’
The standard explains the principle of control which is the basis for determining
which entities are consolidated in the consolidated financial statements. An investor
controls an investee when it is exposed, or has rights, to variable returns from its
involvement with the investee and has the ability to affect those returns through its
power over the investee. The standard sets out further guidance where it is difficult
to determine control. The standard will be effective for the fiscal year beginning
January 1, 2013. The Company is in the process of assessing the impact of the
standard on the consolidated financial statements.
K-IFRS 1111, ‘Joint arrangements Introduction’
The standard reflects the essence of joint arrangements and focuses on the rights
and obligations of the parties to the joint arrangements rather than on the legal
forms of the arrangements. The standard classifies joint arrangements into joint
operations and joint ventures. A joint operation is a joint arrangement whereby the
parties that have joint control of the arrangement (i.e. joint operators) have rights
to the assets, and obligations for the liabilities, relating to the arrangement. A joint
operator accounts for the assets, liabilities, revenues and expenses in relation to
its interest in the arrangement. A joint venture is a joint arrangement whereby the
parties that have joint control of the arrangement (i.e. joint venturers) have rights
to the net assets of the arrangement. Joint venturers account for the investment
using the equity method. The standard will be effective for the fiscal year beginning
January 1, 2013. The Company is in the process of assessing the impact of the
standard on the consolidated financial statements.
K-IFRS 1111, ‘Joint arrangements Introduction’
The standard provides disclosure requirements for all types of equity investments
in other entities including subsidiaries, joint arrangements, associates, consolidated
structured entities and unconsolidated structured entities. The standard will be
effective for the fiscal year beginning January 1, 2013. The Company is in the
process of assessing the impact of the standard on the consolidated financial
statements.
2.3 Consolidation
The Company prepares annual consolidated financial statements in accordance
with K-IFRS 1027, Consolidated and Separate Financial Statements.
(A) Subsidiaries
The consolidated financial statements include the accounts of SEC and its
controlled subsidiaries. Control over a subsidiary is presumed to exist when the
Company has the power to govern the financial and operating policies of an entity
to obtain benefits from its activities generally accompanying a shareholding of
more than one half of the voting rights. The existence and effects of potential voting
rights that are exercisable or convertible at the end of the reporting period are
considered in determining whether the Company controls another entity. Moreover,
K-IFRS 1027 requires the evaluation of whether the Company holds control over the
financial and operating policies of a subsidiary where the Company’s shareholding
is less than or equal to 50%. Control is presumed to exist when the Company is
considered to have control over the financial and operating policies of a subsidiary
through its ownership relative to those of other shareholders. Subsidiaries are fully
consolidated from the date when control is transferred to the Company and de-
consolidated from the date which control ceases to exist.
The purchase method of accounting is used to account for the acquisition of
subsidiaries by the Company. The cost of an acquisition is measured at the fair value
of the assets given, equity instruments issued and liabilities incurred or assumed
at the date of exchange. Identifiable assets acquired and liabilities and contingent
liabilities assumed in a business combination are measured initially at their fair
values at the acquisition date, irrespective of the extent of any non-controlling
interest. The excess of the cost of acquisition over the fair value of the Company’s
share of the identifiable net assets acquired is recorded as goodwill. If the cost of
acquisition is less than the fair value of the net assets of the subsidiary acquired,
the difference is recognized directly in the statement of income. For each business
combination, the Company measures any non-controlling interest in the acquiree
at the non-controlling interest’s proportionate share of the acquiree’s identifiable
net assets.
In a business combination achieved in stages, the acquisition date fair value of the
acquirer’s previously held equity interest in the acquiree is remeasured to fair value
at the acquisition date through profit or loss.
The Company recognizes the acquisition-date fair value of contingent
consideration. Changes in the fair value of contingent consideration classified as an
asset or a liability are recognized in profit or loss in accordance with K-IFRS 1039,
‘Financial Instruments: Recognition and Measurement’. Contingent consideration
classified as equity shall not be remeasured and its subsequent settlement shall be
accounted for within equity.
The Company recognizes goodwill as of the acquisition date measured as the
excess of (1) the aggregate of 1) the consideration transferred, 2) the amount of
any non-controlling interest in the acquiree and 3) the acquisition-date fair value
of the Company’s previously held equity interest in the acquiree over (2) the net
identifiable assets acquired. If the aggregate amount in (1) is less than the fair value
of the acquiree’s net assets (2), the difference is recognized in profit or loss.
Inter-company transactions, balances, income, expenses and unrealized gains
on inter-company transactions are eliminated. Unrealized losses are eliminated
upon assessing the impairment of the transferred assets. Accounting policies of
subsidiaries have been changed where necessary to ensure consistency with the
policies adopted by the Company.
(B) Changes in the ownership of a subsidiary without gain or loss of control
Transactions with non-controlling interests that do not result in loss of control are
accounted for as equity. transactions – that is, as transactions with the owners in
their capacity as owners. The difference between fair value of any consideration paid
and the relevant share acquired of the carrying value of net assets of the subsidiary
is recorded in equity. Gains or losses on disposals to non-controlling interests are
also recorded in equity.
(C) Disposal of a subsidiary
When the Company ceases to have control, any retained interest in the entity is
re-measured to its fair value at the date when control is lost, with the change in
carrying amount recognized in profit or loss. The fair value is the initial carrying
amount for the purposes of subsequently accounting for the retained interest as
an associate, joint venture or financial asset. In addition, any amounts previously
recognized in other comprehensive income in respect of that entity are accounted
for as if the Company had directly disposed of the related assets or liabilities. This
may mean that amounts previously recognized in other comprehensive income are
reclassified to profit or loss.
(D) Non-controlling interests
Profit or loss and each component of other comprehensive income are attributed to
the owners of the parent and to the non-controlling interests. Total comprehensive
income is attributed to the owners of the parent and to the noncontrolling interests
even if this results in the non-controlling interests having a deficit balance. Any
changes in a parent's ownership interest in a subsidiary that do not result in a loss of
control are accounted for as equity transactions (i.e. transactions among owners in
their capacity as owners).
(E) Associated companies
Investments in companies in which the Company does not have the ability to
directly or indirectly control the financial and operating decisions, but does
possess the ability to exercise significant influence, are accounted for using the
equity method. Generally, it is presumed that if at least 20% of the voting stock
and potential voting rights is owned, significant influence exists. The Company’s
investment in associates includes goodwill identified upon acquisition, net of any
accumulated impairment loss.
If the ownership in associated companies decreases to the extent that the Company
loses significant influence, the Company will reclassify the proportionate amount
previously recognized in other comprehensive income to profit or loss.
The Company’s share of post-acquisition profit or loss is recognized in the income
statement, and its share of post acquisition movements in other comprehensive
income is recognized in other comprehensive income with a corresponding
adjustment to the carrying amount of the investment. When the Company’s share
of losses in an associate equals or exceeds its interest in the associate, including
any other unsecured receivables, the Company does not recognize further losses,
unless it has incurred obligations or made payments on behalf of the associate or
joint venture.
The Company assesses at the end of each reporting period whether there is any
objective evidence that the investments in associates are impaired. If any such
evidence exists, the Company will recognize impairment loss as the difference
between the recoverable amount and the carrying amount of investments in
associates. The impairment loss will be separately disclosed in the statement of
income as an impairment loss on associates.
Unrealized gains on transactions between the Company and its associates are
eliminated to the extent of the parent company’s interest in the associates.
Unrealized losses are also eliminated unless the transaction provides evidence of
an impairment of the asset transferred. Accounting policies of associates have been
changed where necessary to ensure consistency with the policies adopted by the
Company. Decrease in the interest in associates is recognized in profit or loss where
the Company maintains significant influence over associates although its share has
been decreased.
(F) Joint ventures
Joint ventures are entities in which the Company holds joint control with other
participants based on an agreed upon contract. Investments in joint ventures
are initially recognized at cost and then accounted for using the equity method.
The Company’s investment in joint ventures includes goodwill identified upon
acquisition, net of any accumulated impairment loss. If the Company purchases
assets from joint ventures, the Company does not recognize its share of post-
acquisition profit until it disposes of the acquired assets to a third party. The
Company recognizes losses from these transactions where such losses provide
evidence of an impairment of the assets or decrease of net realizable value.
2.4 Foreign Currency Translation
(A) Functional and presentation currency
Items included in the financial statements of each of the Company’s entities are
measured using the currency of the primary economic environment in which each
entity operates (‘the functional currency’). The consolidated financial statements
are presented in Korean won, which is SEC’s functional and presentation currency.
(B) Transactions and balances
Foreign currency transactions are translated into the functional currency using the
exchange rates prevailing at the dates of the transactions or valuation where items
are remeasured. Foreign exchange gains and losses resulting from the settlement
of such transactions and from the translation at the exchange rate at the end of
the reporting period of monetary assets denominated in foreign currencies are
recognized as realized foreign exchange gains and losses under finance income and
expense in the statement of income, except when deferred in other comprehensive
income as qualifying cash flow hedges and qualifying net investment hedges.
Changes in the fair value of monetary securities denominated in foreign currency
classified as available-for-sale financial assets are analyzed between translation
differences resulting from changes in the amortized cost of the security and other
changes in the carrying amount of the security. Translation differences related to
changes in amortized cost are recognized in profit or loss, and other changes in
carrying amount are recognized in other comprehensive income.
Translation differences on non-monetary financial assets and liabilities are
recognized in profit or loss as part of the fair value gain or loss. Translation
differences on non-monetary financial assets such as equity instruments held at
fair value through profit or loss are recognized in profit or loss as part of the fair
value gain or loss. Translation differences on non-monetary financial assets, such
as equities classified as available-for-sales are included in other comprehensive
income.
(C) Translation into presentation currency
The results and financial position of all the foreign entities that have a functional
currency different from the presentation currency of the Company are translated
into the presentation currency as follows:
Assets and liabilities are translated at the closing rate at the end of the reporting
date.
Income and expenses for each statement of income are translated at average
exchange rates, unless this average is not a reasonable approximation of the
cumulative effect of the rates prevailing on the transaction dates, in which case
6362
income and expenses are translated at the rate on the dates of the transactions; and
all resulting exchange differences are recognized in other comprehensive income.
On consolidation, exchange differences arising from the translation of the
net investment in foreign operations are recognized in other comprehensive
income. When a foreign operation is partially disposed of or sold, the exchange
differences that were recorded in equity are reclassified as part of gains and losses
on disposition in the statement of income. When the Company loses control over
foreign subsidiaries, the exchange differences that were recorded in equity are
reclassified in the statement of income during the period when the gain or loss is
recognized in profit or loss.
Any goodwill arising on the acquisition of a foreign operation and any fair value
adjustments are treated as the foreign operation’s assets and liabilities. The goodwill
is expressed in the foreign operation’s functional currency and is translated at the
closing rate. Exchange differences should be recognized in other comprehensive
income.
2.5 Cash and Cash Equivalents
Cash and cash equivalents include cash on hand, deposits held at call with banks,
and other short-term highly liquid investments that are readily convertible to a
known amount of cash and are subject to an insignificant risk of change in value.
2.6 Financial Assets
(A) Classification
The Company classifies its financial assets in the following categories: at fair value
through profit or loss, loans and receivables, available-for-sale, and held-to-maturity
investments. The classification depends on the terms of the instruments and
purpose for which the financial assets were acquired. Management determines the
classification of its financial assets at initial recognition.
(1) Financial assets at fair value through profit or loss
Financial assets at fair value through profit or loss are financial assets held for
trading. A financial asset is classified in this category if acquired principally for the
purpose of selling in the short-term. Derivatives not subject to hedge accounting
and derivatives separated from financial instruments such as embedded
derivatives are also categorised as held for trading. Assets in this category are
classified as current assets.
(2) Loans and receivables
Loans and receivables are non-derivative financial assets with fixed or
determinable payments that are not quoted in an active market. They are
included in current assets, except for those with maturities greater than 12
months after the end of the reporting period which are classified as non-current
assets.
(3) Available-for-sale financial assets
Available-for-sale financial assets are non-derivatives that are either designated
in this category or not classified in any of the other categories. They are included
in non-current assets unless an investment matures or management intends to
dispose of it within 12 months of the end of the reporting period.
(B) Recognition and measurement
Regular purchases and sales of financial assets are recognized on the trade date.
Investments are initially recognized at fair value plus transaction costs for all financial
assets not carried at fair value through profit or loss. Financial assets carried at fair
value through profit or loss are initially recognized at fair value, and transaction costs
are expensed in the statement of income. Available-for-sale financial assets and
financial assets at fair value through profit or loss are subsequently carried at fair
value. Loans and receivables and held-to-maturity investments are subsequently
carried at amortized cost using the effective interest method.
Gains or losses arising from changes in the fair value of the financial assets at fair
value through profit or loss, including interest income, are presented as financial
income in the statement of income in the period in which they arise. Dividend
income from financial assets at fair value through profit or loss is recognized as other
non-operating income in the statement of income when the Company’s right to
receive payments is established.
Changes in the fair value of monetary and non-monetary securities classified as
available-for-sale are recognized in other comprehensive income. When securities
classified as available-for-sale are sold or impaired, the accumulated fair value
adjustments previously recognized in equity are transferred to the statement of
income under other nonoperating income or other expense items.
Interest on available-for-sale financial assets and held-to-maturity financial assets
calculated using the effective interest method is recognized in the statement of
income as part of finance income. Dividends on available-for-sale financial assets are
recognized in the statement of income as part of other non-operating income when
the Company’s right to receive payments is established.
(C) Offsetting financial instruments
Financial assets and liabilities are offset and the net amount reported in the
statement of financial position when there is a legally enforceable right to offset the
recognized amounts and there is an intention to settle on a net basis, or realize the
asset and settle the liability simultaneously.
(D) Derecognition of financial assets
Financial assets are derecognized when the contractual rights to the cash flows from
the financial asset expire, when the Company transfers the contractual rights to
receive the cash flows of the financial asset and substantially all the risks and rewards
of ownership, or when the Company neither transfers nor retains substantially all the
risks and rewards of ownership of the financial asset and has not retained control of
the financial asset.
Financial liabilities that arise through a transfer of receivables in factoring
arrangements with recourse do not qualify for derecognition since the Company
retains substantially all the risks and rewards associated with the receivables.. Such
liabilities are classified as short-term borrowings in the consolidated statement of
financial position.
2.7 Impairment of Financial Assets
(A) Assets carried at amortized cost
The Company assesses at the end of each reporting period whether there is objective
evidence that a financial asset or group of financial assets is impaired. A financial
asset or a group of financial assets is impaired and impairment loss is recognized
only if there is objective evidence of impairment as a result of one or more events
that occurred after the initial recognition of the asset or group of financial assets (a
‘loss event’) and that loss event (or events) has an impact on the estimated future
cash flows of the financial asset or group of financial assets that can be reliably
estimated.
The following represent some of the factors that could lead the Company to assess
that there is objective evidence that a financial asset or group of assets is impaired:
- significant financial difficulty of the issuer or obligor;
- delinquency in interest or principal payments;
- the lender, for economic or legal reasons relating to the borrower's financial
difficulty, grants to the borrower a concession that the lender would not otherwise
consider;
- it becoming probable that the borrower will enter bankruptcy or other financial
reorganisation;
- the disappearance of an active market for that financial asset because of financial
difficulties; or
- observable data indicating that there is a measurable decrease in the
estimated future cash flows from a group of financial assets since the
initial recognition of those assets, although the decrease cannot yet
be identified with the individual financial assets in the group, including:
1) adverse changes in the payment status of borrowers in the group; or
2) national or local economic conditions that correlate with defaults on the assets
in the group.
The amount of the loss is measured as the difference between the asset’s carrying
amount and the present value of estimated future cash flows (excluding future
credit losses that have not been incurred) discounted at the financial asset’s original
effective interest rate. The carrying amount of the asset is reduced and the amount
of the loss is recognized in the consolidated statement of income. In cases of
floating rate financial assets, the amount of the loss will be computed using the
present effective interest rate determined by the contract. As a practical expedient,
the Company may measure impairment on the basis of an instrument’s fair value
using an observable market price.
If, in a subsequent period, the amount of the impairment loss decreases and the
decrease can be related objectively to an event occurring after the impairment
was recognized (such as an improvement in the debtor’s credit rating), the reversal
of the previously recognized impairment loss is recognized in the consolidated
statement of income.
(B) Financial Instruments Classified as Available-for-sale
The Company assesses at the end of each reporting period whether there is
objective evidence that a financial asset or a group of financial assets is impaired.
Debt instruments are accounted for using the provisions described in (1). In the
case of equity investments classified as available-for-sale, a 20% or greater decline
in the fair value of the security below its cost or a continuous decline for more than
6 months is also evidence of impairment. If any such evidence exists for available-
for-sale financial assets, the cumulative loss – measured as the difference between
the acquisition cost and the current fair value, less any impairment loss on that
financial asset previously recognized in profit or loss – is removed from equity
and recognized in the consolidated statement of income. Impairment losses on
equity instruments recognized in the consolidated statement of income are not
reversed through the consolidated statement of income. If, in a subsequent period,
the fair value of a debt instrument classified as available-for-sale increases and the
increase can be objectively related to an event occurring after the impairment
loss was recognized in profit or loss, the impairment loss is reversed through the
consolidated statement of income.
2.8 Trade Receivables
Trade receivables are amounts due from customers for merchandise sold or
services performed in the ordinary course of business. If collection is expected in
one year or less (or in the normal operating cycle of the Company if longer), they are
classified as current assets. If not, they are presented as non-current assets. Trade
receivables are recognized initially at fair value and subsequently measured at
amortized cost using the effective interest method, less provision for impairment.
2.9 Inventories
Inventories are stated at the lower of cost and net realizable value. Cost is
determined using the average cost method, except for materials-in-transit. The cost
of finished goods and work in progress comprises design costs, raw materials,
direct labor, other direct costs and related production overheads (based on
normal operating capacity). It excludes costs of idle plant and abnormal waste. Net
realizable value is the estimated selling price in the ordinary course of business, less
applicable variable selling expenses.
Inventories are reduced for the estimated losses arising from excess, obsolescence,
and decline in value. This reduction is determined by estimating market value based
on future customer demand. The losses on inventory obsolescence are recorded as
a part of cost of sales.
2.10 Disposal Groups Classified as Held for Sale
When the carrying amount of certain assets and liabilities are expected to be
recovered through sale and the sale of a disposable group is highly probable, such
assets and liabilities are classified as held for sale and measured at the lower of their
carrying amount and fair value.
2.11 Property, Plant and Equipment
Property, plant and equipment are stated at cost less accumulated depreciation
and accumulated impairment losses. Historical cost includes expenditures that are
directly attributable to the acquisition of the items. Subsequent costs are included
in the asset’s carrying amount or recognized as a separate asset, as appropriate,
only when it is probable that future economic benefits associated with the item
will flow to the Company and the cost of the item can be measured reliably. The
carrying amount of those parts that are replaced is derecognized and repairs
and maintenance expenses are recognized in profit or loss in the period they are
incurred.
Depreciation on tangible assets is calculated using the straight-line method to
allocate their cost to their residual values over their estimated useful lives. Land is
not depreciated. Costs that are directly attributable to the acquisition, construction
or production of a qualifying asset, including capitalized interest costs, form part of
the cost of that asset and are amortized over the estimated useful lives.
6564
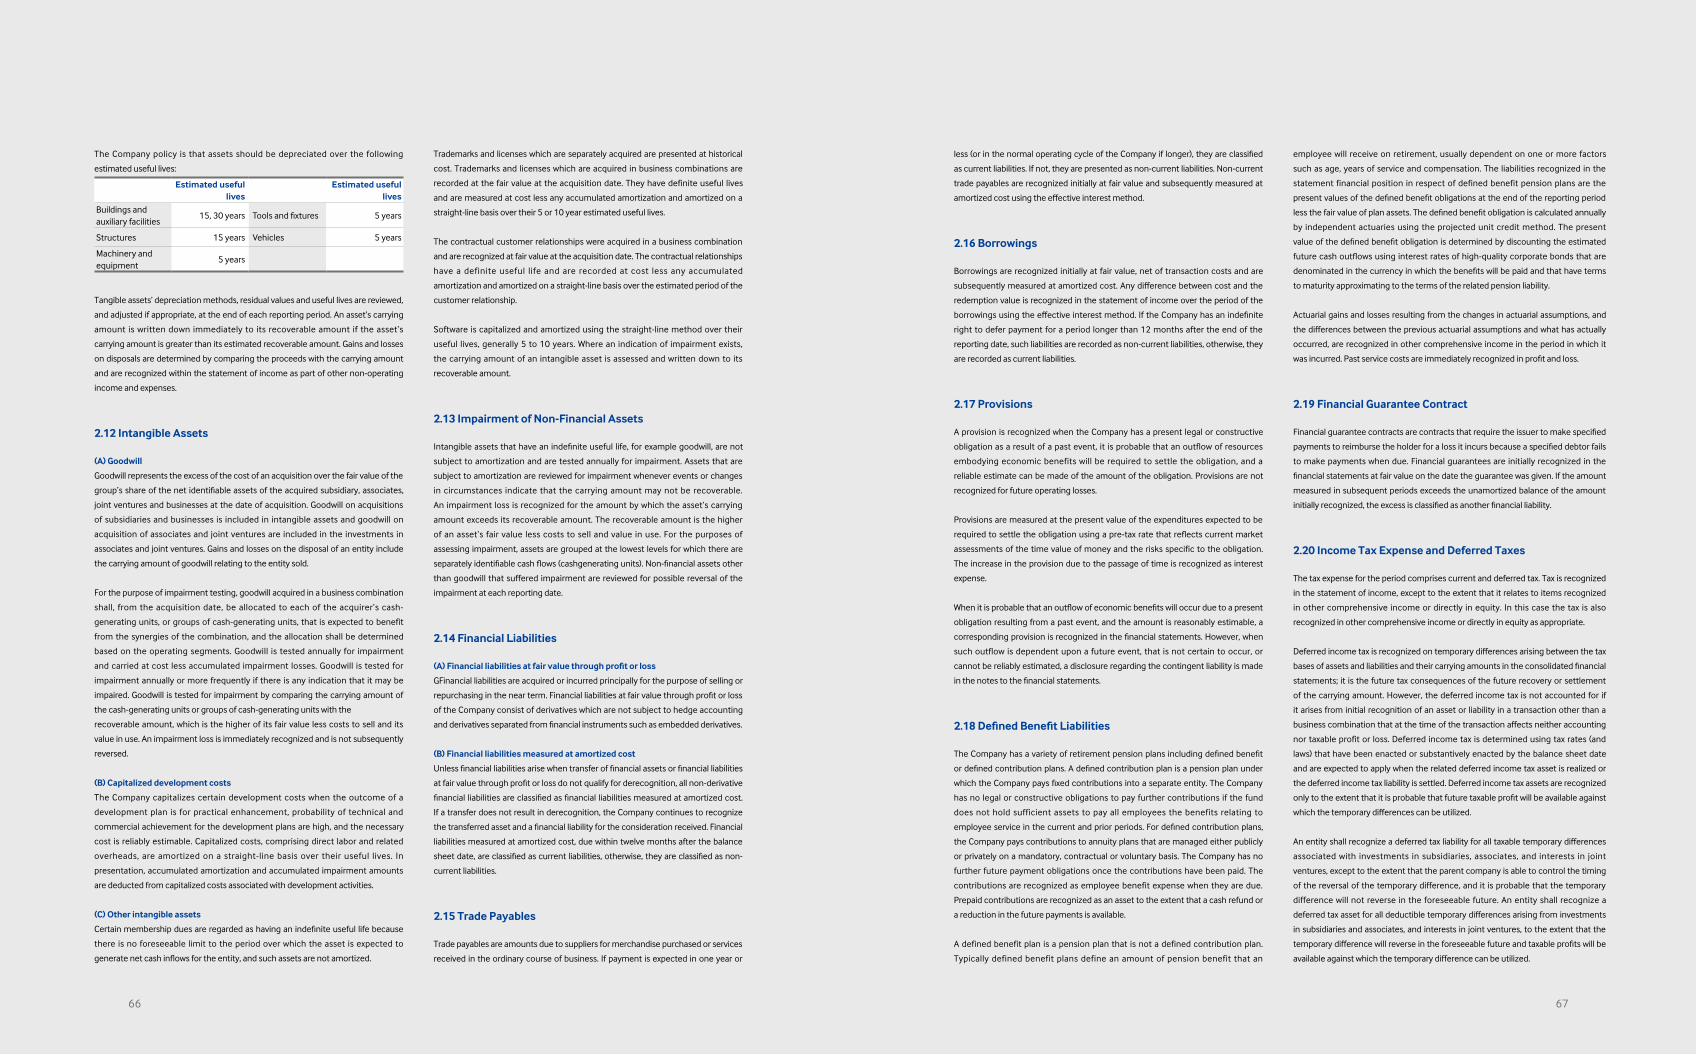
The Company policy is that assets should be depreciated over the following
estimated useful lives:
Estimated useful lives
Estimated useful lives
Buildings and auxiliary facilities
15, 30 years Tools and fixtures 5 years
Structures 15 years Vehicles 5 years
Machinery and equipment
5 years
Tangible assets’ depreciation methods, residual values and useful lives are reviewed,
and adjusted if appropriate, at the end of each reporting period. An asset’s carrying
amount is written down immediately to its recoverable amount if the asset’s
carrying amount is greater than its estimated recoverable amount. Gains and losses
on disposals are determined by comparing the proceeds with the carrying amount
and are recognized within the statement of income as part of other non-operating
income and expenses.
2.12 Intangible Assets
(A) Goodwill
Goodwill represents the excess of the cost of an acquisition over the fair value of the
group’s share of the net identifiable assets of the acquired subsidiary, associates,
joint ventures and businesses at the date of acquisition. Goodwill on acquisitions
of subsidiaries and businesses is included in intangible assets and goodwill on
acquisition of associates and joint ventures are included in the investments in
associates and joint ventures. Gains and losses on the disposal of an entity include
the carrying amount of goodwill relating to the entity sold.
For the purpose of impairment testing, goodwill acquired in a business combination
shall, from the acquisition date, be allocated to each of the acquirer’s cash-
generating units, or groups of cash-generating units, that is expected to benefit
from the synergies of the combination, and the allocation shall be determined
based on the operating segments. Goodwill is tested annually for impairment
and carried at cost less accumulated impairment losses. Goodwill is tested for
impairment annually or more frequently if there is any indication that it may be
impaired. Goodwill is tested for impairment by comparing the carrying amount of
the cash-generating units or groups of cash-generating units with the
recoverable amount, which is the higher of its fair value less costs to sell and its
value in use. An impairment loss is immediately recognized and is not subsequently
reversed.
(B) Capitalized development costs
The Company capitalizes certain development costs when the outcome of a
development plan is for practical enhancement, probability of technical and
commercial achievement for the development plans are high, and the necessary
cost is reliably estimable. Capitalized costs, comprising direct labor and related
overheads, are amortized on a straight-line basis over their useful lives. In
presentation, accumulated amortization and accumulated impairment amounts
are deducted from capitalized costs associated with development activities.
(C) Other intangible assets
Certain membership dues are regarded as having an indefinite useful life because
there is no foreseeable limit to the period over which the asset is expected to
generate net cash inflows for the entity, and such assets are not amortized.
Trademarks and licenses which are separately acquired are presented at historical
cost. Trademarks and licenses which are acquired in business combinations are
recorded at the fair value at the acquisition date. They have definite useful lives
and are measured at cost less any accumulated amortization and amortized on a
straight-line basis over their 5 or 10 year estimated useful lives.
The contractual customer relationships were acquired in a business combination
and are recognized at fair value at the acquisition date. The contractual relationships
have a definite useful life and are recorded at cost less any accumulated
amortization and amortized on a straight-line basis over the estimated period of the
customer relationship.
Software is capitalized and amortized using the straight-line method over their
useful lives, generally 5 to 10 years. Where an indication of impairment exists,
the carrying amount of an intangible asset is assessed and written down to its
recoverable amount.
2.13 Impairment of Non-Financial Assets
Intangible assets that have an indefinite useful life, for example goodwill, are not
subject to amortization and are tested annually for impairment. Assets that are
subject to amortization are reviewed for impairment whenever events or changes
in circumstances indicate that the carrying amount may not be recoverable.
An impairment loss is recognized for the amount by which the asset’s carrying
amount exceeds its recoverable amount. The recoverable amount is the higher
of an asset’s fair value less costs to sell and value in use. For the purposes of
assessing impairment, assets are grouped at the lowest levels for which there are
separately identifiable cash flows (cashgenerating units). Non-financial assets other
than goodwill that suffered impairment are reviewed for possible reversal of the
impairment at each reporting date.
2.14 Financial Liabilities
(A) Financial liabilities at fair value through profit or loss
GFinancial liabilities are acquired or incurred principally for the purpose of selling or
repurchasing in the near term. Financial liabilities at fair value through profit or loss
of the Company consist of derivatives which are not subject to hedge accounting
and derivatives separated from financial instruments such as embedded derivatives.
(B) Financial liabilities measured at amortized cost
Unless financial liabilities arise when transfer of financial assets or financial liabilities
at fair value through profit or loss do not qualify for derecognition, all non-derivative
financial liabilities are classified as financial liabilities measured at amortized cost.
If a transfer does not result in derecognition, the Company continues to recognize
the transferred asset and a financial liability for the consideration received. Financial
liabilities measured at amortized cost, due within twelve months after the balance
sheet date, are classified as current liabilities, otherwise, they are classified as non-
current liabilities.
2.15 Trade Payables
Trade payables are amounts due to suppliers for merchandise purchased or services
received in the ordinary course of business. If payment is expected in one year or
less (or in the normal operating cycle of the Company if longer), they are classified
as current liabilities. If not, they are presented as non-current liabilities. Non-current
trade payables are recognized initially at fair value and subsequently measured at
amortized cost using the effective interest method.
2.16 Borrowings
Borrowings are recognized initially at fair value, net of transaction costs and are
subsequently measured at amortized cost. Any difference between cost and the
redemption value is recognized in the statement of income over the period of the
borrowings using the effective interest method. If the Company has an indefinite
right to defer payment for a period longer than 12 months after the end of the
reporting date, such liabilities are recorded as non-current liabilities, otherwise, they
are recorded as current liabilities.
2.17 Provisions
A provision is recognized when the Company has a present legal or constructive
obligation as a result of a past event, it is probable that an outflow of resources
embodying economic benefits will be required to settle the obligation, and a
reliable estimate can be made of the amount of the obligation. Provisions are not
recognized for future operating losses.
Provisions are measured at the present value of the expenditures expected to be
required to settle the obligation using a pre-tax rate that reflects current market
assessments of the time value of money and the risks specific to the obligation.
The increase in the provision due to the passage of time is recognized as interest
expense.
When it is probable that an outflow of economic benefits will occur due to a present
obligation resulting from a past event, and the amount is reasonably estimable, a
corresponding provision is recognized in the financial statements. However, when
such outflow is dependent upon a future event, that is not certain to occur, or
cannot be reliably estimated, a disclosure regarding the contingent liability is made
in the notes to the financial statements.
2.18 Defined Benefit Liabilities
The Company has a variety of retirement pension plans including defined benefit
or defined contribution plans. A defined contribution plan is a pension plan under
which the Company pays fixed contributions into a separate entity. The Company
has no legal or constructive obligations to pay further contributions if the fund
does not hold sufficient assets to pay all employees the benefits relating to
employee service in the current and prior periods. For defined contribution plans,
the Company pays contributions to annuity plans that are managed either publicly
or privately on a mandatory, contractual or voluntary basis. The Company has no
further future payment obligations once the contributions have been paid. The
contributions are recognized as employee benefit expense when they are due.
Prepaid contributions are recognized as an asset to the extent that a cash refund or
a reduction in the future payments is available.
A defined benefit plan is a pension plan that is not a defined contribution plan.
Typically defined benefit plans define an amount of pension benefit that an
employee will receive on retirement, usually dependent on one or more factors
such as age, years of service and compensation. The liabilities recognized in the
statement financial position in respect of defined benefit pension plans are the
present values of the defined benefit obligations at the end of the reporting period
less the fair value of plan assets. The defined benefit obligation is calculated annually
by independent actuaries using the projected unit credit method. The present
value of the defined benefit obligation is determined by discounting the estimated
future cash outflows using interest rates of high-quality corporate bonds that are
denominated in the currency in which the benefits will be paid and that have terms
to maturity approximating to the terms of the related pension liability.
Actuarial gains and losses resulting from the changes in actuarial assumptions, and
the differences between the previous actuarial assumptions and what has actually
occurred, are recognized in other comprehensive income in the period in which it
was incurred. Past service costs are immediately recognized in profit and loss.
2.19 Financial Guarantee Contract
Financial guarantee contracts are contracts that require the issuer to make specified
payments to reimburse the holder for a loss it incurs because a specified debtor fails
to make payments when due. Financial guarantees are initially recognized in the
financial statements at fair value on the date the guarantee was given. If the amount
measured in subsequent periods exceeds the unamortized balance of the amount
initially recognized, the excess is classified as another financial liability.
2.20 Income Tax Expense and Deferred Taxes
The tax expense for the period comprises current and deferred tax. Tax is recognized
in the statement of income, except to the extent that it relates to items recognized
in other comprehensive income or directly in equity. In this case the tax is also
recognized in other comprehensive income or directly in equity as appropriate.
Deferred income tax is recognized on temporary differences arising between the tax
bases of assets and liabilities and their carrying amounts in the consolidated financial
statements; it is the future tax consequences of the future recovery or settlement
of the carrying amount. However, the deferred income tax is not accounted for if
it arises from initial recognition of an asset or liability in a transaction other than a
business combination that at the time of the transaction affects neither accounting
nor taxable profit or loss. Deferred income tax is determined using tax rates (and
laws) that have been enacted or substantively enacted by the balance sheet date
and are expected to apply when the related deferred income tax asset is realized or
the deferred income tax liability is settled. Deferred income tax assets are recognized
only to the extent that it is probable that future taxable profit will be available against
which the temporary differences can be utilized.
An entity shall recognize a deferred tax liability for all taxable temporary differences
associated with investments in subsidiaries, associates, and interests in joint
ventures, except to the extent that the parent company is able to control the timing
of the reversal of the temporary difference, and it is probable that the temporary
difference will not reverse in the foreseeable future. An entity shall recognize a
deferred tax asset for all deductible temporary differences arising from investments
in subsidiaries and associates, and interests in joint ventures, to the extent that the
temporary difference will reverse in the foreseeable future and taxable profits will be
available against which the temporary difference can be utilized.
6766
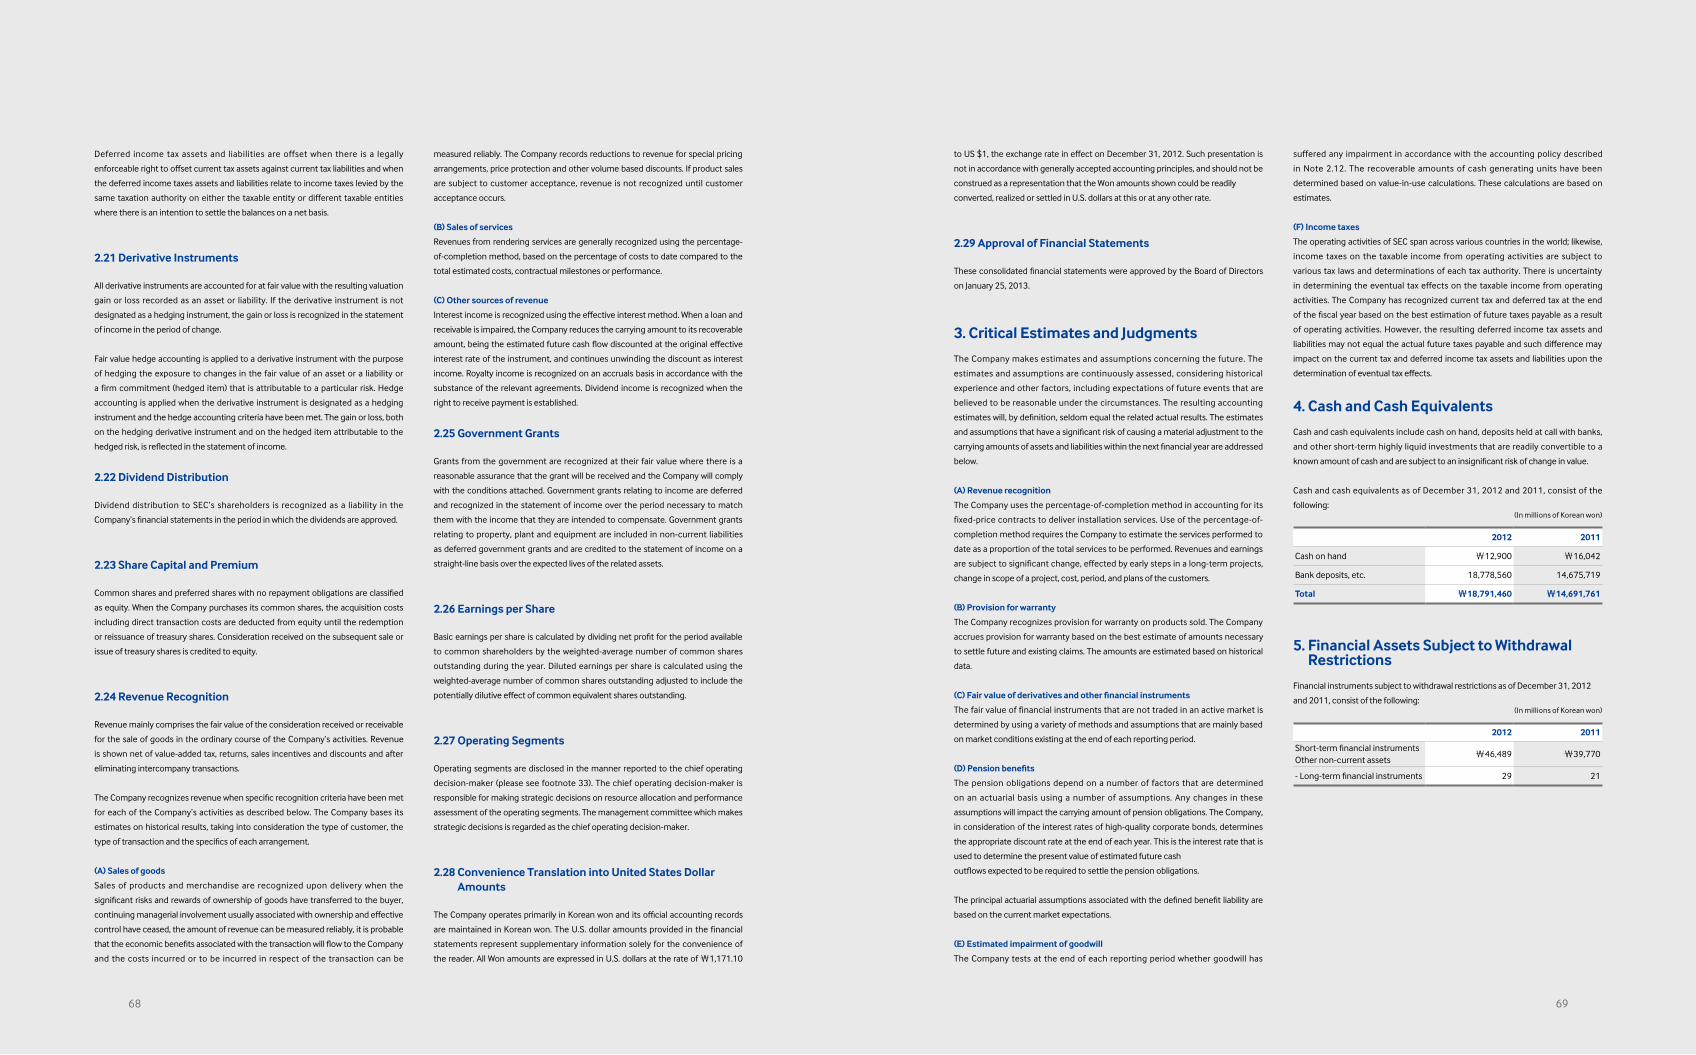
Deferred income tax assets and liabilities are offset when there is a legally
enforceable right to offset current tax assets against current tax liabilities and when
the deferred income taxes assets and liabilities relate to income taxes levied by the
same taxation authority on either the taxable entity or different taxable entities
where there is an intention to settle the balances on a net basis.
2.21 Derivative Instruments
All derivative instruments are accounted for at fair value with the resulting valuation
gain or loss recorded as an asset or liability. If the derivative instrument is not
designated as a hedging instrument, the gain or loss is recognized in the statement
of income in the period of change.
Fair value hedge accounting is applied to a derivative instrument with the purpose
of hedging the exposure to changes in the fair value of an asset or a liability or
a firm commitment (hedged item) that is attributable to a particular risk. Hedge
accounting is applied when the derivative instrument is designated as a hedging
instrument and the hedge accounting criteria have been met. The gain or loss, both
on the hedging derivative instrument and on the hedged item attributable to the
hedged risk, is reflected in the statement of income.
2.22 Dividend Distribution
Dividend distribution to SEC’s shareholders is recognized as a liability in the
Company’s financial statements in the period in which the dividends are approved.
2.23 Share Capital and Premium
Common shares and preferred shares with no repayment obligations are classified
as equity. When the Company purchases its common shares, the acquisition costs
including direct transaction costs are deducted from equity until the redemption
or reissuance of treasury shares. Consideration received on the subsequent sale or
issue of treasury shares is credited to equity.
2.24 Revenue Recognition
Revenue mainly comprises the fair value of the consideration received or receivable
for the sale of goods in the ordinary course of the Company’s activities. Revenue
is shown net of value-added tax, returns, sales incentives and discounts and after
eliminating intercompany transactions.
The Company recognizes revenue when specific recognition criteria have been met
for each of the Company’s activities as described below. The Company bases its
estimates on historical results, taking into consideration the type of customer, the
type of transaction and the specifics of each arrangement.
(A) Sales of goods
Sales of products and merchandise are recognized upon delivery when the
significant risks and rewards of ownership of goods have transferred to the buyer,
continuing managerial involvement usually associated with ownership and effective
control have ceased, the amount of revenue can be measured reliably, it is probable
that the economic benefits associated with the transaction will flow to the Company
and the costs incurred or to be incurred in respect of the transaction can be
to US $1, the exchange rate in effect on December 31, 2012. Such presentation is
not in accordance with generally accepted accounting principles, and should not be
construed as a representation that the Won amounts shown could be readily
converted, realized or settled in U.S. dollars at this or at any other rate.
2.29 Approval of Financial Statements
These consolidated financial statements were approved by the Board of Directors
on January 25, 2013.
3. Critical Estimates and Judgments
The Company makes estimates and assumptions concerning the future. The
estimates and assumptions are continuously assessed, considering historical
experience and other factors, including expectations of future events that are
believed to be reasonable under the circumstances. The resulting accounting
estimates will, by definition, seldom equal the related actual results. The estimates
and assumptions that have a significant risk of causing a material adjustment to the
carrying amounts of assets and liabilities within the next financial year are addressed
below.
(A) Revenue recognition
The Company uses the percentage-of-completion method in accounting for its
fixed-price contracts to deliver installation services. Use of the percentage-of-
completion method requires the Company to estimate the services performed to
date as a proportion of the total services to be performed. Revenues and earnings
are subject to significant change, effected by early steps in a long-term projects,
change in scope of a project, cost, period, and plans of the customers.
(B) Provision for warranty
The Company recognizes provision for warranty on products sold. The Company
accrues provision for warranty based on the best estimate of amounts necessary
to settle future and existing claims. The amounts are estimated based on historical
data.
(C) Fair value of derivatives and other financial instruments
The fair value of financial instruments that are not traded in an active market is
determined by using a variety of methods and assumptions that are mainly based
on market conditions existing at the end of each reporting period.
(D) Pension benefits
The pension obligations depend on a number of factors that are determined
on an actuarial basis using a number of assumptions. Any changes in these
assumptions will impact the carrying amount of pension obligations. The Company,
in consideration of the interest rates of high-quality corporate bonds, determines
the appropriate discount rate at the end of each year. This is the interest rate that is
used to determine the present value of estimated future cash
outflows expected to be required to settle the pension obligations.
The principal actuarial assumptions associated with the defined benefit liability are
based on the current market expectations.
(E) Estimated impairment of goodwill
The Company tests at the end of each reporting period whether goodwill has
suffered any impairment in accordance with the accounting policy described
in Note 2.12. The recoverable amounts of cash generating units have been
determined based on value-in-use calculations. These calculations are based on
estimates.
(F) Income taxes
The operating activities of SEC span across various countries in the world; likewise,
income taxes on the taxable income from operating activities are subject to
various tax laws and determinations of each tax authority. There is uncertainty
in determining the eventual tax effects on the taxable income from operating
activities. The Company has recognized current tax and deferred tax at the end
of the fiscal year based on the best estimation of future taxes payable as a result
of operating activities. However, the resulting deferred income tax assets and
liabilities may not equal the actual future taxes payable and such difference may
impact on the current tax and deferred income tax assets and liabilities upon the
determination of eventual tax effects.
4. Cash and Cash Equivalents
Cash and cash equivalents include cash on hand, deposits held at call with banks,
and other short-term highly liquid investments that are readily convertible to a
known amount of cash and are subject to an insignificant risk of change in value.
Cash and cash equivalents as of December 31, 2012 and 2011, consist of the
following:(In millions of Korean won)
2012 2011
Cash on hand ₩12,900 ₩16,042
Bank deposits, etc. 18,778,560 14,675,719
Total ₩18,791,460 ₩14,691,761
5. Financial Assets Subject to Withdrawal Restrictions
Financial instruments subject to withdrawal restrictions as of December 31, 2012
and 2011, consist of the following:(In millions of Korean won)
2012 2011
Short-term financial instrumentsOther non-current assets
₩46,489 ₩39,770
- Long-term financial instruments 29 21
6968
measured reliably. The Company records reductions to revenue for special pricing
arrangements, price protection and other volume based discounts. If product sales
are subject to customer acceptance, revenue is not recognized until customer
acceptance occurs.
(B) Sales of services
Revenues from rendering services are generally recognized using the percentage-
of-completion method, based on the percentage of costs to date compared to the
total estimated costs, contractual milestones or performance.
(C) Other sources of revenue
Interest income is recognized using the effective interest method. When a loan and
receivable is impaired, the Company reduces the carrying amount to its recoverable
amount, being the estimated future cash flow discounted at the original effective
interest rate of the instrument, and continues unwinding the discount as interest
income. Royalty income is recognized on an accruals basis in accordance with the
substance of the relevant agreements. Dividend income is recognized when the
right to receive payment is established.
2.25 Government Grants
Grants from the government are recognized at their fair value where there is a
reasonable assurance that the grant will be received and the Company will comply
with the conditions attached. Government grants relating to income are deferred
and recognized in the statement of income over the period necessary to match
them with the income that they are intended to compensate. Government grants
relating to property, plant and equipment are included in non-current liabilities
as deferred government grants and are credited to the statement of income on a
straight-line basis over the expected lives of the related assets.
2.26 Earnings per Share
Basic earnings per share is calculated by dividing net profit for the period available
to common shareholders by the weighted-average number of common shares
outstanding during the year. Diluted earnings per share is calculated using the
weighted-average number of common shares outstanding adjusted to include the
potentially dilutive effect of common equivalent shares outstanding.
2.27 Operating Segments
Operating segments are disclosed in the manner reported to the chief operating
decision-maker (please see footnote 33). The chief operating decision-maker is
responsible for making strategic decisions on resource allocation and performance
assessment of the operating segments. The management committee which makes
strategic decisions is regarded as the chief operating decision-maker.
2.28 Convenience Translation into United States Dollar Amounts
The Company operates primarily in Korean won and its official accounting records
are maintained in Korean won. The U.S. dollar amounts provided in the financial
statements represent supplementary information solely for the convenience of
the reader. All Won amounts are expressed in U.S. dollars at the rate of ₩1,171.10
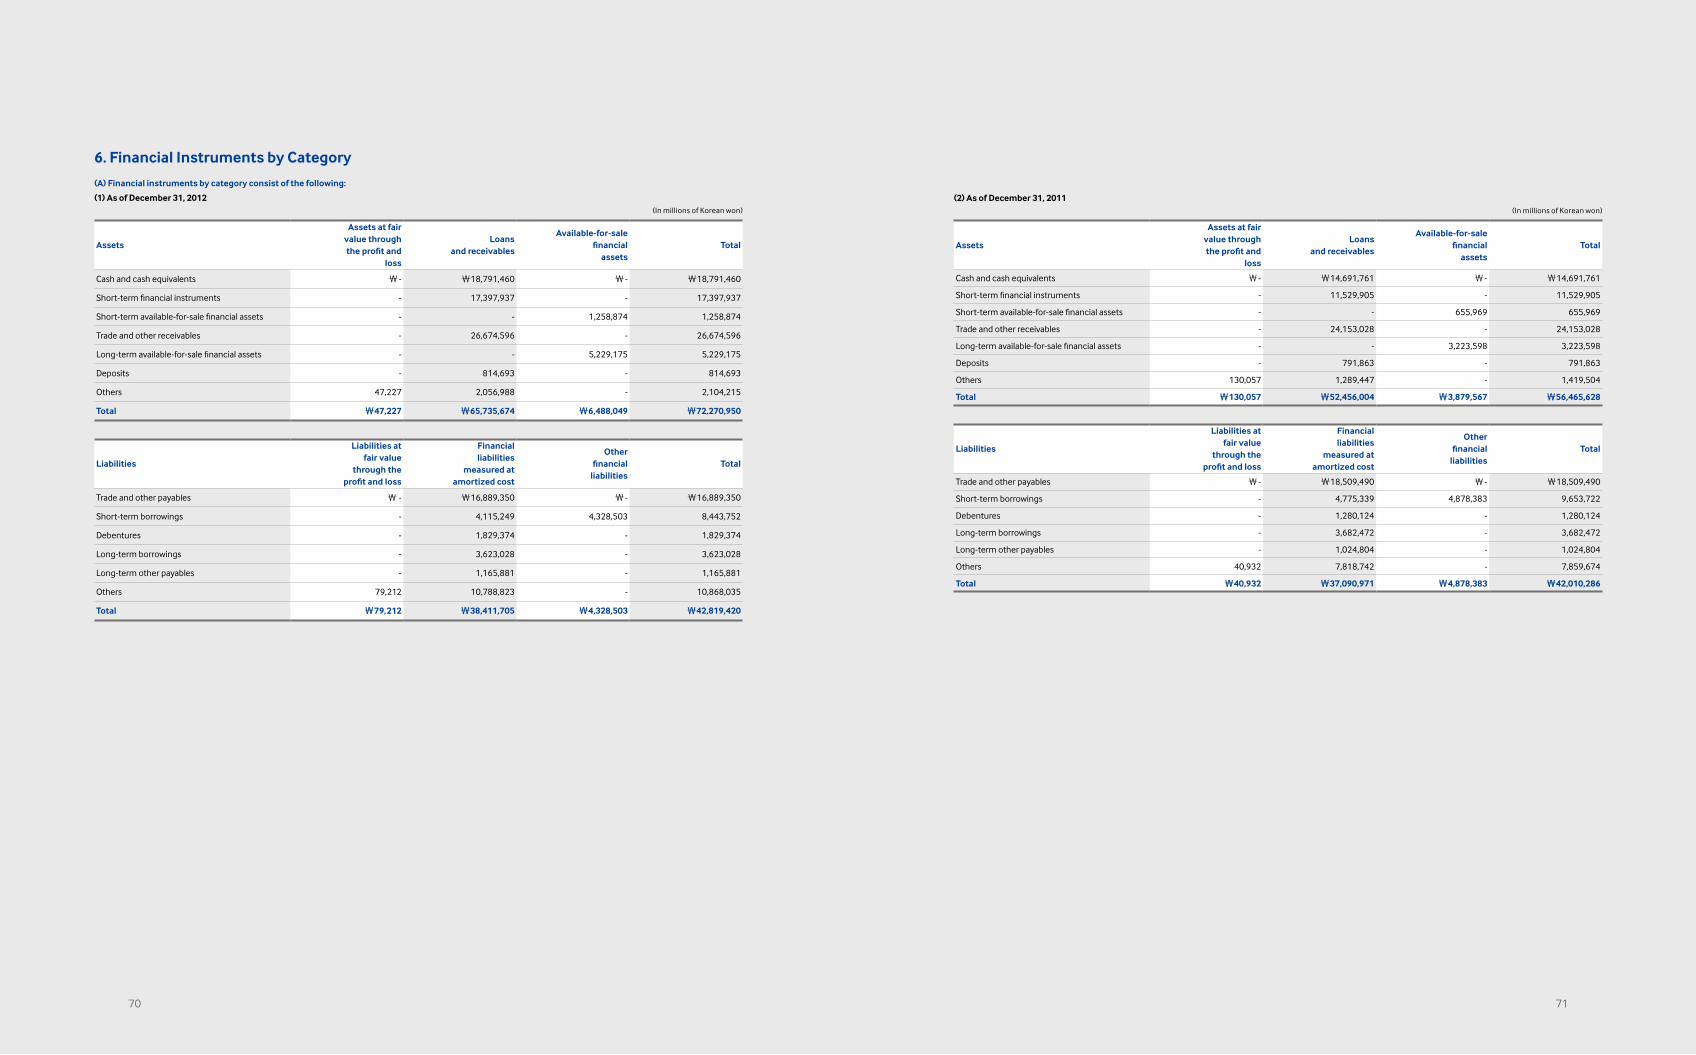
(2) As of December 31, 2011(In millions of Korean won)
Assets
Assets at fairvalue throughthe profit and
loss
Loansand receivables
Available-for-salefinancial
assetsTotal
Cash and cash equivalents ₩- ₩14,691,761 ₩- ₩14,691,761
Short-term financial instruments - 11,529,905 - 11,529,905
Short-term available-for-sale financial assets - - 655,969 655,969
Trade and other receivables - 24,153,028 - 24,153,028
Long-term available-for-sale financial assets - - 3,223,598 3,223,598
Deposits - 791,863 - 791,863
Others 130,057 1,289,447 - 1,419,504
Total ₩130,057 ₩52,456,004 ₩3,879,567 ₩56,465,628
Liabilities
Liabilities atfair value
through theprofit and loss
Financialliabilities
measured atamortized cost
Otherfinancial
liabilitiesTotal
Trade and other payables ₩- ₩18,509,490 ₩- ₩18,509,490
Short-term borrowings - 4,775,339 4,878,383 9,653,722
Debentures - 1,280,124 - 1,280,124
Long-term borrowings - 3,682,472 - 3,682,472
Long-term other payables - 1,024,804 - 1,024,804
Others 40,932 7,818,742 - 7,859,674
Total ₩40,932 ₩37,090,971 ₩4,878,383 ₩42,010,286
7170
6. Financial Instruments by Category
(A) Financial instruments by category consist of the following:
(1) As of December 31, 2012(In millions of Korean won)
Assets
Assets at fairvalue throughthe profit and
loss
Loansand receivables
Available-for-salefinancial
assetsTotal
Cash and cash equivalents ₩- ₩18,791,460 ₩- ₩18,791,460
Short-term financial instruments - 17,397,937 - 17,397,937
Short-term available-for-sale financial assets - - 1,258,874 1,258,874
Trade and other receivables - 26,674,596 - 26,674,596
Long-term available-for-sale financial assets - - 5,229,175 5,229,175
Deposits - 814,693 - 814,693
Others 47,227 2,056,988 - 2,104,215
Total ₩47,227 ₩65,735,674 ₩6,488,049 ₩72,270,950
Liabilities
Liabilities atfair value
through theprofit and loss
Financialliabilities
measured atamortized cost
Otherfinancial
liabilitiesTotal
Trade and other payables ₩ - ₩16,889,350 ₩- ₩16,889,350
Short-term borrowings - 4,115,249 4,328,503 8,443,752
Debentures - 1,829,374 - 1,829,374
Long-term borrowings - 3,623,028 - 3,623,028
Long-term other payables - 1,165,881 - 1,165,881
Others 79,212 10,788,823 - 10,868,035
Total ₩79,212 ₩38,411,705 ₩4,328,503 ₩42,819,420
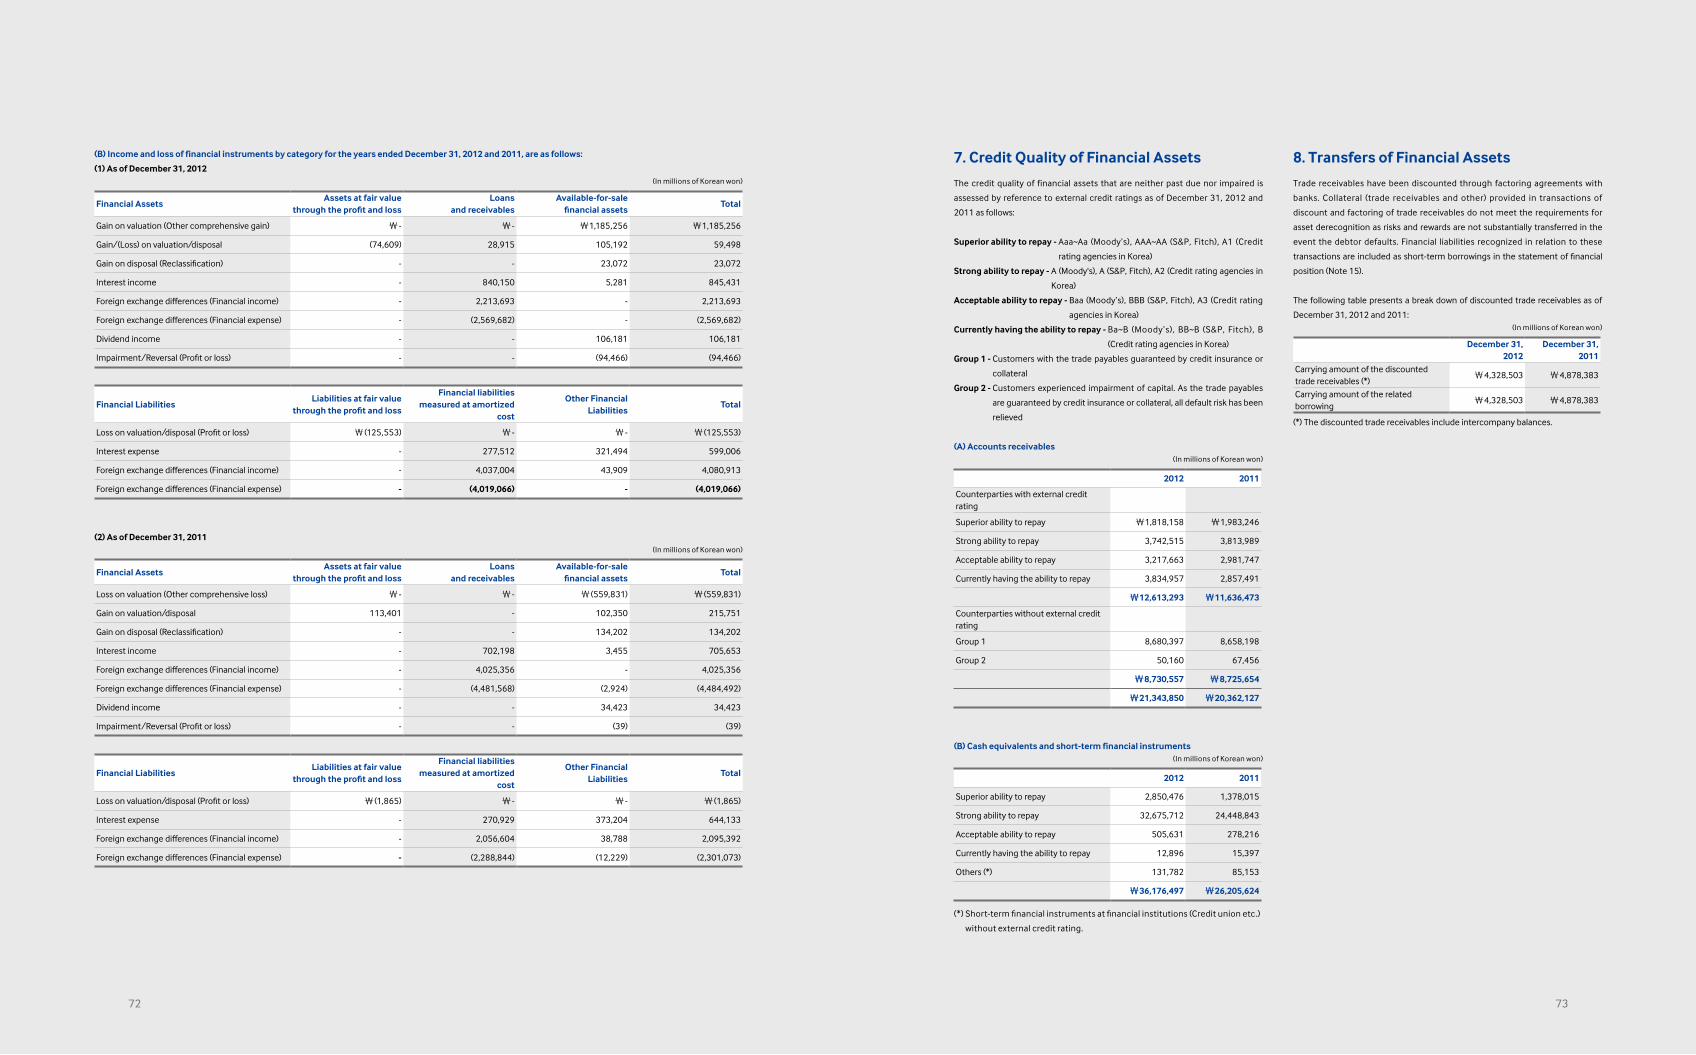
(B) Income and loss of financial instruments by category for the years ended December 31, 2012 and 2011, are as follows:
(1) As of December 31, 2012(In millions of Korean won)
Financial AssetsAssets at fair value
through the profit and lossLoans
and receivablesAvailable-for-sale
financial assetsTotal
Gain on valuation (Other comprehensive gain) ₩- ₩- ₩1,185,256 ₩1,185,256
Gain/(Loss) on valuation/disposal (74,609) 28,915 105,192 59,498
Gain on disposal (Reclassification) - - 23,072 23,072
Interest income - 840,150 5,281 845,431
Foreign exchange differences (Financial income) - 2,213,693 - 2,213,693
Foreign exchange differences (Financial expense) - (2,569,682) - (2,569,682)
Dividend income - - 106,181 106,181
Impairment/Reversal (Profit or loss) - - (94,466) (94,466)
Financial LiabilitiesLiabilities at fair value
through the profit and loss
Financial liabilitiesmeasured at amortized
cost
Other FinancialLiabilities
Total
Loss on valuation/disposal (Profit or loss) ₩(125,553) ₩- ₩- ₩(125,553)
Interest expense - 277,512 321,494 599,006
Foreign exchange differences (Financial income) - 4,037,004 43,909 4,080,913
Foreign exchange differences (Financial expense) - (4,019,066) - (4,019,066)
(2) As of December 31, 2011(In millions of Korean won)
Financial AssetsAssets at fair value
through the profit and lossLoans
and receivablesAvailable-for-sale
financial assetsTotal
Loss on valuation (Other comprehensive loss) ₩- ₩- ₩(559,831) ₩(559,831)
Gain on valuation/disposal 113,401 - 102,350 215,751
Gain on disposal (Reclassification) - - 134,202 134,202
Interest income - 702,198 3,455 705,653
Foreign exchange differences (Financial income) - 4,025,356 - 4,025,356
Foreign exchange differences (Financial expense) - (4,481,568) (2,924) (4,484,492)
Dividend income - - 34,423 34,423
Impairment/Reversal (Profit or loss) - - (39) (39)
Financial LiabilitiesLiabilities at fair value
through the profit and loss
Financial liabilitiesmeasured at amortized
cost
Other FinancialLiabilities
Total
Loss on valuation/disposal (Profit or loss) ₩(1,865) ₩- ₩- ₩(1,865)
Interest expense - 270,929 373,204 644,133
Foreign exchange differences (Financial income) - 2,056,604 38,788 2,095,392
Foreign exchange differences (Financial expense) - (2,288,844) (12,229) (2,301,073)
7. Credit Quality of Financial Assets
The credit quality of financial assets that are neither past due nor impaired is
assessed by reference to external credit ratings as of December 31, 2012 and
2011 as follows:
Superior ability to repay - Aaa~Aa (Moody’s), AAA~AA (S&P, Fitch), A1 (Credit
rating agencies in Korea)
Strong ability to repay - A (Moody's), A (S&P, Fitch), A2 (Credit rating agencies in
Korea)
Acceptable ability to repay - Baa (Moody’s), BBB (S&P, Fitch), A3 (Credit rating
agencies in Korea)
Currently having the ability to repay - Ba~B (Moody’s), BB~B (S&P, Fitch), B
(Credit rating agencies in Korea)
Group 1 - Customers with the trade payables guaranteed by credit insurance or
collateral
Group 2 - Customers experienced impairment of capital. As the trade payables
are guaranteed by credit insurance or collateral, all default risk has been
relieved
(A) Accounts receivables(In millions of Korean won)
2012 2011
Counterparties with external credit rating
Superior ability to repay ₩1,818,158 ₩1,983,246
Strong ability to repay 3,742,515 3,813,989
Acceptable ability to repay 3,217,663 2,981,747
Currently having the ability to repay 3,834,957 2,857,491
₩12,613,293 ₩11,636,473
Counterparties without external credit rating
Group 1 8,680,397 8,658,198
Group 2 50,160 67,456
₩8,730,557 ₩8,725,654
₩21,343,850 ₩20,362,127
(B) Cash equivalents and short-term financial instruments(In millions of Korean won)
2012 2011
Superior ability to repay 2,850,476 1,378,015
Strong ability to repay 32,675,712 24,448,843
Acceptable ability to repay 505,631 278,216
Currently having the ability to repay 12,896 15,397
Others (*) 131,782 85,153
₩36,176,497 ₩26,205,624
(*) Short-term financial instruments at financial institutions (Credit union etc.)
without external credit rating.
8. Transfers of Financial Assets
Trade receivables have been discounted through factoring agreements with
banks. Collateral (trade receivables and other) provided in transactions of
discount and factoring of trade receivables do not meet the requirements for
asset derecognition as risks and rewards are not substantially transferred in the
event the debtor defaults. Financial liabilities recognized in relation to these
transactions are included as short-term borrowings in the statement of financial
position (Note 15).
The following table presents a break down of discounted trade receivables as of
December 31, 2012 and 2011:(In millions of Korean won)
December 31, 2012
December 31, 2011
Carrying amount of the discounted trade receivables (*)
₩4,328,503 ₩4,878,383
Carrying amount of the related borrowing
₩4,328,503 ₩4,878,383
(*) The discounted trade receivables include intercompany balances.
7372
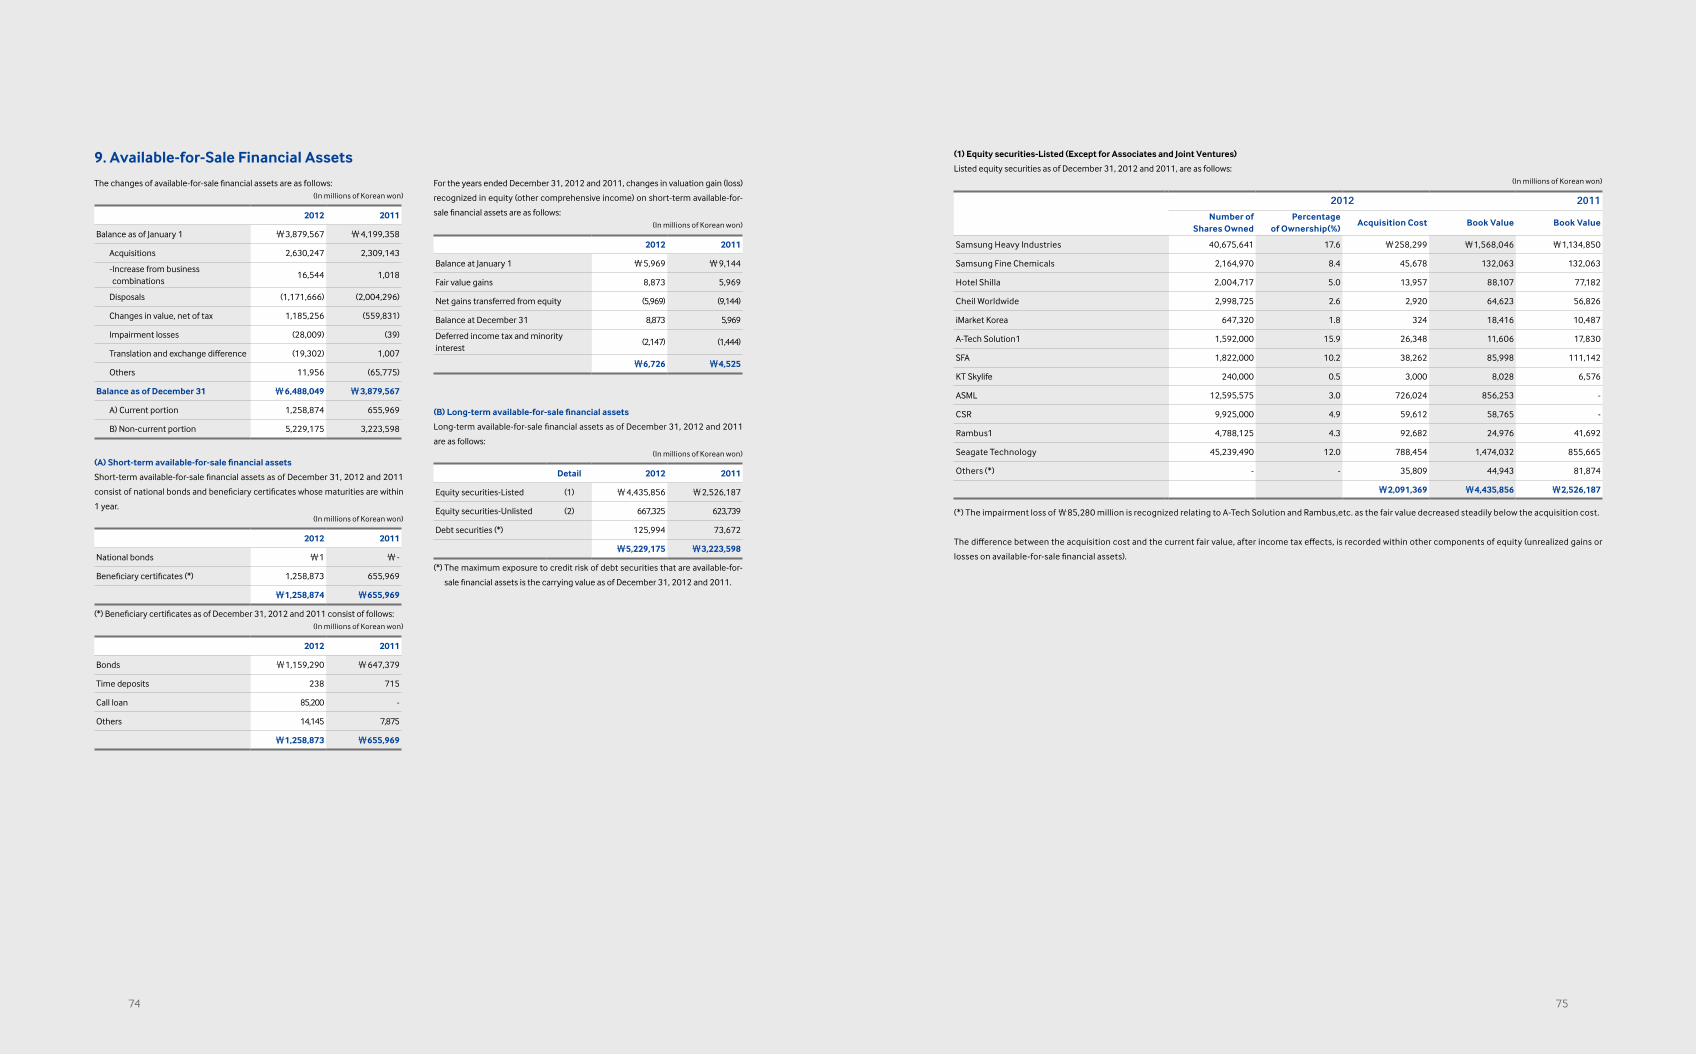
9. Available-for-Sale Financial Assets
The changes of available-for-sale financial assets are as follows:(In millions of Korean won)
2012 2011
Balance as of January 1 ₩3,879,567 ₩4,199,358
Acquisitions 2,630,247 2,309,143
- Increase from business combinations
16,544 1,018
Disposals (1,171,666) (2,004,296)
Changes in value, net of tax 1,185,256 (559,831)
Impairment losses (28,009) (39)
Translation and exchange difference (19,302) 1,007
Others 11,956 (65,775)
Balance as of December 31 ₩6,488,049 ₩3,879,567
A) Current portion 1,258,874 655,969
B) Non-current portion 5,229,175 3,223,598
(A) Short-term available-for-sale financial assets
Short-term available-for-sale financial assets as of December 31, 2012 and 2011
consist of national bonds and beneficiary certificates whose maturities are within
1 year.(In millions of Korean won)
2012 2011
National bonds ₩1 ₩-
Beneficiary certificates (*) 1,258,873 655,969
₩1,258,874 ₩655,969
(*) Beneficiary certificates as of December 31, 2012 and 2011 consist of follows:(In millions of Korean won)
2012 2011
Bonds ₩1,159,290 ₩647,379
Time deposits 238 715
Call loan 85,200 -
Others 14,145 7,875
₩1,258,873 ₩655,969
For the years ended December 31, 2012 and 2011, changes in valuation gain (loss)
recognized in equity (other comprehensive income) on short-term available-for-
sale financial assets are as follows:(In millions of Korean won)
2012 2011
Balance at January 1 ₩5,969 ₩9,144
Fair value gains 8,873 5,969
Net gains transferred from equity (5,969) (9,144)
Balance at December 31 8,873 5,969
Deferred income tax and minority interest
(2,147) (1,444)
₩6,726 ₩4,525
(B) Long-term available-for-sale financial assets
Long-term available-for-sale financial assets as of December 31, 2012 and 2011
are as follows:(In millions of Korean won)
Detail 2012 2011
Equity securities-Listed (1) ₩4,435,856 ₩2,526,187
Equity securities-Unlisted (2) 667,325 623,739
Debt securities (*) 125,994 73,672
₩5,229,175 ₩3,223,598
(*) The maximum exposure to credit risk of debt securities that are available-for-
sale financial assets is the carrying value as of December 31, 2012 and 2011.
(1) Equity securities-Listed (Except for Associates and Joint Ventures)
Listed equity securities as of December 31, 2012 and 2011, are as follows:(In millions of Korean won)
2012 2011
Number ofShares Owned
Percentageof Ownership(%)
Acquisition Cost Book Value Book Value
Samsung Heavy Industries 40,675,641 17.6 ₩258,299 ₩1,568,046 ₩1,134,850
Samsung Fine Chemicals 2,164,970 8.4 45,678 132,063 132,063
Hotel Shilla 2,004,717 5.0 13,957 88,107 77,182
Cheil Worldwide 2,998,725 2.6 2,920 64,623 56,826
iMarket Korea 647,320 1.8 324 18,416 10,487
A-Tech Solution1 1,592,000 15.9 26,348 11,606 17,830
SFA 1,822,000 10.2 38,262 85,998 111,142
KT Skylife 240,000 0.5 3,000 8,028 6,576
ASML 12,595,575 3.0 726,024 856,253 -
CSR 9,925,000 4.9 59,612 58,765 -
Rambus1 4,788,125 4.3 92,682 24,976 41,692
Seagate Technology 45,239,490 12.0 788,454 1,474,032 855,665
Others (*) - - 35,809 44,943 81,874
₩2,091,369 ₩4,435,856 ₩2,526,187
(*) The impairment loss of ₩85,280 million is recognized relating to A-Tech Solution and Rambus,etc. as the fair value decreased steadily below the acquisition cost.
The difference between the acquisition cost and the current fair value, after income tax effects, is recorded within other components of equity (unrealized gains or
losses on available-for-sale financial assets).
7574
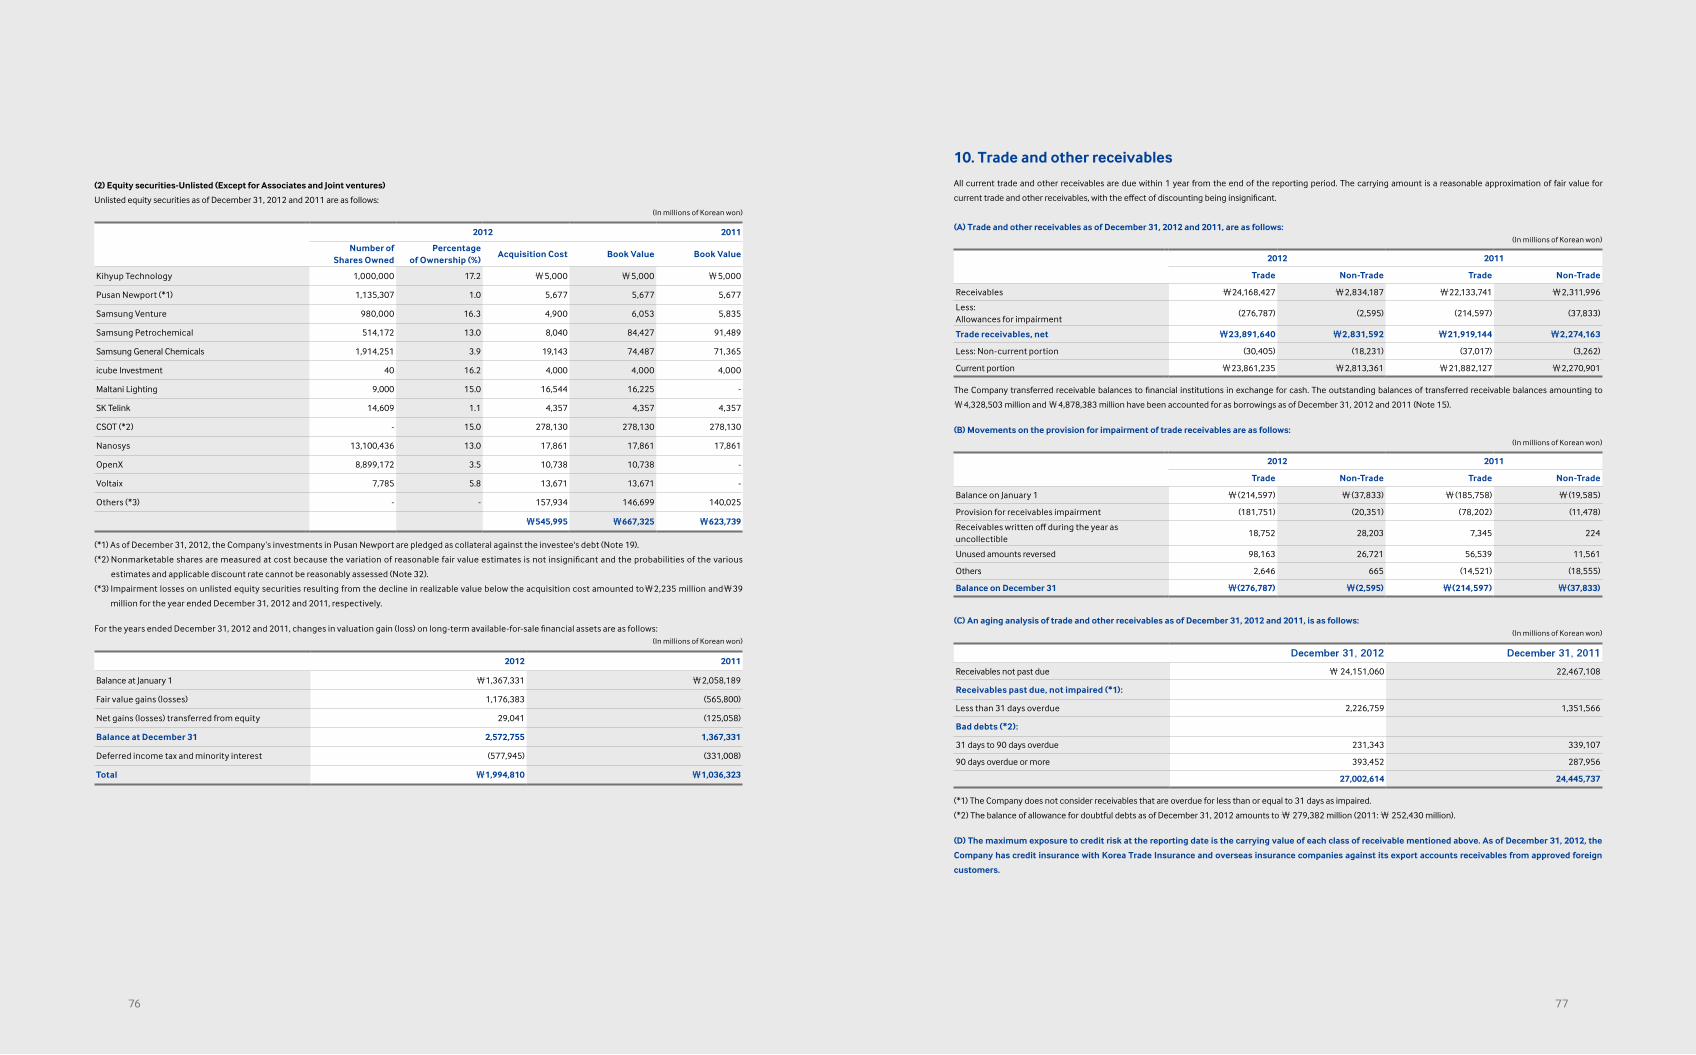
(2) Equity securities-Unlisted (Except for Associates and Joint ventures)
Unlisted equity securities as of December 31, 2012 and 2011 are as follows:(In millions of Korean won)
2012 2011
Number ofShares Owned
Percentageof Ownership (%)
Acquisition Cost Book Value Book Value
Kihyup Technology 1,000,000 17.2 ₩5,000 ₩5,000 ₩5,000
Pusan Newport (*1) 1,135,307 1.0 5,677 5,677 5,677
Samsung Venture 980,000 16.3 4,900 6,053 5,835
Samsung Petrochemical 514,172 13.0 8,040 84,427 91,489
Samsung General Chemicals 1,914,251 3.9 19,143 74,487 71,365
icube Investment 40 16.2 4,000 4,000 4,000
Maltani Lighting 9,000 15.0 16,544 16,225 -
SK Telink 14,609 1.1 4,357 4,357 4,357
CSOT (*2) - 15.0 278,130 278,130 278,130
Nanosys 13,100,436 13.0 17,861 17,861 17,861
OpenX 8,899,172 3.5 10,738 10,738 -
Voltaix 7,785 5.8 13,671 13,671 -
Others (*3) - - 157,934 146,699 140,025
₩545,995 ₩667,325 ₩623,739
(*1) As of December 31, 2012, the Company’s investments in Pusan Newport are pledged as collateral against the investee's debt (Note 19).
(*2) Nonmarketable shares are measured at cost because the variation of reasonable fair value estimates is not insignificant and the probabilities of the various
estimates and applicable discount rate cannot be reasonably assessed (Note 32).
(*3) Impairment losses on unlisted equity securities resulting from the decline in realizable value below the acquisition cost amounted to₩2,235 million and₩39
million for the year ended December 31, 2012 and 2011, respectively.
For the years ended December 31, 2012 and 2011, changes in valuation gain (loss) on long-term available-for-sale financial assets are as follows:(In millions of Korean won)
2012 2011
Balance at January 1 ₩1,367,331 ₩2,058,189
Fair value gains (losses) 1,176,383 (565,800)
Net gains (losses) transferred from equity 29,041 (125,058)
Balance at December 31 2,572,755 1,367,331
Deferred income tax and minority interest (577,945) (331,008)
Total ₩1,994,810 ₩1,036,323
10. Trade and other receivables
All current trade and other receivables are due within 1 year from the end of the reporting period. The carrying amount is a reasonable approximation of fair value for
current trade and other receivables, with the effect of discounting being insignificant.
(A) Trade and other receivables as of December 31, 2012 and 2011, are as follows:(In millions of Korean won)
2012 2011
Trade Non-Trade Trade Non-Trade
Receivables ₩24,168,427 ₩2,834,187 ₩22,133,741 ₩2,311,996
Less:Allowances for impairment
(276,787) (2,595) (214,597) (37,833)
Trade receivables, net ₩23,891,640 ₩2,831,592 ₩21,919,144 ₩2,274,163
Less: Non-current portion (30,405) (18,231) (37,017) (3,262)
Current portion ₩23,861,235 ₩2,813,361 ₩21,882,127 ₩2,270,901
The Company transferred receivable balances to financial institutions in exchange for cash. The outstanding balances of transferred receivable balances amounting to
₩4,328,503 million and ₩4,878,383 million have been accounted for as borrowings as of December 31, 2012 and 2011 (Note 15).
(B) Movements on the provision for impairment of trade receivables are as follows:(In millions of Korean won)
2012 2011
Trade Non-Trade Trade Non-Trade
Balance on January 1 ₩(214,597) ₩(37,833) ₩(185,758) ₩(19,585)
Provision for receivables impairment (181,751) (20,351) (78,202) (11,478)
Receivables written off during the year as uncollectible
18,752 28,203 7,345 224
Unused amounts reversed 98,163 26,721 56,539 11,561
Others 2,646 665 (14,521) (18,555)
Balance on December 31 ₩(276,787) ₩(2,595) ₩(214,597) ₩(37,833)
(C) An aging analysis of trade and other receivables as of December 31, 2012 and 2011, is as follows:(In millions of Korean won)
December 31, 2012 December 31, 2011
Receivables not past due ₩ 24,151,060 22,467,108
Receivables past due, not impaired (*1):
Less than 31 days overdue 2,226,759 1,351,566
Bad debts (*2):
31 days to 90 days overdue 231,343 339,107
90 days overdue or more 393,452 287,956
27,002,614 24,445,737
(*1) The Company does not consider receivables that are overdue for less than or equal to 31 days as impaired.
(*2) The balance of allowance for doubtful debts as of December 31, 2012 amounts to ₩ 279,382 million (2011: ₩ 252,430 million).
(D) The maximum exposure to credit risk at the reporting date is the carrying value of each class of receivable mentioned above. As of December 31, 2012, the
Company has credit insurance with Korea Trade Insurance and overseas insurance companies against its export accounts receivables from approved foreign
customers.
7776
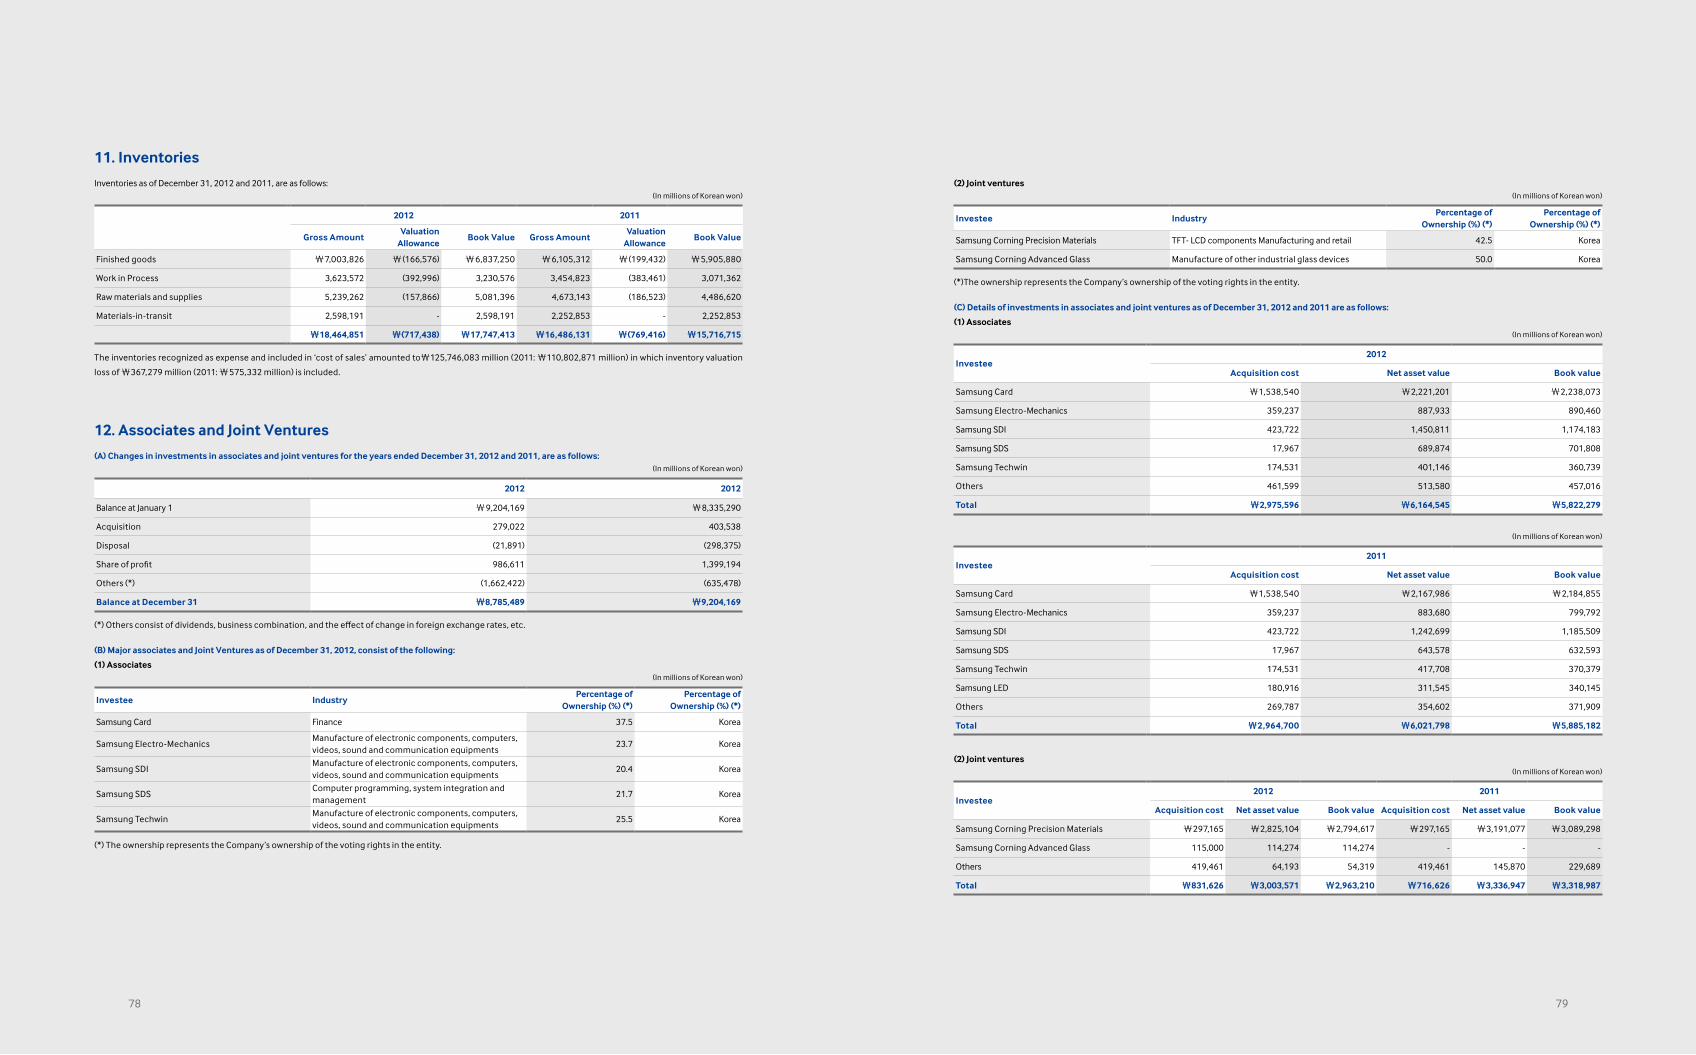
11. Inventories
Inventories as of December 31, 2012 and 2011, are as follows:(In millions of Korean won)
2012 2011
Gross AmountValuation
AllowanceBook Value Gross Amount
ValuationAllowance
Book Value
Finished goods ₩7,003,826 ₩(166,576) ₩6,837,250 ₩6,105,312 ₩(199,432) ₩5,905,880
Work in Process 3,623,572 (392,996) 3,230,576 3,454,823 (383,461) 3,071,362
Raw materials and supplies 5,239,262 (157,866) 5,081,396 4,673,143 (186,523) 4,486,620
Materials-in-transit 2,598,191 - 2,598,191 2,252,853 - 2,252,853
₩18,464,851 ₩(717,438) ₩17,747,413 ₩16,486,131 ₩(769,416) ₩15,716,715
The inventories recognized as expense and included in ‘cost of sales’ amounted to₩125,746,083 million (2011: ₩110,802,871 million) in which inventory valuation
loss of ₩367,279 million (2011: ₩575,332 million) is included.
12. Associates and Joint Ventures
(A) Changes in investments in associates and joint ventures for the years ended December 31, 2012 and 2011, are as follows:(In millions of Korean won)
2012 2012
Balance at January 1 ₩9,204,169 ₩8,335,290
Acquisition 279,022 403,538
Disposal (21,891) (298,375)
Share of profit 986,611 1,399,194
Others (*) (1,662,422) (635,478)
Balance at December 31 ₩8,785,489 ₩9,204,169
(*) Others consist of dividends, business combination, and the effect of change in foreign exchange rates, etc.
(B) Major associates and Joint Ventures as of December 31, 2012, consist of the following:
(1) Associates(In millions of Korean won)
Investee IndustryPercentage of
Ownership (%) (*)Percentage of
Ownership (%) (*)
Samsung Card Finance 37.5 Korea
Samsung Electro-MechanicsManufacture of electronic components, computers,videos, sound and communication equipments
23.7 Korea
Samsung SDIManufacture of electronic components, computers,videos, sound and communication equipments
20.4 Korea
Samsung SDSComputer programming, system integration andmanagement
21.7 Korea
Samsung TechwinManufacture of electronic components, computers,videos, sound and communication equipments
25.5 Korea
(*) The ownership represents the Company’s ownership of the voting rights in the entity.
(2) Joint ventures(In millions of Korean won)
Investee IndustryPercentage of
Ownership (%) (*)Percentage of
Ownership (%) (*)
Samsung Corning Precision Materials TFT- LCD components Manufacturing and retail 42.5 Korea
Samsung Corning Advanced Glass Manufacture of other industrial glass devices 50.0 Korea
(*)The ownership represents the Company’s ownership of the voting rights in the entity.
(C) Details of investments in associates and joint ventures as of December 31, 2012 and 2011 are as follows:
(1) Associates(In millions of Korean won)
Investee2012
Acquisition cost Net asset value Book value
Samsung Card ₩1,538,540 ₩2,221,201 ₩2,238,073
Samsung Electro-Mechanics 359,237 887,933 890,460
Samsung SDI 423,722 1,450,811 1,174,183
Samsung SDS 17,967 689,874 701,808
Samsung Techwin 174,531 401,146 360,739
Others 461,599 513,580 457,016
Total ₩2,975,596 ₩6,164,545 ₩5,822,279
(In millions of Korean won)
Investee2011
Acquisition cost Net asset value Book value
Samsung Card ₩1,538,540 ₩2,167,986 ₩2,184,855
Samsung Electro-Mechanics 359,237 883,680 799,792
Samsung SDI 423,722 1,242,699 1,185,509
Samsung SDS 17,967 643,578 632,593
Samsung Techwin 174,531 417,708 370,379
Samsung LED 180,916 311,545 340,145
Others 269,787 354,602 371,909
Total ₩2,964,700 ₩6,021,798 ₩5,885,182
(2) Joint ventures(In millions of Korean won)
Investee2012 2011
Acquisition cost Net asset value Book value Acquisition cost Net asset value Book value
Samsung Corning Precision Materials ₩297,165 ₩2,825,104 ₩2,794,617 ₩297,165 ₩3,191,077 ₩3,089,298
Samsung Corning Advanced Glass 115,000 114,274 114,274 - - -
Others 419,461 64,193 54,319 419,461 145,870 229,689
Total ₩831,626 ₩3,003,571 ₩2,963,210 ₩716,626 ₩3,336,947 ₩3,318,987
7978
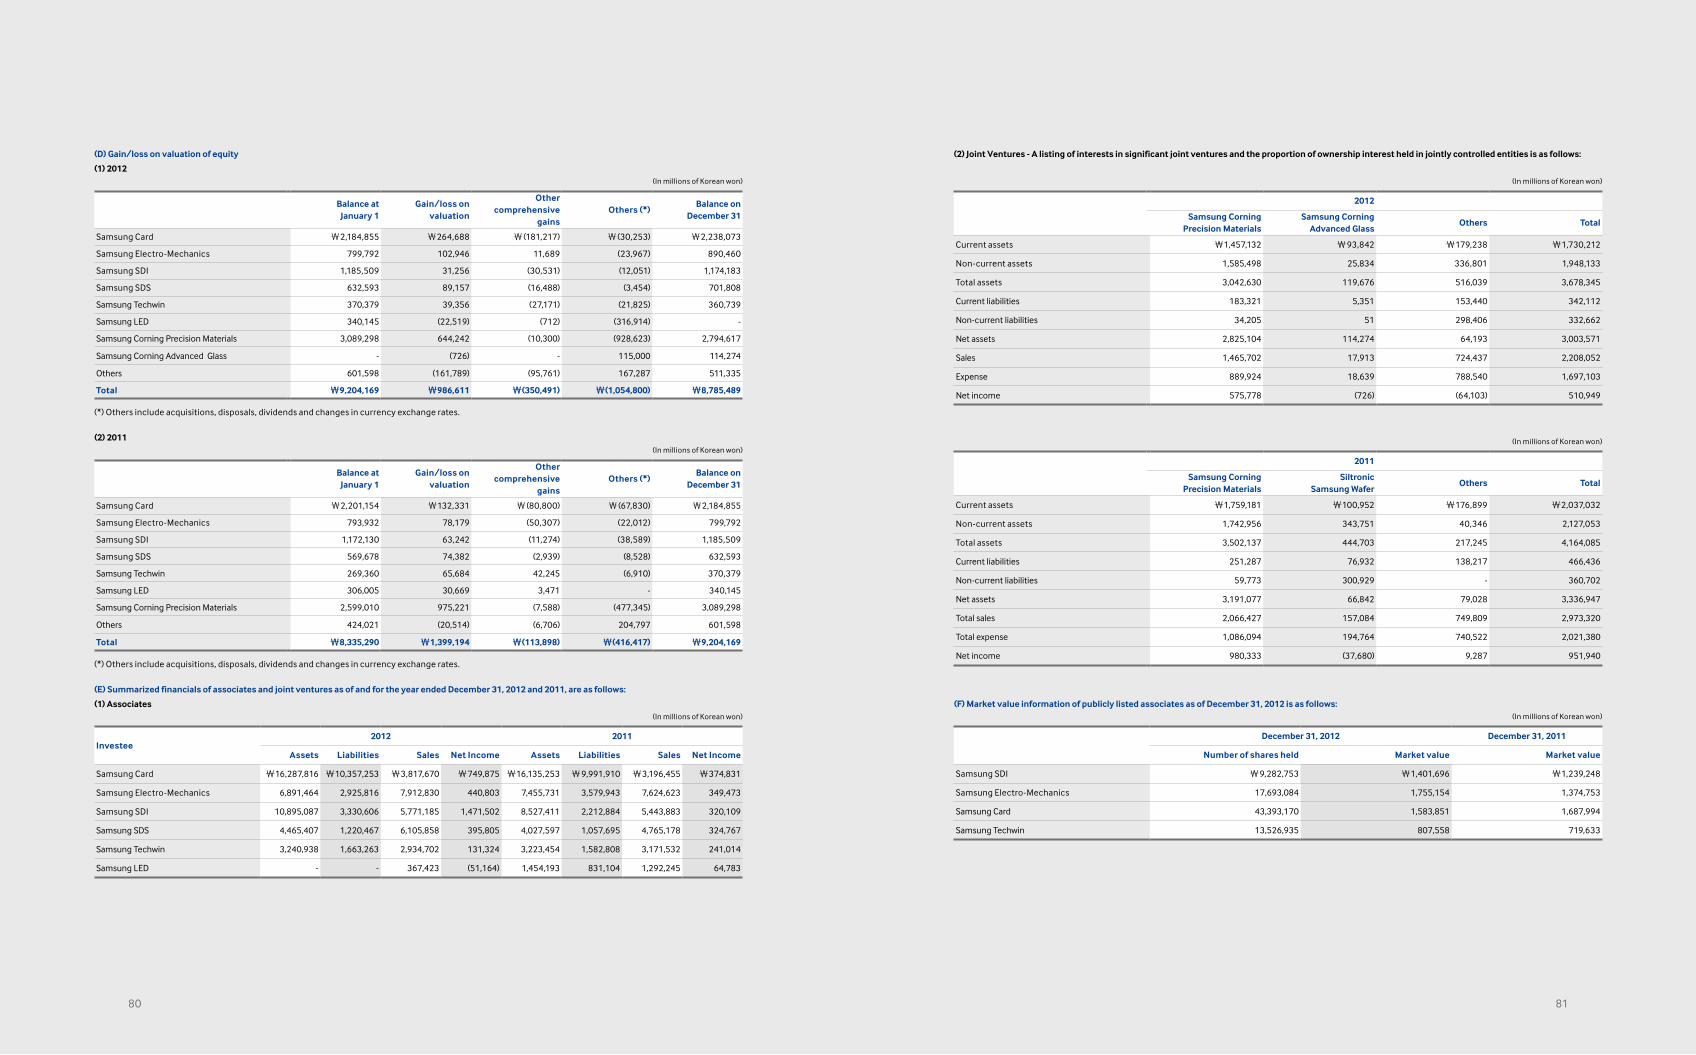
(D) Gain/loss on valuation of equity
(1) 2012(In millions of Korean won)
Balance atJanuary 1
Gain/loss onvaluation
Other comprehensive
gainsOthers (*)
Balance onDecember 31
Samsung Card ₩2,184,855 ₩264,688 ₩(181,217) ₩(30,253) ₩2,238,073
Samsung Electro-Mechanics 799,792 102,946 11,689 (23,967) 890,460
Samsung SDI 1,185,509 31,256 (30,531) (12,051) 1,174,183
Samsung SDS 632,593 89,157 (16,488) (3,454) 701,808
Samsung Techwin 370,379 39,356 (27,171) (21,825) 360,739
Samsung LED 340,145 (22,519) (712) (316,914) -
Samsung Corning Precision Materials 3,089,298 644,242 (10,300) (928,623) 2,794,617
Samsung Corning Advanced Glass - (726) - 115,000 114,274
Others 601,598 (161,789) (95,761) 167,287 511,335
Total ₩9,204,169 ₩986,611 ₩(350,491) ₩(1,054,800) ₩8,785,489
(*) Others include acquisitions, disposals, dividends and changes in currency exchange rates.
(2) 2011(In millions of Korean won)
Balance atJanuary 1
Gain/loss onvaluation
Other comprehensive
gainsOthers (*)
Balance onDecember 31
Samsung Card ₩2,201,154 ₩132,331 ₩(80,800) ₩(67,830) ₩2,184,855
Samsung Electro-Mechanics 793,932 78,179 (50,307) (22,012) 799,792
Samsung SDI 1,172,130 63,242 (11,274) (38,589) 1,185,509
Samsung SDS 569,678 74,382 (2,939) (8,528) 632,593
Samsung Techwin 269,360 65,684 42,245 (6,910) 370,379
Samsung LED 306,005 30,669 3,471 - 340,145
Samsung Corning Precision Materials 2,599,010 975,221 (7,588) (477,345) 3,089,298
Others 424,021 (20,514) (6,706) 204,797 601,598
Total ₩8,335,290 ₩1,399,194 ₩(113,898) ₩(416,417) ₩9,204,169
(*) Others include acquisitions, disposals, dividends and changes in currency exchange rates.
(E) Summarized financials of associates and joint ventures as of and for the year ended December 31, 2012 and 2011, are as follows:
(1) Associates(In millions of Korean won)
Investee2012 2011
Assets Liabilities Sales Net Income Assets Liabilities Sales Net Income
Samsung Card ₩16,287,816 ₩10,357,253 ₩3,817,670 ₩749,875 ₩16,135,253 ₩9,991,910 ₩3,196,455 ₩374,831
Samsung Electro-Mechanics 6,891,464 2,925,816 7,912,830 440,803 7,455,731 3,579,943 7,624,623 349,473
Samsung SDI 10,895,087 3,330,606 5,771,185 1,471,502 8,527,411 2,212,884 5,443,883 320,109
Samsung SDS 4,465,407 1,220,467 6,105,858 395,805 4,027,597 1,057,695 4,765,178 324,767
Samsung Techwin 3,240,938 1,663,263 2,934,702 131,324 3,223,454 1,582,808 3,171,532 241,014
Samsung LED - - 367,423 (51,164) 1,454,193 831,104 1,292,245 64,783
(2) Joint Ventures - A listing of interests in significant joint ventures and the proportion of ownership interest held in jointly controlled entities is as follows:
(In millions of Korean won)
2012
Samsung CorningPrecision Materials
Samsung CorningAdvanced Glass
Others Total
Current assets ₩1,457,132 ₩93,842 ₩179,238 ₩1,730,212
Non-current assets 1,585,498 25,834 336,801 1,948,133
Total assets 3,042,630 119,676 516,039 3,678,345
Current liabilities 183,321 5,351 153,440 342,112
Non-current liabilities 34,205 51 298,406 332,662
Net assets 2,825,104 114,274 64,193 3,003,571
Sales 1,465,702 17,913 724,437 2,208,052
Expense 889,924 18,639 788,540 1,697,103
Net income 575,778 (726) (64,103) 510,949
(In millions of Korean won)
2011
Samsung CorningPrecision Materials
Siltronic Samsung Wafer
Others Total
Current assets ₩1,759,181 ₩100,952 ₩176,899 ₩2,037,032
Non-current assets 1,742,956 343,751 40,346 2,127,053
Total assets 3,502,137 444,703 217,245 4,164,085
Current liabilities 251,287 76,932 138,217 466,436
Non-current liabilities 59,773 300,929 - 360,702
Net assets 3,191,077 66,842 79,028 3,336,947
Total sales 2,066,427 157,084 749,809 2,973,320
Total expense 1,086,094 194,764 740,522 2,021,380
Net income 980,333 (37,680) 9,287 951,940
(F) Market value information of publicly listed associates as of December 31, 2012 is as follows:(In millions of Korean won)
December 31, 2012 December 31, 2011
Number of shares held Market value Market value
Samsung SDI ₩9,282,753 ₩1,401,696 ₩1,239,248
Samsung Electro-Mechanics 17,693,084 1,755,154 1,374,753
Samsung Card 43,393,170 1,583,851 1,687,994
Samsung Techwin 13,526,935 807,558 719,633
8180
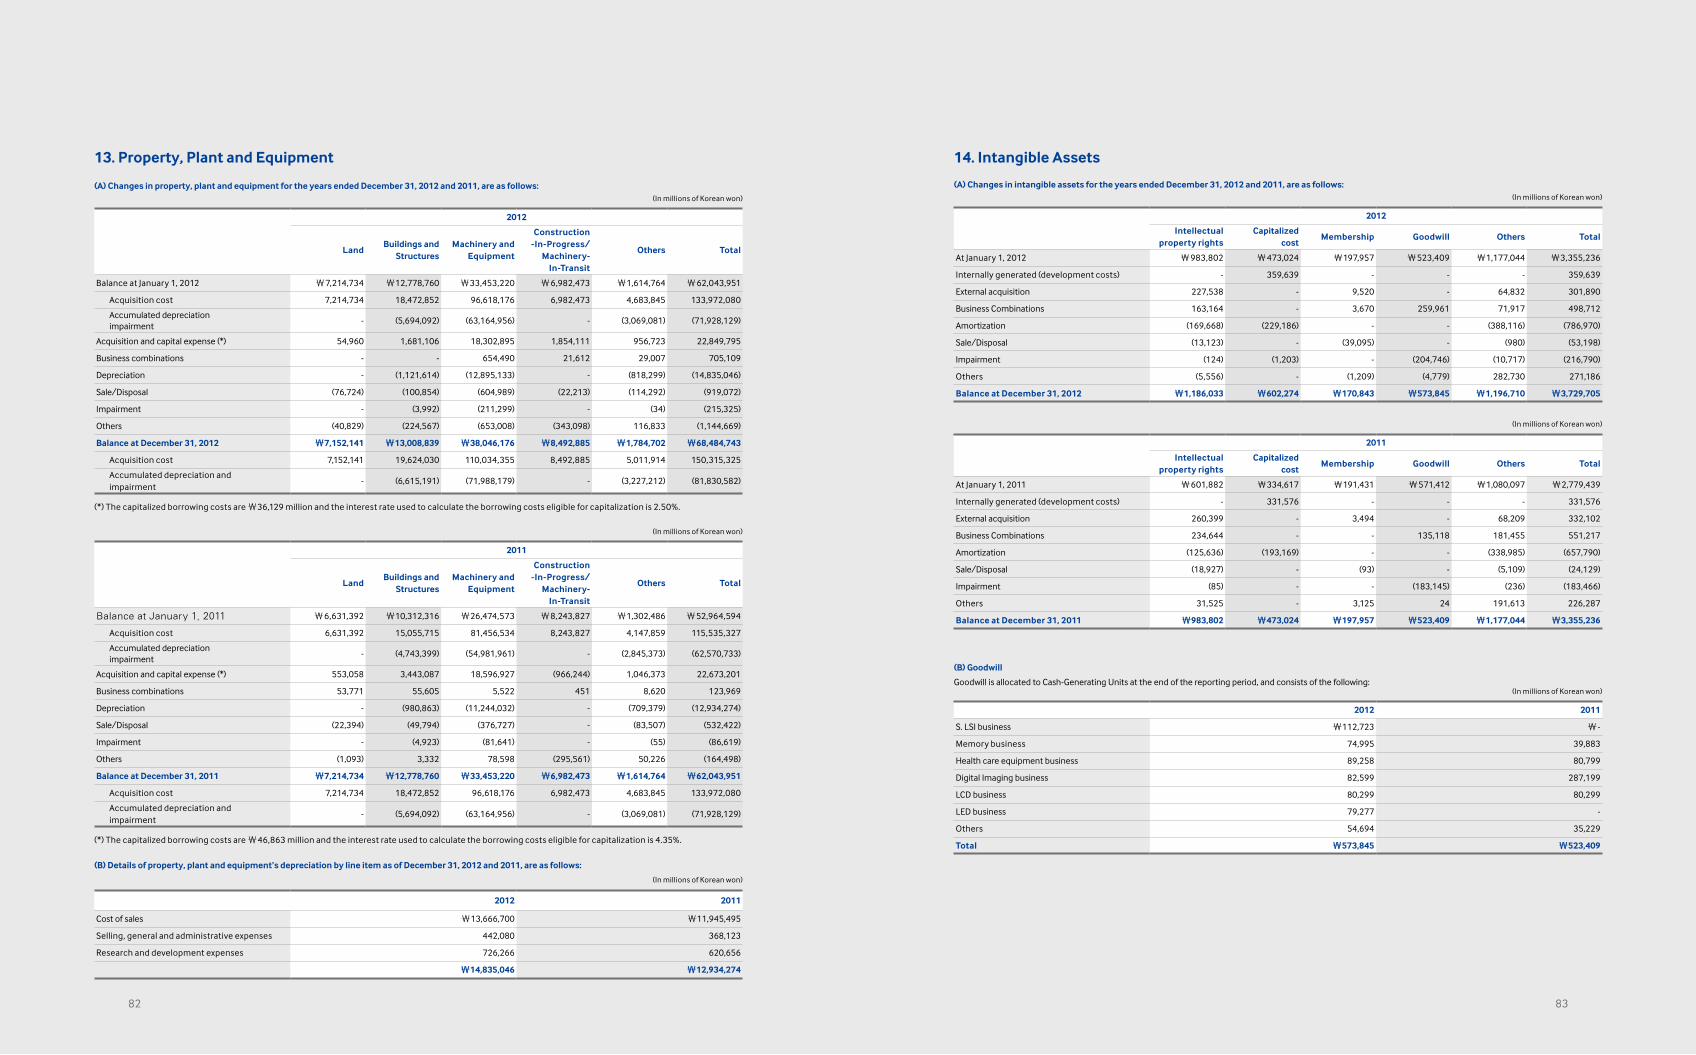
13. Property, Plant and Equipment
(A) Changes in property, plant and equipment for the years ended December 31, 2012 and 2011, are as follows:(In millions of Korean won)
2012
LandBuildings and
StructuresMachinery and
Equipment
Construction-In-Progress/
Machinery-In-Transit
Others Total
Balance at January 1, 2012 ₩7,214,734 ₩12,778,760 ₩33,453,220 ₩6,982,473 ₩1,614,764 ₩62,043,951
Acquisition cost 7,214,734 18,472,852 96,618,176 6,982,473 4,683,845 133,972,080
Accumulated depreciationimpairment
- (5,694,092) (63,164,956) - (3,069,081) (71,928,129)
Acquisition and capital expense (*) 54,960 1,681,106 18,302,895 1,854,111 956,723 22,849,795
Business combinations - - 654,490 21,612 29,007 705,109
Depreciation - (1,121,614) (12,895,133) - (818,299) (14,835,046)
Sale/Disposal (76,724) (100,854) (604,989) (22,213) (114,292) (919,072)
Impairment - (3,992) (211,299) - (34) (215,325)
Others (40,829) (224,567) (653,008) (343,098) 116,833 (1,144,669)
Balance at December 31, 2012 ₩7,152,141 ₩13,008,839 ₩38,046,176 ₩8,492,885 ₩1,784,702 ₩68,484,743
Acquisition cost 7,152,141 19,624,030 110,034,355 8,492,885 5,011,914 150,315,325
Accumulated depreciation andimpairment
- (6,615,191) (71,988,179) - (3,227,212) (81,830,582)
(*) The capitalized borrowing costs are ₩36,129 million and the interest rate used to calculate the borrowing costs eligible for capitalization is 2.50%.
(In millions of Korean won)
2011
LandBuildings and
StructuresMachinery and
Equipment
Construction-In-Progress/
Machinery-In-Transit
Others Total
Balance at January 1, 2011 ₩6,631,392 ₩10,312,316 ₩26,474,573 ₩8,243,827 ₩1,302,486 ₩52,964,594
Acquisition cost 6,631,392 15,055,715 81,456,534 8,243,827 4,147,859 115,535,327
Accumulated depreciationimpairment
- (4,743,399) (54,981,961) - (2,845,373) (62,570,733)
Acquisition and capital expense (*) 553,058 3,443,087 18,596,927 (966,244) 1,046,373 22,673,201
Business combinations 53,771 55,605 5,522 451 8,620 123,969
Depreciation - (980,863) (11,244,032) - (709,379) (12,934,274)
Sale/Disposal (22,394) (49,794) (376,727) - (83,507) (532,422)
Impairment - (4,923) (81,641) - (55) (86,619)
Others (1,093) 3,332 78,598 (295,561) 50,226 (164,498)
Balance at December 31, 2011 ₩7,214,734 ₩12,778,760 ₩33,453,220 ₩6,982,473 ₩1,614,764 ₩62,043,951
Acquisition cost 7,214,734 18,472,852 96,618,176 6,982,473 4,683,845 133,972,080
Accumulated depreciation andimpairment
- (5,694,092) (63,164,956) - (3,069,081) (71,928,129)
(*) The capitalized borrowing costs are ₩46,863 million and the interest rate used to calculate the borrowing costs eligible for capitalization is 4.35%.
(B) Details of property, plant and equipment’s depreciation by line item as of December 31, 2012 and 2011, are as follows:
(In millions of Korean won)
2012 2011
Cost of sales ₩13,666,700 ₩11,945,495
Selling, general and administrative expenses 442,080 368,123
Research and development expenses 726,266 620,656
₩14,835,046 ₩12,934,274
14. Intangible Assets
(A) Changes in intangible assets for the years ended December 31, 2012 and 2011, are as follows:(In millions of Korean won)
2012
Intellectualproperty rights
Capitalizedcost
Membership Goodwill Others Total
At January 1, 2012 ₩983,802 ₩473,024 ₩197,957 ₩523,409 ₩1,177,044 ₩3,355,236
Internally generated (development costs) - 359,639 - - - 359,639
External acquisition 227,538 - 9,520 - 64,832 301,890
Business Combinations 163,164 - 3,670 259,961 71,917 498,712
Amortization (169,668) (229,186) - - (388,116) (786,970)
Sale/Disposal (13,123) - (39,095) - (980) (53,198)
Impairment (124) (1,203) - (204,746) (10,717) (216,790)
Others (5,556) - (1,209) (4,779) 282,730 271,186
Balance at December 31, 2012 ₩1,186,033 ₩602,274 ₩170,843 ₩573,845 ₩1,196,710 ₩3,729,705
(In millions of Korean won)
2011
Intellectualproperty rights
Capitalizedcost
Membership Goodwill Others Total
At January 1, 2011 ₩601,882 ₩334,617 ₩191,431 ₩571,412 ₩1,080,097 ₩2,779,439
Internally generated (development costs) - 331,576 - - - 331,576
External acquisition 260,399 - 3,494 - 68,209 332,102
Business Combinations 234,644 - - 135,118 181,455 551,217
Amortization (125,636) (193,169) - - (338,985) (657,790)
Sale/Disposal (18,927) - (93) - (5,109) (24,129)
Impairment (85) - - (183,145) (236) (183,466)
Others 31,525 - 3,125 24 191,613 226,287
Balance at December 31, 2011 ₩983,802 ₩473,024 ₩197,957 ₩523,409 ₩1,177,044 ₩3,355,236
(B) Goodwill
Goodwill is allocated to Cash-Generating Units at the end of the reporting period, and consists of the following:(In millions of Korean won)
2012 2011
S. LSI business ₩112,723 ₩-
Memory business 74,995 39,883
Health care equipment business 89,258 80,799
Digital Imaging business 82,599 287,199
LCD business 80,299 80,299
LED business 79,277 -
Others 54,694 35,229
Total ₩573,845 ₩523,409
8382
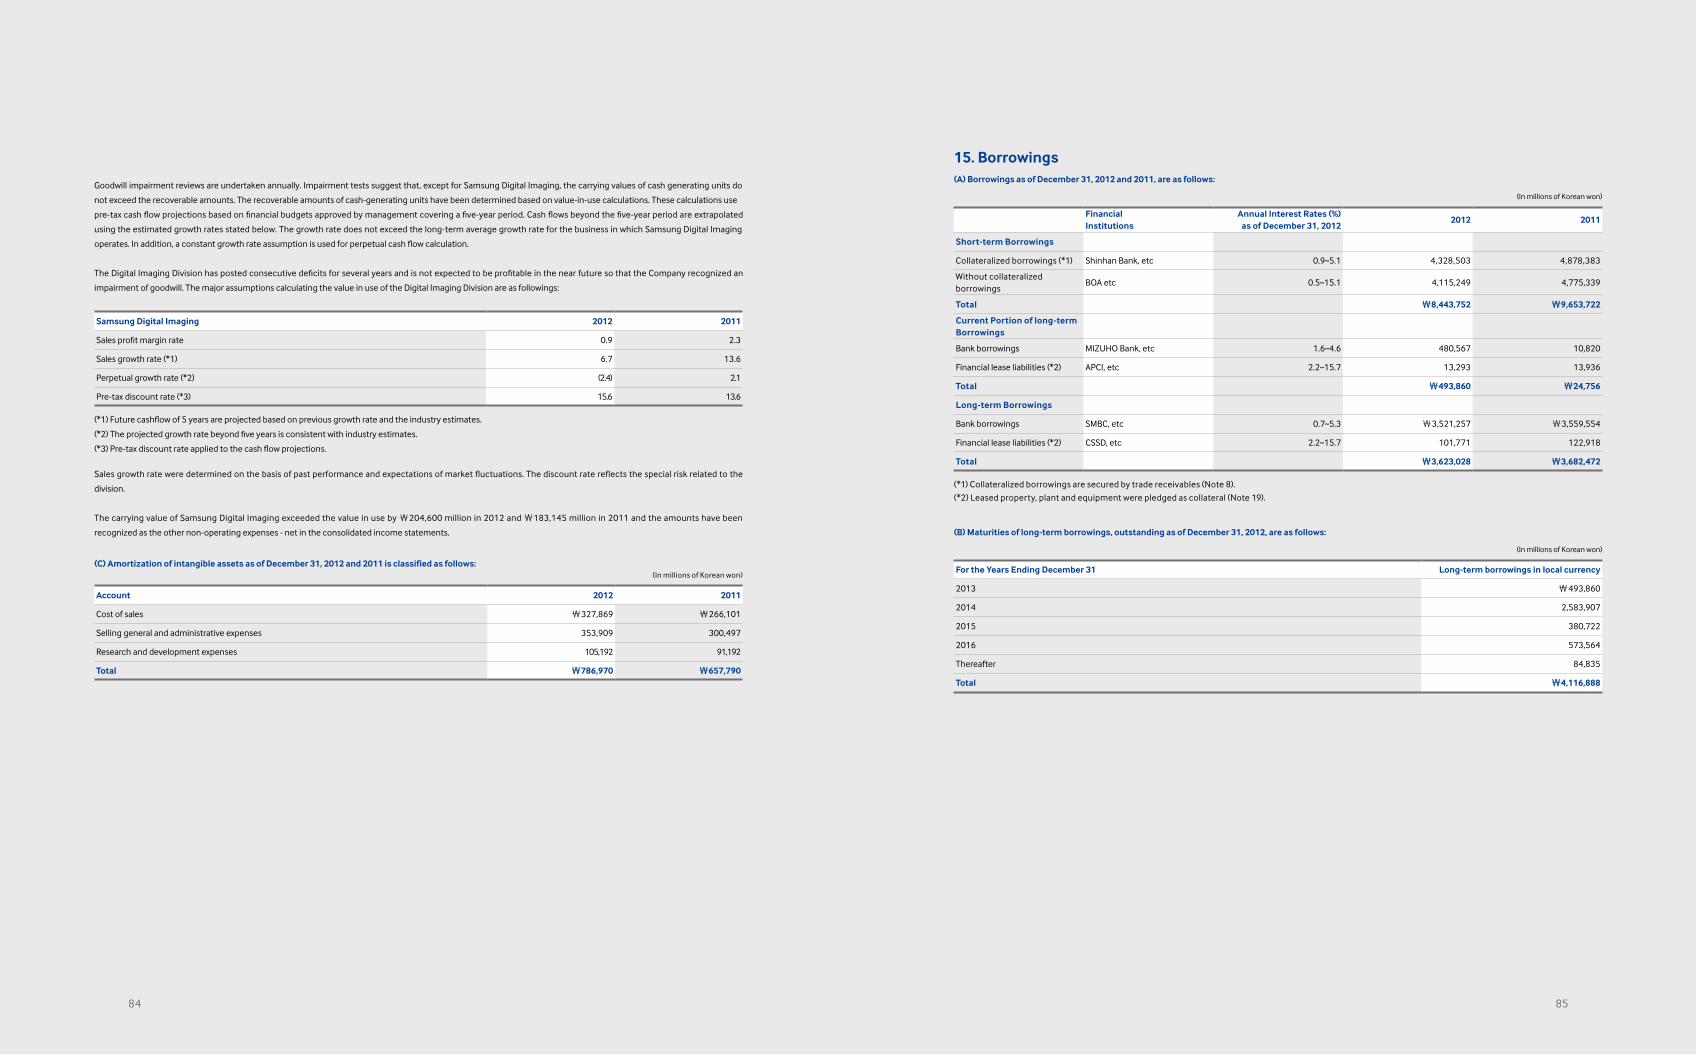
Goodwill impairment reviews are undertaken annually. Impairment tests suggest that, except for Samsung Digital Imaging, the carrying values of cash generating units do
not exceed the recoverable amounts. The recoverable amounts of cash-generating units have been determined based on value-in-use calculations. These calculations use
pre-tax cash flow projections based on financial budgets approved by management covering a five-year period. Cash flows beyond the five-year period are extrapolated
using the estimated growth rates stated below. The growth rate does not exceed the long-term average growth rate for the business in which Samsung Digital Imaging
operates. In addition, a constant growth rate assumption is used for perpetual cash flow calculation.
The Digital Imaging Division has posted consecutive deficits for several years and is not expected to be profitable in the near future so that the Company recognized an
impairment of goodwill. The major assumptions calculating the value in use of the Digital Imaging Division are as followings:
Samsung Digital Imaging 2012 2011
Sales profit margin rate 0.9 2.3
Sales growth rate (*1) 6.7 13.6
Perpetual growth rate (*2) (2.4) 2.1
Pre-tax discount rate (*3) 15.6 13.6
(*1) Future cashflow of 5 years are projected based on previous growth rate and the industry estimates.
(*2) The projected growth rate beyond five years is consistent with industry estimates.
(*3) Pre-tax discount rate applied to the cash flow projections.
Sales growth rate were determined on the basis of past performance and expectations of market fluctuations. The discount rate reflects the special risk related to the
division.
The carrying value of Samsung Digital Imaging exceeded the value in use by ₩204,600 million in 2012 and ₩183,145 million in 2011 and the amounts have been
recognized as the other non-operating expenses - net in the consolidated income statements.
(C) Amortization of intangible assets as of December 31, 2012 and 2011 is classified as follows: (In millions of Korean won)
Account 2012 2011
Cost of sales ₩327,869 ₩266,101
Selling general and administrative expenses 353,909 300,497
Research and development expenses 105,192 91,192
Total ₩786,970 ₩657,790
15. Borrowings(A) Borrowings as of December 31, 2012 and 2011, are as follows:
(In millions of Korean won)
FinancialInstitutions
Annual Interest Rates (%)as of December 31, 2012
2012 2011
Short-term Borrowings
Collateralized borrowings (*1) Shinhan Bank, etc 0.9~5.1 4,328,503 4,878,383
Without collateralized borrowings
BOA etc 0.5~15.1 4,115,249 4,775,339
Total ₩8,443,752 ₩9,653,722
Current Portion of long-term Borrowings
Bank borrowings MIZUHO Bank, etc 1.6~4.6 480,567 10,820
Financial lease liabilities (*2) APCI, etc 2.2~15.7 13,293 13,936
Total ₩493,860 ₩24,756
Long-term Borrowings
Bank borrowings SMBC, etc 0.7~5.3 ₩3,521,257 ₩3,559,554
Financial lease liabilities (*2) CSSD, etc 2.2~15.7 101,771 122,918
Total ₩3,623,028 ₩3,682,472
(*1) Collateralized borrowings are secured by trade receivables (Note 8).
(*2) Leased property, plant and equipment were pledged as collateral (Note 19).
(B) Maturities of long-term borrowings, outstanding as of December 31, 2012, are as follows:
(In millions of Korean won)
For the Years Ending December 31 Long-term borrowings in local currency
2013 ₩493,860
2014 2,583,907
2015 380,722
2016 573,564
Thereafter 84,835
Total ₩4,116,888
8584
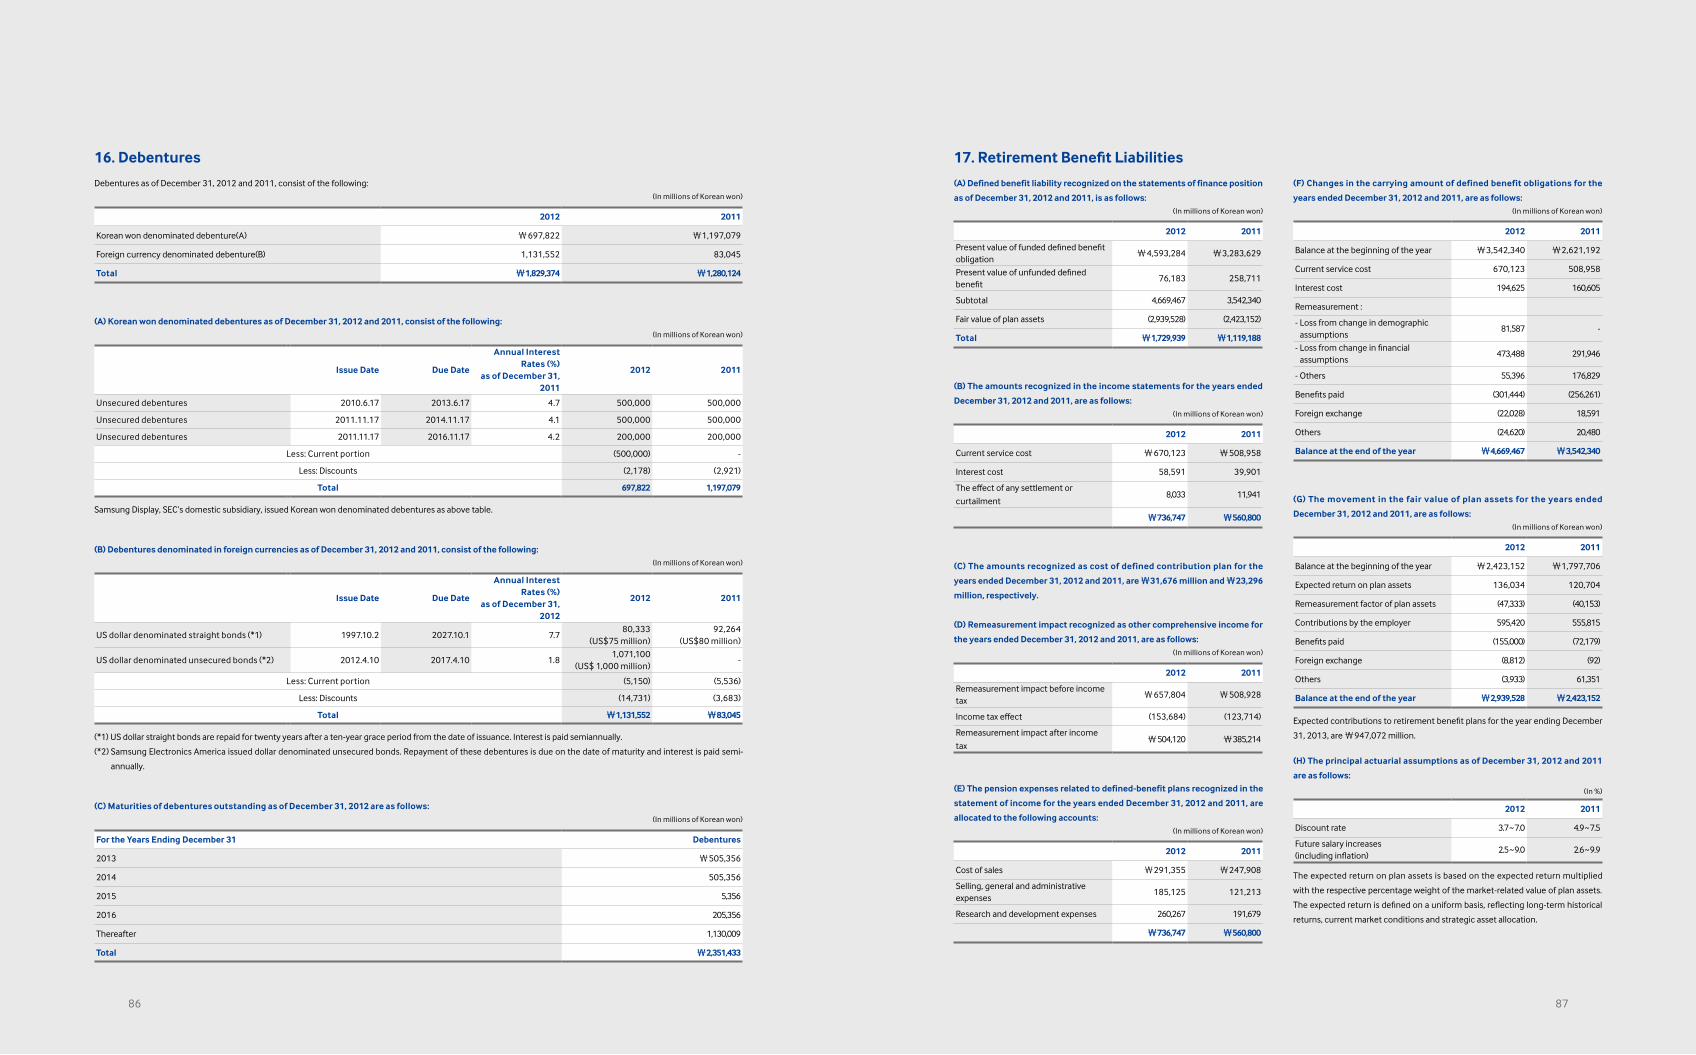
16. Debentures
Debentures as of December 31, 2012 and 2011, consist of the following:(In millions of Korean won)
2012 2011
Korean won denominated debenture(A) ₩697,822 ₩1,197,079
Foreign currency denominated debenture(B) 1,131,552 83,045
Total ₩1,829,374 ₩1,280,124
(A) Korean won denominated debentures as of December 31, 2012 and 2011, consist of the following:(In millions of Korean won)
Issue Date Due Date
Annual Interest Rates (%)
as of December 31, 2011
2012 2011
Unsecured debentures 2010.6.17 2013.6.17 4.7 500,000 500,000
Unsecured debentures 2011.11.17 2014.11.17 4.1 500,000 500,000
Unsecured debentures 2011.11.17 2016.11.17 4.2 200,000 200,000
Less: Current portion (500,000) -
Less: Discounts (2,178) (2,921)
Total 697,822 1,197,079
Samsung Display, SEC’s domestic subsidiary, issued Korean won denominated debentures as above table.
(B) Debentures denominated in foreign currencies as of December 31, 2012 and 2011, consist of the following:(In millions of Korean won)
Issue Date Due Date
Annual Interest Rates (%)
as of December 31, 2012
2012 2011
US dollar denominated straight bonds (*1) 1997.10.2 2027.10.1 7.780,333
(US$75 million)92,264
(US$80 million)
US dollar denominated unsecured bonds (*2) 2012.4.10 2017.4.10 1.81,071,100
(US$ 1,000 million)-
Less: Current portion (5,150) (5,536)
Less: Discounts (14,731) (3,683)
Total ₩1,131,552 ₩83,045
(*1) US dollar straight bonds are repaid for twenty years after a ten-year grace period from the date of issuance. Interest is paid semiannually.
(*2) Samsung Electronics America issued dollar denominated unsecured bonds. Repayment of these debentures is due on the date of maturity and interest is paid semi-
annually.
(C) Maturities of debentures outstanding as of December 31, 2012 are as follows:(In millions of Korean won)
For the Years Ending December 31 Debentures
2013 ₩505,356
2014 505,356
2015 5,356
2016 205,356
Thereafter 1,130,009
Total ₩2,351,433
17. Retirement Benefit Liabilities
(A) Defined benefit liability recognized on the statements of finance position
as of December 31, 2012 and 2011, is as follows:(In millions of Korean won)
2012 2011
Present value of funded defined benefit obligation
₩4,593,284 ₩3,283,629
Present value of unfunded defined benefit
76,183 258,711
Subtotal 4,669,467 3,542,340
Fair value of plan assets (2,939,528) (2,423,152)
Total ₩1,729,939 ₩1,119,188
(B) The amounts recognized in the income statements for the years ended
December 31, 2012 and 2011, are as follows:(In millions of Korean won)
2012 2011
Current service cost ₩670,123 ₩508,958
Interest cost 58,591 39,901
The effect of any settlement or
curtailment8,033 11,941
₩736,747 ₩560,800
(C) The amounts recognized as cost of defined contribution plan for the
years ended December 31, 2012 and 2011, are ₩31,676 million and ₩23,296
million, respectively.
(D) Remeasurement impact recognized as other comprehensive income for
the years ended December 31, 2012 and 2011, are as follows:(In millions of Korean won)
2012 2011
Remeasurement impact before income tax
₩657,804 ₩508,928
Income tax effect (153,684) (123,714)
Remeasurement impact after income
tax₩504,120 ₩385,214
(E) The pension expenses related to defined-benefit plans recognized in the
statement of income for the years ended December 31, 2012 and 2011, are
allocated to the following accounts:(In millions of Korean won)
2012 2011
Cost of sales ₩291,355 ₩247,908
Selling, general and administrative expenses
185,125 121,213
Research and development expenses 260,267 191,679
₩736,747 ₩560,800
8786
(F) Changes in the carrying amount of defined benefit obligations for the
years ended December 31, 2012 and 2011, are as follows:(In millions of Korean won)
2012 2011
Balance at the beginning of the year ₩3,542,340 ₩2,621,192
Current service cost 670,123 508,958
Interest cost 194,625 160,605
Remeasurement :
- Loss from change in demographic assumptions
81,587 -
- Loss from change in financial assumptions
473,488 291,946
- Others 55,396 176,829
Benefits paid (301,444) (256,261)
Foreign exchange (22,028) 18,591
Others (24,620) 20,480
Balance at the end of the year ₩4,669,467 ₩3,542,340
(G) The movement in the fair value of plan assets for the years ended
December 31, 2012 and 2011, are as follows:(In millions of Korean won)
2012 2011
Balance at the beginning of the year ₩2,423,152 ₩1,797,706
Expected return on plan assets 136,034 120,704
Remeasurement factor of plan assets (47,333) (40,153)
Contributions by the employer 595,420 555,815
Benefits paid (155,000) (72,179)
Foreign exchange (8,812) (92)
Others (3,933) 61,351
Balance at the end of the year ₩2,939,528 ₩2,423,152
Expected contributions to retirement benefit plans for the year ending December
31, 2013, are ₩947,072 million.
(H) The principal actuarial assumptions as of December 31, 2012 and 2011
are as follows:
(In %)
2012 2011
Discount rate 3.7 ~ 7.0 4.9 ~ 7.5
Future salary increases (including inflation)
2.5 ~ 9.0 2.6 ~ 9.9
The expected return on plan assets is based on the expected return multiplied
with the respective percentage weight of the market-related value of plan assets.
The expected return is defined on a uniform basis, reflecting long-term historical
returns, current market conditions and strategic asset allocation.
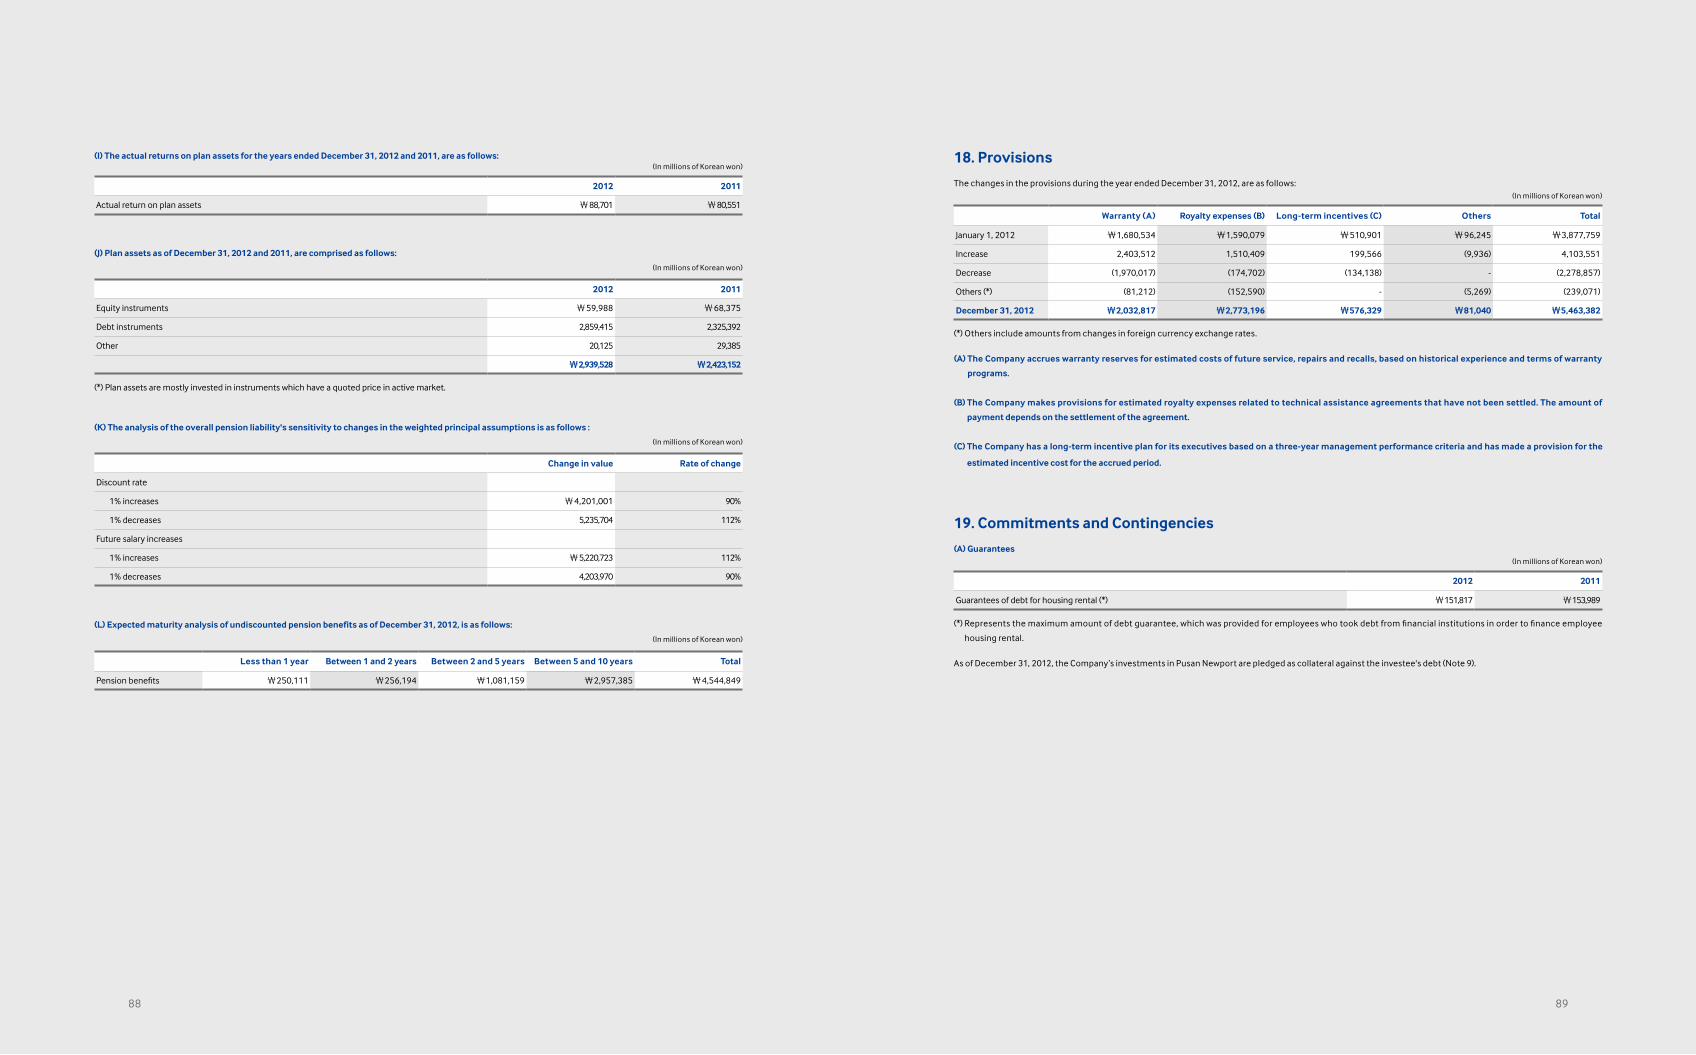
(I) The actual returns on plan assets for the years ended December 31, 2012 and 2011, are as follows:(In millions of Korean won)
2012 2011
Actual return on plan assets ₩88,701 ₩80,551
(J) Plan assets as of December 31, 2012 and 2011, are comprised as follows:
(In millions of Korean won)
2012 2011
Equity instruments ₩59,988 ₩68,375
Debt instruments 2,859,415 2,325,392
Other 20,125 29,385
₩2,939,528 ₩2,423,152
(*) Plan assets are mostly invested in instruments which have a quoted price in active market.
(K) The analysis of the overall pension liability's sensitivity to changes in the weighted principal assumptions is as follows :
(In millions of Korean won)
Change in value Rate of change
Discount rate
1% increases ₩4,201,001 90%
1% decreases 5,235,704 112%
Future salary increases
1% increases ₩5,220,723 112%
1% decreases 4,203,970 90%
(L) Expected maturity analysis of undiscounted pension benefits as of December 31, 2012, is as follows:
(In millions of Korean won)
Less than 1 year Between 1 and 2 years Between 2 and 5 years Between 5 and 10 years Total
Pension benefits ₩250,111 ₩256,194 ₩1,081,159 ₩2,957,385 ₩4,544,849
8988
18. Provisions
The changes in the provisions during the year ended December 31, 2012, are as follows:(In millions of Korean won)
Warranty (A) Royalty expenses (B) Long-term incentives (C) Others Total
January 1, 2012 ₩1,680,534 ₩1,590,079 ₩510,901 ₩96,245 ₩3,877,759
Increase 2,403,512 1,510,409 199,566 (9,936) 4,103,551
Decrease (1,970,017) (174,702) (134,138) - (2,278,857)
Others (*) (81,212) (152,590) - (5,269) (239,071)
December 31, 2012 ₩2,032,817 ₩2,773,196 ₩576,329 ₩81,040 ₩5,463,382
(*) Others include amounts from changes in foreign currency exchange rates.
(A) The Company accrues warranty reserves for estimated costs of future service, repairs and recalls, based on historical experience and terms of warranty
programs.
(B) The Company makes provisions for estimated royalty expenses related to technical assistance agreements that have not been settled. The amount of
payment depends on the settlement of the agreement.
(C) The Company has a long-term incentive plan for its executives based on a three-year management performance criteria and has made a provision for the
estimated incentive cost for the accrued period.
19. Commitments and Contingencies
(A) Guarantees(In millions of Korean won)
2012 2011
Guarantees of debt for housing rental (*) ₩151,817 ₩153,989
(*) Represents the maximum amount of debt guarantee, which was provided for employees who took debt from financial institutions in order to finance employee
housing rental.
As of December 31, 2012, the Company’s investments in Pusan Newport are pledged as collateral against the investee's debt (Note 9).
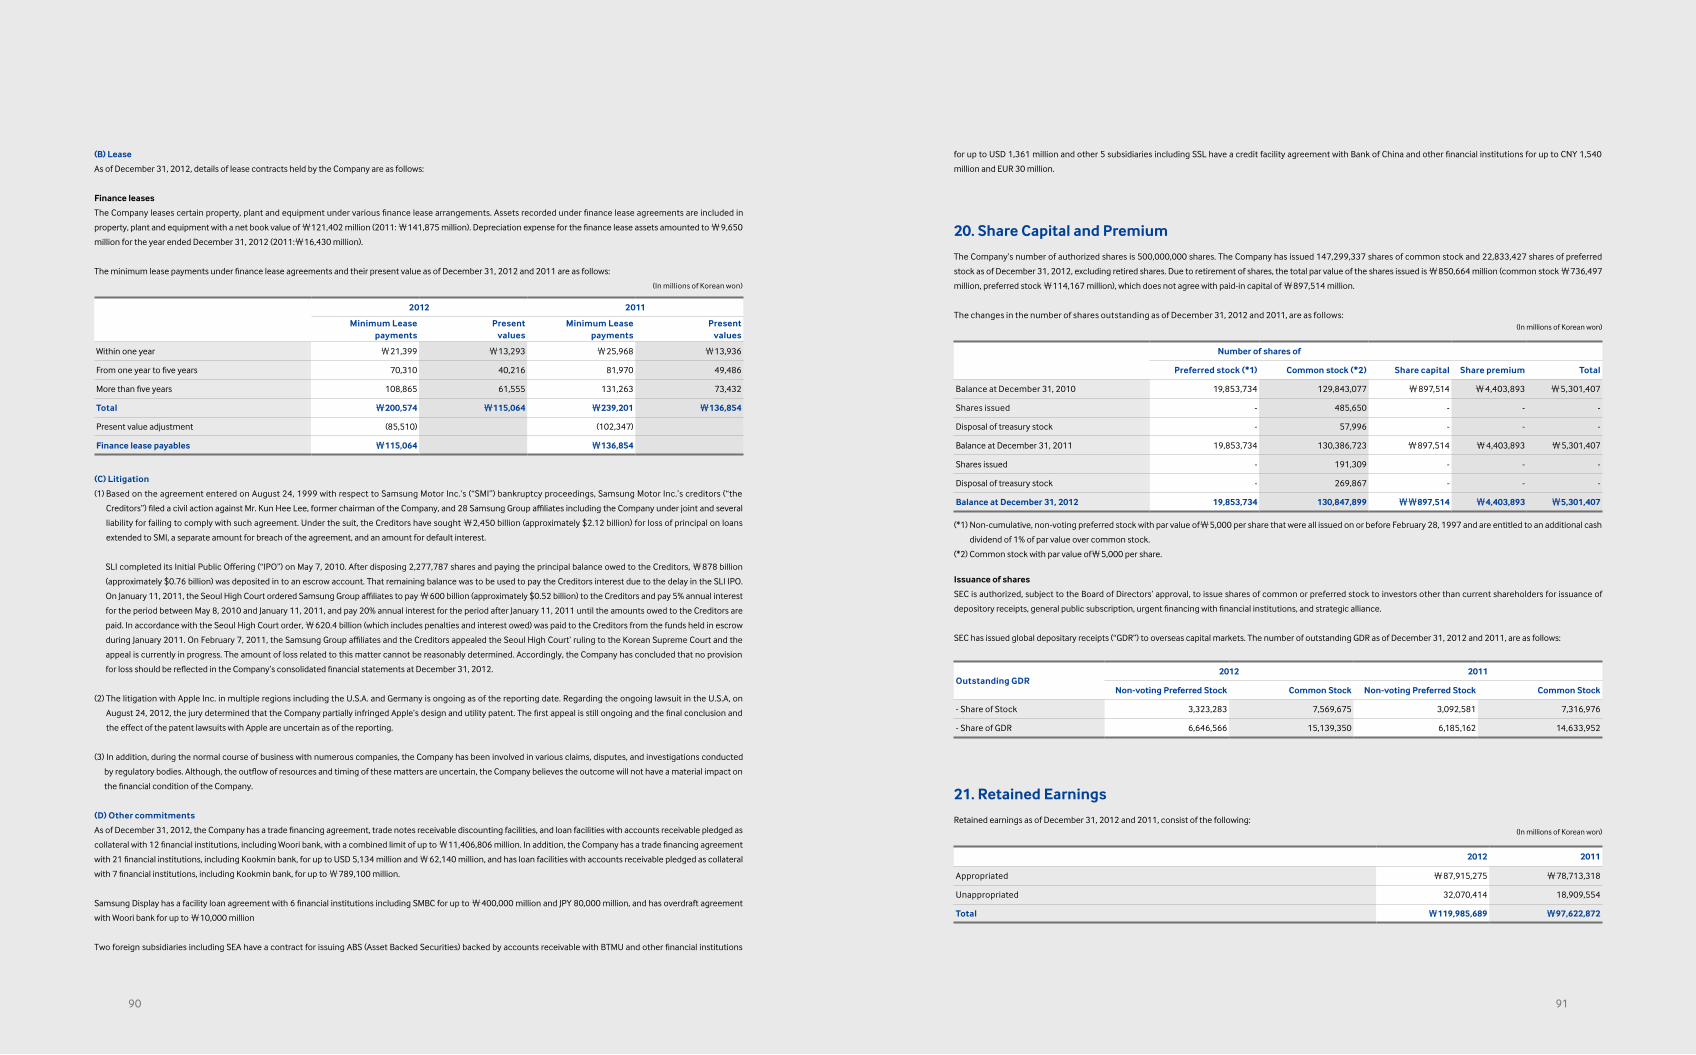
(B) Lease
As of December 31, 2012, details of lease contracts held by the Company are as follows:
Finance leases
The Company leases certain property, plant and equipment under various finance lease arrangements. Assets recorded under finance lease agreements are included in
property, plant and equipment with a net book value of ₩121,402 million (2011: ₩141,875 million). Depreciation expense for the finance lease assets amounted to ₩9,650
million for the year ended December 31, 2012 (2011:₩16,430 million).
The minimum lease payments under finance lease agreements and their present value as of December 31, 2012 and 2011 are as follows:
(In millions of Korean won)
2012 2011
Minimum Leasepayments
Presentvalues
Minimum Leasepayments
Presentvalues
Within one year ₩21,399 ₩13,293 ₩25,968 ₩13,936
From one year to five years 70,310 40,216 81,970 49,486
More than five years 108,865 61,555 131,263 73,432
Total ₩200,574 ₩115,064 ₩239,201 ₩136,854
Present value adjustment (85,510) (102,347)
Finance lease payables ₩115,064 ₩136,854
(C) Litigation
(1) Based on the agreement entered on August 24, 1999 with respect to Samsung Motor Inc.’s (“SMI”) bankruptcy proceedings, Samsung Motor Inc.’s creditors (“the
Creditors”) filed a civil action against Mr. Kun Hee Lee, former chairman of the Company, and 28 Samsung Group affiliates including the Company under joint and several
liability for failing to comply with such agreement. Under the suit, the Creditors have sought ₩2,450 billion (approximately $2.12 billion) for loss of principal on loans
extended to SMI, a separate amount for breach of the agreement, and an amount for default interest.
SLI completed its Initial Public Offering (“IPO”) on May 7, 2010. After disposing 2,277,787 shares and paying the principal balance owed to the Creditors, ₩878 billion
(approximately $0.76 billion) was deposited in to an escrow account. That remaining balance was to be used to pay the Creditors interest due to the delay in the SLI IPO.
On January 11, 2011, the Seoul High Court ordered Samsung Group affiliates to pay ₩600 billion (approximately $0.52 billion) to the Creditors and pay 5% annual interest
for the period between May 8, 2010 and January 11, 2011, and pay 20% annual interest for the period after January 11, 2011 until the amounts owed to the Creditors are
paid. In accordance with the Seoul High Court order, ₩620.4 billion (which includes penalties and interest owed) was paid to the Creditors from the funds held in escrow
during January 2011. On February 7, 2011, the Samsung Group affiliates and the Creditors appealed the Seoul High Court’ ruling to the Korean Supreme Court and the
appeal is currently in progress. The amount of loss related to this matter cannot be reasonably determined. Accordingly, the Company has concluded that no provision
for loss should be reflected in the Company’s consolidated financial statements at December 31, 2012.
(2) The litigation with Apple Inc. in multiple regions including the U.S.A. and Germany is ongoing as of the reporting date. Regarding the ongoing lawsuit in the U.S.A, on
August 24, 2012, the jury determined that the Company partially infringed Apple’s design and utility patent. The first appeal is still ongoing and the final conclusion and
the effect of the patent lawsuits with Apple are uncertain as of the reporting.
(3) In addition, during the normal course of business with numerous companies, the Company has been involved in various claims, disputes, and investigations conducted
by regulatory bodies. Although, the outflow of resources and timing of these matters are uncertain, the Company believes the outcome will not have a material impact on
the financial condition of the Company.
(D) Other commitments
As of December 31, 2012, the Company has a trade financing agreement, trade notes receivable discounting facilities, and loan facilities with accounts receivable pledged as
collateral with 12 financial institutions, including Woori bank, with a combined limit of up to ₩11,406,806 million. In addition, the Company has a trade financing agreement
with 21 financial institutions, including Kookmin bank, for up to USD 5,134 million and ₩62,140 million, and has loan facilities with accounts receivable pledged as collateral
with 7 financial institutions, including Kookmin bank, for up to ₩789,100 million.
Samsung Display has a facility loan agreement with 6 financial institutions including SMBC for up to ₩400,000 million and JPY 80,000 million, and has overdraft agreement
with Woori bank for up to ₩10,000 million
Two foreign subsidiaries including SEA have a contract for issuing ABS (Asset Backed Securities) backed by accounts receivable with BTMU and other financial institutions
9190
for up to USD 1,361 million and other 5 subsidiaries including SSL have a credit facility agreement with Bank of China and other financial institutions for up to CNY 1,540
million and EUR 30 million.
20. Share Capital and Premium
The Company’s number of authorized shares is 500,000,000 shares. The Company has issued 147,299,337 shares of common stock and 22,833,427 shares of preferred
stock as of December 31, 2012, excluding retired shares. Due to retirement of shares, the total par value of the shares issued is ₩850,664 million (common stock ₩736,497
million, preferred stock ₩114,167 million), which does not agree with paid-in capital of ₩897,514 million.
The changes in the number of shares outstanding as of December 31, 2012 and 2011, are as follows:(In millions of Korean won)
Number of shares of
Preferred stock (*1) Common stock (*2) Share capital Share premium Total
Balance at December 31, 2010 19,853,734 129,843,077 ₩897,514 ₩4,403,893 ₩5,301,407
Shares issued - 485,650 - - -
Disposal of treasury stock - 57,996 - - -
Balance at December 31, 2011 19,853,734 130,386,723 ₩897,514 ₩4,403,893 ₩5,301,407
Shares issued - 191,309 - - -
Disposal of treasury stock - 269,867 - - -
Balance at December 31, 2012 19,853,734 130,847,899 ₩₩897,514 ₩4,403,893 ₩5,301,407
(*1) Non-cumulative, non-voting preferred stock with par value of₩5,000 per share that were all issued on or before February 28, 1997 and are entitled to an additional cash
dividend of 1% of par value over common stock.
(*2) Common stock with par value of₩5,000 per share.
Issuance of shares
SEC is authorized, subject to the Board of Directors’ approval, to issue shares of common or preferred stock to investors other than current shareholders for issuance of
depository receipts, general public subscription, urgent financing with financial institutions, and strategic alliance.
SEC has issued global depositary receipts (“GDR”) to overseas capital markets. The number of outstanding GDR as of December 31, 2012 and 2011, are as follows:
Outstanding GDR2012 2011
Non-voting Preferred Stock Common Stock Non-voting Preferred Stock Common Stock
- Share of Stock 3,323,283 7,569,675 3,092,581 7,316,976
- Share of GDR 6,646,566 15,139,350 6,185,162 14,633,952
21. Retained Earnings
Retained earnings as of December 31, 2012 and 2011, consist of the following:(In millions of Korean won)
2012 2011
Appropriated ₩87,915,275 ₩78,713,318
Unappropriated 32,070,414 18,909,554
Total ₩119,985,689 ₩97,622,872
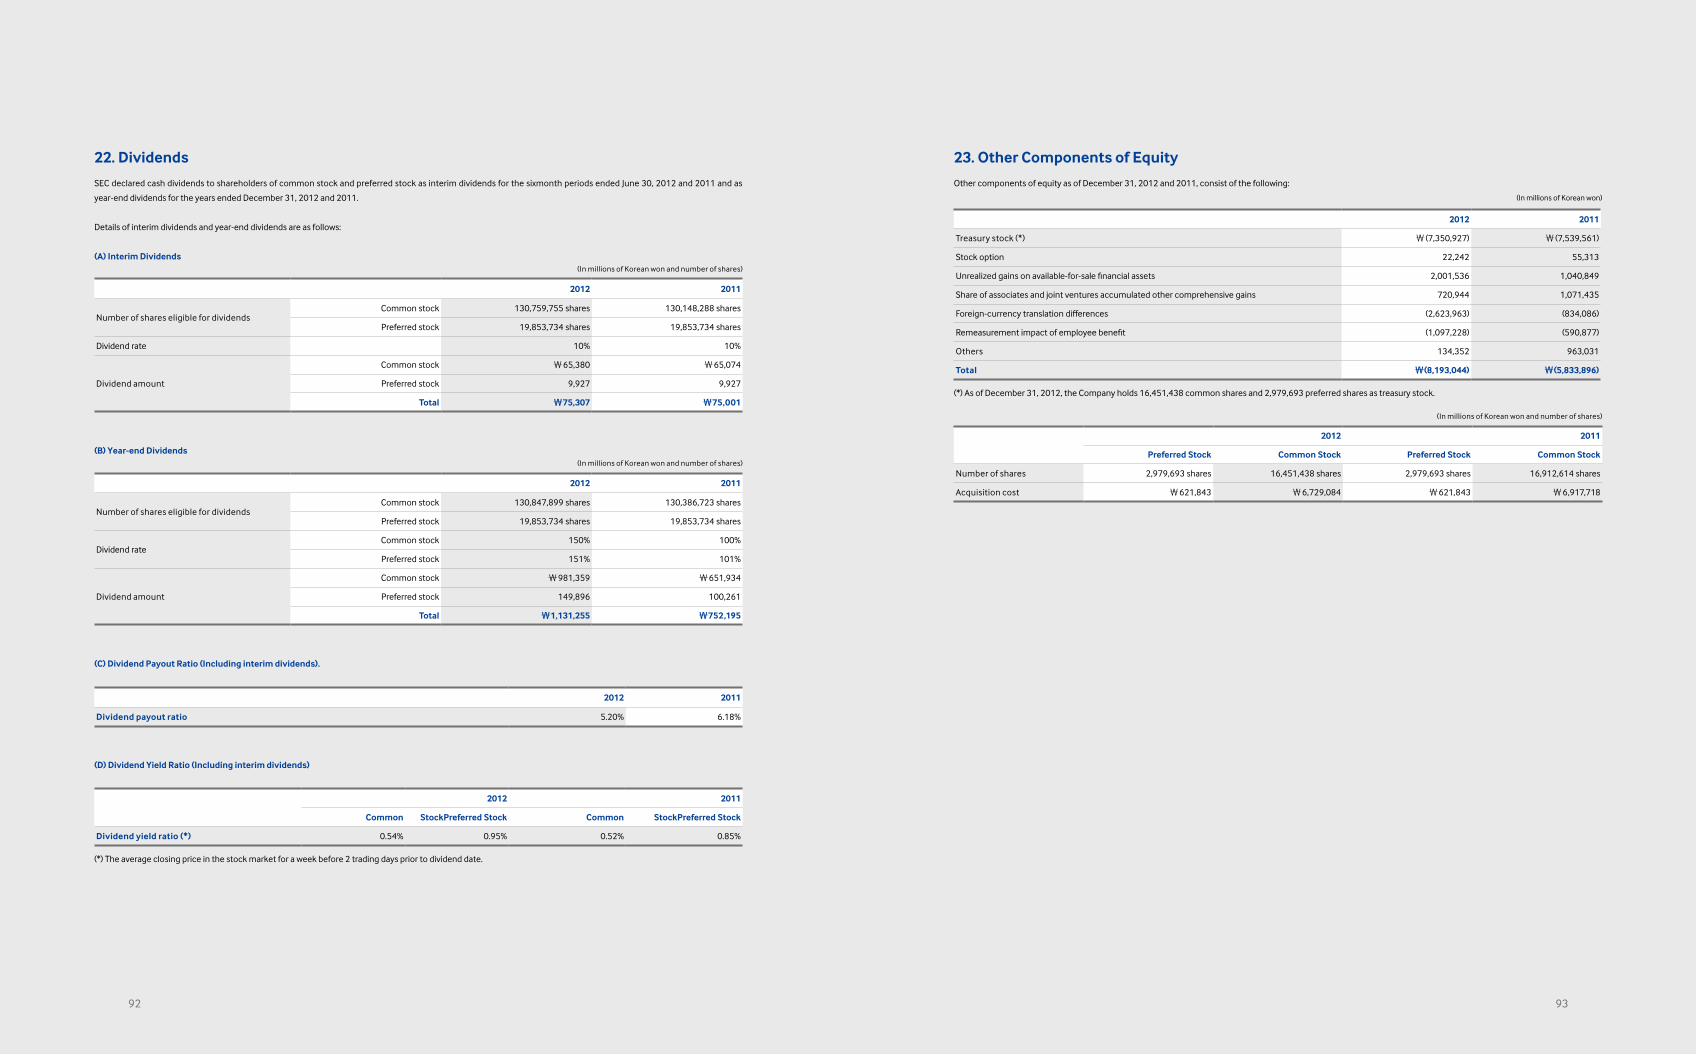
22. Dividends
SEC declared cash dividends to shareholders of common stock and preferred stock as interim dividends for the sixmonth periods ended June 30, 2012 and 2011 and as
year-end dividends for the years ended December 31, 2012 and 2011.
Details of interim dividends and year-end dividends are as follows:
(A) Interim Dividends(In millions of Korean won and number of shares)
2012 2011
Number of shares eligible for dividendsCommon stock 130,759,755 shares 130,148,288 shares
Preferred stock 19,853,734 shares 19,853,734 shares
Dividend rate 10% 10%
Dividend amount
Common stock ₩65,380 ₩65,074
Preferred stock 9,927 9,927
Total ₩75,307 ₩75,001
(B) Year-end Dividends(In millions of Korean won and number of shares)
2012 2011
Number of shares eligible for dividendsCommon stock 130,847,899 shares 130,386,723 shares
Preferred stock 19,853,734 shares 19,853,734 shares
Dividend rateCommon stock 150% 100%
Preferred stock 151% 101%
Dividend amount
Common stock ₩981,359 ₩651,934
Preferred stock 149,896 100,261
Total ₩1,131,255 ₩752,195
(C) Dividend Payout Ratio (Including interim dividends).
2012 2011
Dividend payout ratio 5.20% 6.18%
(D) Dividend Yield Ratio (Including interim dividends)
2012 2011
Common StockPreferred Stock Common StockPreferred Stock
Dividend yield ratio (*) 0.54% 0.95% 0.52% 0.85%
(*) The average closing price in the stock market for a week before 2 trading days prior to dividend date.
9392
23. Other Components of Equity
Other components of equity as of December 31, 2012 and 2011, consist of the following:
(In millions of Korean won)
2012 2011
Treasury stock (*) ₩(7,350,927) ₩(7,539,561)
Stock option 22,242 55,313
Unrealized gains on available-for-sale financial assets 2,001,536 1,040,849
Share of associates and joint ventures accumulated other comprehensive gains 720,944 1,071,435
Foreign-currency translation differences (2,623,963) (834,086)
Remeasurement impact of employee benefit (1,097,228) (590,877)
Others 134,352 963,031
Total ₩(8,193,044) ₩(5,833,896)
(*) As of December 31, 2012, the Company holds 16,451,438 common shares and 2,979,693 preferred shares as treasury stock.
(In millions of Korean won and number of shares)
2012 2011
Preferred Stock Common Stock Preferred Stock Common Stock
Number of shares 2,979,693 shares 16,451,438 shares 2,979,693 shares 16,912,614 shares
Acquisition cost ₩621,843 ₩6,729,084 ₩621,843 ₩6,917,718
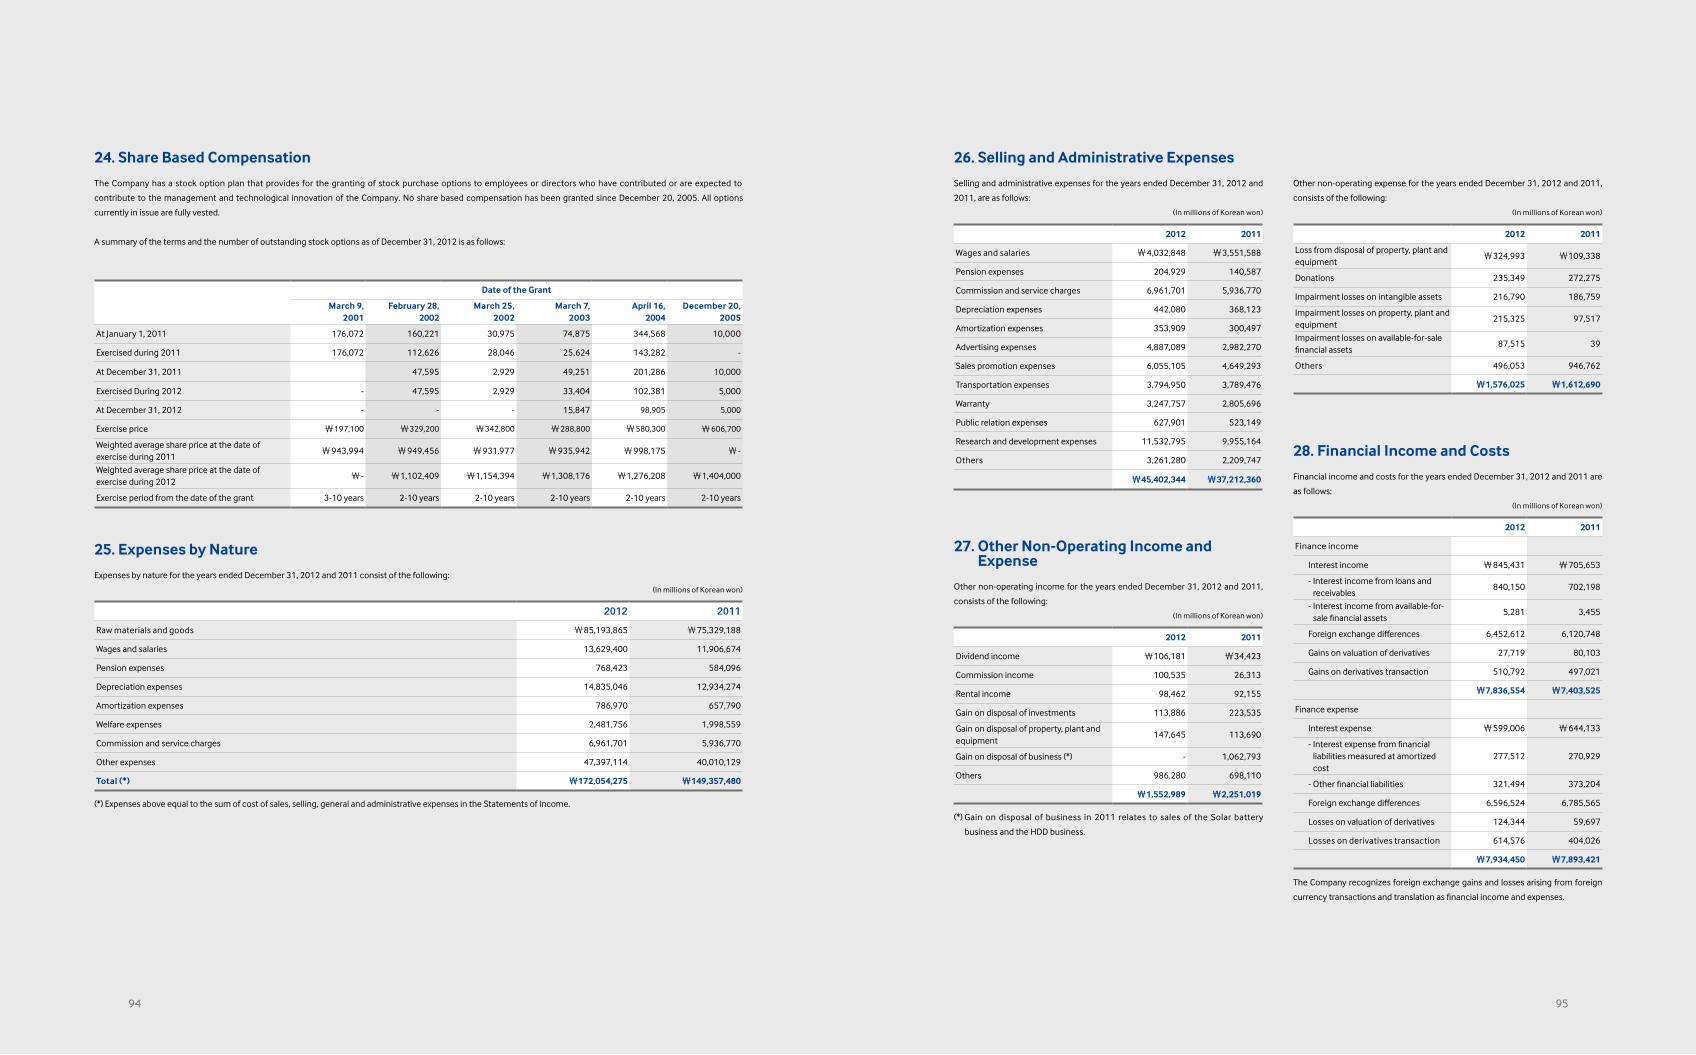
24. Share Based Compensation
The Company has a stock option plan that provides for the granting of stock purchase options to employees or directors who have contributed or are expected to
contribute to the management and technological innovation of the Company. No share based compensation has been granted since December 20, 2005. All options
currently in issue are fully vested.
A summary of the terms and the number of outstanding stock options as of December 31, 2012 is as follows:
Date of the Grant
March 9,2001
February 28,2002
March 25,2002
March 7,2003
April 16,2004
December 20,2005
At January 1, 2011 176,072 160,221 30,975 74,875 344,568 10,000
Exercised during 2011 176,072 112,626 28,046 25,624 143,282 -
At December 31, 2011 47,595 2,929 49,251 201,286 10,000
Exercised During 2012 - 47,595 2,929 33,404 102,381 5,000
At December 31, 2012 - - - 15,847 98,905 5,000
Exercise price ₩197,100 ₩329,200 ₩342,800 ₩288,800 ₩580,300 ₩606,700
Weighted average share price at the date of exercise during 2011
₩943,994 ₩949,456 ₩931,977 ₩935,942 ₩998,175 ₩-
Weighted average share price at the date of exercise during 2012
₩- ₩1,102,409 ₩1,154,394 ₩1,308,176 ₩1,276,208 ₩1,404,000
Exercise period from the date of the grant 3-10 years 2-10 years 2-10 years 2-10 years 2-10 years 2-10 years
25. Expenses by Nature
Expenses by nature for the years ended December 31, 2012 and 2011 consist of the following:
(In millions of Korean won)
2012 2011
Raw materials and goods ₩85,193,865 ₩75,329,188
Wages and salaries 13,629,400 11,906,674
Pension expenses 768,423 584,096
Depreciation expenses 14,835,046 12,934,274
Amortization expenses 786,970 657,790
Welfare expenses 2,481,756 1,998,559
Commission and service charges 6,961,701 5,936,770
Other expenses 47,397,114 40,010,129
Total (*) ₩172,054,275 ₩149,357,480
(*) Expenses above equal to the sum of cost of sales, selling, general and administrative expenses in the Statements of Income.
9594
26. Selling and Administrative Expenses
Selling and administrative expenses for the years ended December 31, 2012 and
2011, are as follows:
(In millions of Korean won)
2012 2011
Wages and salaries ₩4,032,848 ₩3,551,588
Pension expenses 204,929 140,587
Commission and service charges 6,961,701 5,936,770
Depreciation expenses 442,080 368,123
Amortization expenses 353,909 300,497
Advertising expenses 4,887,089 2,982,270
Sales promotion expenses 6,055,105 4,649,293
Transportation expenses 3,794,950 3,789,476
Warranty 3,247,757 2,805,696
Public relation expenses 627,901 523,149
Research and development expenses 11,532,795 9,955,164
Others 3,261,280 2,209,747
₩45,402,344 ₩37,212,360
27. Other Non-Operating Income and Expense
Other non-operating income for the years ended December 31, 2012 and 2011,
consists of the following:
(In millions of Korean won)
2012 2011
Dividend income ₩106,181 ₩34,423
Commission income 100,535 26,313
Rental income 98,462 92,155
Gain on disposal of investments 113,886 223,535
Gain on disposal of property, plant and equipment
147,645 113,690
Gain on disposal of business (*) - 1,062,793
Others 986,280 698,110
₩1,552,989 ₩2,251,019
(*) Gain on disposal of business in 2011 relates to sales of the Solar battery
business and the HDD business.
Other non-operating expense for the years ended December 31, 2012 and 2011,
consists of the following:
(In millions of Korean won)
2012 2011
Loss from disposal of property, plant and equipment
₩324,993 ₩109,338
Donations 235,349 272,275
Impairment losses on intangible assets 216,790 186,759
Impairment losses on property, plant and equipment
215,325 97,517
Impairment losses on available-for-sale financial assets
87,515 39
Others 496,053 946,762
₩1,576,025 ₩1,612,690
28. Financial Income and Costs
Financial income and costs for the years ended December 31, 2012 and 2011 are
as follows:
(In millions of Korean won)
2012 2011
Finance income
Interest income ₩845,431 ₩705,653
- Interest income from loans and receivables
840,150 702,198
- Interest income from available-for-sale financial assets
5,281 3,455
Foreign exchange differences 6,452,612 6,120,748
Gains on valuation of derivatives 27,719 80,103
Gains on derivatives transaction 510,792 497,021
₩7,836,554 ₩7,403,525
Finance expense
Interest expense ₩599,006 ₩644,133
- Interest expense from financial liabilities measured at amortized cost
277,512 270,929
- Other financial liabilities 321,494 373,204
Foreign exchange differences 6,596,524 6,785,565
Losses on valuation of derivatives 124,344 59,697
Losses on derivatives transaction 614,576 404,026
₩7,934,450 ₩7,893,421
The Company recognizes foreign exchange gains and losses arising from foreign
currency transactions and translation as financial income and expenses.
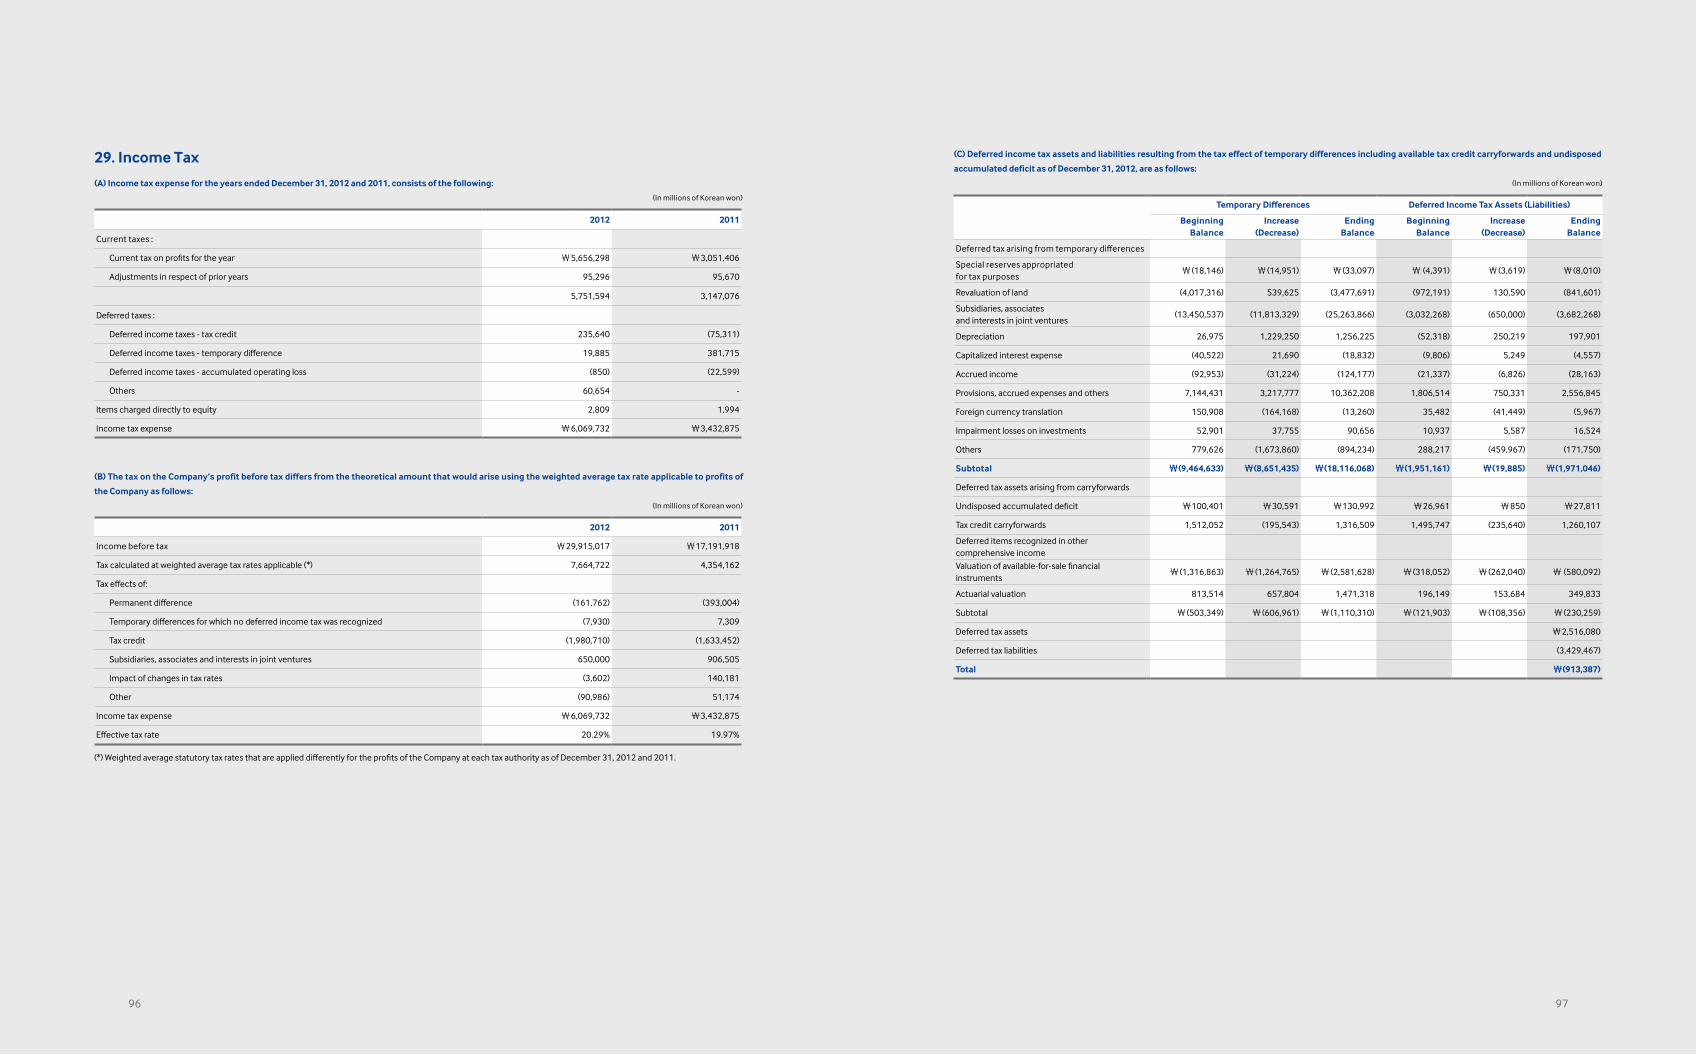
29. Income Tax
(A) Income tax expense for the years ended December 31, 2012 and 2011, consists of the following:
(In millions of Korean won)
2012 2011
Current taxes :
Current tax on profits for the year ₩5,656,298 ₩3,051,406
Adjustments in respect of prior years 95,296 95,670
5,751,594 3,147,076
Deferred taxes :
Deferred income taxes - tax credit 235,640 (75,311)
Deferred income taxes - temporary difference 19,885 381,715
Deferred income taxes - accumulated operating loss (850) (22,599)
Others 60,654 -
Items charged directly to equity 2,809 1,994
Income tax expense ₩6,069,732 ₩3,432,875
(B) The tax on the Company’s profit before tax differs from the theoretical amount that would arise using the weighted average tax rate applicable to profits of
the Company as follows:
(In millions of Korean won)
2012 2011
Income before tax ₩29,915,017 ₩17,191,918
Tax calculated at weighted average tax rates applicable (*) 7,664,722 4,354,162
Tax effects of:
Permanent difference (161,762) (393,004)
Temporary differences for which no deferred income tax was recognized (7,930) 7,309
Tax credit (1,980,710) (1,633,452)
Subsidiaries, associates and interests in joint ventures 650,000 906,505
Impact of changes in tax rates (3,602) 140,181
Other (90,986) 51,174
Income tax expense ₩6,069,732 ₩3,432,875
Effective tax rate 20.29% 19.97%
(*) Weighted average statutory tax rates that are applied differently for the profits of the Company at each tax authority as of December 31, 2012 and 2011.
(C) Deferred income tax assets and liabilities resulting from the tax effect of temporary differences including available tax credit carryforwards and undisposed
accumulated deficit as of December 31, 2012, are as follows:
(In millions of Korean won)
Temporary Differences Deferred Income Tax Assets (Liabilities)
BeginningBalance
Increase(Decrease)
EndingBalance
BeginningBalance
Increase(Decrease)
EndingBalance
Deferred tax arising from temporary differences
Special reserves appropriatedfor tax purposes
₩(18,146) ₩(14,951) ₩(33,097) ₩ (4,391) ₩(3,619) ₩(8,010)
Revaluation of land (4,017,316) 539,625 (3,477,691) (972,191) 130,590 (841,601)
Subsidiaries, associatesand interests in joint ventures
(13,450,537) (11,813,329) (25,263,866) (3,032,268) (650,000) (3,682,268)
Depreciation 26,975 1,229,250 1,256,225 (52,318) 250,219 197,901
Capitalized interest expense (40,522) 21,690 (18,832) (9,806) 5,249 (4,557)
Accrued income (92,953) (31,224) (124,177) (21,337) (6,826) (28,163)
Provisions, accrued expenses and others 7,144,431 3,217,777 10,362,208 1,806,514 750,331 2,556,845
Foreign currency translation 150,908 (164,168) (13,260) 35,482 (41,449) (5,967)
Impairment losses on investments 52,901 37,755 90,656 10,937 5,587 16,524
Others 779,626 (1,673,860) (894,234) 288,217 (459,967) (171,750)
Subtotal ₩(9,464,633) ₩(8,651,435) ₩(18,116,068) ₩(1,951,161) ₩(19,885) ₩(1,971,046)
Deferred tax assets arising from carryforwards
Undisposed accumulated deficit ₩100,401 ₩30,591 ₩130,992 ₩26,961 ₩850 ₩27,811
Tax credit carryforwards 1,512,052 (195,543) 1,316,509 1,495,747 (235,640) 1,260,107
Deferred items recognized in other comprehensive income
Valuation of available-for-sale financial instruments
₩(1,316,863) ₩(1,264,765) ₩(2,581,628) ₩(318,052) ₩(262,040) ₩ (580,092)
Actuarial valuation 813,514 657,804 1,471,318 196,149 153,684 349,833
Subtotal ₩(503,349) ₩(606,961) ₩(1,110,310) ₩(121,903) ₩(108,356) ₩(230,259)
Deferred tax assets ₩2,516,080
Deferred tax liabilities (3,429,467)
Total ₩(913,387)
9796
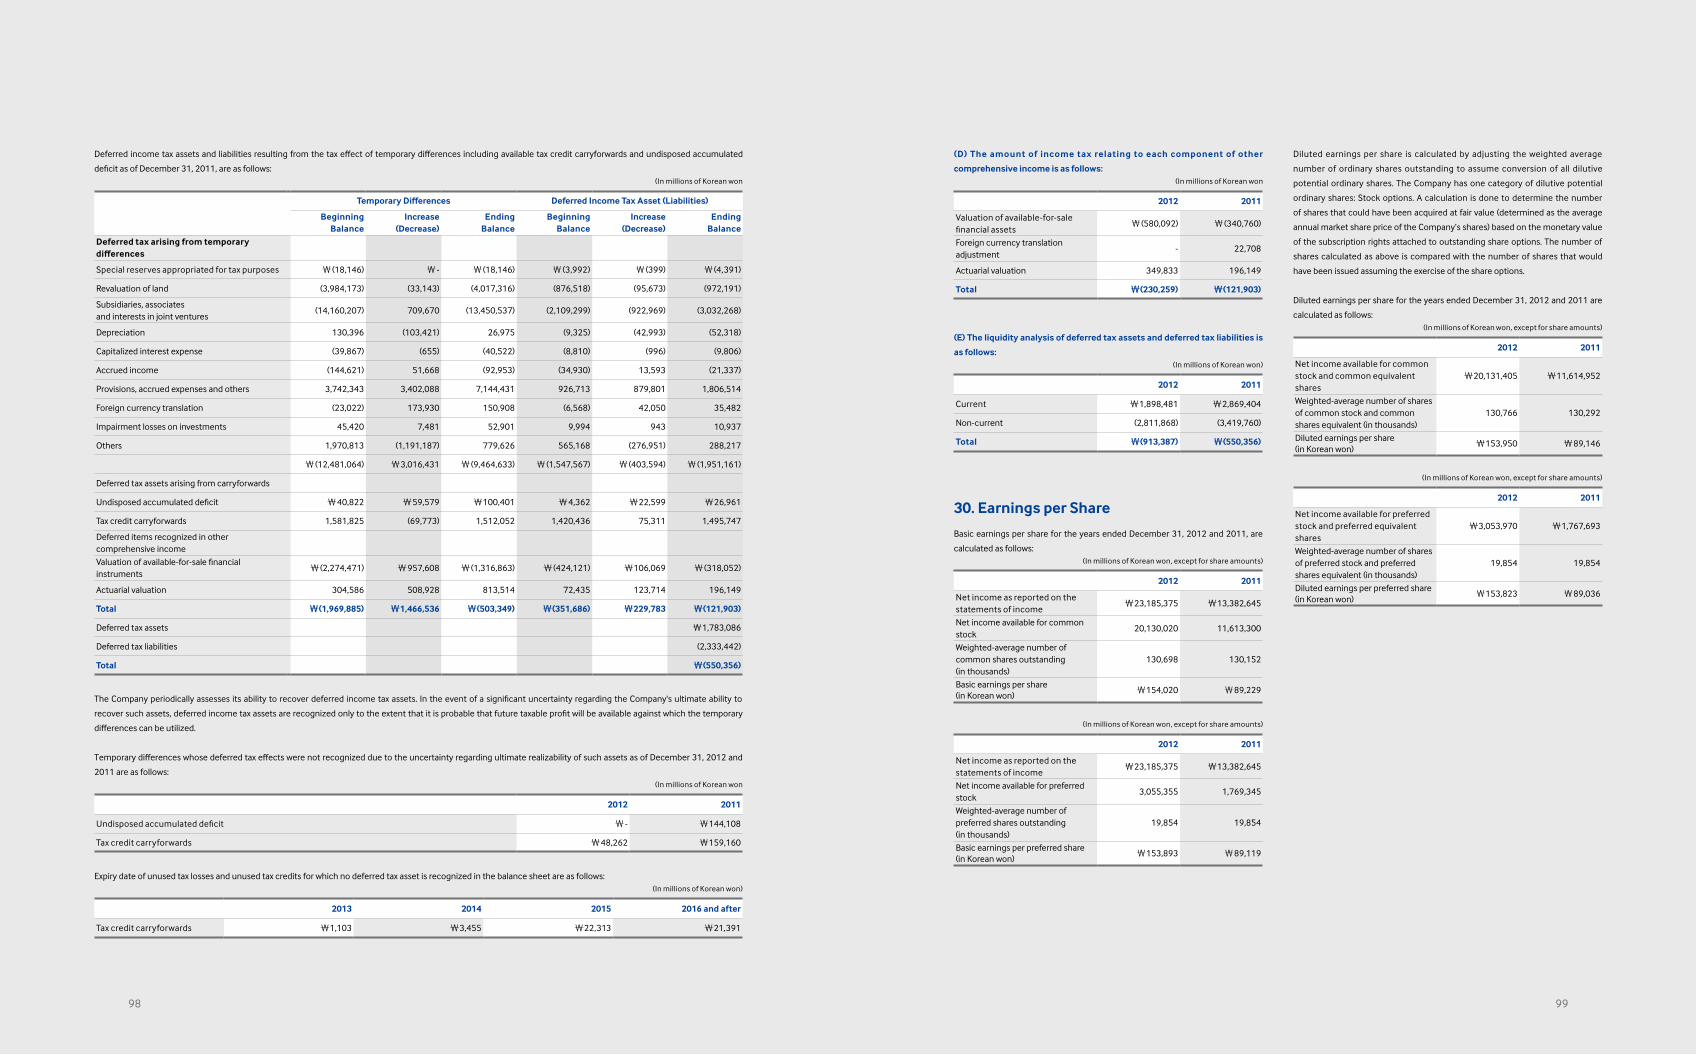
Deferred income tax assets and liabilities resulting from the tax effect of temporary differences including available tax credit carryforwards and undisposed accumulated
deficit as of December 31, 2011, are as follows:(In millions of Korean won
Temporary Differences Deferred Income Tax Asset (Liabilities)
BeginningBalance
Increase(Decrease)
EndingBalance
BeginningBalance
Increase(Decrease)
EndingBalance
Deferred tax arising from temporary differences
Special reserves appropriated for tax purposes ₩(18,146) ₩- ₩(18,146) ₩(3,992) ₩(399) ₩(4,391)
Revaluation of land (3,984,173) (33,143) (4,017,316) (876,518) (95,673) (972,191)
Subsidiaries, associatesand interests in joint ventures
(14,160,207) 709,670 (13,450,537) (2,109,299) (922,969) (3,032,268)
Depreciation 130,396 (103,421) 26,975 (9,325) (42,993) (52,318)
Capitalized interest expense (39,867) (655) (40,522) (8,810) (996) (9,806)
Accrued income (144,621) 51,668 (92,953) (34,930) 13,593 (21,337)
Provisions, accrued expenses and others 3,742,343 3,402,088 7,144,431 926,713 879,801 1,806,514
Foreign currency translation (23,022) 173,930 150,908 (6,568) 42,050 35,482
Impairment losses on investments 45,420 7,481 52,901 9,994 943 10,937
Others 1,970,813 (1,191,187) 779,626 565,168 (276,951) 288,217
₩(12,481,064) ₩3,016,431 ₩(9,464,633) ₩(1,547,567) ₩(403,594) ₩(1,951,161)
Deferred tax assets arising from carryforwards
Undisposed accumulated deficit ₩40,822 ₩59,579 ₩100,401 ₩4,362 ₩22,599 ₩26,961
Tax credit carryforwards 1,581,825 (69,773) 1,512,052 1,420,436 75,311 1,495,747
Deferred items recognized in other comprehensive income
Valuation of available-for-sale financialinstruments
₩(2,274,471) ₩957,608 ₩(1,316,863) ₩(424,121) ₩106,069 ₩(318,052)
Actuarial valuation 304,586 508,928 813,514 72,435 123,714 196,149
Total ₩(1,969,885) ₩1,466,536 ₩(503,349) ₩(351,686) ₩229,783 ₩(121,903)
Deferred tax assets ₩1,783,086
Deferred tax liabilities (2,333,442)
Total ₩(550,356)
The Company periodically assesses its ability to recover deferred income tax assets. In the event of a significant uncertainty regarding the Company's ultimate ability to
recover such assets, deferred income tax assets are recognized only to the extent that it is probable that future taxable profit will be available against which the temporary
differences can be utilized.
Temporary differences whose deferred tax effects were not recognized due to the uncertainty regarding ultimate realizability of such assets as of December 31, 2012 and
2011 are as follows:(In millions of Korean won
2012 2011
Undisposed accumulated deficit ₩- ₩144,108
Tax credit carryforwards ₩48,262 ₩159,160
Expiry date of unused tax losses and unused tax credits for which no deferred tax asset is recognized in the balance sheet are as follows:(In millions of Korean won)
2013 2014 2015 2016 and after
Tax credit carryforwards ₩1,103 ₩3,455 ₩22,313 ₩21,391
(D) The amount of income tax relating to each component of other
comprehensive income is as follows:(In millions of Korean won
2012 2011
Valuation of available-for-sale financial assets
₩(580,092) ₩(340,760)
Foreign currency translation adjustment
- 22,708
Actuarial valuation 349,833 196,149
Total ₩(230,259) ₩(121,903)
(E) The liquidity analysis of deferred tax assets and deferred tax liabilities is
as follows:(In millions of Korean won)
2012 2011
Current ₩1,898,481 ₩2,869,404
Non-current (2,811,868) (3,419,760)
Total ₩(913,387) ₩(550,356)
30. Earnings per Share
Basic earnings per share for the years ended December 31, 2012 and 2011, are
calculated as follows:(In millions of Korean won, except for share amounts)
2012 2011
Net income as reported on the statements of income
₩23,185,375 ₩13,382,645
Net income available for common stock
20,130,020 11,613,300
Weighted-average number of common shares outstanding (in thousands)
130,698 130,152
Basic earnings per share (in Korean won)
₩154,020 ₩89,229
(In millions of Korean won, except for share amounts)
2012 2011
Net income as reported on the statements of income
₩23,185,375 ₩13,382,645
Net income available for preferred stock
3,055,355 1,769,345
Weighted-average number of preferred shares outstanding (in thousands)
19,854 19,854
Basic earnings per preferred share (in Korean won)
₩153,893 ₩89,119
9998
Diluted earnings per share is calculated by adjusting the weighted average
number of ordinary shares outstanding to assume conversion of all dilutive
potential ordinary shares. The Company has one category of dilutive potential
ordinary shares: Stock options. A calculation is done to determine the number
of shares that could have been acquired at fair value (determined as the average
annual market share price of the Company’s shares) based on the monetary value
of the subscription rights attached to outstanding share options. The number of
shares calculated as above is compared with the number of shares that would
have been issued assuming the exercise of the share options.
Diluted earnings per share for the years ended December 31, 2012 and 2011 are
calculated as follows:(In millions of Korean won, except for share amounts)
2012 2011
Net income available for common stock and common equivalent shares
₩20,131,405 ₩11,614,952
Weighted-average number of shares of common stock and commonshares equivalent (in thousands)
130,766 130,292
Diluted earnings per share (in Korean won)
₩153,950 ₩89,146
(In millions of Korean won, except for share amounts)
2012 2011
Net income available for preferred stock and preferred equivalent shares
₩3,053,970 ₩1,767,693
Weighted-average number of shares of preferred stock and preferredshares equivalent (in thousands)
19,854 19,854
Diluted earnings per preferred share (in Korean won)
₩153,823 ₩89,036
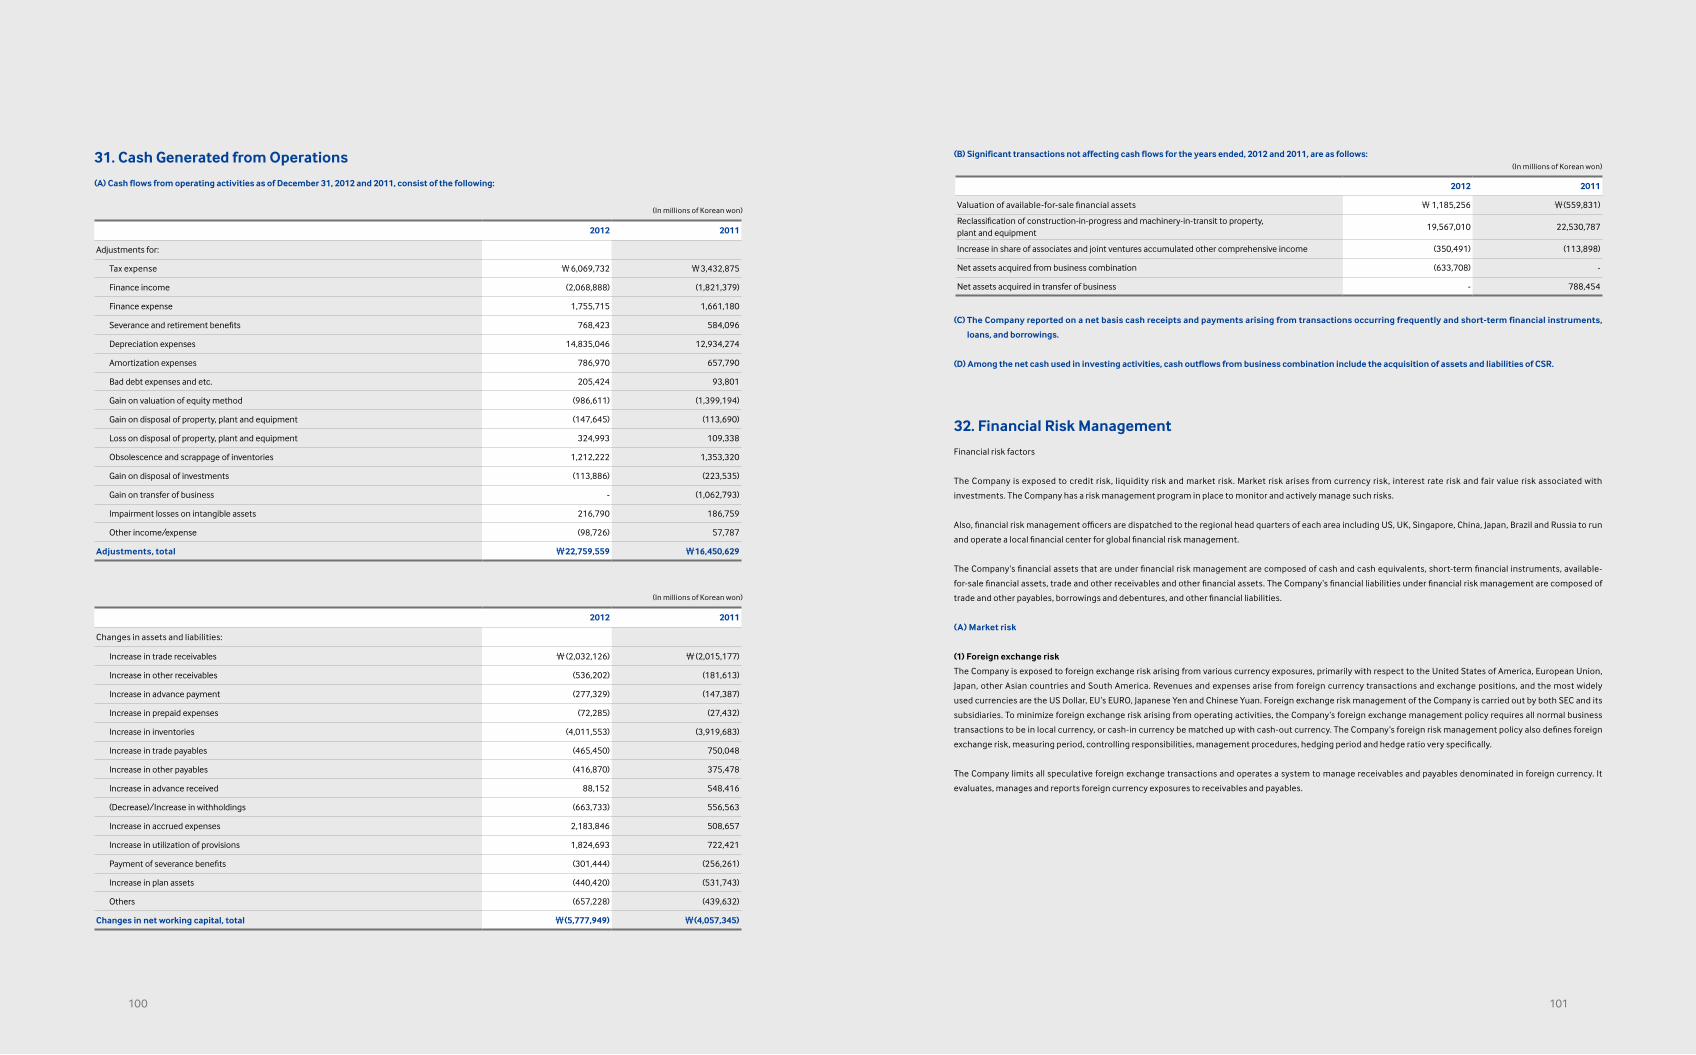
31. Cash Generated from Operations
(A) Cash flows from operating activities as of December 31, 2012 and 2011, consist of the following:
(In millions of Korean won)
2012 2011
Adjustments for:
Tax expense ₩6,069,732 ₩3,432,875
Finance income (2,068,888) (1,821,379)
Finance expense 1,755,715 1,661,180
Severance and retirement benefits 768,423 584,096
Depreciation expenses 14,835,046 12,934,274
Amortization expenses 786,970 657,790
Bad debt expenses and etc. 205,424 93,801
Gain on valuation of equity method (986,611) (1,399,194)
Gain on disposal of property, plant and equipment (147,645) (113,690)
Loss on disposal of property, plant and equipment 324,993 109,338
Obsolescence and scrappage of inventories 1,212,222 1,353,320
Gain on disposal of investments (113,886) (223,535)
Gain on transfer of business - (1,062,793)
Impairment losses on intangible assets 216,790 186,759
Other income/expense (98,726) 57,787
Adjustments, total ₩22,759,559 ₩16,450,629
(In millions of Korean won)
2012 2011
Changes in assets and liabilities:
Increase in trade receivables ₩(2,032,126) ₩(2,015,177)
Increase in other receivables (536,202) (181,613)
Increase in advance payment (277,329) (147,387)
Increase in prepaid expenses (72,285) (27,432)
Increase in inventories (4,011,553) (3,919,683)
Increase in trade payables (465,450) 750,048
Increase in other payables (416,870) 375,478
Increase in advance received 88,152 548,416
(Decrease)/Increase in withholdings (663,733) 556,563
Increase in accrued expenses 2,183,846 508,657
Increase in utilization of provisions 1,824,693 722,421
Payment of severance benefits (301,444) (256,261)
Increase in plan assets (440,420) (531,743)
Others (657,228) (439,632)
Changes in net working capital, total ₩(5,777,949) ₩(4,057,345)
101100
(B) Significant transactions not affecting cash flows for the years ended, 2012 and 2011, are as follows:(In millions of Korean won)
2012 2011
Valuation of available-for-sale financial assets ₩ 1,185,256 ₩(559,831)
Reclassification of construction-in-progress and machinery-in-transit to property, plant and equipment
19,567,010 22,530,787
Increase in share of associates and joint ventures accumulated other comprehensive income (350,491) (113,898)
Net assets acquired from business combination (633,708) -
Net assets acquired in transfer of business - 788,454
(C) The Company reported on a net basis cash receipts and payments arising from transactions occurring frequently and short-term financial instruments,
loans, and borrowings.
(D) Among the net cash used in investing activities, cash outflows from business combination include the acquisition of assets and liabilities of CSR.
32. Financial Risk Management
Financial risk factors
The Company is exposed to credit risk, liquidity risk and market risk. Market risk arises from currency risk, interest rate risk and fair value risk associated with
investments. The Company has a risk management program in place to monitor and actively manage such risks.
Also, financial risk management officers are dispatched to the regional head quarters of each area including US, UK, Singapore, China, Japan, Brazil and Russia to run
and operate a local financial center for global financial risk management.
The Company’s financial assets that are under financial risk management are composed of cash and cash equivalents, short-term financial instruments, available-
for-sale financial assets, trade and other receivables and other financial assets. The Company’s financial liabilities under financial risk management are composed of
trade and other payables, borrowings and debentures, and other financial liabilities.
(A) Market risk
(1) Foreign exchange risk
The Company is exposed to foreign exchange risk arising from various currency exposures, primarily with respect to the United States of America, European Union,
Japan, other Asian countries and South America. Revenues and expenses arise from foreign currency transactions and exchange positions, and the most widely
used currencies are the US Dollar, EU’s EURO, Japanese Yen and Chinese Yuan. Foreign exchange risk management of the Company is carried out by both SEC and its
subsidiaries. To minimize foreign exchange risk arising from operating activities, the Company’s foreign exchange management policy requires all normal business
transactions to be in local currency, or cash-in currency be matched up with cash-out currency. The Company’s foreign risk management policy also defines foreign
exchange risk, measuring period, controlling responsibilities, management procedures, hedging period and hedge ratio very specifically.
The Company limits all speculative foreign exchange transactions and operates a system to manage receivables and payables denominated in foreign currency. It
evaluates, manages and reports foreign currency exposures to receivables and payables.
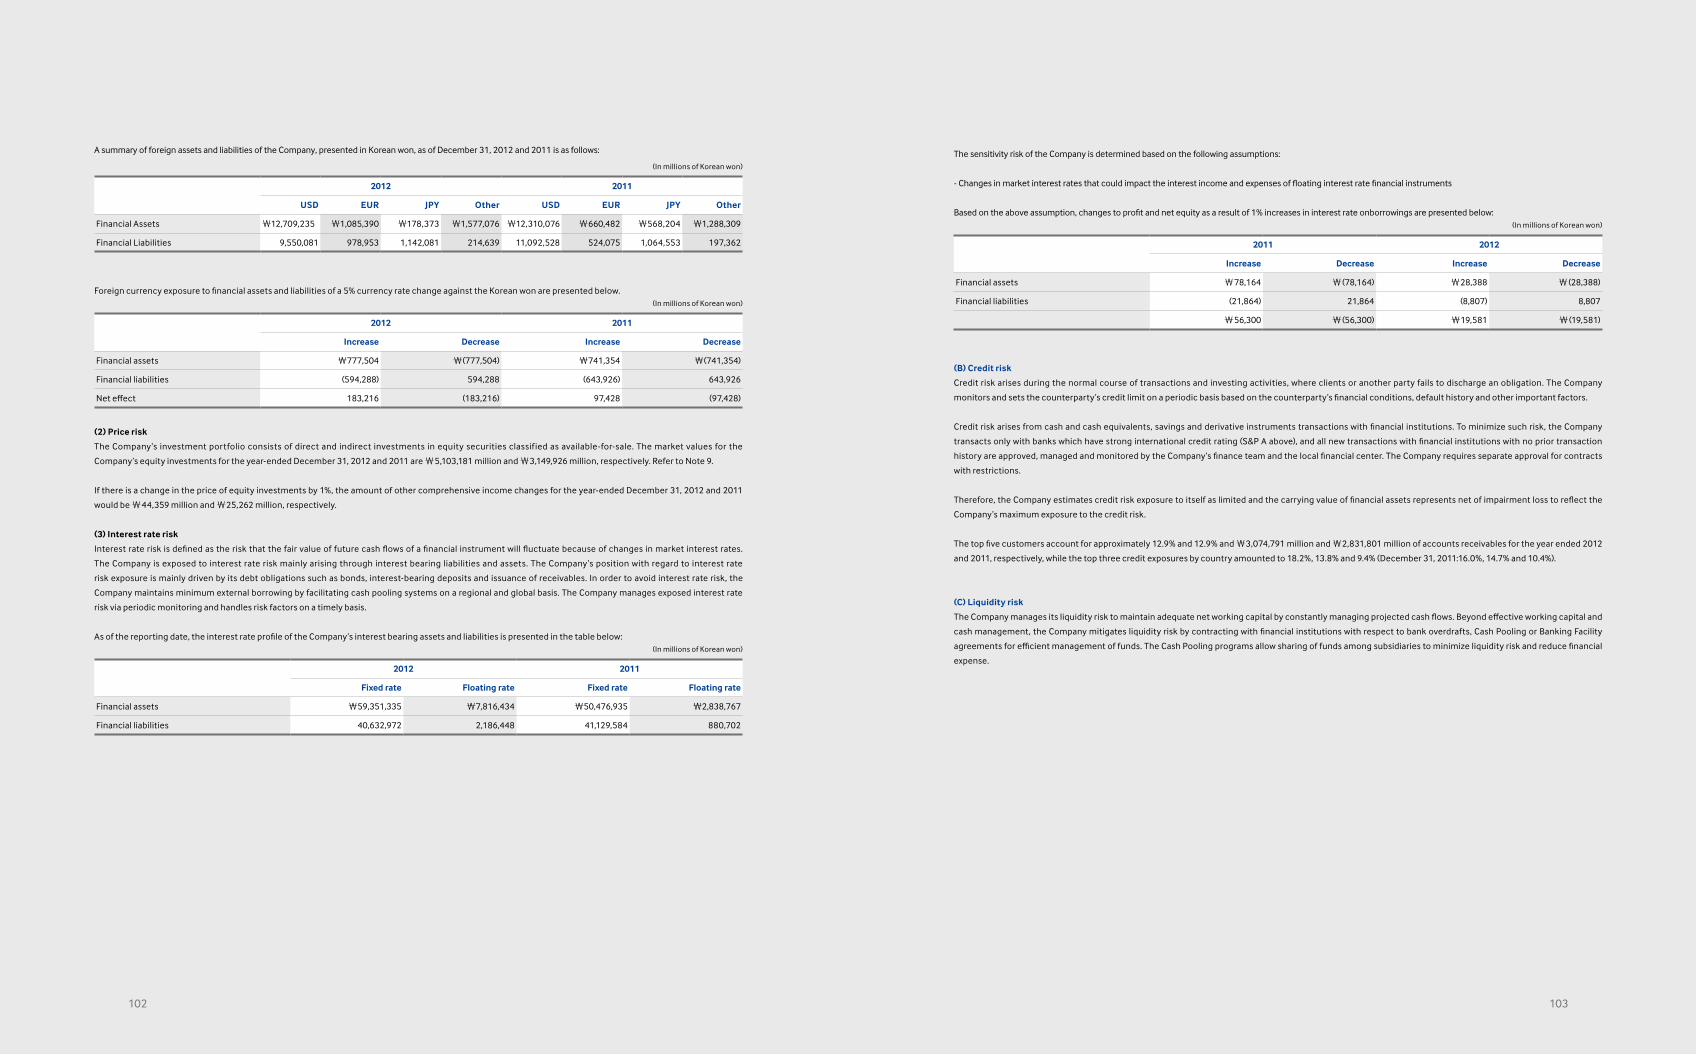
A summary of foreign assets and liabilities of the Company, presented in Korean won, as of December 31, 2012 and 2011 is as follows:
(In millions of Korean won)
2012 2011
USD EUR JPY Other USD EUR JPY Other
Financial Assets ₩12,709,235 ₩1,085,390 ₩178,373 ₩1,577,076 ₩12,310,076 ₩660,482 ₩568,204 ₩1,288,309
Financial Liabilities 9,550,081 978,953 1,142,081 214,639 11,092,528 524,075 1,064,553 197,362
Foreign currency exposure to financial assets and liabilities of a 5% currency rate change against the Korean won are presented below.(In millions of Korean won)
2012 2011
Increase Decrease Increase Decrease
Financial assets ₩777,504 ₩(777,504) ₩741,354 ₩(741,354)
Financial liabilities (594,288) 594,288 (643,926) 643,926
Net effect 183,216 (183,216) 97,428 (97,428)
(2) Price risk
The Company’s investment portfolio consists of direct and indirect investments in equity securities classified as available-for-sale. The market values for the
Company’s equity investments for the year-ended December 31, 2012 and 2011 are ₩5,103,181 million and ₩3,149,926 million, respectively. Refer to Note 9.
If there is a change in the price of equity investments by 1%, the amount of other comprehensive income changes for the year-ended December 31, 2012 and 2011
would be ₩44,359 million and ₩25,262 million, respectively.
(3) Interest rate risk
Interest rate risk is defined as the risk that the fair value of future cash flows of a financial instrument will fluctuate because of changes in market interest rates.
The Company is exposed to interest rate risk mainly arising through interest bearing liabilities and assets. The Company’s position with regard to interest rate
risk exposure is mainly driven by its debt obligations such as bonds, interest-bearing deposits and issuance of receivables. In order to avoid interest rate risk, the
Company maintains minimum external borrowing by facilitating cash pooling systems on a regional and global basis. The Company manages exposed interest rate
risk via periodic monitoring and handles risk factors on a timely basis.
As of the reporting date, the interest rate profile of the Company’s interest bearing assets and liabilities is presented in the table below:(In millions of Korean won)
2012 2011
Fixed rate Floating rate Fixed rate Floating rate
Financial assets ₩59,351,335 ₩7,816,434 ₩50,476,935 ₩2,838,767
Financial liabilities 40,632,972 2,186,448 41,129,584 880,702
103102
The sensitivity risk of the Company is determined based on the following assumptions:
- Changes in market interest rates that could impact the interest income and expenses of floating interest rate financial instruments
Based on the above assumption, changes to profit and net equity as a result of 1% increases in interest rate onborrowings are presented below:(In millions of Korean won)
2011 2012
Increase Decrease Increase Decrease
Financial assets ₩78,164 ₩(78,164) ₩28,388 ₩(28,388)
Financial liabilities (21,864) 21,864 (8,807) 8,807
₩56,300 ₩(56,300) ₩19,581 ₩(19,581)
(B) Credit risk
Credit risk arises during the normal course of transactions and investing activities, where clients or another party fails to discharge an obligation. The Company
monitors and sets the counterparty’s credit limit on a periodic basis based on the counterparty’s financial conditions, default history and other important factors.
Credit risk arises from cash and cash equivalents, savings and derivative instruments transactions with financial institutions. To minimize such risk, the Company
transacts only with banks which have strong international credit rating (S&P A above), and all new transactions with financial institutions with no prior transaction
history are approved, managed and monitored by the Company’s finance team and the local financial center. The Company requires separate approval for contracts
with restrictions.
Therefore, the Company estimates credit risk exposure to itself as limited and the carrying value of financial assets represents net of impairment loss to reflect the
Company’s maximum exposure to the credit risk.
The top five customers account for approximately 12.9% and 12.9% and ₩3,074,791 million and ₩2,831,801 million of accounts receivables for the year ended 2012
and 2011, respectively, while the top three credit exposures by country amounted to 18.2%, 13.8% and 9.4% (December 31, 2011:16.0%, 14.7% and 10.4%).
(C) Liquidity risk
The Company manages its liquidity risk to maintain adequate net working capital by constantly managing projected cash flows. Beyond effective working capital and
cash management, the Company mitigates liquidity risk by contracting with financial institutions with respect to bank overdrafts, Cash Pooling or Banking Facility
agreements for efficient management of funds. The Cash Pooling programs allow sharing of funds among subsidiaries to minimize liquidity risk and reduce financial
expense.
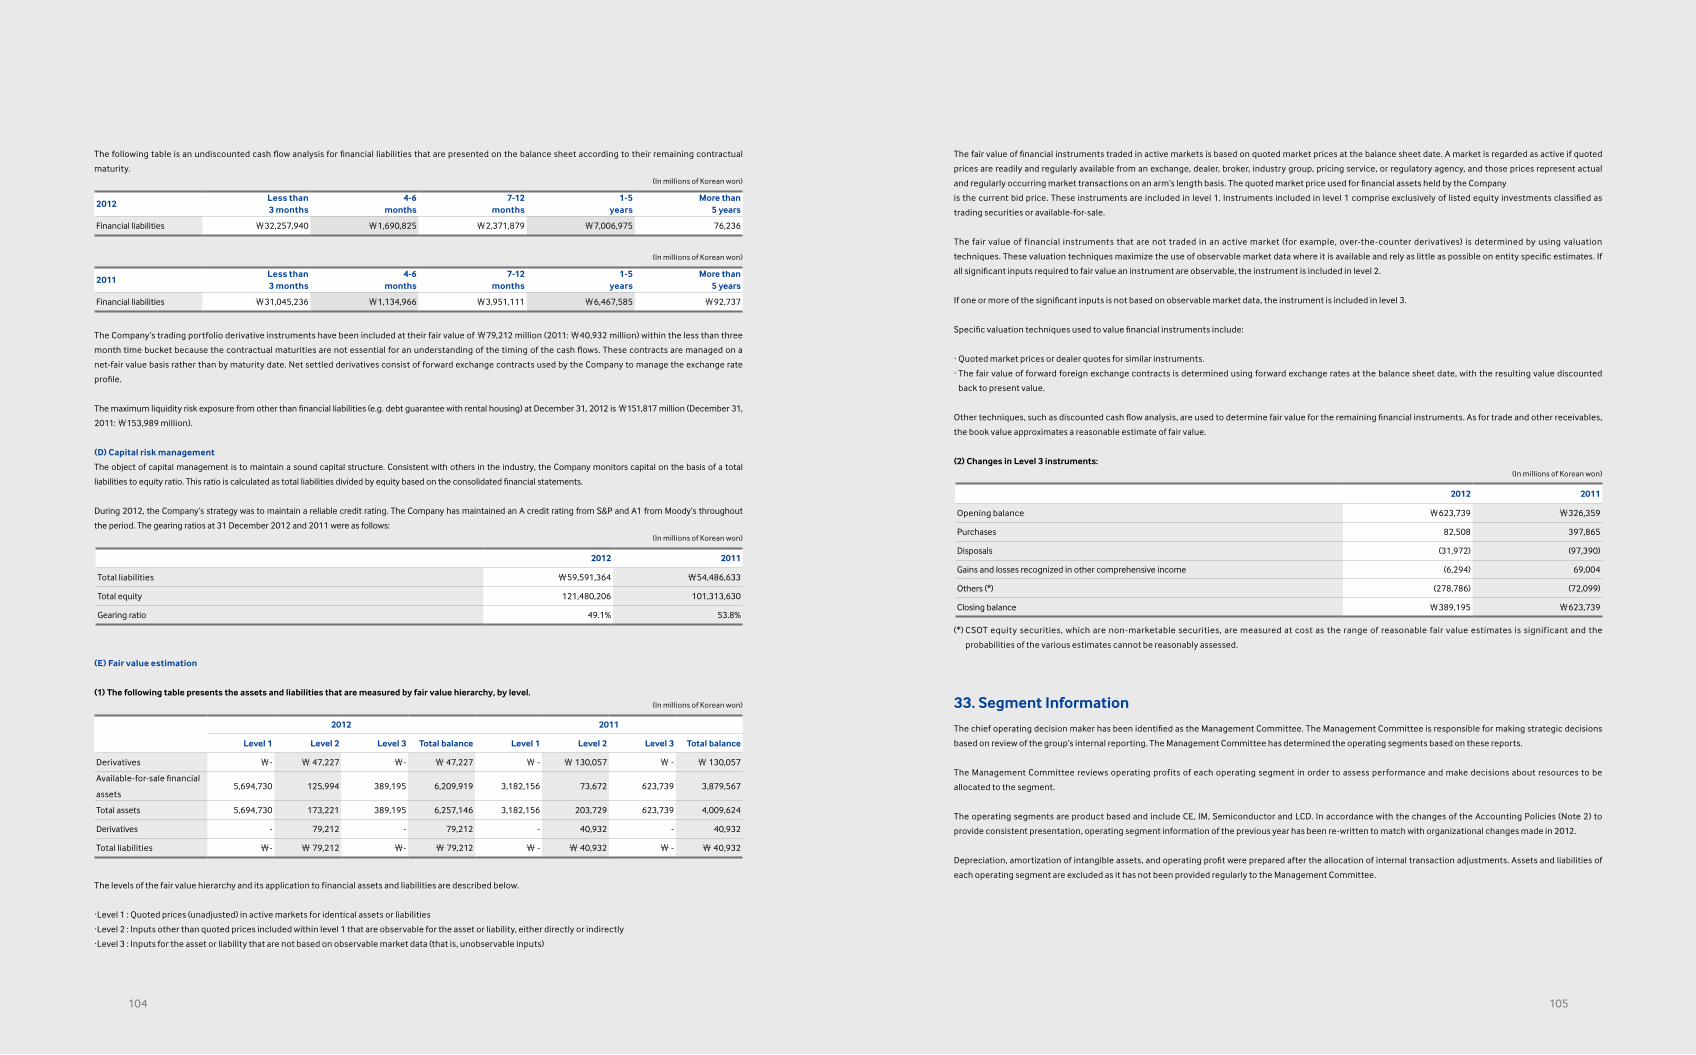
The following table is an undiscounted cash flow analysis for financial liabilities that are presented on the balance sheet according to their remaining contractual
maturity.(In millions of Korean won)
2012Less than3 months
4-6months
7-12months
1-5years
More than5 years
Financial liabilities ₩32,257,940 ₩1,690,825 ₩2,371,879 ₩7,006,975 76,236
(In millions of Korean won)
2011Less than3 months
4-6months
7-12months
1-5years
More than5 years
Financial liabilities ₩31,045,236 ₩1,134,966 ₩3,951,111 ₩6,467,585 ₩92,737
The Company’s trading portfolio derivative instruments have been included at their fair value of ₩79,212 million (2011: ₩40,932 million) within the less than three
month time bucket because the contractual maturities are not essential for an understanding of the timing of the cash flows. These contracts are managed on a
net-fair value basis rather than by maturity date. Net settled derivatives consist of forward exchange contracts used by the Company to manage the exchange rate
profile.
The maximum liquidity risk exposure from other than financial liabilities (e.g. debt guarantee with rental housing) at December 31, 2012 is ₩151,817 million (December 31,
2011: ₩153,989 million).
(D) Capital risk management
The object of capital management is to maintain a sound capital structure. Consistent with others in the industry, the Company monitors capital on the basis of a total
liabilities to equity ratio. This ratio is calculated as total liabilities divided by equity based on the consolidated financial statements.
During 2012, the Company’s strategy was to maintain a reliable credit rating. The Company has maintained an A credit rating from S&P and A1 from Moody’s throughout
the period. The gearing ratios at 31 December 2012 and 2011 were as follows:(In millions of Korean won)
2012 2011
Total liabilities ₩59,591,364 ₩54,486,633
Total equity 121,480,206 101,313,630
Gearing ratio 49.1% 53.8%
(E) Fair value estimation
(1) The following table presents the assets and liabilities that are measured by fair value hierarchy, by level.(In millions of Korean won)
2012 2011
Level 1 Level 2 Level 3 Total balance Level 1 Level 2 Level 3 Total balance
Derivatives ₩- ₩ 47,227 ₩- ₩ 47,227 ₩ - ₩ 130,057 ₩ - ₩ 130,057
Available-for-sale financial
assets5,694,730 125,994 389,195 6,209,919 3,182,156 73,672 623,739 3,879,567
Total assets 5,694,730 173,221 389,195 6,257,146 3,182,156 203,729 623,739 4,009,624
Derivatives - 79,212 - 79,212 - 40,932 - 40,932
Total liabilities ₩- ₩ 79,212 ₩- ₩ 79,212 ₩ - ₩ 40,932 ₩ - ₩ 40,932
The levels of the fair value hierarchy and its application to financial assets and liabilities are described below.
·Level 1 : Quoted prices (unadjusted) in active markets for identical assets or liabilities
·Level 2 : Inputs other than quoted prices included within level 1 that are observable for the asset or liability, either directly or indirectly
·Level 3 : Inputs for the asset or liability that are not based on observable market data (that is, unobservable inputs)
105104
The fair value of financial instruments traded in active markets is based on quoted market prices at the balance sheet date. A market is regarded as active if quoted
prices are readily and regularly available from an exchange, dealer, broker, industry group, pricing service, or regulatory agency, and those prices represent actual
and regularly occurring market transactions on an arm’s length basis. The quoted market price used for financial assets held by the Company
is the current bid price. These instruments are included in level 1. Instruments included in level 1 comprise exclusively of listed equity investments classified as
trading securities or available-for-sale.
The fair value of f inancial instruments that are not traded in an active market (for example, over-the-counter derivatives) is determined by using valuation
techniques. These valuation techniques maximize the use of observable market data where it is available and rely as little as possible on entity specific estimates. If
all significant inputs required to fair value an instrument are observable, the instrument is included in level 2.
If one or more of the significant inputs is not based on observable market data, the instrument is included in level 3.
Specific valuation techniques used to value financial instruments include:
· Quoted market prices or dealer quotes for similar instruments.
· The fair value of forward foreign exchange contracts is determined using forward exchange rates at the balance sheet date, with the resulting value discounted
back to present value.
Other techniques, such as discounted cash flow analysis, are used to determine fair value for the remaining financial instruments. As for trade and other receivables,
the book value approximates a reasonable estimate of fair value.
(2) Changes in Level 3 instruments:(In millions of Korean won)
2012 2011
Opening balance ₩623,739 ₩326,359
Purchases 82,508 397,865
Disposals (31,972) (97,390)
Gains and losses recognized in other comprehensive income (6,294) 69,004
Others (*) (278,786) (72,099)
Closing balance ₩389,195 ₩623,739
(*) CSOT equity securities, which are non-marketable securities, are measured at cost as the range of reasonable fair value estimates is signif icant and the
probabilities of the various estimates cannot be reasonably assessed.
33. Segment Information
The chief operating decision maker has been identified as the Management Committee. The Management Committee is responsible for making strategic decisions
based on review of the group’s internal reporting. The Management Committee has determined the operating segments based on these reports.
The Management Committee reviews operating profits of each operating segment in order to assess performance and make decisions about resources to be
allocated to the segment.
The operating segments are product based and include CE, IM, Semiconductor and LCD. In accordance with the changes of the Accounting Policies (Note 2) to
provide consistent presentation, operating segment information of the previous year has been re-written to match with organizational changes made in 2012.
Depreciation, amortization of intangible assets, and operating profit were prepared after the allocation of internal transaction adjustments. Assets and liabilities of
each operating segment are excluded as it has not been provided regularly to the Management Committee.
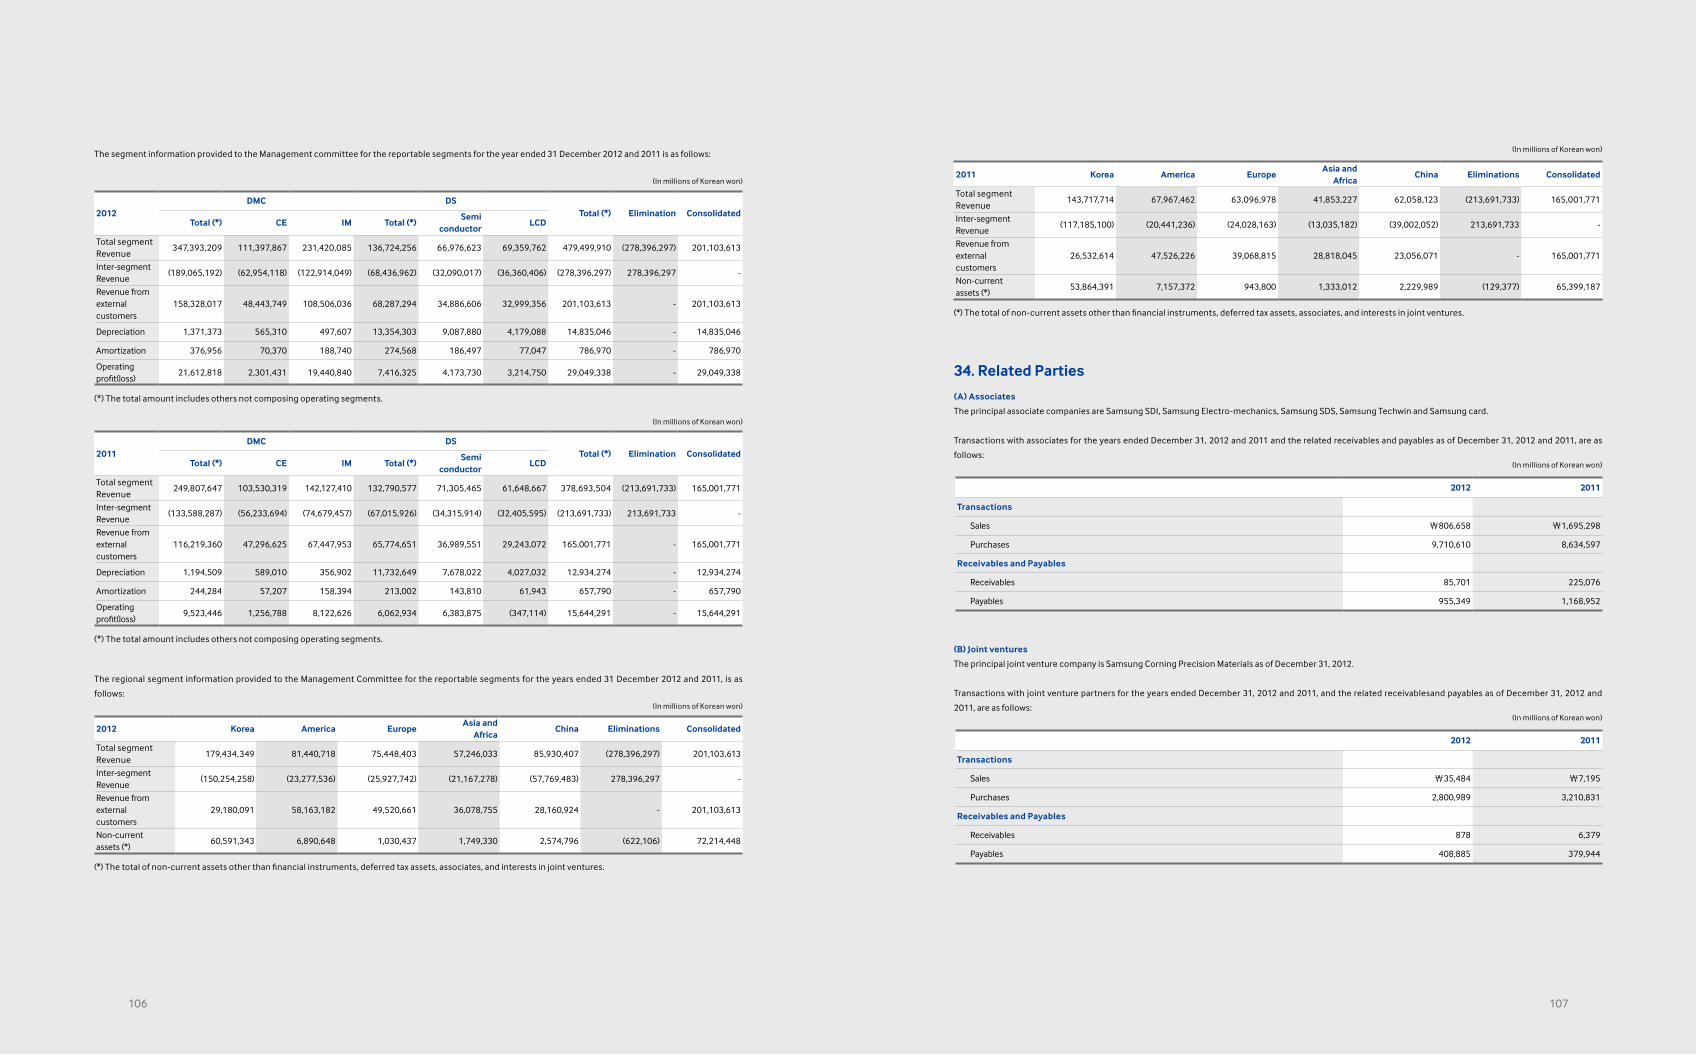
The segment information provided to the Management committee for the reportable segments for the year ended 31 December 2012 and 2011 is as follows:
(In millions of Korean won)
2012DMC DS
Total (*) Elimination ConsolidatedTotal (*) CE IM Total (*)
Semiconductor
LCD
Total segmentRevenue
347,393,209 111,397,867 231,420,085 136,724,256 66,976,623 69,359,762 479,499,910 (278,396,297) 201,103,613
Inter-segmentRevenue
(189,065,192) (62,954,118) (122,914,049) (68,436,962) (32,090,017) (36,360,406) (278,396,297) 278,396,297 -
Revenue fromexternalcustomers
158,328,017 48,443,749 108,506,036 68,287,294 34,886,606 32,999,356 201,103,613 - 201,103,613
Depreciation 1,371,373 565,310 497,607 13,354,303 9,087,880 4,179,088 14,835,046 - 14,835,046
Amortization 376,956 70,370 188,740 274,568 186,497 77,047 786,970 - 786,970
Operatingprofit(loss)
21,612,818 2,301,431 19,440,840 7,416,325 4,173,730 3,214,750 29,049,338 - 29,049,338
(*) The total amount includes others not composing operating segments.
(In millions of Korean won)
2011DMC DS
Total (*) Elimination ConsolidatedTotal (*) CE IM Total (*)
Semiconductor
LCD
Total segmentRevenue
249,807,647 103,530,319 142,127,410 132,790,577 71,305,465 61,648,667 378,693,504 (213,691,733) 165,001,771
Inter-segmentRevenue
(133,588,287) (56,233,694) (74,679,457) (67,015,926) (34,315,914) (32,405,595) (213,691,733) 213,691,733 -
Revenue fromexternalcustomers
116,219,360 47,296,625 67,447,953 65,774,651 36,989,551 29,243,072 165,001,771 - 165,001,771
Depreciation 1,194,509 589,010 356,902 11,732,649 7,678,022 4,027,032 12,934,274 - 12,934,274
Amortization 244,284 57,207 158,394 213,002 143,810 61,943 657,790 - 657,790
Operatingprofit(loss)
9,523,446 1,256,788 8,122,626 6,062,934 6,383,875 (347,114) 15,644,291 - 15,644,291
(*) The total amount includes others not composing operating segments.
The regional segment information provided to the Management Committee for the reportable segments for the years ended 31 December 2012 and 2011, is as
follows:(In millions of Korean won)
2012 Korea America EuropeAsia and
AfricaChina Eliminations Consolidated
Total segmentRevenue
179,434,349 81,440,718 75,448,403 57,246,033 85,930,407 (278,396,297) 201,103,613
Inter-segmentRevenue
(150,254,258) (23,277,536) (25,927,742) (21,167,278) (57,769,483) 278,396,297 -
Revenue fromexternalcustomers
29,180,091 58,163,182 49,520,661 36,078,755 28,160,924 - 201,103,613
Non-currentassets (*)
60,591,343 6,890,648 1,030,437 1,749,330 2,574,796 (622,106) 72,214,448
(*) The total of non-current assets other than financial instruments, deferred tax assets, associates, and interests in joint ventures.
107106
(In millions of Korean won)
2011 Korea America EuropeAsia and
AfricaChina Eliminations Consolidated
Total segmentRevenue
143,717,714 67,967,462 63,096,978 41,853,227 62,058,123 (213,691,733) 165,001,771
Inter-segmentRevenue
(117,185,100) (20,441,236) (24,028,163) (13,035,182) (39,002,052) 213,691,733 -
Revenue fromexternalcustomers
26,532,614 47,526,226 39,068,815 28,818,045 23,056,071 - 165,001,771
Non-currentassets (*)
53,864,391 7,157,372 943,800 1,333,012 2,229,989 (129,377) 65,399,187
(*) The total of non-current assets other than financial instruments, deferred tax assets, associates, and interests in joint ventures.
34. Related Parties
(A) Associates
The principal associate companies are Samsung SDI, Samsung Electro-mechanics, Samsung SDS, Samsung Techwin and Samsung card.
Transactions with associates for the years ended December 31, 2012 and 2011 and the related receivables and payables as of December 31, 2012 and 2011, are as
follows:(In millions of Korean won)
2012 2011
Transactions
Sales ₩806,658 ₩1,695,298
Purchases 9,710,610 8,634,597
Receivables and Payables
Receivables 85,701 225,076
Payables 955,349 1,168,952
(B) Joint ventures
The principal joint venture company is Samsung Corning Precision Materials as of December 31, 2012.
Transactions with joint venture partners for the years ended December 31, 2012 and 2011, and the related receivablesand payables as of December 31, 2012 and
2011, are as follows:(In millions of Korean won)
2012 2011
Transactions
Sales ₩35,484 ₩7,195
Purchases 2,800,989 3,210,831
Receivables and Payables
Receivables 878 6,379
Payables 408,885 379,944
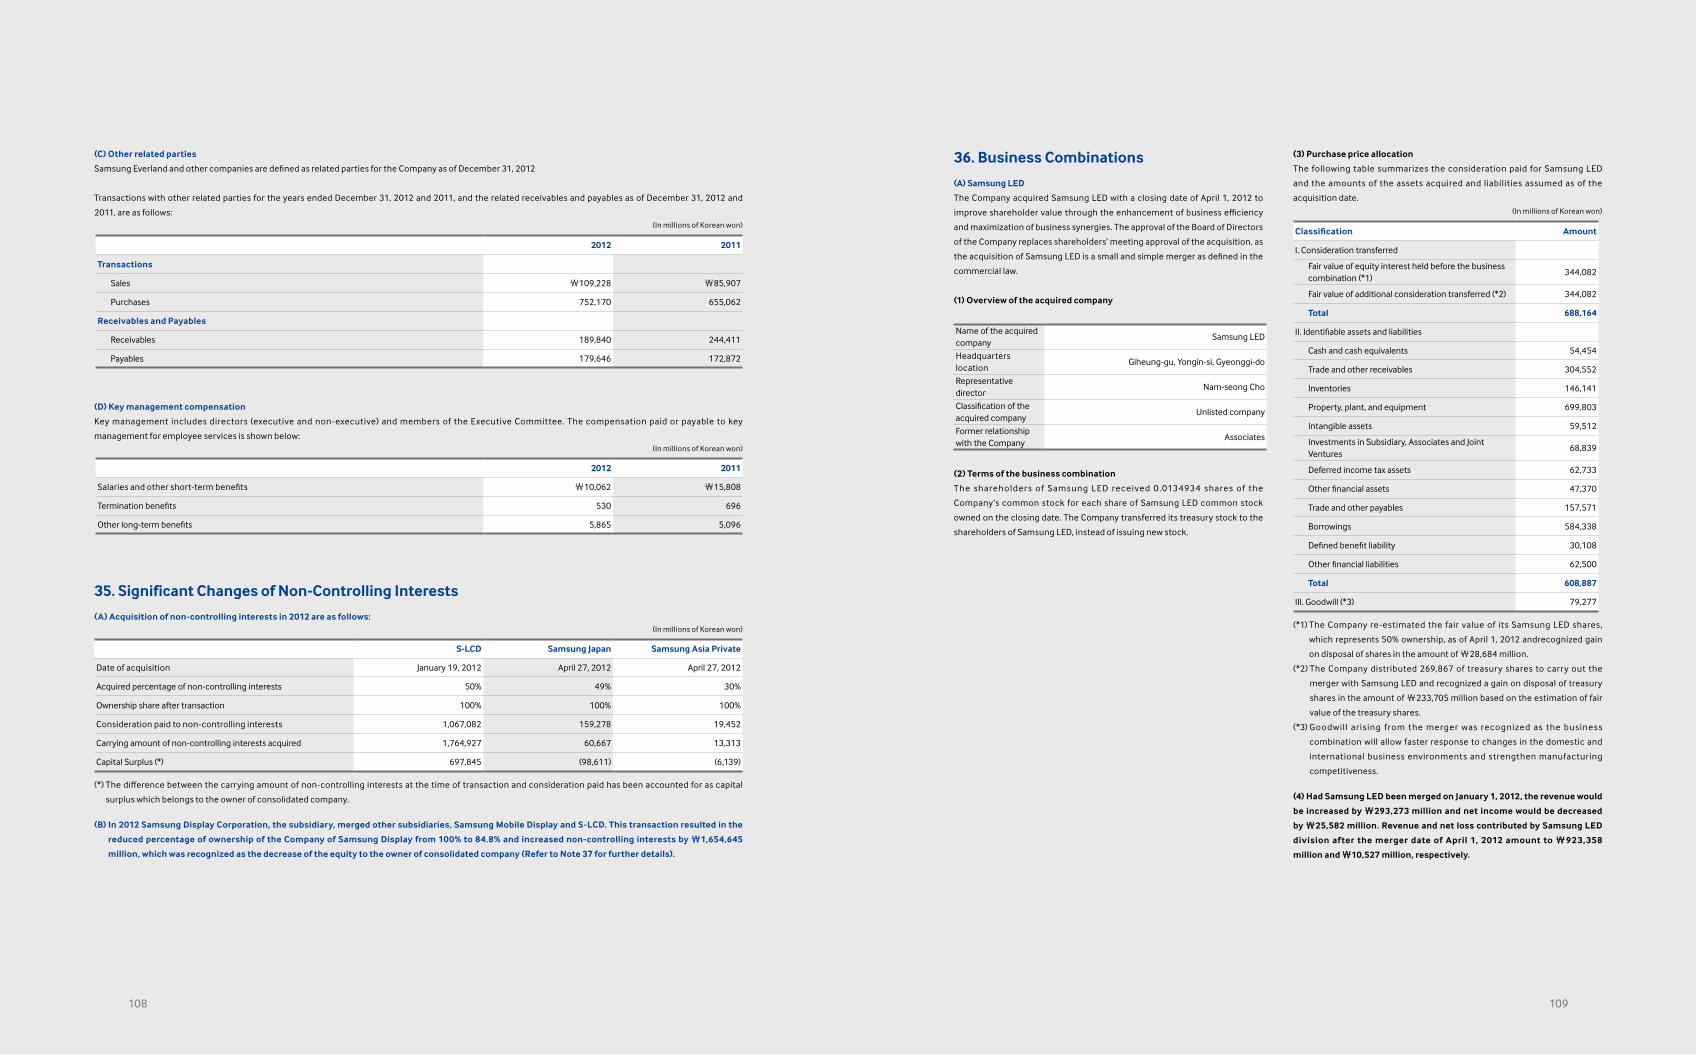
(C) Other related parties
Samsung Everland and other companies are defined as related parties for the Company as of December 31, 2012
Transactions with other related parties for the years ended December 31, 2012 and 2011, and the related receivables and payables as of December 31, 2012 and
2011, are as follows:(In millions of Korean won)
2012 2011
Transactions
Sales ₩109,228 ₩85,907
Purchases 752,170 655,062
Receivables and Payables
Receivables 189,840 244,411
Payables 179,646 172,872
(D) Key management compensation
Key management includes directors (executive and non-executive) and members of the Executive Committee. The compensation paid or payable to key
management for employee services is shown below:(In millions of Korean won)
2012 2011
Salaries and other short-term benefits ₩10,062 ₩15,808
Termination benefits 530 696
Other long-term benefits 5,865 5,096
35. Significant Changes of Non-Controlling Interests
(A) Acquisition of non-controlling interests in 2012 are as follows:(In millions of Korean won)
S-LCD Samsung Japan Samsung Asia Private
Date of acquisition January 19, 2012 April 27, 2012 April 27, 2012
Acquired percentage of non-controlling interests 50% 49% 30%
Ownership share after transaction 100% 100% 100%
Consideration paid to non-controlling interests 1,067,082 159,278 19,452
Carrying amount of non-controlling interests acquired 1,764,927 60,667 13,313
Capital Surplus (*) 697,845 (98,611) (6,139)
(*) The difference between the carrying amount of non-controlling interests at the time of transaction and consideration paid has been accounted for as capital
surplus which belongs to the owner of consolidated company.
(B) In 2012 Samsung Display Corporation, the subsidiary, merged other subsidiaries, Samsung Mobile Display and S-LCD. This transaction resulted in the
reduced percentage of ownership of the Company of Samsung Display from 100% to 84.8% and increased non-controlling interests by ₩1,654,645
million, which was recognized as the decrease of the equity to the owner of consolidated company (Refer to Note 37 for further details).
109108
36. Business Combinations
(A) Samsung LED
The Company acquired Samsung LED with a closing date of April 1, 2012 to
improve shareholder value through the enhancement of business efficiency
and maximization of business synergies. The approval of the Board of Directors
of the Company replaces shareholders’ meeting approval of the acquisition, as
the acquisition of Samsung LED is a small and simple merger as defined in the
commercial law.
(1) Overview of the acquired company
Name of the acquired company
Samsung LED
Headquarters location
Giheung-gu, Yongin-si, Gyeonggi-do
Representative director
Nam-seong Cho
Classification of the acquired company
Unlisted company
Former relationship with the Company
Associates
(2) Terms of the business combination
The shareholders of Samsung LED received 0.0134934 shares of the
Company’s common stock for each share of Samsung LED common stock
owned on the closing date. The Company transferred its treasury stock to the
shareholders of Samsung LED, instead of issuing new stock.
(3) Purchase price allocation
The following table summarizes the consideration paid for Samsung LED
and the amounts of the assets acquired and liabilities assumed as of the
acquisition date.(In millions of Korean won)
Classification Amount
I. Consideration transferred
Fair value of equity interest held before the business combination (*1)
344,082
Fair value of additional consideration transferred (*2) 344,082
Total 688,164
II. Identifiable assets and liabilities
Cash and cash equivalents 54,454
Trade and other receivables 304,552
Inventories 146,141
Property, plant, and equipment 699,803
Intangible assets 59,512
Investments in Subsidiary, Associates and Joint Ventures
68,839
Deferred income tax assets 62,733
Other financial assets 47,370
Trade and other payables 157,571
Borrowings 584,338
Defined benefit liability 30,108
Other financial liabilities 62,500
Total 608,887
III. Goodwill (*3) 79,277
(*1) The Company re-estimated the fair value of its Samsung LED shares,
which represents 50% ownership, as of April 1, 2012 andrecognized gain
on disposal of shares in the amount of ₩28,684 million.
(*2) The Company distributed 269,867 of treasury shares to carry out the
merger with Samsung LED and recognized a gain on disposal of treasury
shares in the amount of ₩233,705 million based on the estimation of fair
value of the treasury shares.
(*3) Goodwil l ar ising from the merger was recognized as the business
combination will allow faster response to changes in the domestic and
international business environments and strengthen manufacturing
competitiveness.
(4) Had Samsung LED been merged on January 1, 2012, the revenue would
be increased by ₩293,273 million and net income would be decreased
by ₩25,582 million. Revenue and net loss contributed by Samsung LED
division after the merger date of April 1, 2012 amount to ₩923,358
million and ₩10,527 million, respectively.
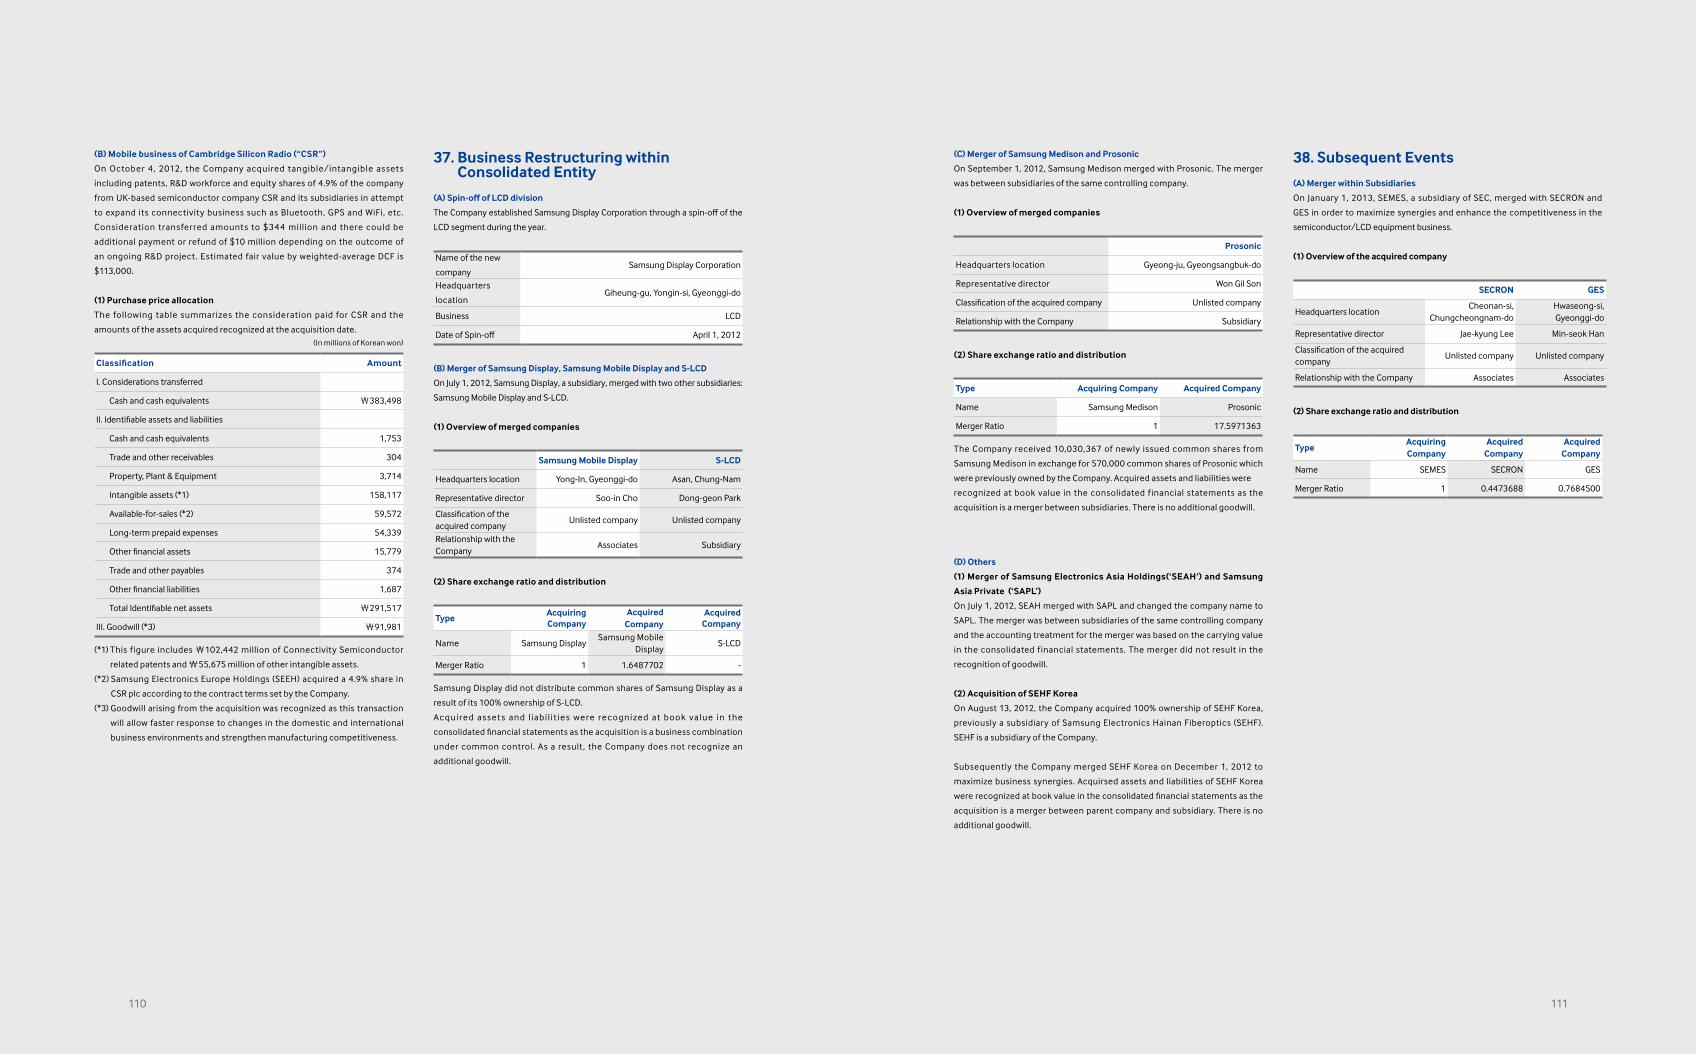
111110
(B) Mobile business of Cambridge Silicon Radio (“CSR”)
On October 4, 2012, the Company acquired tangible/intangible assets
including patents, R&D workforce and equity shares of 4.9% of the company
from UK-based semiconductor company CSR and its subsidiaries in attempt
to expand its connectivity business such as Bluetooth, GPS and WiFi, etc.
Consideration transferred amounts to $344 million and there could be
additional payment or refund of $10 million depending on the outcome of
an ongoing R&D project. Estimated fair value by weighted-average DCF is
$113,000.
(1) Purchase price allocation
The following table summarizes the consideration paid for CSR and the
amounts of the assets acquired recognized at the acquisition date.(In millions of Korean won)
Classification Amount
I. Considerations transferred
Cash and cash equivalents ₩383,498
II. Identifiable assets and liabilities
Cash and cash equivalents 1,753
Trade and other receivables 304
Property, Plant & Equipment 3,714
Intangible assets (*1) 158,117
Available-for-sales (*2) 59,572
Long-term prepaid expenses 54,339
Other financial assets 15,779
Trade and other payables 374
Other financial liabilities 1,687
Total Identifiable net assets ₩291,517
III. Goodwill (*3) ₩91,981
(*1) This f igure includes ₩102,442 million of Connectivity Semiconductor
related patents and ₩55,675 million of other intangible assets.
(*2) Samsung Electronics Europe Holdings (SEEH) acquired a 4.9% share in
CSR plc according to the contract terms set by the Company.
(*3) Goodwill arising from the acquisition was recognized as this transaction
will allow faster response to changes in the domestic and international
business environments and strengthen manufacturing competitiveness.
37. Business Restructuring within Consolidated Entity
(A) Spin-off of LCD division
The Company established Samsung Display Corporation through a spin-off of the
LCD segment during the year.
Name of the new
companySamsung Display Corporation
Headquarters
locationGiheung-gu, Yongin-si, Gyeonggi-do
Business LCD
Date of Spin-off April 1, 2012
(B) Merger of Samsung Display, Samsung Mobile Display and S-LCD
On July 1, 2012, Samsung Display, a subsidiary, merged with two other subsidiaries:
Samsung Mobile Display and S-LCD.
(1) Overview of merged companies
Samsung Mobile Display S-LCD
Headquarters location Yong-In, Gyeonggi-do Asan, Chung-Nam
Representative director Soo-in Cho Dong-geon Park
Classification of the acquired company
Unlisted company Unlisted company
Relationship with the Company
Associates Subsidiary
(2) Share exchange ratio and distribution
TypeAcquiring Company
Acquired Company
Acquired Company
Name Samsung DisplaySamsung Mobile
DisplayS-LCD
Merger Ratio 1 1.6487702 -
Samsung Display did not distribute common shares of Samsung Display as a
result of its 100% ownership of S-LCD.
Acquired asset s and l iabi l i t ies were recognized at book value in the
consolidated financial statements as the acquisition is a business combination
under common control. As a result, the Company does not recognize an
additional goodwill.
(C) Merger of Samsung Medison and Prosonic
On September 1, 2012, Samsung Medison merged with Prosonic. The merger
was between subsidiaries of the same controlling company.
(1) Overview of merged companies
Prosonic
Headquarters location Gyeong-ju, Gyeongsangbuk-do
Representative director Won Gil Son
Classification of the acquired company Unlisted company
Relationship with the Company Subsidiary
(2) Share exchange ratio and distribution
Type Acquiring Company Acquired Company
Name Samsung Medison Prosonic
Merger Ratio 1 17.5971363
The Company received 10,030,367 of newly issued common shares from
Samsung Medison in exchange for 570,000 common shares of Prosonic which
were previously owned by the Company. Acquired assets and liabilities were
recognized at book value in the consolidated f inancial statements as the
acquisition is a merger between subsidiaries. There is no additional goodwill.
(D) Others
(1) Merger of Samsung Electronics Asia Holdings(‘SEAH’) and Samsung
Asia Private (‘SAPL’)
On July 1, 2012, SEAH merged with SAPL and changed the company name to
SAPL. The merger was between subsidiaries of the same controlling company
and the accounting treatment for the merger was based on the carrying value
in the consolidated f inancial statements. The merger did not result in the
recognition of goodwill.
(2) Acquisition of SEHF Korea
On August 13, 2012, the Company acquired 100% ownership of SEHF Korea,
previously a subsidiary of Samsung Electronics Hainan Fiberoptics (SEHF).
SEHF is a subsidiary of the Company.
Subsequently the Company merged SEHF Korea on December 1, 2012 to
maximize business synergies. Acquirsed assets and liabilities of SEHF Korea
were recognized at book value in the consolidated financial statements as the
acquisition is a merger between parent company and subsidiary. There is no
additional goodwill.
38. Subsequent Events
(A) Merger within Subsidiaries
On January 1, 2013, SEMES, a subsidiary of SEC, merged with SECRON and
GES in order to maximize synergies and enhance the competitiveness in the
semiconductor/LCD equipment business.
(1) Overview of the acquired company
SECRON GES
Headquarters locationCheonan-si,
Chungcheongnam-doHwaseong-si, Gyeonggi-do
Representative director Jae-kyung Lee Min-seok Han
Classification of the acquired company
Unlisted company Unlisted company
Relationship with the Company Associates Associates
(2) Share exchange ratio and distribution
TypeAcquiring Company
Acquired Company
Acquired Company
Name SEMES SECRON GES
Merger Ratio 1 0.4473688 0.7684500
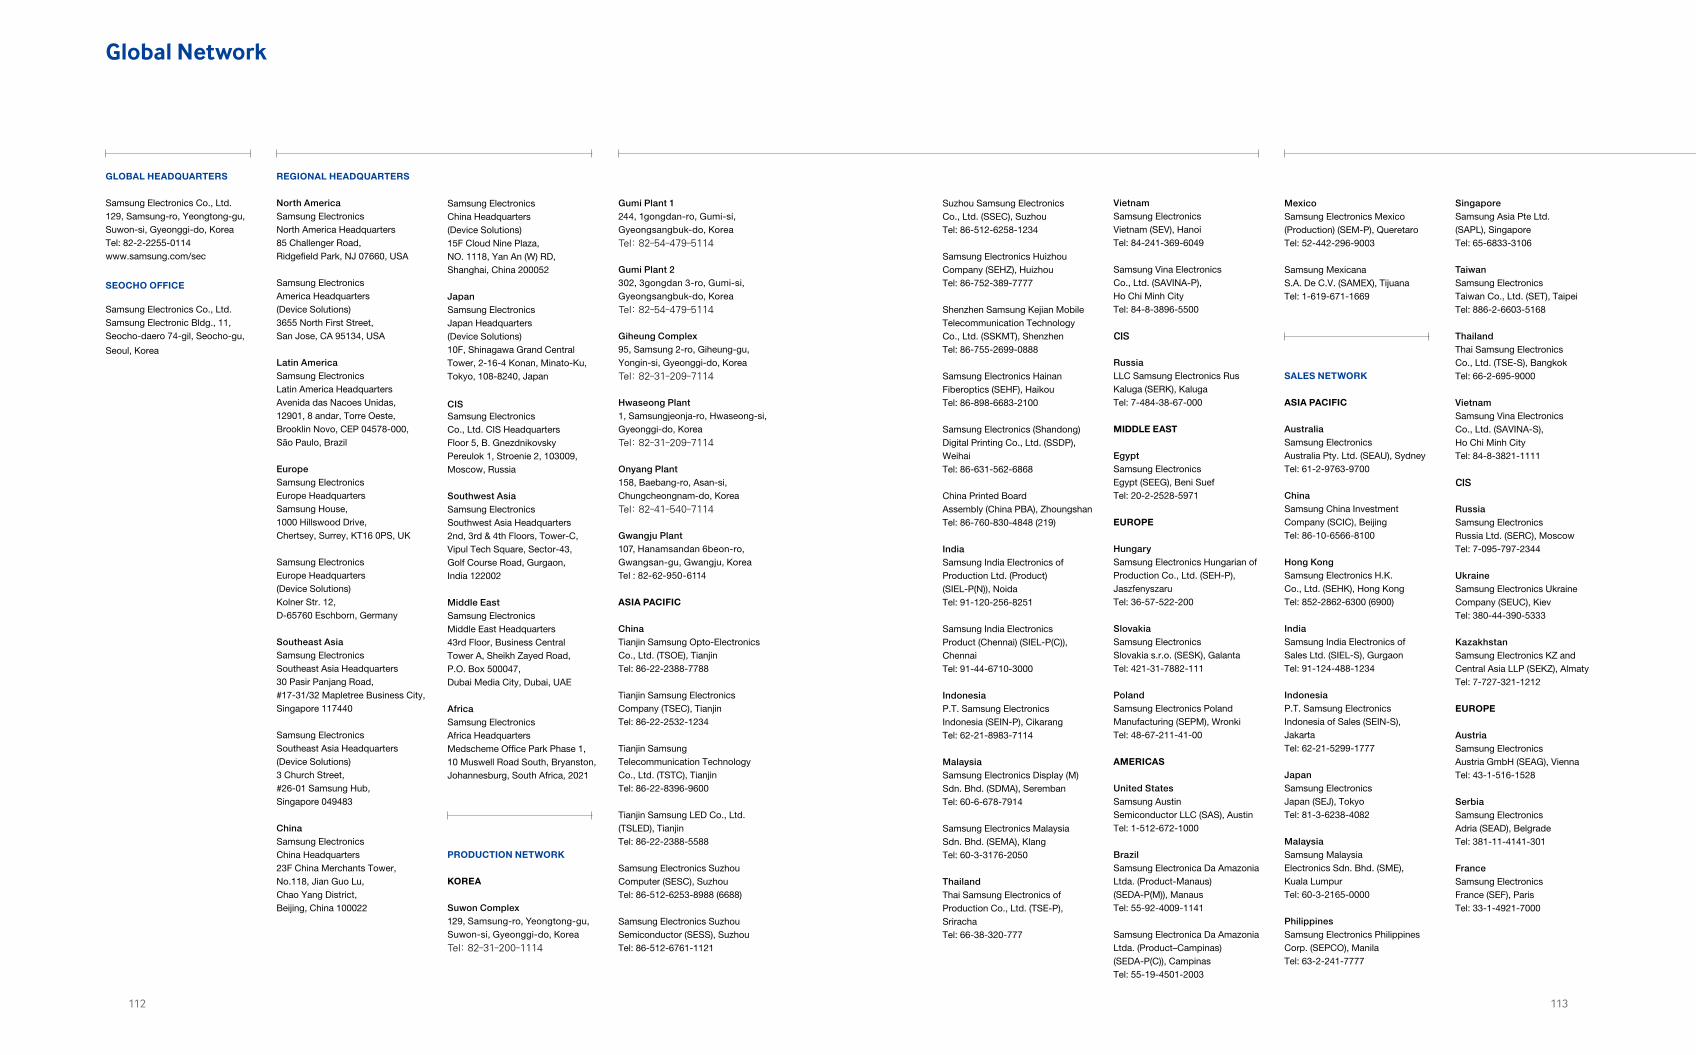
GLOBAL HEADQUARTERS
Samsung Electronics Co., Ltd.129, Samsung-ro, Yeongtong-gu, Suwon-si, Gyeonggi-do, KoreaTel: 82-2-2255-0114www.samsung.com/sec
SEOCHO OFFICE
Samsung Electronics Co., Ltd.Samsung Electronic Bldg., 11, Seocho-daero 74-gil, Seocho-gu,
Seoul, Korea
REGIONAL HEADQUARTERS
North AmericaSamsung ElectronicsNorth America Headquarters85 Challenger Road,Ridgefield Park, NJ 07660, USA
Samsung ElectronicsAmerica Headquarters(Device Solutions) 3655 North First Street,San Jose, CA 95134, USA
Latin AmericaSamsung ElectronicsLatin America HeadquartersAvenida das Nacoes Unidas,12901, 8 andar, Torre Oeste,Brooklin Novo, CEP 04578-000,São Paulo, Brazil
EuropeSamsung ElectronicsEurope HeadquartersSamsung House,1000 Hillswood Drive, Chertsey, Surrey, KT16 0PS, UK
Samsung ElectronicsEurope Headquarters (Device Solutions)Kolner Str. 12,D-65760 Eschborn, Germany
Southeast AsiaSamsung ElectronicsSoutheast Asia Headquarters30 Pasir Panjang Road,#17-31/32 Mapletree Business City,Singapore 117440
Samsung Electronics Southeast Asia Headquarters (Device Solutions) 3 Church Street,#26-01 Samsung Hub,Singapore 049483
ChinaSamsung ElectronicsChina Headquarters23F China Merchants Tower,No.118, Jian Guo Lu,Chao Yang District, Beijing, China 100022
SingaporeSamsung Asia Pte Ltd.(SAPL), SingaporeTel: 65-6833-3106
TaiwanSamsung ElectronicsTaiwan Co., Ltd. (SET), TaipeiTel: 886-2-6603-5168
ThailandThai Samsung ElectronicsCo., Ltd. (TSE-S), BangkokTel: 66-2-695-9000
VietnamSamsung Vina ElectronicsCo., Ltd. (SAVINA-S), Ho Chi Minh CityTel: 84-8-3821-1111
CIS
RussiaSamsung ElectronicsRussia Ltd. (SERC), MoscowTel: 7-095-797-2344
UkraineSamsung Electronics UkraineCompany (SEUC), KievTel: 380-44-390-5333
KazakhstanSamsung Electronics KZ andCentral Asia LLP (SEKZ), AlmatyTel: 7-727-321-1212
EUROPE
AustriaSamsung ElectronicsAustria GmbH (SEAG), ViennaTel: 43-1-516-1528
SerbiaSamsung Electronics Adria (SEAD), BelgradeTel: 381-11-4141-301
FranceSamsung ElectronicsFrance (SEF), ParisTel: 33-1-4921-7000
Suzhou Samsung ElectronicsCo., Ltd. (SSEC), SuzhouTel: 86-512-6258-1234
Samsung Electronics HuizhouCompany (SEHZ), HuizhouTel: 86-752-389-7777
Shenzhen Samsung Kejian MobileTelecommunication TechnologyCo., Ltd. (SSKMT), ShenzhenTel: 86-755-2699-0888
Samsung Electronics HainanFiberoptics (SEHF), HaikouTel: 86-898-6683-2100
Samsung Electronics (Shandong)Digital Printing Co., Ltd. (SSDP),WeihaiTel: 86-631-562-6868
China Printed BoardAssembly (China PBA), ZhoungshanTel: 86-760-830-4848 (219)
IndiaSamsung India Electronics of Production Ltd. (Product)(SIEL-P(N)), NoidaTel: 91-120-256-8251
Samsung India ElectronicsProduct (Chennai) (SIEL-P(C)),ChennaiTel: 91-44-6710-3000
IndonesiaP.T. Samsung ElectronicsIndonesia (SEIN-P), CikarangTel: 62-21-8983-7114
MalaysiaSamsung Electronics Display (M)Sdn. Bhd. (SDMA), SerembanTel: 60-6-678-7914
Samsung Electronics MalaysiaSdn. Bhd. (SEMA), KlangTel: 60-3-3176-2050
ThailandThai Samsung Electronics ofProduction Co., Ltd. (TSE-P),SrirachaTel: 66-38-320-777
Samsung ElectronicsChina Headquarters (Device Solutions)15F Cloud Nine Plaza,NO. 1118, Yan An (W) RD, Shanghai, China 200052
JapanSamsung ElectronicsJapan Headquarters (Device Solutions)10F, Shinagawa Grand Central Tower, 2-16-4 Konan, Minato-Ku, Tokyo, 108-8240, Japan
CISSamsung ElectronicsCo., Ltd. CIS HeadquartersFloor 5, B. GnezdnikovskyPereulok 1, Stroenie 2, 103009,Moscow, Russia
Southwest AsiaSamsung ElectronicsSouthwest Asia Headquarters2nd, 3rd & 4th Floors, Tower-C,Vipul Tech Square, Sector-43,Golf Course Road, Gurgaon, India 122002
Middle EastSamsung ElectronicsMiddle East Headquarters43rd Floor, Business CentralTower A, Sheikh Zayed Road,P.O. Box 500047,Dubai Media City, Dubai, UAE
AfricaSamsung ElectronicsAfrica HeadquartersMedscheme Office Park Phase 1,10 Muswell Road South, Bryanston,Johannesburg, South Africa, 2021
PRODUCTION NETWORK
KOREA
Suwon Complex129, Samsung-ro, Yeongtong-gu, Suwon-si, Gyeonggi-do, KoreaTel: 82-31-200-1114
VietnamSamsung ElectronicsVietnam (SEV), HanoiTel: 84-241-369-6049
Samsung Vina ElectronicsCo., Ltd. (SAVINA-P), Ho Chi Minh CityTel: 84-8-3896-5500
CIS
RussiaLLC Samsung Electronics RusKaluga (SERK), KalugaTel: 7-484-38-67-000
MIDDLE EAST
EgyptSamsung ElectronicsEgypt (SEEG), Beni SuefTel: 20-2-2528-5971
EUROPE
HungarySamsung Electronics Hungarian ofProduction Co., Ltd. (SEH-P),JaszfenyszaruTel: 36-57-522-200
SlovakiaSamsung ElectronicsSlovakia s.r.o. (SESK), GalantaTel: 421-31-7882-111
PolandSamsung Electronics PolandManufacturing (SEPM), WronkiTel: 48-67-211-41-00
AMERICAS
United StatesSamsung AustinSemiconductor LLC (SAS), AustinTel: 1-512-672-1000
BrazilSamsung Electronica Da AmazoniaLtda. (Product-Manaus)(SEDA-P(M)), ManausTel: 55-92-4009-1141
Samsung Electronica Da AmazoniaLtda. (Product–Campinas)(SEDA-P(C)), CampinasTel: 55-19-4501-2003
Gumi Plant 1244, 1gongdan-ro, Gumi-si, Gyeongsangbuk-do, KoreaTel: 82-54-479-5114
Gumi Plant 2302, 3gongdan 3-ro, Gumi-si, Gyeongsangbuk-do, KoreaTel: 82-54-479-5114
Giheung Complex95, Samsung 2-ro, Giheung-gu, Yongin-si, Gyeonggi-do, KoreaTel: 82-31-209-7114
Hwaseong Plant1, Samsungjeonja-ro, Hwaseong-si, Gyeonggi-do, KoreaTel: 82-31-209-7114
Onyang Plant158, Baebang-ro, Asan-si, Chungcheongnam-do, KoreaTel: 82-41-540-7114
Gwangju Plant107, Hanamsandan 6beon-ro, Gwangsan-gu, Gwangju, KoreaTel : 82-62-950-6114
ASIA PACIFIC
ChinaTianjin Samsung Opto-ElectronicsCo., Ltd. (TSOE), TianjinTel: 86-22-2388-7788
Tianjin Samsung ElectronicsCompany (TSEC), TianjinTel: 86-22-2532-1234
Tianjin SamsungTelecommunication TechnologyCo., Ltd. (TSTC), TianjinTel: 86-22-8396-9600
Tianjin Samsung LED Co., Ltd.(TSLED), TianjinTel: 86-22-2388-5588
Samsung Electronics SuzhouComputer (SESC), SuzhouTel: 86-512-6253-8988 (6688)
Samsung Electronics SuzhouSemiconductor (SESS), SuzhouTel: 86-512-6761-1121
MexicoSamsung Electronics Mexico(Production) (SEM-P), QueretaroTel: 52-442-296-9003
Samsung MexicanaS.A. De C.V. (SAMEX), TijuanaTel: 1-619-671-1669
SALES NETWORK
ASIA PACIFIC
AustraliaSamsung ElectronicsAustralia Pty. Ltd. (SEAU), SydneyTel: 61-2-9763-9700
ChinaSamsung China InvestmentCompany (SCIC), BeijingTel: 86-10-6566-8100
Hong KongSamsung Electronics H.K.Co., Ltd. (SEHK), Hong KongTel: 852-2862-6300 (6900)
IndiaSamsung India Electronics ofSales Ltd. (SIEL-S), GurgaonTel: 91-124-488-1234
IndonesiaP.T. Samsung ElectronicsIndonesia of Sales (SEIN-S),JakartaTel: 62-21-5299-1777
JapanSamsung ElectronicsJapan (SEJ), TokyoTel: 81-3-6238-4082
MalaysiaSamsung MalaysiaElectronics Sdn. Bhd. (SME),Kuala LumpurTel: 60-3-2165-0000
PhilippinesSamsung Electronics PhilippinesCorp. (SEPCO), ManilaTel: 63-2-241-7777
Global Network
113112
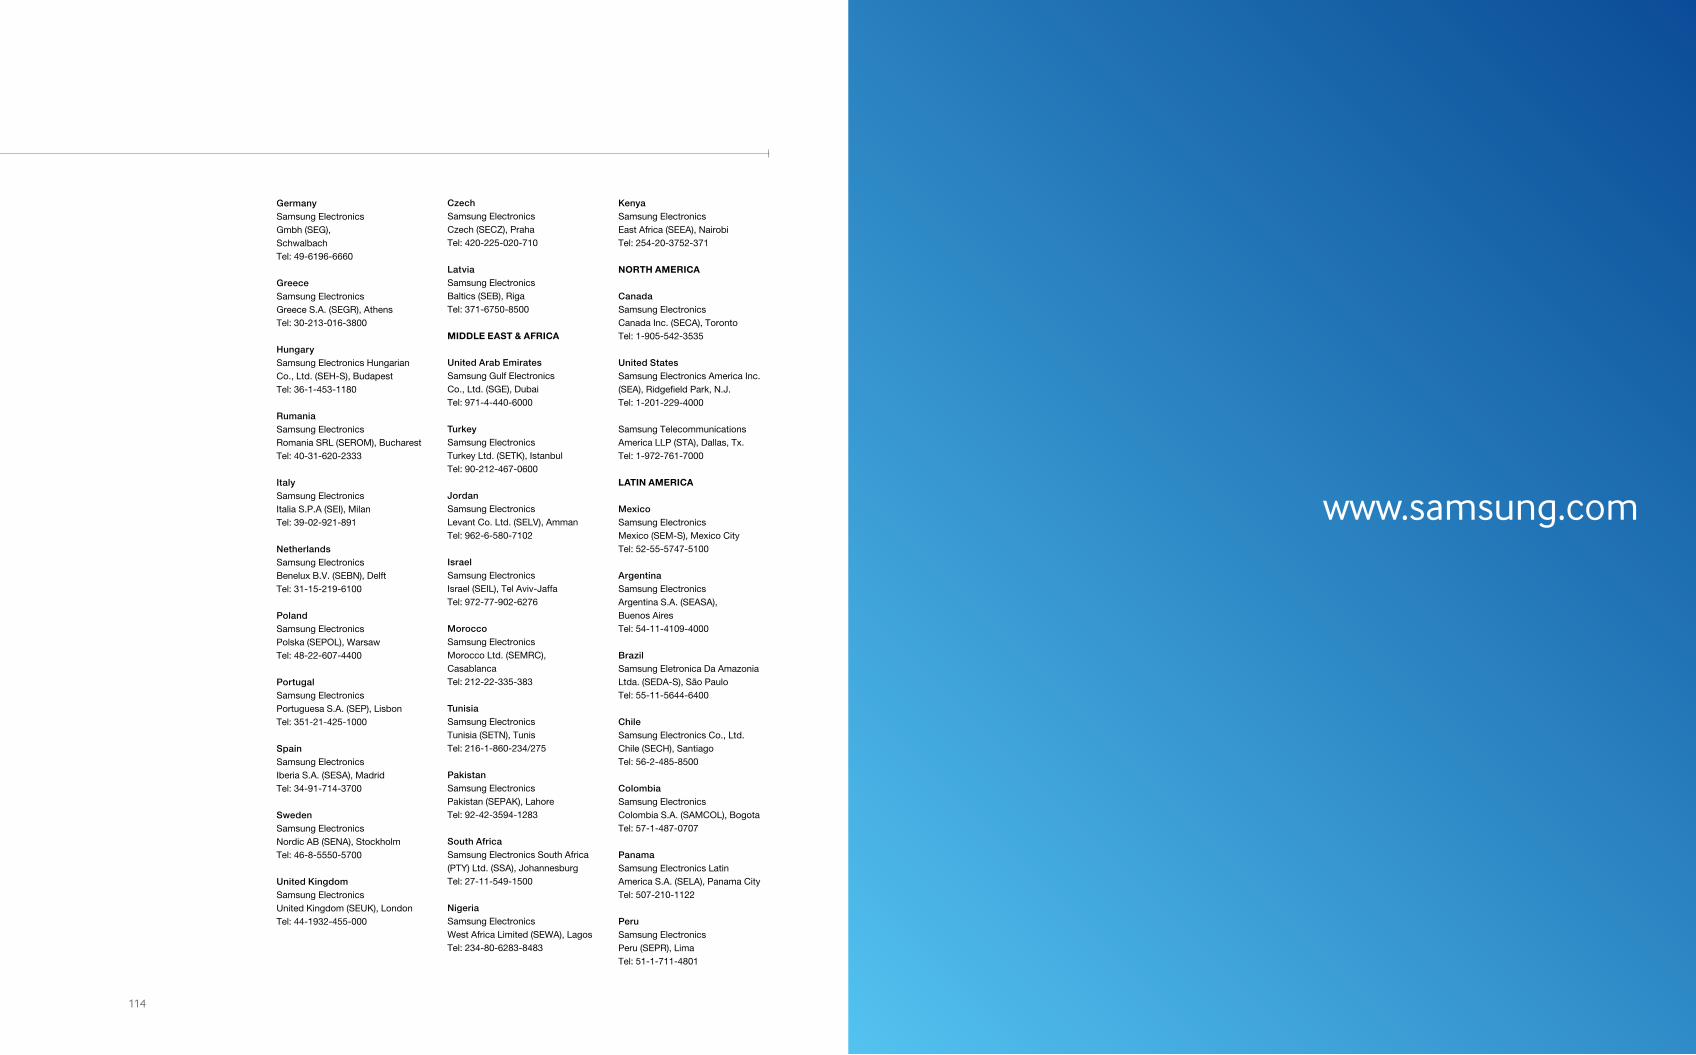
CzechSamsung Electronics Czech (SECZ), PrahaTel: 420-225-020-710
LatviaSamsung ElectronicsBaltics (SEB), RigaTel: 371-6750-8500
MIDDLE EAST & AFRICA
United Arab EmiratesSamsung Gulf ElectronicsCo., Ltd. (SGE), DubaiTel: 971-4-440-6000
TurkeySamsung ElectronicsTurkey Ltd. (SETK), IstanbulTel: 90-212-467-0600
JordanSamsung Electronics Levant Co. Ltd. (SELV), AmmanTel: 962-6-580-7102
IsraelSamsung ElectronicsIsrael (SEIL), Tel Aviv-JaffaTel: 972-77-902-6276
MoroccoSamsung Electronics Morocco Ltd. (SEMRC), CasablancaTel: 212-22-335-383
TunisiaSamsung ElectronicsTunisia (SETN), TunisTel: 216-1-860-234/275
PakistanSamsung ElectronicsPakistan (SEPAK), LahoreTel: 92-42-3594-1283
South AfricaSamsung Electronics South Africa (PTY) Ltd. (SSA), JohannesburgTel: 27-11-549-1500
NigeriaSamsung ElectronicsWest Africa Limited (SEWA), LagosTel: 234-80-6283-8483
KenyaSamsung ElectronicsEast Africa (SEEA), NairobiTel: 254-20-3752-371
NORTH AMERICA
CanadaSamsung ElectronicsCanada Inc. (SECA), TorontoTel: 1-905-542-3535
United StatesSamsung Electronics America Inc.(SEA), Ridgefield Park, N.J.Tel: 1-201-229-4000
Samsung TelecommunicationsAmerica LLP (STA), Dallas, Tx.Tel: 1-972-761-7000
LATIN AMERICA
MexicoSamsung ElectronicsMexico (SEM-S), Mexico CityTel: 52-55-5747-5100
ArgentinaSamsung ElectronicsArgentina S.A. (SEASA),Buenos AiresTel: 54-11-4109-4000
BrazilSamsung Eletronica Da AmazoniaLtda. (SEDA-S), São PauloTel: 55-11-5644-6400
ChileSamsung Electronics Co., Ltd.Chile (SECH), SantiagoTel: 56-2-485-8500
ColombiaSamsung ElectronicsColombia S.A. (SAMCOL), BogotaTel: 57-1-487-0707
PanamaSamsung Electronics Latin America S.A. (SELA), Panama CityTel: 507-210-1122
PeruSamsung Electronics Peru (SEPR), LimaTel: 51-1-711-4801
GermanySamsung Electronics Gmbh (SEG), SchwalbachTel: 49-6196-6660
GreeceSamsung Electronics Greece S.A. (SEGR), AthensTel: 30-213-016-3800
HungarySamsung Electronics HungarianCo., Ltd. (SEH-S), BudapestTel: 36-1-453-1180
RumaniaSamsung ElectronicsRomania SRL (SEROM), BucharestTel: 40-31-620-2333
ItalySamsung ElectronicsItalia S.P.A (SEI), MilanTel: 39-02-921-891
NetherlandsSamsung ElectronicsBenelux B.V. (SEBN), DelftTel: 31-15-219-6100
PolandSamsung ElectronicsPolska (SEPOL), WarsawTel: 48-22-607-4400
PortugalSamsung Electronics Portuguesa S.A. (SEP), LisbonTel: 351-21-425-1000
SpainSamsung Electronics Iberia S.A. (SESA), MadridTel: 34-91-714-3700
SwedenSamsung ElectronicsNordic AB (SENA), StockholmTel: 46-8-5550-5700
United KingdomSamsung ElectronicsUnited Kingdom (SEUK), LondonTel: 44-1932-455-000
114
www.samsung.com


![Home [] · 2021. 2. 24. · samsung samsung samsung samsung samsung advance advance advance advance advance advance advance advance advance advance 223sw 2233sw 2233sw 2233sw 933sn](https://static.documents.pub/doc/80x56/613cd1974c23507cb6359ff0/home-2021-2-24-samsung-samsung-samsung-samsung-samsung-advance-advance.jpg)


