Page 1
Sustainable Building:You can’t always get what you want, but if you try virtually you might get what you need
Martin FischerProfessor, Civil and Environmental Engineering
Director, Center for Integrated Facility Engineering (CIFE)
http://www.stanford.edu/~fischer
[email protected]
Page 2
CIFE Development and Background
• 100% funded by industry
– Building owners
– Design and construction companies
– Software and hardware vendors
• 1988-2000
– Building Information Modeling (BIM)
• 2000-2010
– Virtual Design and Construction (VDC)
• 2010+
– Integrated Facility Engineering
– Breakthrough performance
Page 3
Hospital Objectives
NSH Project Objectives
ICEBIM+ ProcessCurrent State Process, T5 Rebar Detailing for Construction
De
sig
nM
an
ufa
ctu
reE
ng
ine
erin
g
Release CAD
dwg, rebar
schedule (*.CSF)
in Documentum
Document
control delay
(1 week)
Preliminary
designGA drawings
Refine RC details
and concept for
buildability/
detailing
Use model to
develop and
communicate
methods
Prepare RC detail
drawings
(drafting)
Check and
coordinate detail
drawings
CAD check
(1d/dwg)
Check against
engineering calcs
(.5d /dwg)
Independent final
check & sign off
(2 weeks)
Building control
check & sign off
(BAA, time?)
Release paper P4
dwgs & bar
bending
schedules
Rebar factory
starts bending
Pre-assembly
Ship to site
Draft spec
Comment on
spec
Update spec Release spec
Model rebar
component (Use
digital
Prototyping tool)
Issue and resolve
TQ’s (Technical
Queries)
AutoCAD CAD RC IDEAS Arma +
Design input/
changes
Technology:
Detailed
engineering
design
information
Site assembly
Preliminary drafting
2 weeks
Back drafting
1 week
Checking
2 weeks
Document control
1 weekTimeline:
NOTE: Drawings are batched into sections-
then subdivided into building components.
Each component is an assembly package,
e.g. rail box floor, wall, etc.
The number of drawing sheets per building
component vary depending on the work. On
ART for example, each component may
consist of 8-15 GA drawings and 8-15 RC
detail drawings.
All of the GA drawings are complete -
pend ing changes f rom other des ign
disciplines
NOTE: Design changes
during detailing (from:
architecture, baggage,
s y s t e m s , e t c . ) a r e
upsetting RC drawing
development.
Other / None/
Unknown
Preliminary RC
detailing
Iterative
process
Consists of:
engineering
calculations,
sketches, etc.
Most of the checking
process is done
concurrently with RC
detail development.
BAA building control
accepts the opinion
of the independent
design check - and
does not perform a
check of its own
Asse
mb
ly
Existing Process - 6 weeks
Client/Business Objectives
Project Objectives
Virtual Design and Construction (VDC)
Page 4
Past Present Future
• Yesterday’s practice:
YCASWYG
You can’t always see what you get
• Today’s practice:
WYSIWYG
What you see is what you get
• Next practice:
WYMIWYG
What you model is what you get}
performance Scofield 2002
Page 5
Suggested steps for creating sustainable facilities • Define project goals
– Connect them to design solutions
– Revisit them throughout the project
• Implement a solid information infrastructure
• Develop many design alternatives
– Evaluate them consistently
• Engage the right professionals for decisions in a timely manner
– Keep them engaged and accountable
• Carefully design the project schedule
• Virtually build and operate
• Document the as-built facility
• Commission
• Document the accuracy of the performance predictions
• Document operations cost and value
• Establish a culture of learning
• Enable the project team to move money between organizations
Page 6
Key strategies for breakthrough
sustainability performance
• Create appropriate synergies between building
systems through integrated facility engineering
• Develop as many design options as possible
• Reduce response and decision latency
• Increase information transparency
• Set goals predict measure compare
Page 7
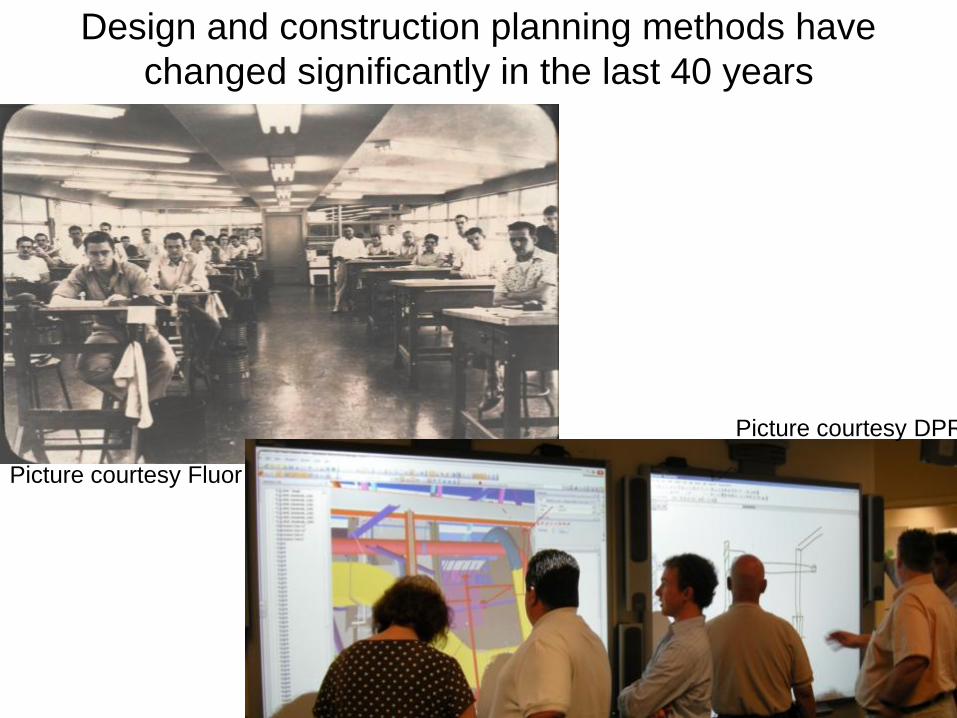
Design and construction planning methods have
changed significantly in the last 40 years
Picture courtesy Fluor
Picture courtesy DPR
Page 8
As have coordination and communication methods
Picture courtesy Fluor
Picture courtesy Accu-Crete
Page 9
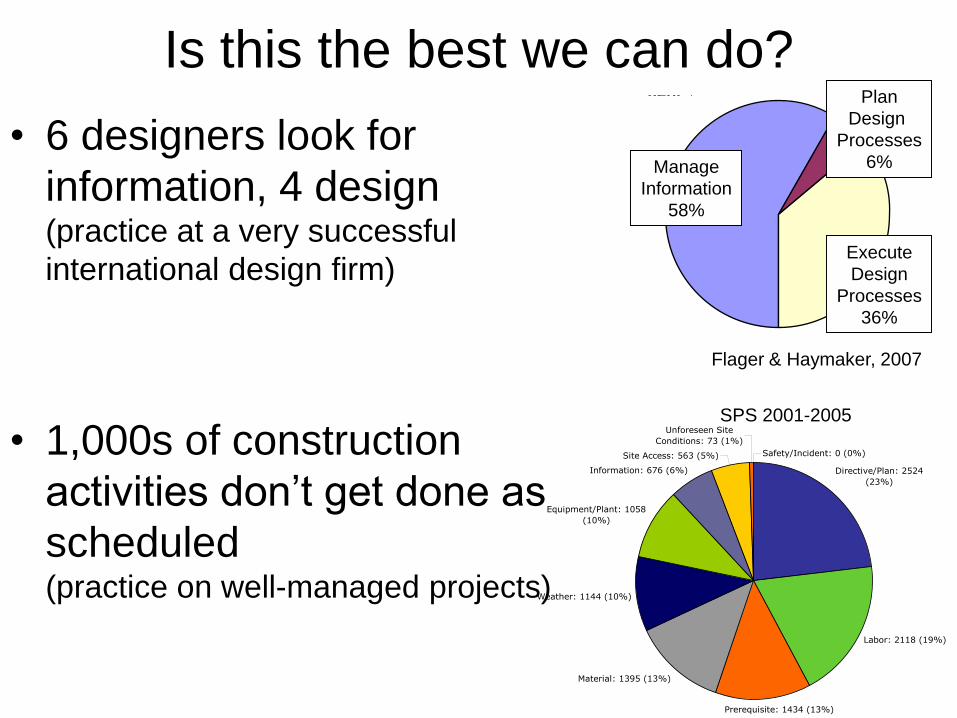
Is this the best we can do?
• 6 designers look for
information, 4 design(practice at a very successful
international design firm)
• 1,000s of construction
activities don’t get done as
scheduled(practice on well-managed projects)
58%
6%
36%
Management
Specification
Execution
2.85 weeks7 weeks
Subsequent
(avg.)Initial
Average Number
of Iterations Per
Project
Duration of Design
Iterations
Number and duration of design iterations
Relative time spent on design tasks by category
Specification
(6%)
Execution
(36%)
Management
(58%)
Manage
Information
58%
Plan
Design
Processes
6%
Execute
Design
Processes
36%
Flager & Haymaker, 2007
Reasons Analysis
Directive/Plan: 2524
(23%)
Labor: 2118 (19%)
Prerequisite: 1434 (13%)
Material: 1395 (13%)
Weather: 1144 (10%)
Equipment/Plant: 1058
(10%)
Information: 676 (6%)
Site Access: 563 (5%)
Unforeseen Site
Conditions: 73 (1%)
Safety/Incident: 0 (0%)
SPS 2001-2005
Page 10
Is this the best we can do?
• Predicted energy
consumption
does not match
actual
consumption(findings from buildings
where owners really
cared about energy
performance)
(Turner and Frankel, 2008)
Page 11
11
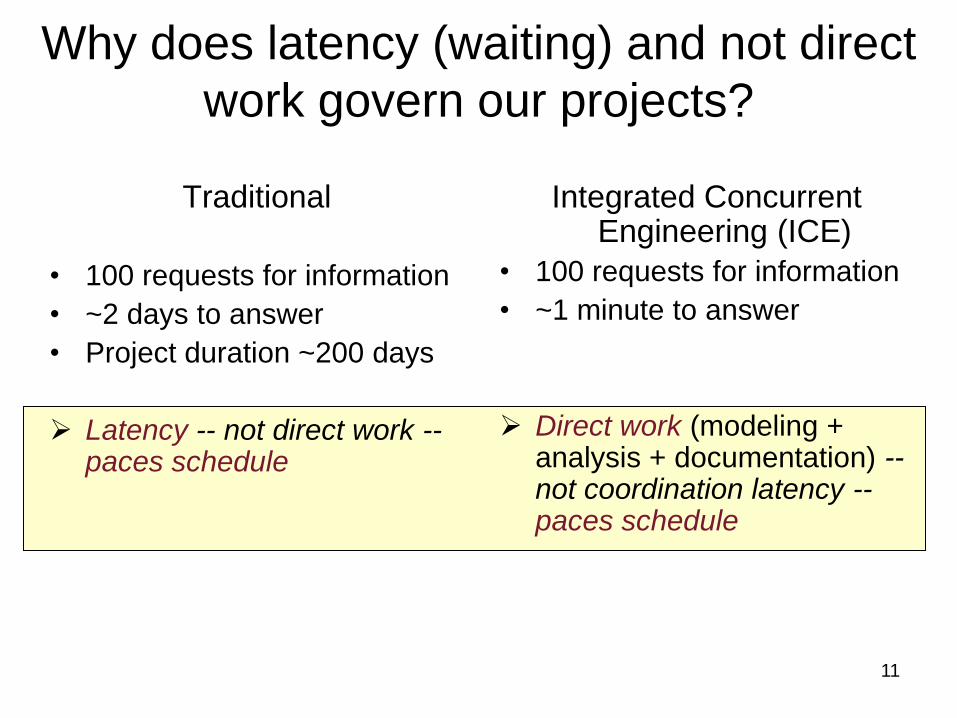
Why does latency (waiting) and not direct
work govern our projects?
Traditional
• 100 requests for information
• ~2 days to answer
• Project duration ~200 days
Latency -- not direct work --paces schedule
Integrated Concurrent Engineering (ICE)
• 100 requests for information
• ~1 minute to answer
Direct work (modeling + analysis + documentation) --not coordination latency --paces schedule
Page 12
Copyright © 2001-2010 Strategic Project Solutions, Inc. (SPS). All Rights Reserved.
68 days to perform 9 days of work
Data
SendDrawgs to
Plann.DeptLayouts Drwg
ValueEngineer
Drwg
AddManufact.
Details
File
IssueOfficial
Document(drwg)Drwg
AproveDrawing
Drwg
80 hrs(10 days-2 weeks)
Value Stream for Rectangular Ducts
Produce"L"
Shapes
Fit"L"
ShapesWIP
FitCorners
WIP
Deliver toCCs
WIP
Deliver toT5 Main
Site
CrossTHE GATE
InstallSite
Stock
PlaceOrder
Deliverto
HotchkissSteel
Manufacture
(UK)Order
160 hrs(32 days - 4 weeks)
Data
PlaceOrder
Deliverto
HotchkissSealant
Fabricate(USA)
Order
40 hrs(5 days- 1 week)
Data
HotchkissManufacturing
Facility
80hrs(10 days-2 weeks)
DuctInstalled
THE GATE
Drwg Drwg
NumberItems
ExtractLayoutfromSME
ReviewInstall.Details
T5 SITE
Design Flow
Raw Material Flow: Steel
Raw Material Flow: Sealant
8 hrs(1 day)
120 hrs(15 days-3 weeks)
Data
UseCompuDuct
1 hr 0.5 hr 0.034 hr
(2 min.)
0.17 hr
(10 min.)
0.084 hr
(5 min.)
0.017 hr
(1 min.)
0.017 hr
(1 min)
16 hrs
(2 days)
0.034 hr
(2 min)
Steel
8 hrs
(1 day)
8 hrs
(1 day)
8 hrs
(1 day)
8 hrs
(1 day)
8 hrs
(1 day)
8 hrs
(1 day)
Sealant
0.067 hr
(4 min.)
0.084 hr
(5 min.)
0.05 hr
(3 min.)
1.5-month
Stock
9-month
Stock
MoveProductsto Hold
Area WIP
0.17 hr
(10 min.)
CheckQuality
ducts
0.084 hr
(5 min.)
LoadLorry stor.
1 night
0.17 hr
(10 min.)2 hrs
Production Capacity=100 tn of ducts/month
ducts
Consolidate
ducts
CCs
Estimated # of workers for Installation = 200no
8 hrs(1 day)
0.5 hr 0.5 hr8 hrs
(1 day)
1 hr 0.5 hr0.25 hr 3 hrs
DescriptionValueAdded
Time (hrs)
TotalDurations
(hrs)% VAT
Design 17.86 200 9%
RM-steel
Manufacturing
CCs
Installation
24 160 15%
RM-sealant 24 80 30%
2.63 80 3.3%
1 8 12.5%
3.75 17 22%
EstimatedTotals
545 13.45%73.24
Effort
(hrs)Calendar Duration
Page 13
Why do we leave so many facility performance aspects to chance?
t
$, t, energy, CO2, human costs, etc.
Facility Maintenance Cost
Business Operations Cost
Design-Construction Costs
Value from Facility
Building Operations Cost
Page 14
Why are we only measuring safety, cost, and schedule performance during construction and then expect a high-value, energy-efficient building?
t
$, t, energy, CO2, human costs, etc.
Facility Maintenance Cost
Business Operations Cost
Design-Construction Costs
Value from Facility
Building Operations Cost
Page 15
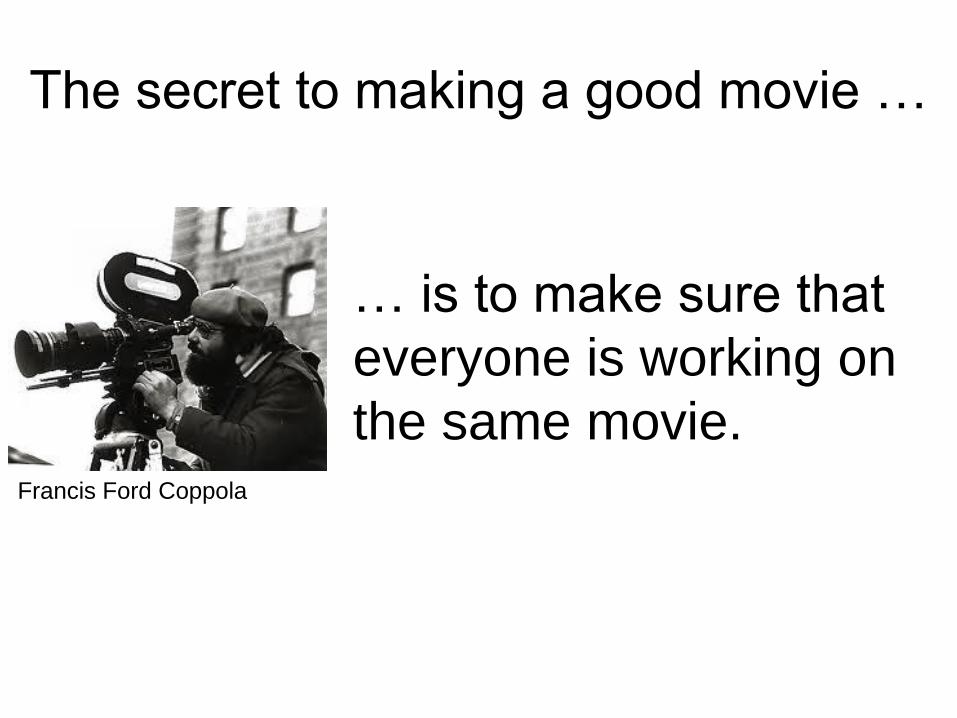
The secret to making a good movie …
… is to make sure that
everyone is working on
the same movie.Francis Ford Coppola
Page 16
Reid Senescu and John Haymaker© John Haymaker, PhD, AIA, LEED ap 2009
Establish transparent project goals
AB
C
MACDADI: Multi-Attribute Collaborative Design Analysis and Decision Integration
Page 17
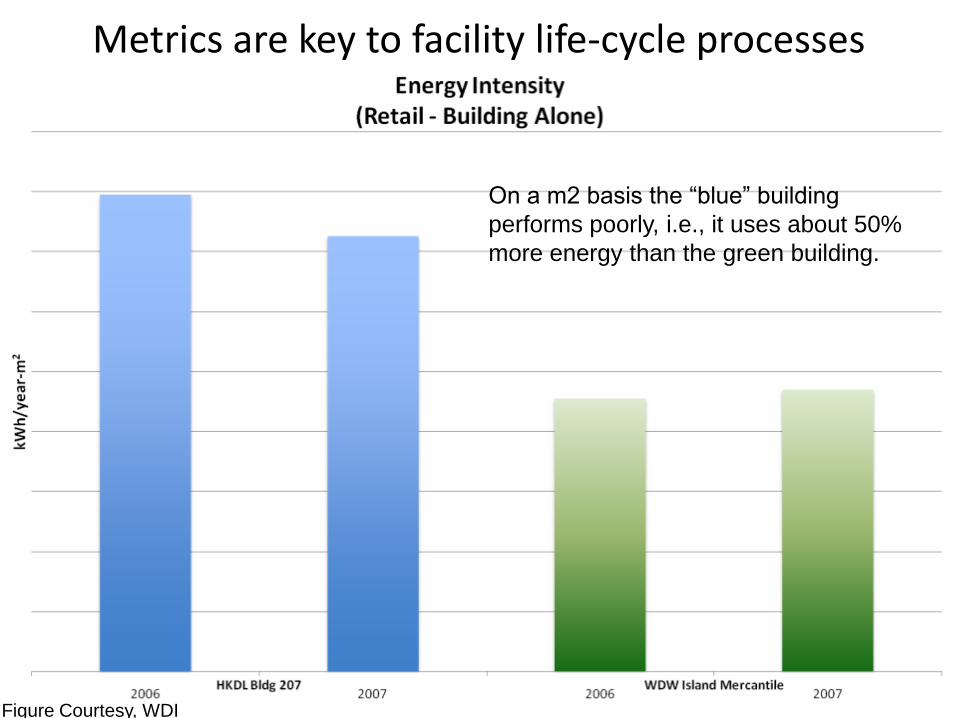
Figure Courtesy, WDI
On a m2 basis the “blue” building
performs poorly, i.e., it uses about 50%
more energy than the green building.
Metrics are key to facility life-cycle processes
Page 18
Figure Courtesy, WDI
On a transaction per m2 basis the
“green” building performs poorly, i.e., it
uses about 80% more energy than the
green building.
How do you define and track (energy) efficiency?
Page 19
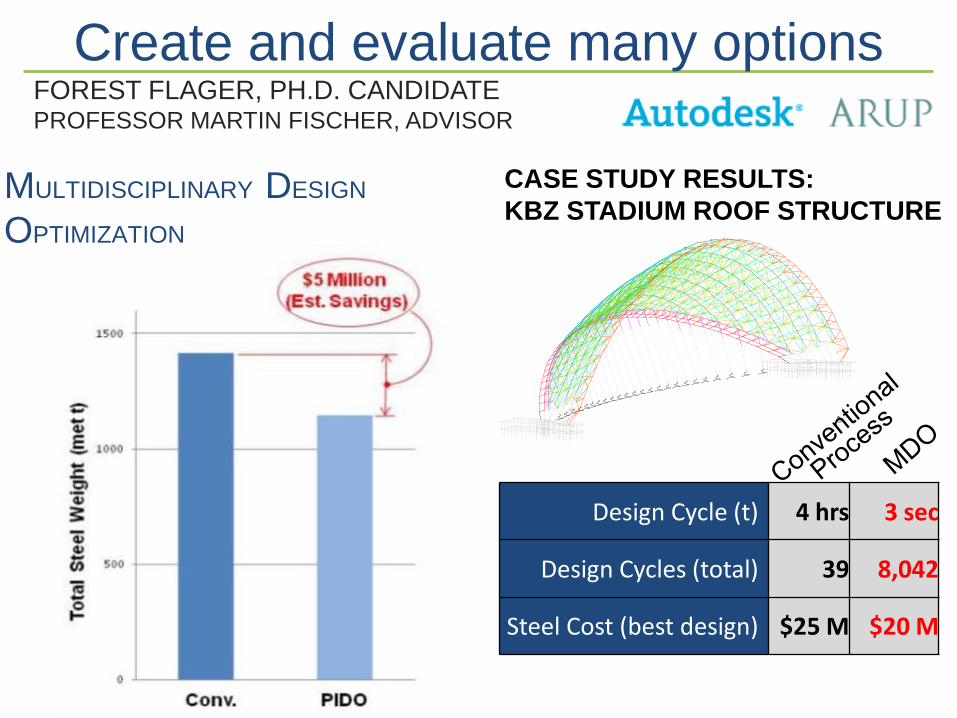
FOREST FLAGER, PH.D. CANDIDATEPROFESSOR MARTIN FISCHER, ADVISOR
Design Cycle (t) 4 hrs 3 sec
Design Cycles (total) 39 8,042
Steel Cost (best design) $25 M $20 M
CASE STUDY RESULTS:
KBZ STADIUM ROOF STRUCTURE
x y
z
DESIGN LAYER
Scale: 1:727.8
Create and evaluate many options
MULTIDISCIPLINARY DESIGN
OPTIMIZATION
Page 20
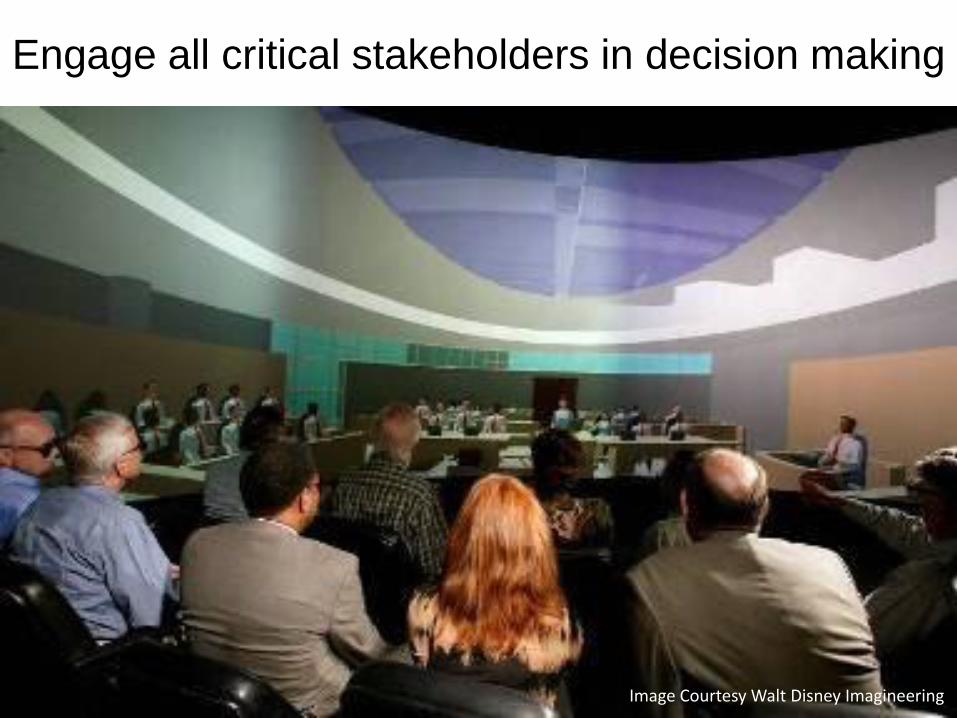
Engage all critical stakeholders in decision making
Image Courtesy Walt Disney Imagineering
Page 21
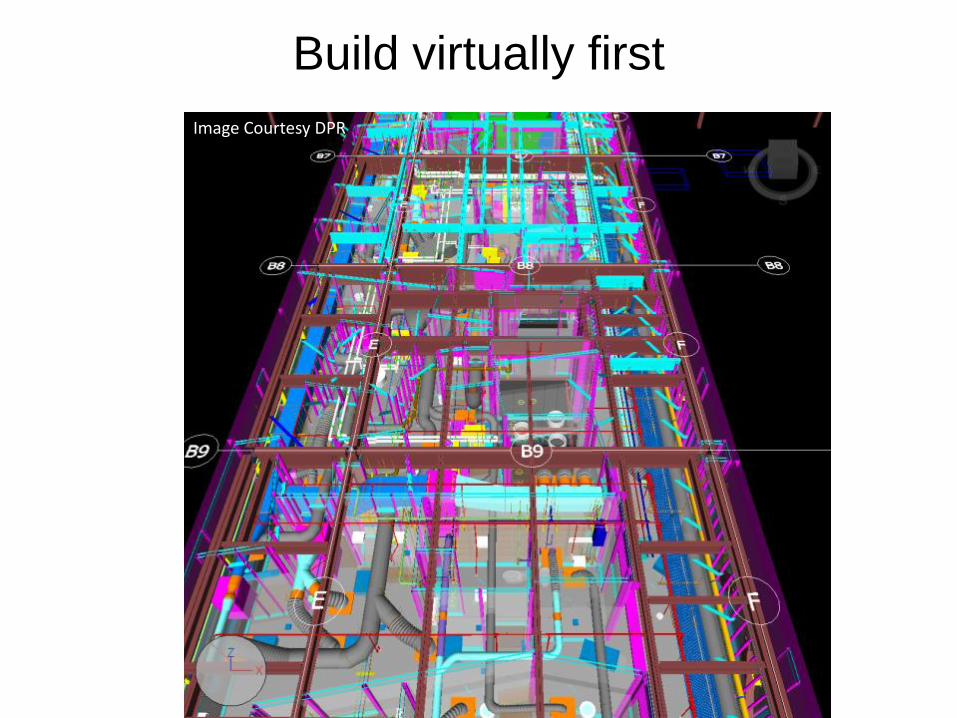
Build virtually first
Image Courtesy DPR
Page 22
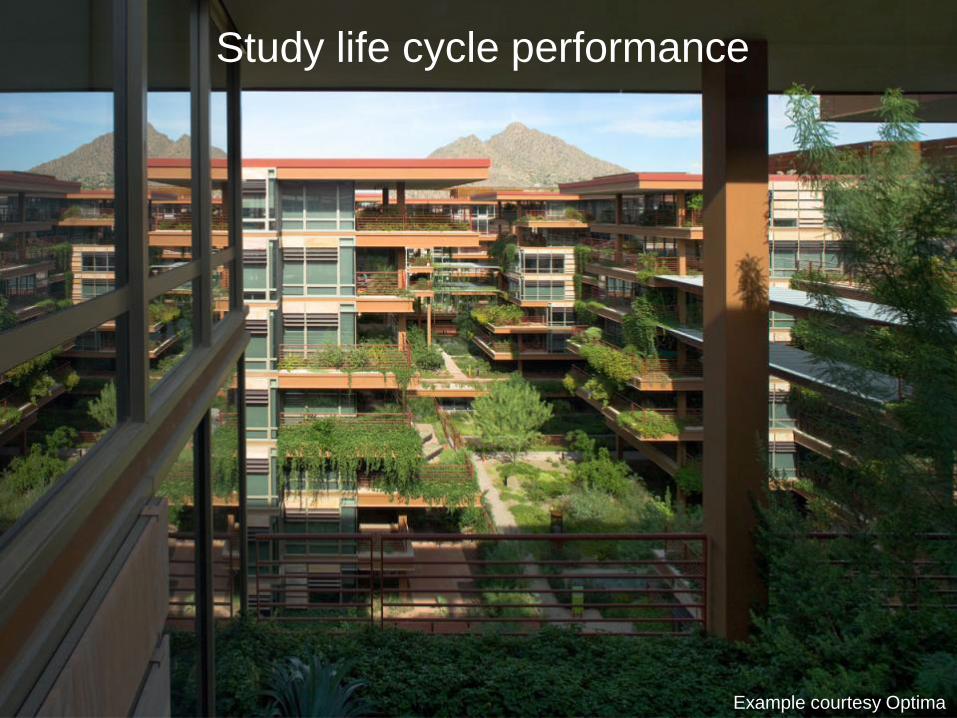
Study life cycle performance
Example courtesy Optima
Page 23
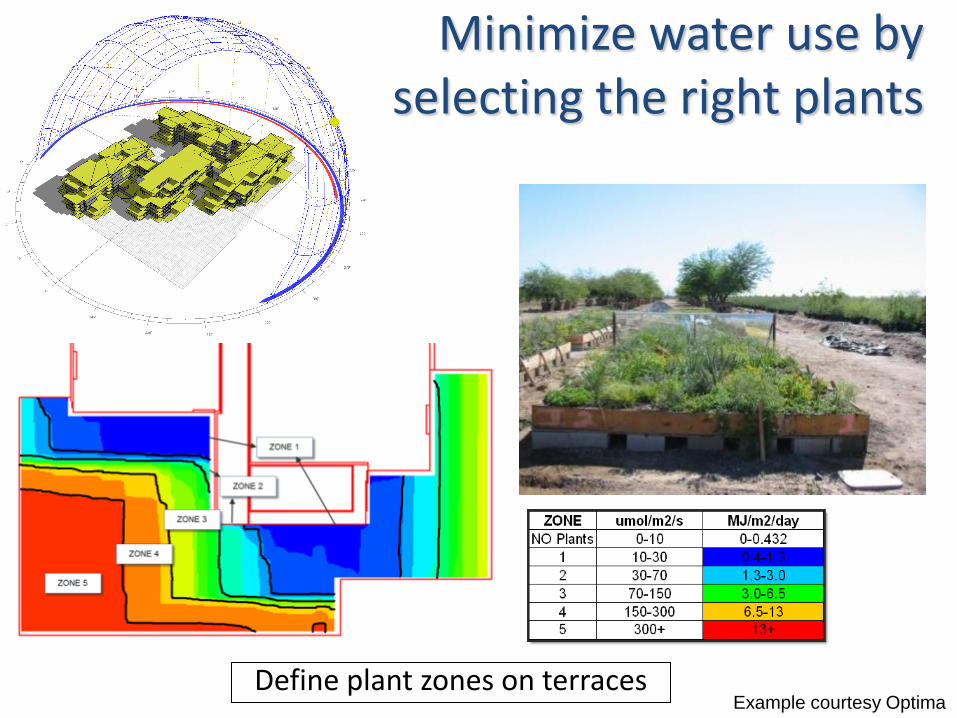
Define plant zones on terraces
Minimize water use by selecting the right plants
Example courtesy Optima
Page 24
When selecting the heating/cooling strategy during
conceptual design, consider
operations performance
operations cost
installation costs
displacement cooling mixed cooling
Snapshots courtesy of Granlund, Helsinki, Finland
Page 25
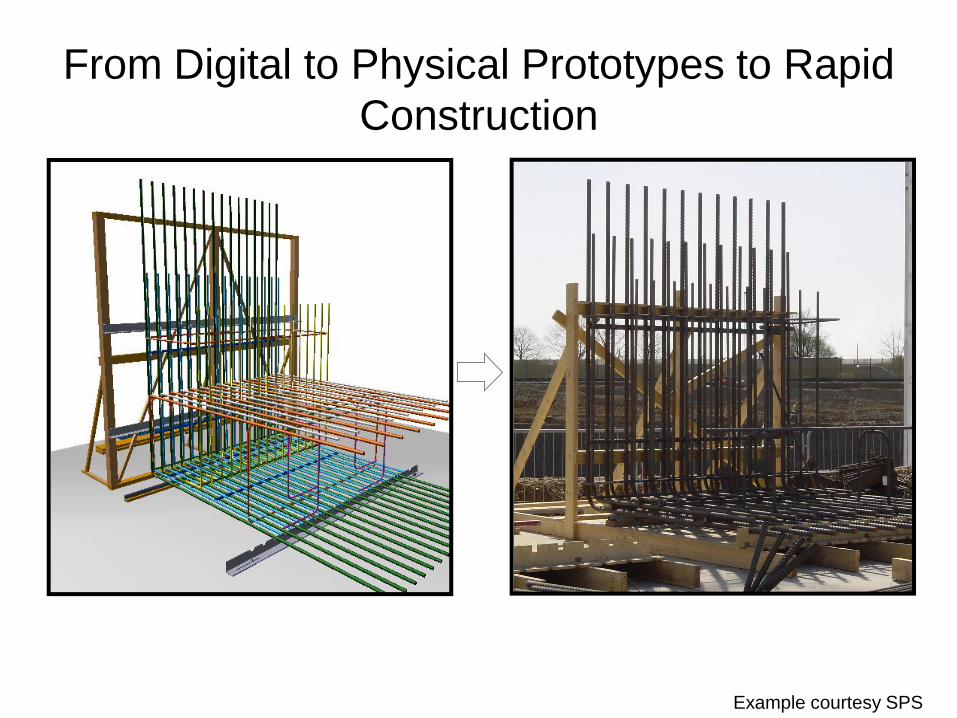
From Digital to Physical Prototypes to Rapid
Construction
Example courtesy SPS
Page 26
Cut latency by colocating project team in a VDC-enabled work environment• UCSF Mission Bay Hospital
– 60,000 m2 Hospital; 23,000 m2
Outpatient Building; 9,000 m2
Energy Center
– Budget ~$1.6B
– Complete Dec. 2014
• 4-day VDC and integration
planning workshop at CIFE with
32 key project team members
• Big Room with 100 professionals
working on the project (owner,
architect, engineers, general
contractor, subcontractors)
Image Courtesy DPR Inc.
Image Courtesy DPR Inc.
Page 27
Predict and see life cycle performance
Video clip available at: http://www.vimeo.com/4282317
Page 28
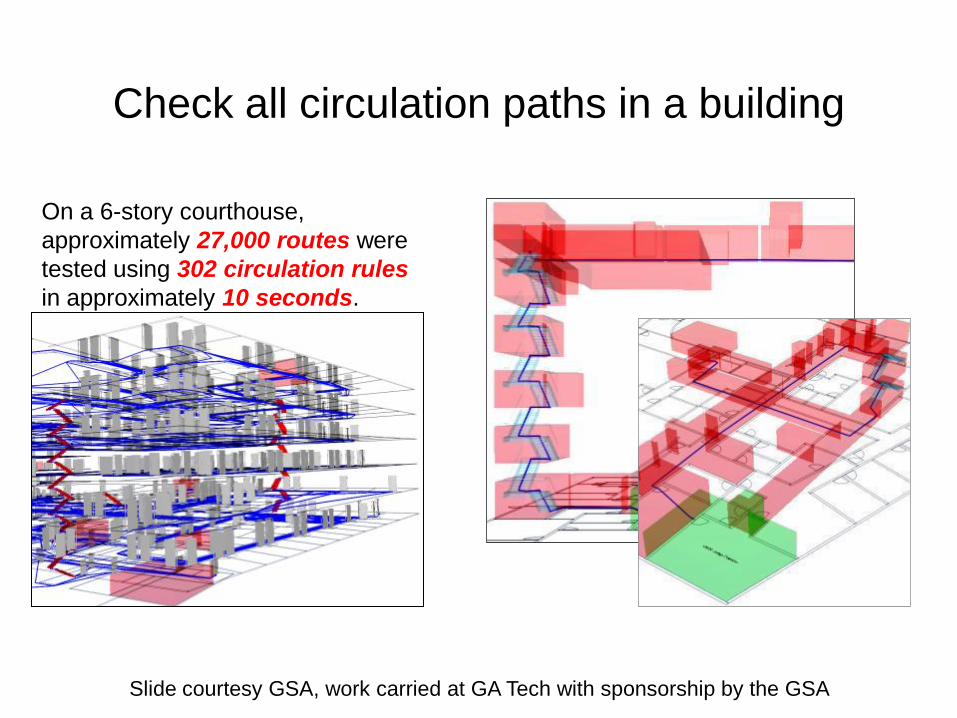
Check all circulation paths in a building
On a 6-story courthouse,
approximately 27,000 routes were
tested using 302 circulation rules
in approximately 10 seconds.
Slide courtesy GSA, work carried at GA Tech with sponsorship by the GSA
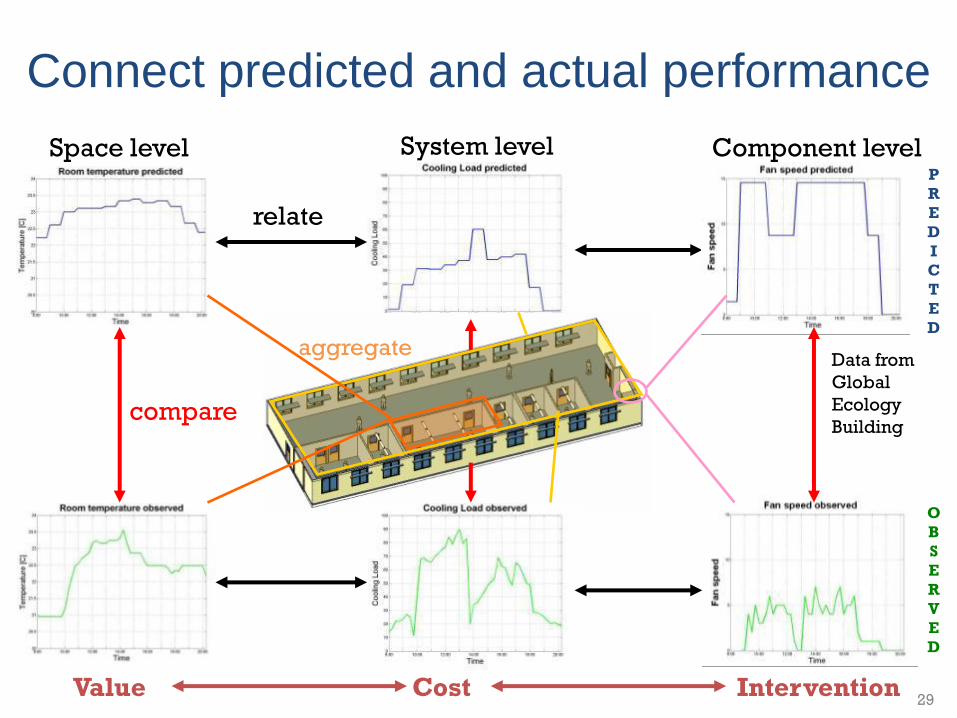
Page 29
29
relate
Connect predicted and actual performance
aggregate
Component levelSystem levelSpace level
compare
Data from
Global
Ecology
Building
P
R
E
D
I
C
T
E
D
O
B
S
E
R
V
E
D
Value Cost Intervention
Page 30
Sooner or later you/we will pay for integration
t
$, t, energy, CO2, human costs, etc.
Facility Maintenance Cost
Business Operations Cost
Design-Construction Costs
Value from Facility
Building Operations Cost
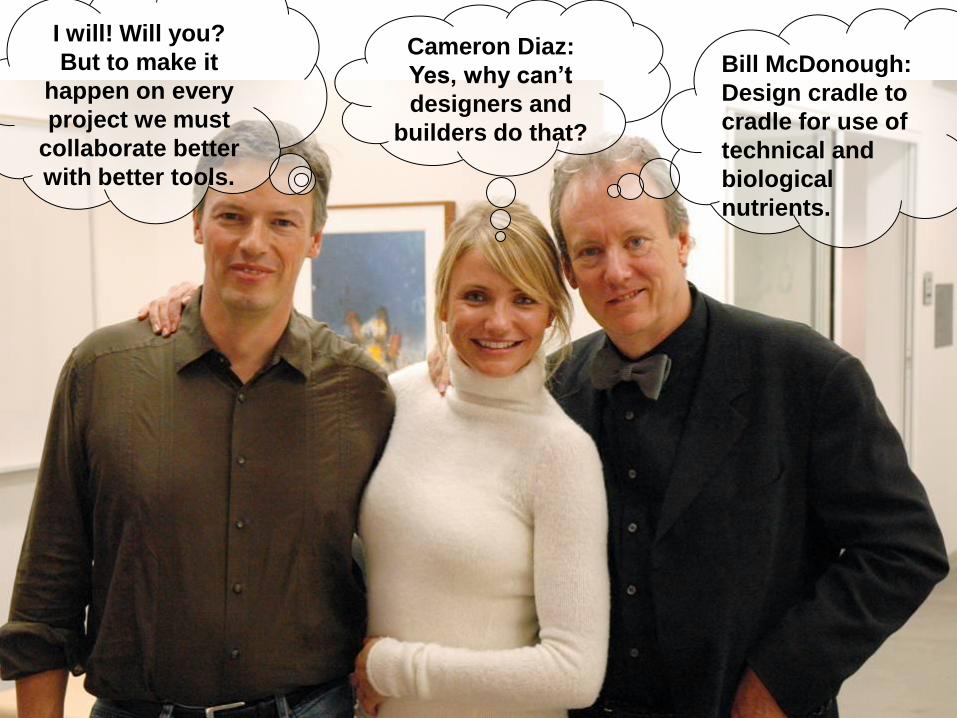
Page 31
Bill McDonough:
Design cradle to
cradle for use of
technical and
biological
nutrients.
Cameron Diaz:
Yes, why can’t
designers and
builders do that?
I will! Will you?
But to make it
happen on every
project we must
collaborate better
with better tools.
Page 32
Launch of the Green Products Innovation
InstituteMay 20, 2010
Google HQ
Rosario Dawson, Actress
Wendy Schmidt, President, Schmidt Family Foundation
Martin Fischer, Professor, Stanford University
Vance Bell, CEO, Shaw Industries
Arnold Schwarzenegger, Governor, California
Chad Hurley, Co-Founder, YouTube
Bill McDonough, Architect
Mike Volkema, Chairman, Hermann Miller
Page 33
No more excuses. Just do it!