52
Invesco fourth quarter and full year 2017 results Martin L. Flanagan President and Chief Executive Officer Loren M. Starr Chief Financial Officer January 31, 2018
Invesco fourth quarter and full year 2017 results Martin L. Flanagan President and Chief Executive Officer Loren M. Starr Chief Financial Officer January 31, 2018
Forward-looking statements
This presentation, and comments made in the associated conference call today, may include “forward-looking statements.” Forward-looking statements include information concerning future results of our operations, expenses, earnings, liquidity, cash flow and capital expenditures, industry or market conditions, AUM, geopolitical events and their potential impact on the company, acquisitions and divestitures, debt and our ability to obtain additional financing or make payments, regulatory developments, demand for and pricing of our products and other aspects of our business or general economic conditions. In addition, words such as “believes,” “expects,” “anticipates,” “intends,” “plans,” “estimates,” “projects,” “forecasts,” and future or conditional verbs such as “will,” “may,” “could,” “should,” and “would” as well as any other statement that necessarily depends on future events, are intended to identify forward-looking statements.
Forward-looking statements are not guarantees, and they involve risks, uncertainties and assumptions. There can be no assurance that actual results will not differ materially from our expectations. We caution investors not to rely unduly on any forward-looking statements and urge you to carefully consider the risks described in our most recent Form 10-K and subsequent Forms 10-Q, filed with the Securities and Exchange Commission.
You may obtain these reports from the SEC’s website at www.sec.gov. We expressly disclaim any obligation to update the information in any public disclosure if any forward-looking statement later turns out to be inaccurate.
1
Presentation of fourth quarter and full year 2017 results
This presentation includes the following non-GAAP performance measures: net revenue (and by calculation, net revenue yield on AUM), adjusted operating income, adjusted operating margin, adjusted net income attributable to Invesco Ltd., and adjusted diluted earnings per share (EPS). We believe the adjusted measures provide valuable insight into our ongoing operational performance and assist in comparisons to our competitors. These measures also assist management with the establishment of operational budgets and forecasts and assist the Board of Directors and management in determining incentive compensation decisions. The most directly comparable U.S. GAAP measures are operating revenues (and by calculation, gross revenue yield on AUM), operating income, operating margin, net income attributable to Invesco Ltd., and diluted EPS.
The information in this presentation is meant to supplement the information contained in the earnings release and includes a more detailed reconciliation format of the income statement from U.S. GAAP to a non-GAAP presentation. We believe that this presentation is useful, as it aggregates the various non-GAAP adjustments to illustrate adjusted revenue and expense categories and allows more transparency into the calculation of the non-GAAP financial measures.
2

Discussion topics
2017 overview and fourth quarter overview
Investment performance and flows
Financial results
Questions
Appendix
3
2017 overview – highlights
Past performance is not a guarantee of future results. Please see page 12 of this presentation for more information on investment performance Non-GAAP financial measures - See Appendix to this presentation for a reconciliation of adjusted operating income (and by calculation adjusted operating margin), to the most directly comparable U.S. GAAP financial measure.
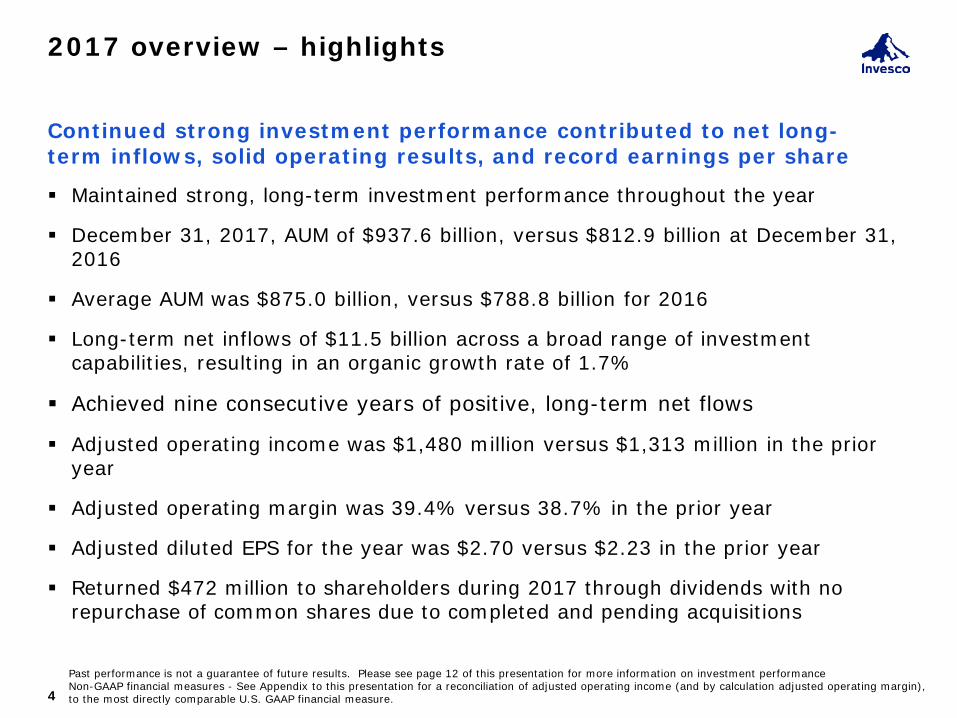
Maintained strong, long-term investment performance throughout the year
December 31, 2017, AUM of $937.6 billion, versus $812.9 billion at December 31, 2016
Average AUM was $875.0 billion, versus $788.8 billion for 2016
Long-term net inflows of $11.5 billion across a broad range of investment capabilities, resulting in an organic growth rate of 1.7%
Achieved nine consecutive years of positive, long-term net flows
Adjusted operating income was $1,480 million versus $1,313 million in the prior year
Adjusted operating margin was 39.4% versus 38.7% in the prior year
Adjusted diluted EPS for the year was $2.70 versus $2.23 in the prior year
Returned $472 million to shareholders during 2017 through dividends with no repurchase of common shares due to completed and pending acquisitions
4
Continued strong investment performance contributed to net long-term inflows, solid operating results, and record earnings per share

H
L
F
J
E
D
A
B
IVZ C
G
K
I
-6.0%
-4.0%
-2.0%
0.0%
2.0%
4.0%
6.0%
8.0%
0.0% 1.0% 2.0% 3.0% 4.0% 5.0% 6.0%
Organic Growth
Standard Deviation
Average Organic Growth = 1.1%
Average Standard Deviation = 2.3%
5
IVZ Targeted Organic Growth Rate of 3-5%
Benefits of diversification Invesco’s global diversification has lead to consistent growth and lower volatility compared to industry average
Note: Organic growth is based on average annual net long term flows divided by beginning period AUM from 2013-2017 (2017 amounts based on annualized YTD results through September 30, 2017 except IVZ). Averages exclude IVZ. Companies represented include: Affiliated Managers, Group , AllianceBernstein, Ameriprise Financial, Bank of New York Mellon , BlackRock,, Eaton Vance, Federated Investors, Franklin Resources, Lazard, Legg Mason, Principal Financial, and T. Rowe Price. Source: Invesco Ltd.

6
Delivered strong, long-term investment performance to our clients across the globe: 64% and 75% of actively managed assets in the top half of peer groups on a three- and five-year basis, respectively (as of Dec. 31, 2017).
Achieved nine consecutive years of positive, long-term net flows and record adjusted diluted EPS* of $2.70 for the year
Continued to build our comprehensive range of active, passive and alternative capabilities while strengthening our scale and relevance in key capabilities:
– Completed the acquisition of Source, a leading independent specialist provider of exchange-traded funds (ETFs) based in Europe;
– Announced our intention to acquire Guggenheim Investments’ ETF business, which includes 76 ETFs that would strengthen the depth, breadth and diversity of Invesco’s traditional and smart beta ETFs; and
– Launched a variety of new funds and ETFs which will strengthen our ability to help clients achieve their investment objectives.
2017 overview – building the firm to meet future client needs and strengthen our competitive position
Our achievements throughout 2017 enhanced our ability to meet current and future client needs, while strengthening our ability to compete
Past performance is not a guarantee of future results. Please see page 12 of this presentation for more information on investment performance. *Non-GAAP financial measures - See Appendix to this presentation for a reconciliation of adjusted operating income (and by calculation adjusted operating margin), to the most directly comparable U.S. GAAP financial measure.

7
Continued to expand our Invesco Solutions team, which brings together the full capabilities of the firm to provide outcomes that help clients meet their investment objectives.
Announced partnerships with a number of large enterprises for our digital advice capability, Jemstep, and are well down the implementation path with several of them. The sales and onboarding pipeline is robust, particularly among banks.
Further strengthened our investment and distribution teams through new hires and our efforts to attract, develop, motivate and retain the best talent in the industry.
Continued to drive savings through our business optimization program, which delivered more than $43 million in annualized run-rate expense savings as of the end of 2017. The savings will be used to offset investment in initiatives that enhance our ability to meet client needs and key growth initiatives for future years (e.g., factor-based investing, institutional and our expansion in China).
2017 overview – building the firm to meet future client needs and strengthen our competitive position
Our achievements throughout 2017 enhanced our ability to meet current and future client needs, while strengthening our ability to compete
Our 2017 acquisitions were intended to further strengthen our global ETF platform and enhance our long-term growth
8
Further expanding the depth, breadth and diversity of Invesco’s ETFs
Strengthening the competitiveness of our global business, and particularly our EMEA and US Wealth Management Intermediaries businesses
Providing additional scale and relevance in the growing ETF market globally
Expanding our ability to build better, more diversified portfolios for clients
Driving greater operating efficiency by delivering scale benefits to our existing global ETF platform across investments, distribution and operations
The expansion of EMEA ETFs and the planned acquisition of Guggenheim Investment’s ETFs provide highly complementary capabilities that will help accelerate the growth of our global ETF business by:
EMEA ETFs (Source)
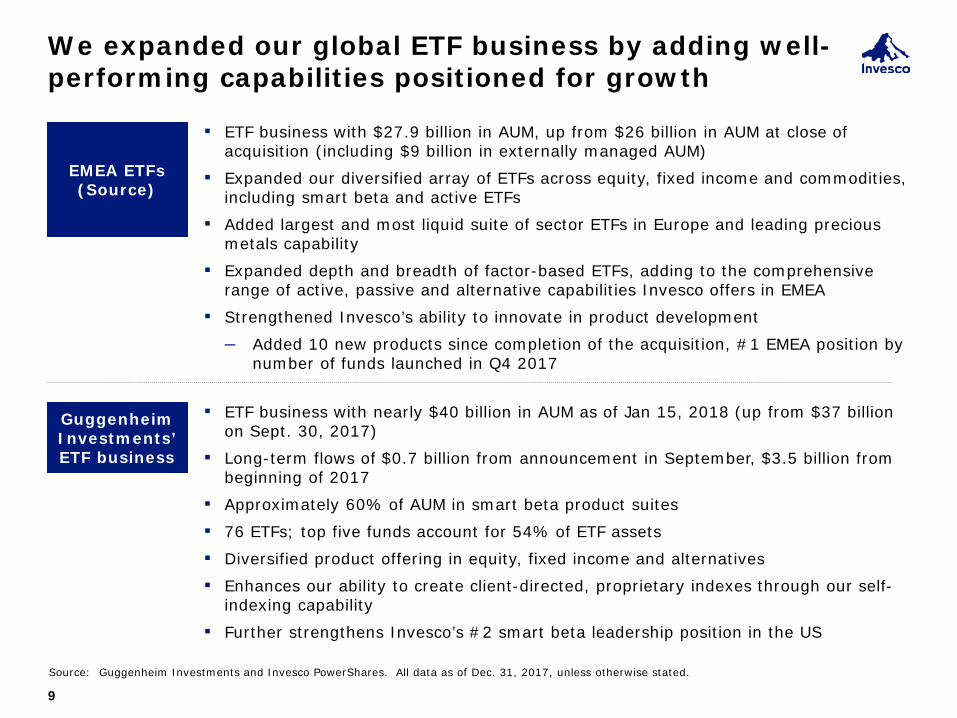
▪ ETF business with $27.9 billion in AUM, up from $26 billion in AUM at close of acquisition (including $9 billion in externally managed AUM)
▪ Expanded our diversified array of ETFs across equity, fixed income and commodities, including smart beta and active ETFs
▪ Added largest and most liquid suite of sector ETFs in Europe and leading precious metals capability
▪ Expanded depth and breadth of factor-based ETFs, adding to the comprehensive range of active, passive and alternative capabilities Invesco offers in EMEA
▪ Strengthened Invesco’s ability to innovate in product development
– Added 10 new products since completion of the acquisition, #1 EMEA position by number of funds launched in Q4 2017
Guggenheim Investments’ ETF business
9
We expanded our global ETF business by adding well-performing capabilities positioned for growth
Source: Guggenheim Investments and Invesco PowerShares. All data as of Dec. 31, 2017, unless otherwise stated.
▪ ETF business with nearly $40 billion in AUM as of Jan 15, 2018 (up from $37 billion on Sept. 30, 2017)
▪ Long-term flows of $0.7 billion from announcement in September, $3.5 billion from beginning of 2017
▪ Approximately 60% of AUM in smart beta product suites
▪ 76 ETFs; top five funds account for 54% of ETF assets
▪ Diversified product offering in equity, fixed income and alternatives
▪ Enhances our ability to create client-directed, proprietary indexes through our self-indexing capability
▪ Further strengthens Invesco’s #2 smart beta leadership position in the US
Fourth quarter overview – highlights
Past performance is not a guarantee of future results. Please see page 12 of this presentation for more information on investment performance. Non-GAAP financial measures - See Appendix to this presentation for a reconciliation to the most directly comparable U.S. GAAP financial measure.
Maintained strong, long-term investment performance – 64% and 75% of actively managed assets in top half of peer group on a 3- and 5-year basis
December 31, 2017, AUM of $937.6 billion, versus $917.5 billion at September 30, 2017
Average AUM was $930.3 billion, versus $890.8 billion for the third quarter of 2017
Solid retail and institutional demand led to long-term net inflows of $4.4 billion and a long-term organic growth rate of 2.3%
Adjusted operating income was $399 million versus $397 million in the prior quarter
Adjusted operating margin was 39.7% in the quarter versus 40.7% in the prior quarter
Adjusted diluted EPS for the quarter was $0.73 versus $0.71 in the prior quarter
Returned $119 million to shareholders during the fourth quarter through dividends. Quarterly dividend of $0.29 per share, up 3.6% over the prior year
10
Maintained strong investment performance and achieved solid long-term organic growth during the quarter
Discussion topics
2017 overview and fourth quarter overview
Investment performance and flows
Financial results
Questions
Appendix
11
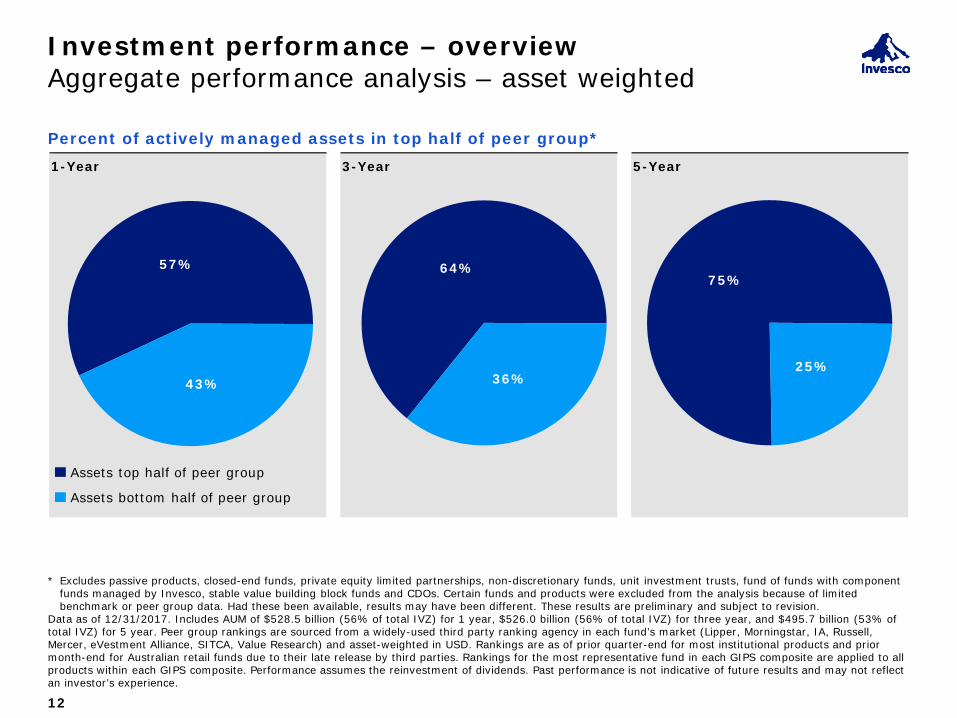
75%
25%
64%
36%
57%
43%
1-Year
Investment performance – overview Aggregate performance analysis – asset weighted
3-Year 5-Year
Assets top half of peer group
Assets bottom half of peer group
Percent of actively managed assets in top half of peer group*
12
* Excludes passive products, closed-end funds, private equity limited partnerships, non-discretionary funds, unit investment trusts, fund of funds with component funds managed by Invesco, stable value building block funds and CDOs. Certain funds and products were excluded from the analysis because of limited benchmark or peer group data. Had these been available, results may have been different. These results are preliminary and subject to revision.
Data as of 12/31/2017. Includes AUM of $528.5 billion (56% of total IVZ) for 1 year, $526.0 billion (56% of total IVZ) for three year, and $495.7 billion (53% of total IVZ) for 5 year. Peer group rankings are sourced from a widely-used third party ranking agency in each fund’s market (Lipper, Morningstar, IA, Russell, Mercer, eVestment Alliance, SITCA, Value Research) and asset-weighted in USD. Rankings are as of prior quarter-end for most institutional products and prior month-end for Australian retail funds due to their late release by third parties. Rankings for the most representative fund in each GIPS composite are applied to all products within each GIPS composite. Performance assumes the reinvestment of dividends. Past performance is not indicative of future results and may not reflect an investor’s experience.
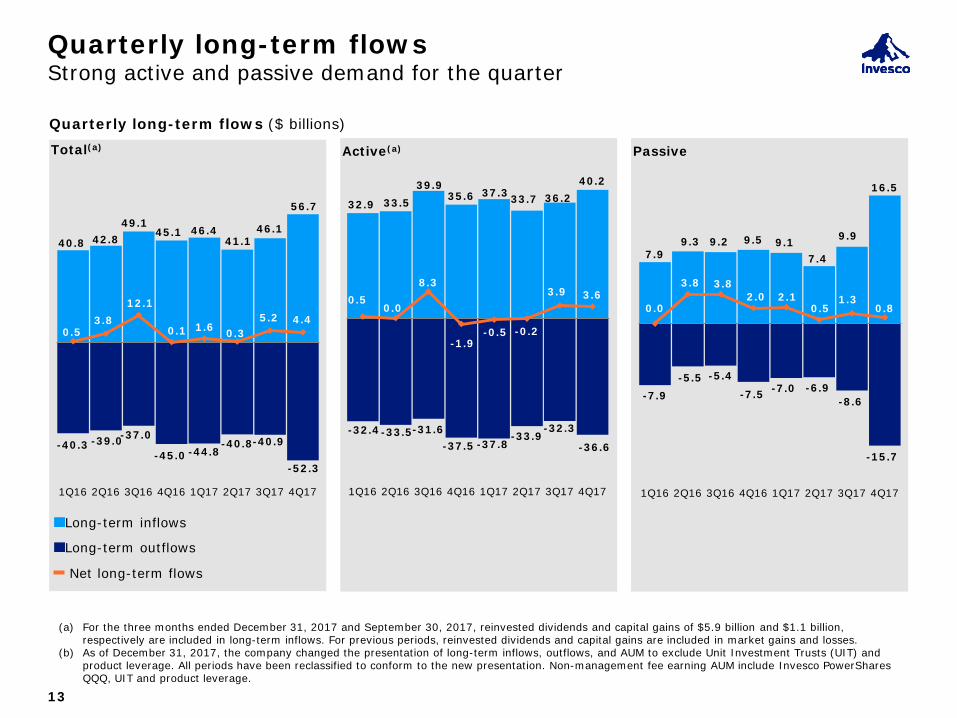
7.9 9.3 9.2 9.5 9.1
7.4
9.9
16.5
-7.9 -5.5 -5.4
-7.5 -7.0 -6.9 -8.6
-15.7
0.0
3.8 3.8 2.0 2.1
0.5 1.3
0.8
1Q16 2Q16 3Q16 4Q16 1Q17 2Q17 3Q17 4Q17
32.9 33.5 39.9
35.6 37.3 33.7 36.2 40.2
-32.4 -33.5 -31.6 -37.5 -37.8
-33.9 -32.3
-36.6
0.5 0.0
8.3
-1.9 -0.5 -0.2
3.9 3.6
1Q16 2Q16 3Q16 4Q16 1Q17 2Q17 3Q17 4Q17
40.8 42.8 49.1
45.1 46.4 41.1
46.1
56.7
-40.3 -39.0 -37.0
-45.0 -44.8 -40.8 -40.9
-52.3
0.5 3.8
12.1
0.1 1.6 0.3 5.2 4.4
1Q16 2Q16 3Q16 4Q16 1Q17 2Q17 3Q17 4Q17
Total(a)
Quarterly long-term flows Strong active and passive demand for the quarter
Active(a)
Passive
Quarterly long-term flows ($ billions)
Long-term inflows
Long-term outflows
Net long-term flows
13
(a) For the three months ended December 31, 2017 and September 30, 2017, reinvested dividends and capital gains of $5.9 billion and $1.1 billion, respectively are included in long-term inflows. For previous periods, reinvested dividends and capital gains are included in market gains and losses.
(b) As of December 31, 2017, the company changed the presentation of long-term inflows, outflows, and AUM to exclude Unit Investment Trusts (UIT) and product leverage. All periods have been reclassified to conform to the new presentation. Non-management fee earning AUM include Invesco PowerShares QQQ, UIT and product leverage.
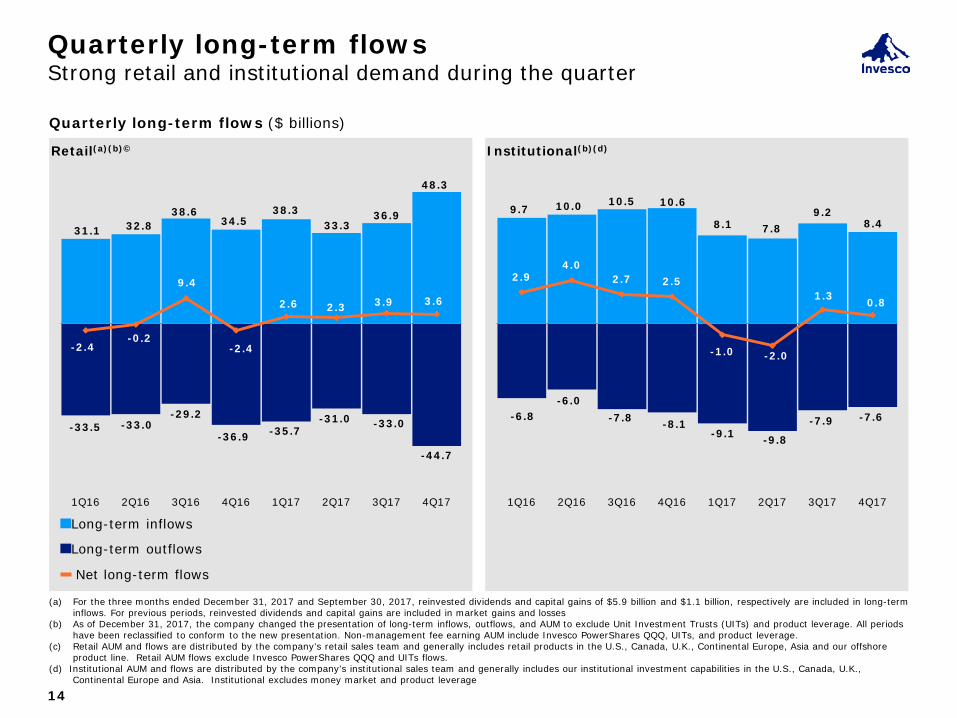
9.7 10.0 10.5 10.6
8.1 7.8 9.2
8.4
-6.8 -6.0
-7.8 -8.1 -9.1 -9.8
-7.9 -7.6
2.9 4.0
2.7 2.5
-1.0 -2.0
1.3 0.8
1Q16 2Q16 3Q16 4Q16 1Q17 2Q17 3Q17 4Q17
31.1 32.8 38.6
34.5 38.3
33.3 36.9
48.3
-33.5 -33.0 -29.2
-36.9 -35.7 -31.0 -33.0
-44.7
-2.4 -0.2
9.4
-2.4
2.6 2.3 3.9 3.6
1Q16 2Q16 3Q16 4Q16 1Q17 2Q17 3Q17 4Q17
Long-term inflows
Long-term outflows
Net long-term flows
Quarterly long-term flows ($ billions)
Retail(a)(b)© Institutional(b)(d)
(a) For the three months ended December 31, 2017 and September 30, 2017, reinvested dividends and capital gains of $5.9 billion and $1.1 billion, respectively are included in long-term inflows. For previous periods, reinvested dividends and capital gains are included in market gains and losses
(b) As of December 31, 2017, the company changed the presentation of long-term inflows, outflows, and AUM to exclude Unit Investment Trusts (UITs) and product leverage. All periods have been reclassified to conform to the new presentation. Non-management fee earning AUM include Invesco PowerShares QQQ, UITs, and product leverage.
(c) Retail AUM and flows are distributed by the company’s retail sales team and generally includes retail products in the U.S., Canada, U.K., Continental Europe, Asia and our offshore product line. Retail AUM flows exclude Invesco PowerShares QQQ and UITs flows.
(d) Institutional AUM and flows are distributed by the company’s institutional sales team and generally includes our institutional investment capabilities in the U.S., Canada, U.K., Continental Europe and Asia. Institutional excludes money market and product leverage
Quarterly long-term flows Strong retail and institutional demand during the quarter
14
Discussion topics
2017 overview and fourth quarter overview
Investment performance and flows
Financial results
Questions
Appendix
15
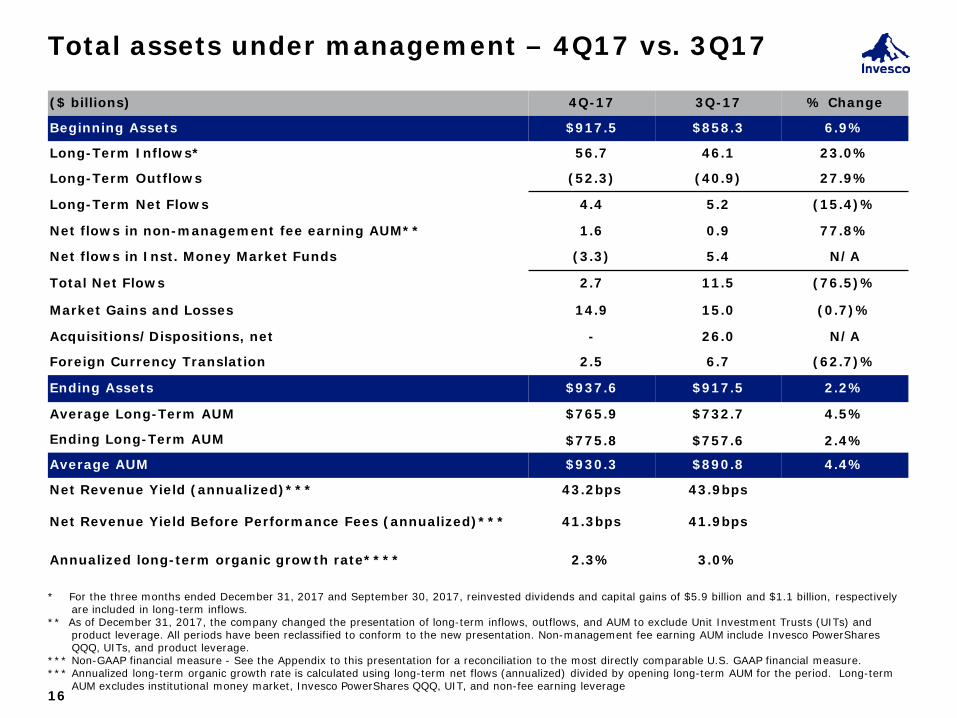
Total assets under management – 4Q17 vs. 3Q17
* For the three months ended December 31, 2017 and September 30, 2017, reinvested dividends and capital gains of $5.9 billion and $1.1 billion, respectively are included in long-term inflows.
** As of December 31, 2017, the company changed the presentation of long-term inflows, outflows, and AUM to exclude Unit Investment Trusts (UITs) and product leverage. All periods have been reclassified to conform to the new presentation. Non-management fee earning AUM include Invesco PowerShares QQQ, UITs, and product leverage.
*** Non-GAAP financial measure - See the Appendix to this presentation for a reconciliation to the most directly comparable U.S. GAAP financial measure. *** Annualized long-term organic growth rate is calculated using long-term net flows (annualized) divided by opening long-term AUM for the period. Long-term
AUM excludes institutional money market, Invesco PowerShares QQQ, UIT, and non-fee earning leverage 16
($ billions) 4Q-17 3Q-17 % Change
Beginning Assets $917.5 $858.3 6.9%
Long-Term Inflows* 56.7 46.1 23.0%
Long-Term Outflows (52.3) (40.9) 27.9%
Long-Term Net Flows 4.4 5.2 (15.4)%
Net flows in non-management fee earning AUM** 1.6 0.9 77.8%
Net flows in Inst. Money Market Funds (3.3) 5.4 N/A
Total Net Flows 2.7 11.5 (76.5)%
Market Gains and Losses 14.9 15.0 (0.7)%
Acquisitions/Dispositions, net - 26.0 N/A
Foreign Currency Translation 2.5 6.7 (62.7)%
Ending Assets $937.6 $917.5 2.2%
Average Long-Term AUM $765.9 $732.7 4.5%
Ending Long-Term AUM $775.8 $757.6 2.4%
Average AUM $930.3 $890.8 4.4%
Net Revenue Yield (annualized)*** 43.2bps 43.9bps
Net Revenue Yield Before Performance Fees (annualized)*** 41.3bps 41.9bps
Annualized long-term organic growth rate**** 2.3% 3.0%
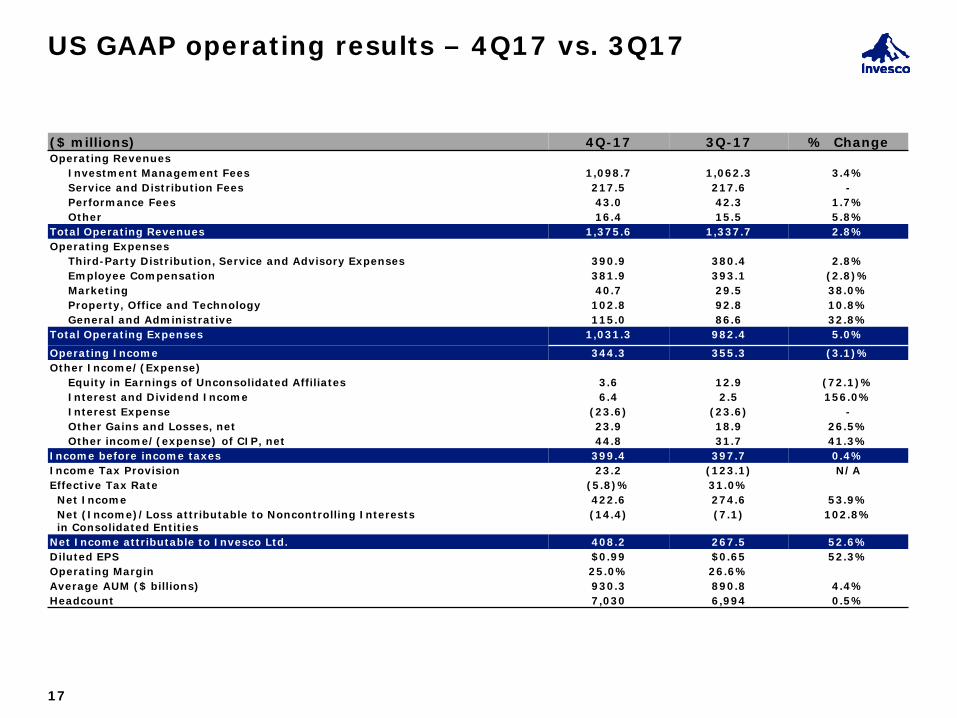
US GAAP operating results – 4Q17 vs. 3Q17
17
($ millions) 4Q-17 3Q-17 % Change Operating Revenues Investment Management Fees 1,098.7 1,062.3 3.4% Service and Distribution Fees 217.5 217.6 - Performance Fees 43.0 42.3 1.7% Other 16.4 15.5 5.8% Total Operating Revenues 1,375.6 1,337.7 2.8% Operating Expenses Third-Party Distribution, Service and Advisory Expenses 390.9 380.4 2.8% Employee Compensation 381.9 393.1 (2.8)% Marketing 40.7 29.5 38.0% Property, Office and Technology 102.8 92.8 10.8% General and Administrative 115.0 86.6 32.8% Total Operating Expenses 1,031.3 982.4 5.0%
Operating Income 344.3 355.3 (3.1)% Other Income/(Expense) Equity in Earnings of Unconsolidated Affiliates 3.6 12.9 (72.1)% Interest and Dividend Income 6.4 2.5 156.0% Interest Expense (23.6) (23.6) - Other Gains and Losses, net 23.9 18.9 26.5% Other income/(expense) of CIP, net 44.8 31.7 41.3% Income before income taxes 399.4 397.7 0.4% Income Tax Provision 23.2 (123.1) N/A Effective Tax Rate (5.8)% 31.0% Net Income 422.6 274.6 53.9% Net (Income)/Loss attributable to Noncontrolling Interests in Consolidated Entities
(14.4) (7.1) 102.8%
Net Income attributable to Invesco Ltd. 408.2 267.5 52.6% Diluted EPS $0.99 $0.65 52.3% Operating Margin 25.0% 26.6% Average AUM ($ billions) 930.3 890.8 4.4% Headcount 7,030 6,994 0.5%

Non-GAAP operating results – 4Q17 vs. 3Q17
($ millions) 4Q-17 3Q-17 % Change Adjusted Revenues Investment Management Fees 1,119.2 1,081.9 3.4% Service and Distribution Fees 217.5 217.6 - Performance Fees 43.3 43.3 - Other 18.4 16.7 10.2% Third-Party Distribution, Service and Advisory Expenses (393.5) (382.9) 2.8% Net Revenues 1,004.9 976.6 2.9% Adjusted Operating Expenses Employee Compensation 376.3 383.9 (2.0)% Marketing 39.8 30.1 32.2% Property, Office and Technology 100.8 93.7 7.6% General and Administrative 88.8 71.5 24.2% Total Adjusted Operating Expenses 605.7 579.2 4.6% Adjusted Operating Income 399.2 397.4 0.5% Adjusted Other Income/(Expense) Equity in Earnings of Unconsolidated Affiliates 9.3 13.8 (32.6)% Interest and Dividend Income 5.1 2.9 75.9% Interest Expense (23.6) (23.6) - Other Gains and Losses, net 18.3 12.8 43.0% Adjusted Income before income taxes 408.3 403.3 1.2% Income Tax Provision (109.2) (111.5) (2.1)% Effective Tax Rate 26.8% 27.6% Adjusted Net Income attributable to Invesco Ltd. 299.1 291.8 2.5% Adjusted Diluted EPS $0.73 $0.71 2.8% Adjusted Operating Margin 39.7% 40.7% Average AUM ($ billions) 930.3 890.8 4.4% Headcount 7,030 6,994 0.5%
Non-GAAP financial measures - See the Appendix to this presentation for a reconciliation to the most directly comparable U.S. GAAP financial measure.
18
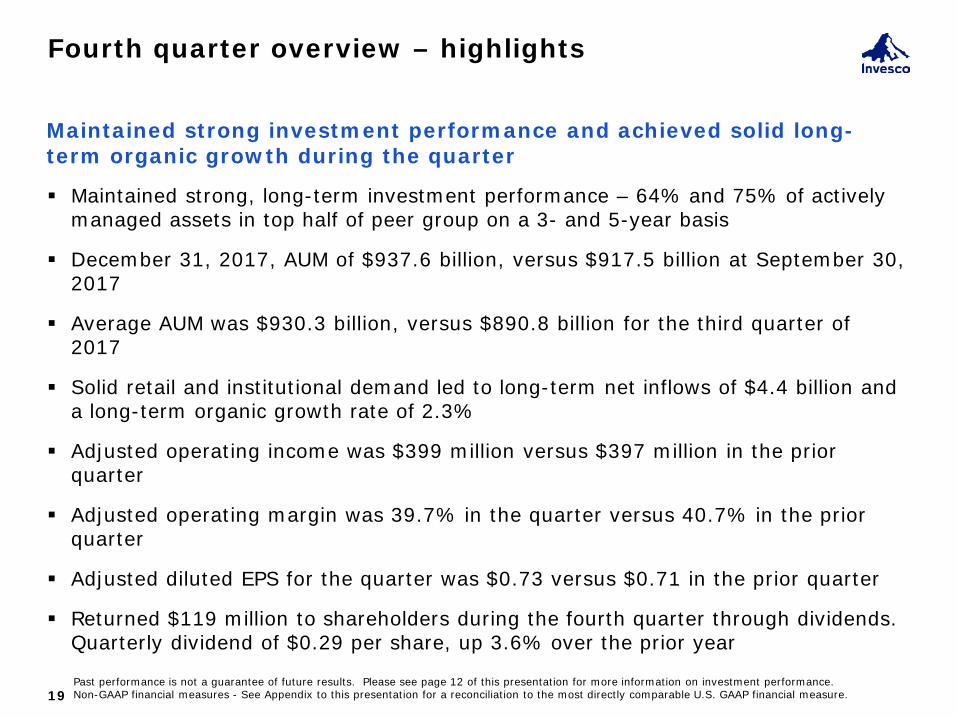
Fourth quarter overview – highlights
Past performance is not a guarantee of future results. Please see page 12 of this presentation for more information on investment performance. Non-GAAP financial measures - See Appendix to this presentation for a reconciliation to the most directly comparable U.S. GAAP financial measure.
Maintained strong, long-term investment performance – 64% and 75% of actively managed assets in top half of peer group on a 3- and 5-year basis
December 31, 2017, AUM of $937.6 billion, versus $917.5 billion at September 30, 2017
Average AUM was $930.3 billion, versus $890.8 billion for the third quarter of 2017
Solid retail and institutional demand led to long-term net inflows of $4.4 billion and a long-term organic growth rate of 2.3%
Adjusted operating income was $399 million versus $397 million in the prior quarter
Adjusted operating margin was 39.7% in the quarter versus 40.7% in the prior quarter
Adjusted diluted EPS for the quarter was $0.73 versus $0.71 in the prior quarter
Returned $119 million to shareholders during the fourth quarter through dividends. Quarterly dividend of $0.29 per share, up 3.6% over the prior year
19
Maintained strong investment performance and achieved solid long-term organic growth during the quarter

Discussion topics
2017 overview and fourth quarter overview
Investment performance and flows
Financial results
Questions
Appendix
20

Discussion topics
2017 overview and fourth quarter overview
Investment performance and flows
Financial results
Questions
Appendix
21

We are diversified as a firm Delivering a diverse set of solutions to meet client needs
As of December 31, 2017.
By client domicile By channel By asset class
$585.4 $26.8
$110.9 $127.1 $87.4
$937.6 Total
U.S. Canada U.K. Europe Asia
8.5% 16.0% 12.9% 76.3% 9.3%
15.3%
1-Yr Change ($ billions)
$637.0 $300.6
$937.6 Total
Retail Institutional
21.0% 5.0%
15.3%
1-Yr Change ($ billions)
$431.2 $57.7 $78.7
$225.8 $144.2
Total
Equity Balanced Money Market Fixed Income Alternatives
18.4% 23.3% 0.5%
11.9% 18.2%
15.3%
1-Yr Change ($ billions)
$937.6
22
62%
3%
12%
14%
9%
68%
32%
46%
6% 8%
24%
16%
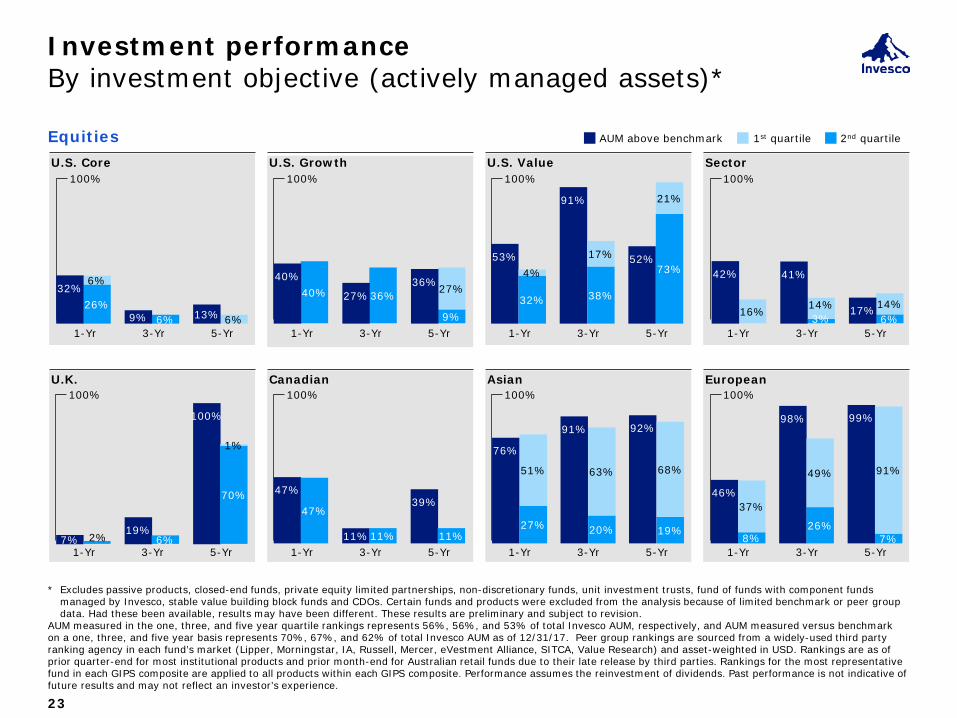
Investment performance By investment objective (actively managed assets)*
Equities
1-Yr 3-Yr 5-Yr
100%
1-Yr 3-Yr 5-Yr
100%
1-Yr 3-Yr 5-Yr
100%
1-Yr 3-Yr 5-Yr
100%
1-Yr 3-Yr 5-Yr
100%
1-Yr 3-Yr 5-Yr
100%
76%
91% 92%
1-Yr 3-Yr 5-Yr
100%
1-Yr 3-Yr 5-Yr
100%
AUM above benchmark 1st quartile 2nd quartile
U.K. Canadian Asian European
U.S. Core U.S. Growth U.S. Value Sector
40% 36%
9%
27% 40%
27% 36%
53%
91%
52%
46%
98% 99%
7% 19%
100%
2% 6%
70%
1%
26% 6%
6%
6%
32% 38%
73% 4%
17%
21%
8% 26%
7%
37%
49% 91%
47%
11%
39%
27% 20% 19%
51% 63% 68%
3% 6% 16% 14% 14%
23
* Excludes passive products, closed-end funds, private equity limited partnerships, non-discretionary funds, unit investment trusts, fund of funds with component funds managed by Invesco, stable value building block funds and CDOs. Certain funds and products were excluded from the analysis because of limited benchmark or peer group data. Had these been available, results may have been different. These results are preliminary and subject to revision.
AUM measured in the one, three, and five year quartile rankings represents 56%, 56%, and 53% of total Invesco AUM, respectively, and AUM measured versus benchmark on a one, three, and five year basis represents 70%, 67%, and 62% of total Invesco AUM as of 12/31/17. Peer group rankings are sourced from a widely-used third party ranking agency in each fund’s market (Lipper, Morningstar, IA, Russell, Mercer, eVestment Alliance, SITCA, Value Research) and asset-weighted in USD. Rankings are as of prior quarter-end for most institutional products and prior month-end for Australian retail funds due to their late release by third parties. Rankings for the most representative fund in each GIPS composite are applied to all products within each GIPS composite. Performance assumes the reinvestment of dividends. Past performance is not indicative of future results and may not reflect an investor’s experience.
42% 41%
17%
47%
11% 11%
32%
9% 13%
56%
71% 62%
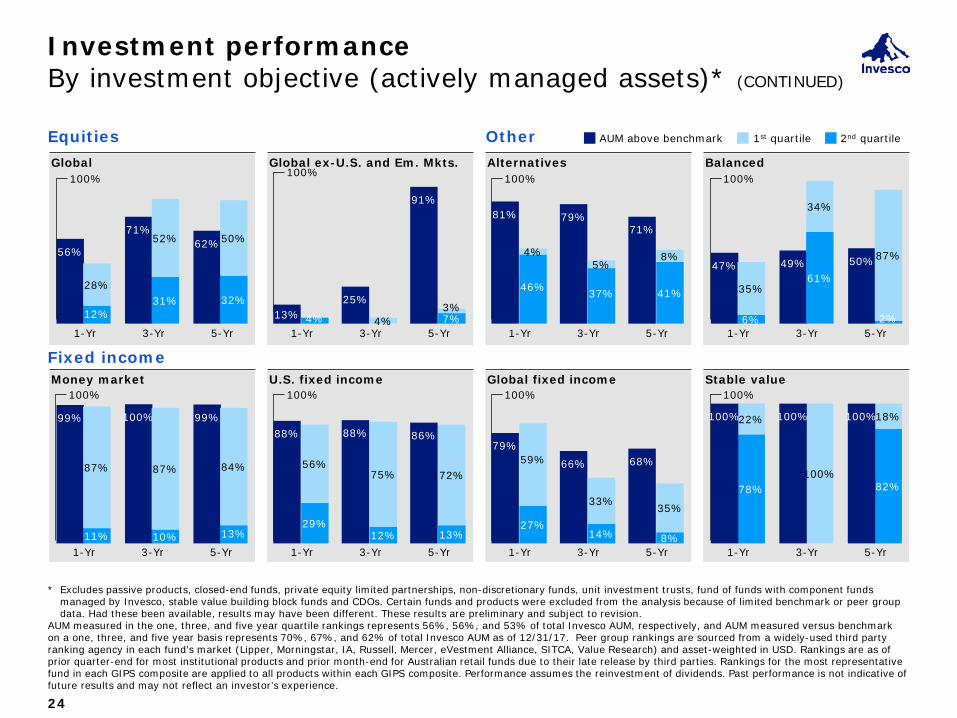
Investment performance By investment objective (actively managed assets)* (CONTINUED)
Equities
1-Yr 3-Yr 5-Yr
100%
1-Yr 3-Yr 5-Yr
100%
1-Yr 3-Yr 5-Yr
100%
1-Yr 3-Yr 5-Yr
100%
AUM above benchmark 1st quartile 2nd quartile Other
Fixed income
Global Global ex-U.S. and Em. Mkts. Alternatives Balanced
Money market U.S. fixed income Global fixed income
13% 25%
91%
Stable value
12% 31% 32%
28%
52% 50%
81% 79% 71%
46% 37% 41%
4% 5%
8% 47% 49% 50%
6%
61%
2%
35%
34%
87%
99% 100% 99%
11% 10% 13%
87% 87% 84%
1-Yr 3-Yr 5-Yr
100%
1-Yr 3-Yr 5-Yr
100%
1-Yr 3-Yr 5-Yr
100%
1-Yr 3-Yr 5-Yr
100%
88% 88% 86%
29% 12% 13%
56% 75% 72%
79%
66% 68%
27% 14% 8%
59%
33% 35%
78% 82%
22%
100%
18%
4% 7% 4% 3%
100% 100% 100%
24
* Excludes passive products, closed-end funds, private equity limited partnerships, non-discretionary funds, unit investment trusts, fund of funds with component funds managed by Invesco, stable value building block funds and CDOs. Certain funds and products were excluded from the analysis because of limited benchmark or peer group data. Had these been available, results may have been different. These results are preliminary and subject to revision.
AUM measured in the one, three, and five year quartile rankings represents 56%, 56%, and 53% of total Invesco AUM, respectively, and AUM measured versus benchmark on a one, three, and five year basis represents 70%, 67%, and 62% of total Invesco AUM as of 12/31/17. Peer group rankings are sourced from a widely-used third party ranking agency in each fund’s market (Lipper, Morningstar, IA, Russell, Mercer, eVestment Alliance, SITCA, Value Research) and asset-weighted in USD. Rankings are as of prior quarter-end for most institutional products and prior month-end for Australian retail funds due to their late release by third parties. Rankings for the most representative fund in each GIPS composite are applied to all products within each GIPS composite. Performance assumes the reinvestment of dividends. Past performance is not indicative of future results and may not reflect an investor’s experience.
6
94
36
64
94
6 20
80
98
2
87
13 11
89 71
29
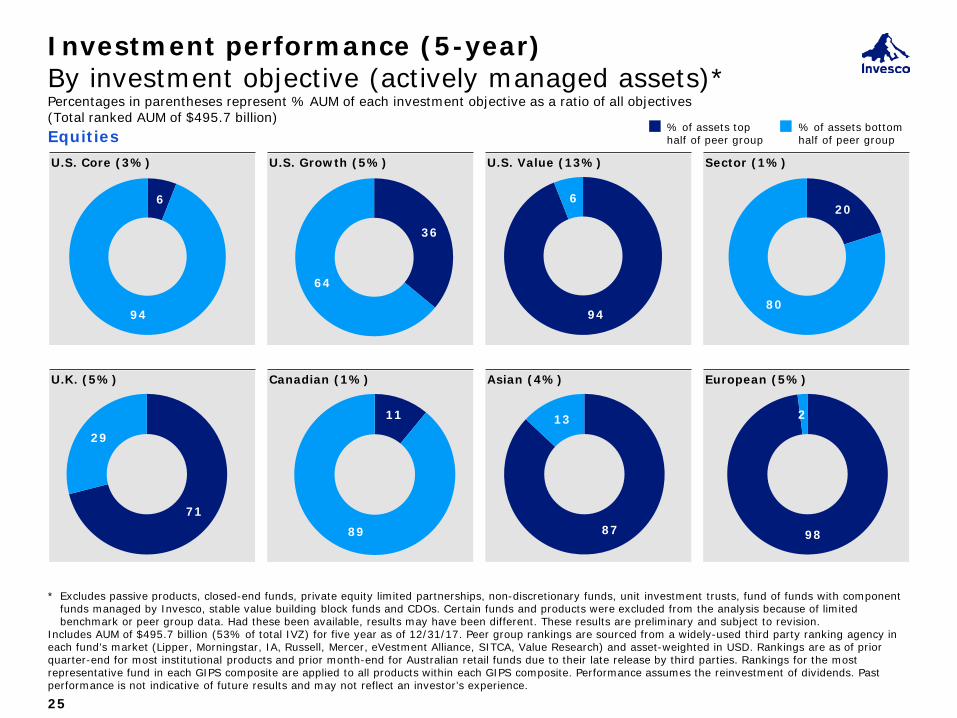
U.S. Core (3%)
Investment performance (5-year) By investment objective (actively managed assets)* Percentages in parentheses represent % AUM of each investment objective as a ratio of all objectives (Total ranked AUM of $495.7 billion)
U.S. Growth (5%) U.S. Value (13%) Sector (1%)
U.K. (5%) Canadian (1%) Asian (4%) European (5%)
Equities % of assets top half of peer group
% of assets bottom half of peer group
25
* Excludes passive products, closed-end funds, private equity limited partnerships, non-discretionary funds, unit investment trusts, fund of funds with component funds managed by Invesco, stable value building block funds and CDOs. Certain funds and products were excluded from the analysis because of limited benchmark or peer group data. Had these been available, results may have been different. These results are preliminary and subject to revision.
Includes AUM of $495.7 billion (53% of total IVZ) for five year as of 12/31/17. Peer group rankings are sourced from a widely-used third party ranking agency in each fund’s market (Lipper, Morningstar, IA, Russell, Mercer, eVestment Alliance, SITCA, Value Research) and asset-weighted in USD. Rankings are as of prior quarter-end for most institutional products and prior month-end for Australian retail funds due to their late release by third parties. Rankings for the most representative fund in each GIPS composite are applied to all products within each GIPS composite. Performance assumes the reinvestment of dividends. Past performance is not indicative of future results and may not reflect an investor’s experience.

85
15
100
43
57
89
11
49 51
10
90 82
18
97
3
Global (4%)
Investment performance (5-year) By investment objective (actively managed assets)* (CONTINUED) Percentages in parentheses represent % AUM of each investment objective as a ratio of all objectives (Total ranked AUM of $495.7 billion)
Global ex-US and Em. Mkts (5%)
Alternatives (7%) Balanced (12%)
Money market (16%) U.S. fixed income (8%) Global fixed income (7%) Stable value (6%)
Equities % of assets top half of peer group
% of assets bottom half of peer group Other
Fixed income
26
* Excludes passive products, closed-end funds, private equity limited partnerships, non-discretionary funds, unit investment trusts, fund of funds with component funds managed by Invesco, stable value building block funds and CDOs. Certain funds and products were excluded from the analysis because of limited benchmark or peer group data. Had these been available, results may have been different. These results are preliminary and subject to revision.
Includes AUM of $495.7 billion (53% of total IVZ) for five year as of 12/31/17. Peer group rankings are sourced from a widely-used third party ranking agency in each fund’s market (Lipper, Morningstar, IA, Russell, Mercer, eVestment Alliance, SITCA, Value Research) and asset-weighted in USD. Rankings are as of prior quarter-end for most institutional products and prior month-end for Australian retail funds due to their late release by third parties. Rankings for the most representative fund in each GIPS composite are applied to all products within each GIPS composite. Performance assumes the reinvestment of dividends. Past performance is not indicative of future results and may not reflect an investor’s experience.
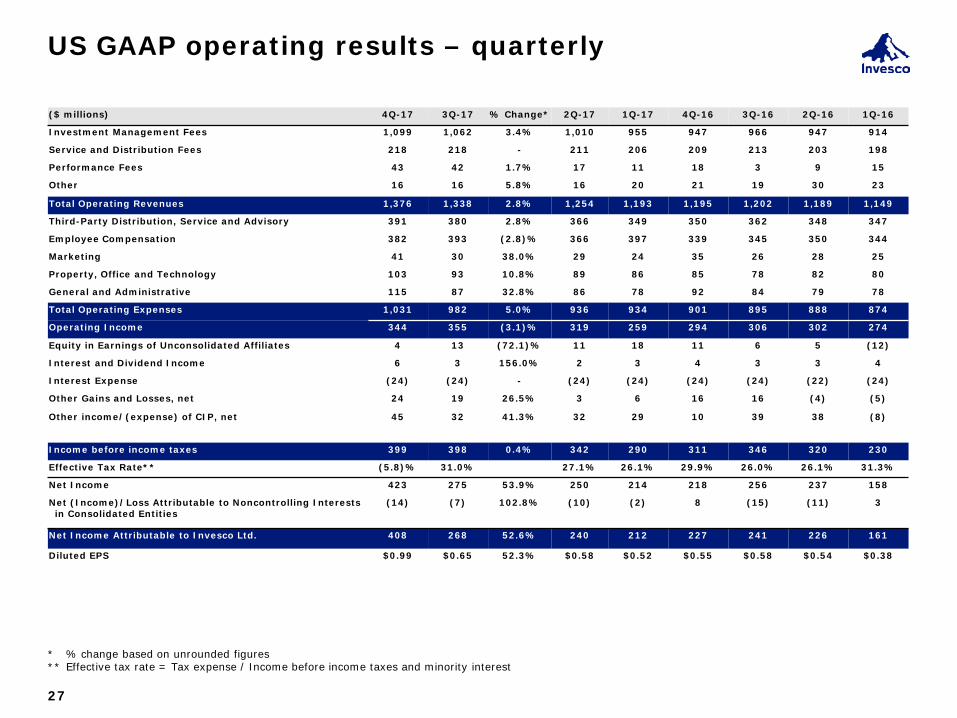
US GAAP operating results – quarterly
* % change based on unrounded figures ** Effective tax rate = Tax expense / Income before income taxes and minority interest
($ millions) 4Q-17 3Q-17 % Change* 2Q-17 1Q-17 4Q-16 3Q-16 2Q-16 1Q-16
Investment Management Fees 1,099 1,062 3.4% 1,010 955 947 966 947 914
Service and Distribution Fees 218 218 - 211 206 209 213 203 198
Performance Fees 43 42 1.7% 17 11 18 3 9 15
Other 16 16 5.8% 16 20 21 19 30 23
Total Operating Revenues 1,376 1,338 2.8% 1,254 1,193 1,195 1,202 1,189 1,149
Third-Party Distribution, Service and Advisory 391 380 2.8% 366 349 350 362 348 347
Employee Compensation 382 393 (2.8)% 366 397 339 345 350 344
Marketing 41 30 38.0% 29 24 35 26 28 25
Property, Office and Technology 103 93 10.8% 89 86 85 78 82 80
General and Administrative 115 87 32.8% 86 78 92 84 79 78
Total Operating Expenses 1,031 982 5.0% 936 934 901 895 888 874
Operating Income 344 355 (3.1)% 319 259 294 306 302 274
Equity in Earnings of Unconsolidated Affiliates 4 13 (72.1)% 11 18 11 6 5 (12)
Interest and Dividend Income 6 3 156.0% 2 3 4 3 3 4
Interest Expense (24) (24) - (24) (24) (24) (24) (22) (24)
Other Gains and Losses, net 24 19 26.5% 3 6 16 16 (4) (5)
Other income/(expense) of CIP, net 45 32 41.3% 32 29 10 39 38 (8)
Income before income taxes 399 398 0.4% 342 290 311 346 320 230
Effective Tax Rate** (5.8)% 31.0% 27.1% 26.1% 29.9% 26.0% 26.1% 31.3%
Net Income 423 275 53.9% 250 214 218 256 237 158
Net (Income)/Loss Attributable to Noncontrolling Interests in Consolidated Entities
(14) (7) 102.8% (10) (2) 8 (15) (11) 3
Net Income Attributable to Invesco Ltd. 408 268 52.6% 240 212 227 241 226 161
Diluted EPS $0.99 $0.65 52.3% $0.58 $0.52 $0.55 $0.58 $0.54 $0.38
27
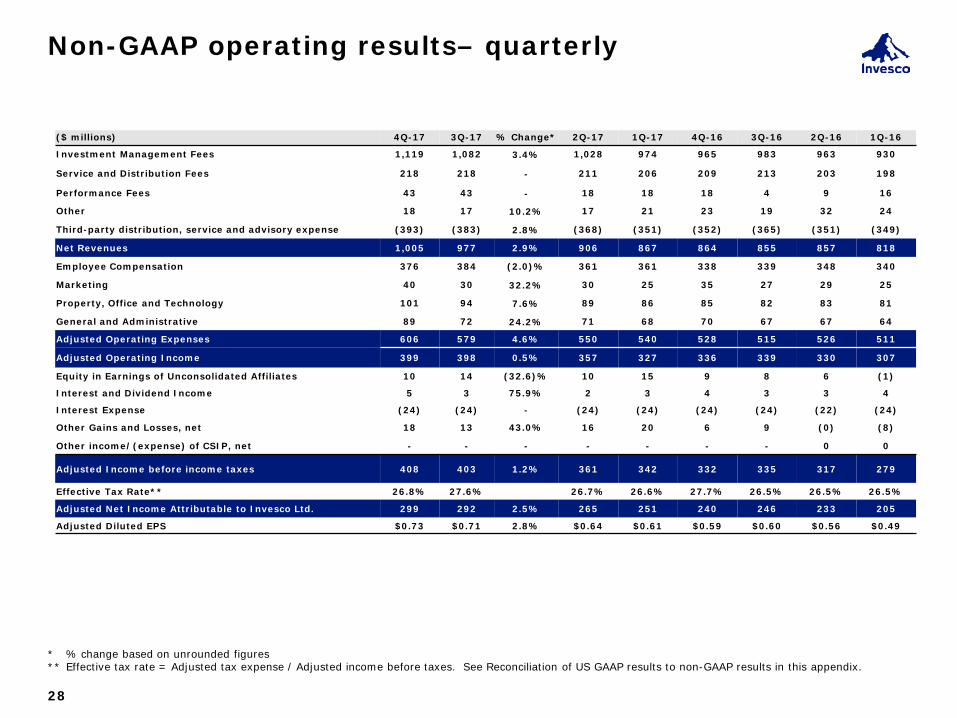
Non-GAAP operating results– quarterly
* % change based on unrounded figures ** Effective tax rate = Adjusted tax expense / Adjusted income before taxes. See Reconciliation of US GAAP results to non-GAAP results in this appendix.
($ millions) 4Q-17 3Q-17 % Change* 2Q-17 1Q-17 4Q-16 3Q-16 2Q-16 1Q-16
Investment Management Fees 1,119 1,082 3.4% 1,028 974 965 983 963 930
Service and Distribution Fees 218 218 - 211 206 209 213 203 198
Performance Fees 43 43 - 18 18 18 4 9 16
Other 18 17 10.2% 17 21 23 19 32 24
Third-party distribution, service and advisory expense (393) (383) 2.8% (368) (351) (352) (365) (351) (349)
Net Revenues 1,005 977 2.9% 906 867 864 855 857 818
Employee Compensation 376 384 (2.0)% 361 361 338 339 348 340
Marketing 40 30 32.2% 30 25 35 27 29 25
Property, Office and Technology 101 94 7.6% 89 86 85 82 83 81
General and Administrative 89 72 24.2% 71 68 70 67 67 64
Adjusted Operating Expenses 606 579 4.6% 550 540 528 515 526 511
Adjusted Operating Income 399 398 0.5% 357 327 336 339 330 307
Equity in Earnings of Unconsolidated Affiliates 10 14 (32.6)% 10 15 9 8 6 (1)
Interest and Dividend Income 5 3 75.9% 2 3 4 3 3 4
Interest Expense (24) (24) - (24) (24) (24) (24) (22) (24)
Other Gains and Losses, net 18 13 43.0% 16 20 6 9 (0) (8)
Other income/(expense) of CSIP, net - - - - - - - 0 0
Adjusted Income before income taxes 408 403 1.2% 361 342 332 335 317 279
Effective Tax Rate** 26.8% 27.6% 26.7% 26.6% 27.7% 26.5% 26.5% 26.5%
Adjusted Net Income Attributable to Invesco Ltd. 299 292 2.5% 265 251 240 246 233 205
Adjusted Diluted EPS $0.73 $0.71 2.8% $0.64 $0.61 $0.59 $0.60 $0.56 $0.49
28
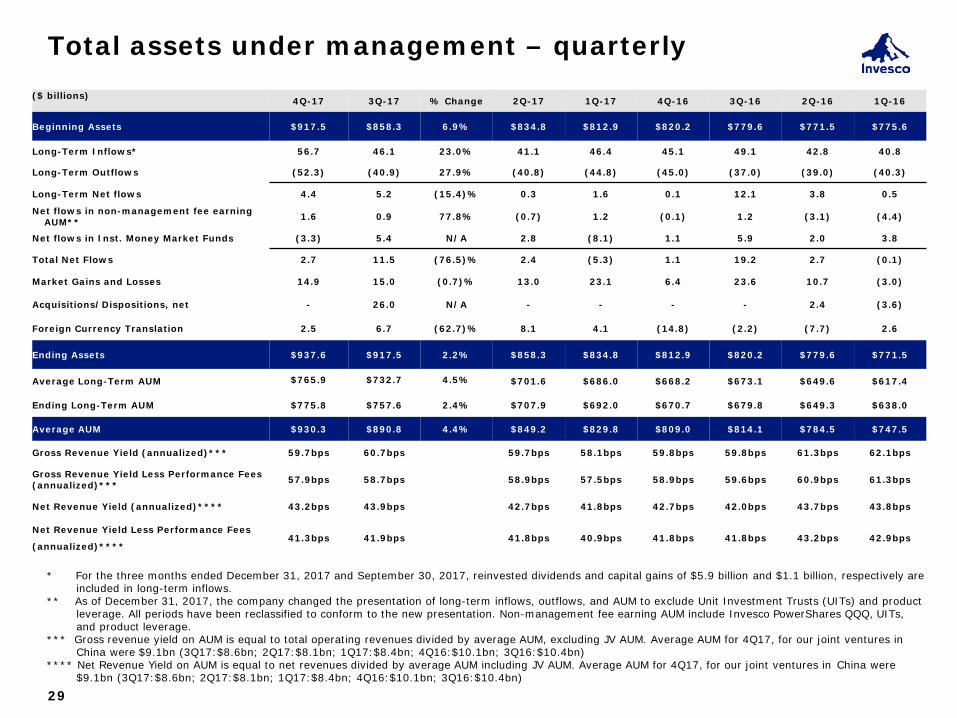
Total assets under management – quarterly
* For the three months ended December 31, 2017 and September 30, 2017, reinvested dividends and capital gains of $5.9 billion and $1.1 billion, respectively are included in long-term inflows. ** As of December 31, 2017, the company changed the presentation of long-term inflows, outflows, and AUM to exclude Unit Investment Trusts (UITs) and product leverage. All periods have been reclassified to conform to the new presentation. Non-management fee earning AUM include Invesco PowerShares QQQ, UITs, and product leverage. *** Gross revenue yield on AUM is equal to total operating revenues divided by average AUM, excluding JV AUM. Average AUM for 4Q17, for our joint ventures in China were $9.1bn (3Q17:$8.6bn; 2Q17:$8.1bn; 1Q17:$8.4bn; 4Q16:$10.1bn; 3Q16:$10.4bn) **** Net Revenue Yield on AUM is equal to net revenues divided by average AUM including JV AUM. Average AUM for 4Q17, for our joint ventures in China were $9.1bn (3Q17:$8.6bn; 2Q17:$8.1bn; 1Q17:$8.4bn; 4Q16:$10.1bn; 3Q16:$10.4bn)
($ billions) 4Q-17 3Q-17 % Change 2Q-17 1Q-17 4Q-16 3Q-16 2Q-16 1Q-16
Beginning Assets $917.5 $858.3 6.9% $834.8 $812.9 $820.2 $779.6 $771.5 $775.6
Long-Term Inflows* 56.7 46.1 23.0% 41.1 46.4 45.1 49.1 42.8 40.8
Long-Term Outflows (52.3) (40.9) 27.9% (40.8) (44.8) (45.0) (37.0) (39.0) (40.3)
Long-Term Net flows 4.4 5.2 (15.4)% 0.3 1.6 0.1 12.1 3.8 0.5
Net flows in non-management fee earning AUM** 1.6 0.9 77.8% (0.7) 1.2 (0.1) 1.2 (3.1) (4.4)
Net flows in Inst. Money Market Funds (3.3) 5.4 N/A 2.8 (8.1) 1.1 5.9 2.0 3.8
Total Net Flows 2.7 11.5 (76.5)% 2.4 (5.3) 1.1 19.2 2.7 (0.1)
Market Gains and Losses 14.9 15.0 (0.7)% 13.0 23.1 6.4 23.6 10.7 (3.0)
Acquisitions/Dispositions, net - 26.0 N/A - - - - 2.4 (3.6)
Foreign Currency Translation 2.5 6.7 (62.7)% 8.1 4.1 (14.8) (2.2) (7.7) 2.6
Ending Assets $937.6 $917.5 2.2% $858.3 $834.8 $812.9 $820.2 $779.6 $771.5
Average Long-Term AUM $765.9 $732.7 4.5% $701.6 $686.0 $668.2 $673.1 $649.6 $617.4
Ending Long-Term AUM $775.8 $757.6 2.4% $707.9 $692.0 $670.7 $679.8 $649.3 $638.0
Average AUM $930.3 $890.8 4.4% $849.2 $829.8 $809.0 $814.1 $784.5 $747.5
Gross Revenue Yield (annualized)*** 59.7bps 60.7bps 59.7bps 58.1bps 59.8bps 59.8bps 61.3bps 62.1bps
Gross Revenue Yield Less Performance Fees (annualized)*** 57.9bps 58.7bps 58.9bps 57.5bps 58.9bps 59.6bps 60.9bps 61.3bps
Net Revenue Yield (annualized)**** 43.2bps 43.9bps 42.7bps 41.8bps 42.7bps 42.0bps 43.7bps 43.8bps
Net Revenue Yield Less Performance Fees
(annualized)**** 41.3bps 41.9bps 41.8bps 40.9bps 41.8bps 41.8bps 43.2bps 42.9bps
29
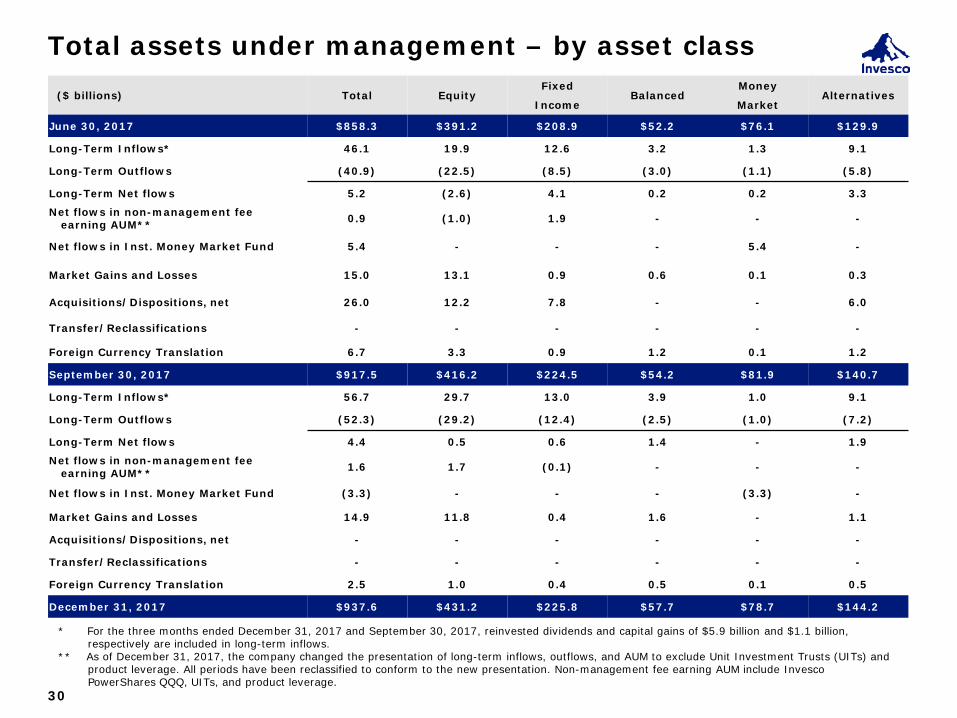
Total assets under management – by asset class
30
($ billions) Total Equity Fixed
Income Balanced
Money
Market Alternatives
June 30, 2017 $858.3 $391.2 $208.9 $52.2 $76.1 $129.9
Long-Term Inflows* 46.1 19.9 12.6 3.2 1.3 9.1
Long-Term Outflows (40.9) (22.5) (8.5) (3.0) (1.1) (5.8)
Long-Term Net flows 5.2 (2.6) 4.1 0.2 0.2 3.3
Net flows in non-management fee earning AUM** 0.9 (1.0) 1.9 - - -
Net flows in Inst. Money Market Fund 5.4 - - - 5.4 -
Market Gains and Losses 15.0 13.1 0.9 0.6 0.1 0.3
Acquisitions/Dispositions, net 26.0 12.2 7.8 - - 6.0
Transfer/Reclassifications - - - - - -
Foreign Currency Translation 6.7 3.3 0.9 1.2 0.1 1.2
September 30, 2017 $917.5 $416.2 $224.5 $54.2 $81.9 $140.7
Long-Term Inflows* 56.7 29.7 13.0 3.9 1.0 9.1
Long-Term Outflows (52.3) (29.2) (12.4) (2.5) (1.0) (7.2)
Long-Term Net flows 4.4 0.5 0.6 1.4 - 1.9
Net flows in non-management fee earning AUM** 1.6 1.7 (0.1) - - -
Net flows in Inst. Money Market Fund (3.3) - - - (3.3) -
Market Gains and Losses 14.9 11.8 0.4 1.6 - 1.1
Acquisitions/Dispositions, net - - - - - -
Transfer/Reclassifications - - - - - -
Foreign Currency Translation 2.5 1.0 0.4 0.5 0.1 0.5
December 31, 2017 $937.6 $431.2 $225.8 $57.7 $78.7 $144.2
* For the three months ended December 31, 2017 and September 30, 2017, reinvested dividends and capital gains of $5.9 billion and $1.1 billion, respectively are included in long-term inflows. ** As of December 31, 2017, the company changed the presentation of long-term inflows, outflows, and AUM to exclude Unit Investment Trusts (UITs) and product leverage. All periods have been reclassified to conform to the new presentation. Non-management fee earning AUM include Invesco PowerShares QQQ, UITs, and product leverage.

Total assets under management – by asset class
31
($ billions) Total Equity Fixed
Income Balanced
Money
Market Alternatives
December 31, 2016 $812.9 $364.1 $201.7 $46.8 $78.3 $122.0
Long-Term Inflows 46.4 20.3 11.2 2.7 0.8 11.4
Long-Term Outflows (44.8) (24.6) (9.6) (2.2) (0.9) (7.5)
Long-Term Net flows 1.6 (4.3) 1.6 0.5 (0.1) 3.9
Net flows in non-management fee earning AUM 1.2 0.3 0.9 - - -
Net flows in Inst. Money Market Fund (8.1) - - - (8.1) -
Market Gains and Losses 23.1 20.2 1.7 1.3 - (0.1)
Acquisitions/Dispositions, net - - - - - -
Transfers/Reclassifications - - (3.0) - 3.0 -
Foreign Currency Translation 4.1 1.5 0.9 0.3 - 1.4
March 31, 2017 $834.8 $381.8 $203.8 $48.9 $73.1 $127.2
Long-Term Inflows 41.1 18.0 10.7 3.6 1.0 7.8
Long-Term Outflows (40.8) (22.9) (8.4) (2.1) (0.9) (6.5)
Long-Term Net flows 0.3 (4.9) 2.3 1.5 0.1 1.3
Net flows in non-management fee earning AUM (0.7) (0.5) (0.2) - - -
Net flows in Inst. Money Market Fund 2.8 - - - 2.8 -
Market Gains and Losses 13.0 10.9 2.0 0.2 - (0.1)
Acquisitions/Dispositions, net - - - - - -
Transfer/Reclassifications - - - - - -
Foreign Currency Translation 8.1 3.9 1.0 1.6 0.1 1.5
June 30, 2017 $858.3 $391.2 $208.9 $52.2 $76.1 $129.9
As of December 31, 2017, the company changed the presentation of long-term inflows, outflows, and AUM to exclude Unit Investment Trusts (UITs) and product leverage. All periods have been reclassified to conform to the new presentation. Non-management fee earning AUM include Invesco PowerShares QQQ, UITs, and product leverage.

Total assets under management – by channel
32
($ billions) Total Retail Institutional
June 30, 2017 $858.3 $572.4 $285.9
Long-Term Inflows* 46.1 36.9 9.2
Long-Term Outflows (40.9) (33.0) (7.9)
Long-Term Net flows 5.2 3.9 1.3
Net flows in non-management fee earning AUM** 0.9 (1.0) 1.9
Net flows in Inst. Money Market Funds 5.4 - 5.4
Market Gains and Losses 15.0 14.5 0.5
Acquisitions/Dispositions, net 26.0 26.0 -
Transfer/Reclassifications - - -
Foreign Currency Translation 6.7 5.7 1.0
September 30, 2017 $917.5 $621.5 $296.0
Long-Term Inflows* 56.7 48.3 8.4
Long-Term Outflows (52.3) (44.7) (7.6)
Long-Term Net flows 4.4 3.6 0.8
Net flows in non-management fee earning AUM** 1.6 1.6 -
Net flows in Inst. Money Market Funds (3.3) (3.2) (0.1)
Market Gains and Losses 14.9 11.6 3.3
Acquisitions/Dispositions, net - - -
Transfer/Reclassifications - - -
Foreign Currency Translation 2.5 1.9 0.6
December 31, 2017 $937.6 $637.0 $300.6
* For the three months ended December 31, 2017 and September 30, 2017, reinvested dividends and capital gains of $5.9 billion and $1.1 billion, respectively are included in long-term inflows. ** As of December 31, 2017, the company changed the presentation of long-term inflows, outflows, and AUM to exclude Unit Investment Trusts (UITs) and product leverage. All periods have been reclassified to conform to the new presentation. Non-management fee earning AUM include Invesco PowerShares QQQ, UITs, and product leverage.
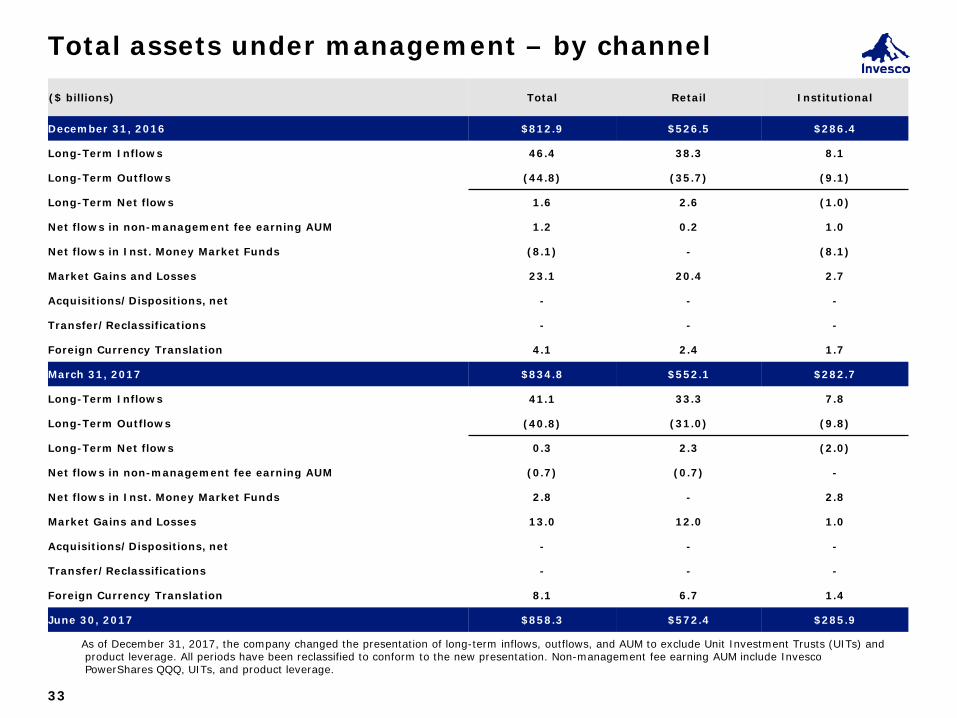
Total assets under management – by channel
33
($ billions) Total Retail Institutional
December 31, 2016 $812.9 $526.5 $286.4
Long-Term Inflows 46.4 38.3 8.1
Long-Term Outflows (44.8) (35.7) (9.1)
Long-Term Net flows 1.6 2.6 (1.0)
Net flows in non-management fee earning AUM 1.2 0.2 1.0
Net flows in Inst. Money Market Funds (8.1) - (8.1)
Market Gains and Losses 23.1 20.4 2.7
Acquisitions/Dispositions, net - - -
Transfer/Reclassifications - - -
Foreign Currency Translation 4.1 2.4 1.7
March 31, 2017 $834.8 $552.1 $282.7
Long-Term Inflows 41.1 33.3 7.8
Long-Term Outflows (40.8) (31.0) (9.8)
Long-Term Net flows 0.3 2.3 (2.0)
Net flows in non-management fee earning AUM (0.7) (0.7) -
Net flows in Inst. Money Market Funds 2.8 - 2.8
Market Gains and Losses 13.0 12.0 1.0
Acquisitions/Dispositions, net - - -
Transfer/Reclassifications - - -
Foreign Currency Translation 8.1 6.7 1.4
June 30, 2017 $858.3 $572.4 $285.9
As of December 31, 2017, the company changed the presentation of long-term inflows, outflows, and AUM to exclude Unit Investment Trusts (UITs) and product leverage. All periods have been reclassified to conform to the new presentation. Non-management fee earning AUM include Invesco PowerShares QQQ, UITs, and product leverage.
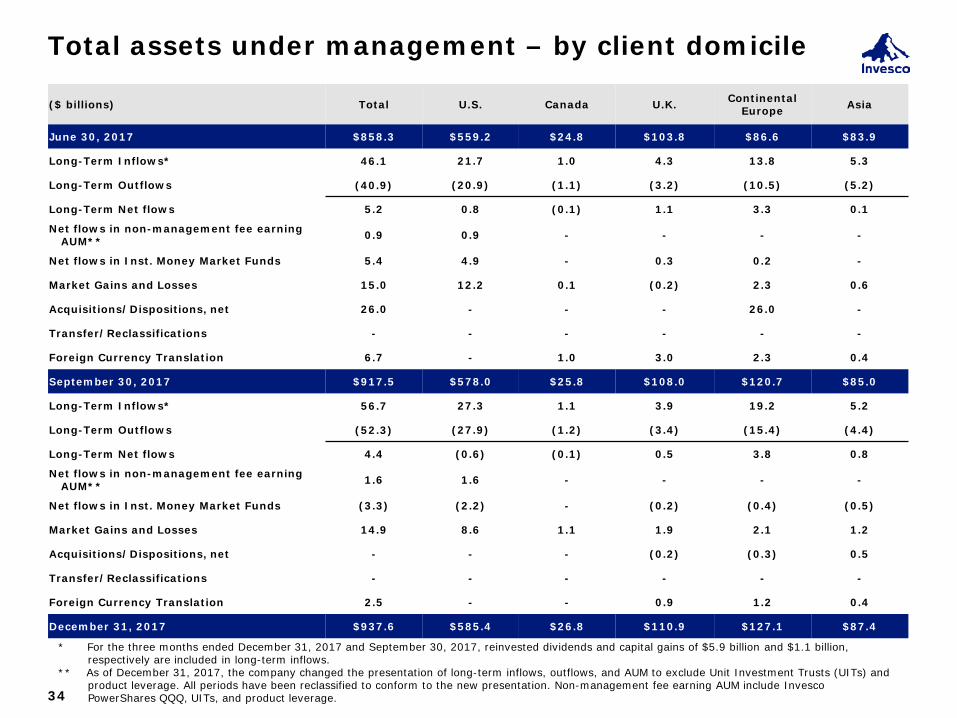
Total assets under management – by client domicile
34
($ billions) Total U.S. Canada U.K. Continental Europe Asia
June 30, 2017 $858.3 $559.2 $24.8 $103.8 $86.6 $83.9
Long-Term Inflows* 46.1 21.7 1.0 4.3 13.8 5.3
Long-Term Outflows (40.9) (20.9) (1.1) (3.2) (10.5) (5.2)
Long-Term Net flows 5.2 0.8 (0.1) 1.1 3.3 0.1
Net flows in non-management fee earning AUM** 0.9 0.9 - - - -
Net flows in Inst. Money Market Funds 5.4 4.9 - 0.3 0.2 -
Market Gains and Losses 15.0 12.2 0.1 (0.2) 2.3 0.6
Acquisitions/Dispositions, net 26.0 - - - 26.0 -
Transfer/Reclassifications - - - - - -
Foreign Currency Translation 6.7 - 1.0 3.0 2.3 0.4
September 30, 2017 $917.5 $578.0 $25.8 $108.0 $120.7 $85.0
Long-Term Inflows* 56.7 27.3 1.1 3.9 19.2 5.2
Long-Term Outflows (52.3) (27.9) (1.2) (3.4) (15.4) (4.4)
Long-Term Net flows 4.4 (0.6) (0.1) 0.5 3.8 0.8
Net flows in non-management fee earning AUM** 1.6 1.6 - - - -
Net flows in Inst. Money Market Funds (3.3) (2.2) - (0.2) (0.4) (0.5)
Market Gains and Losses 14.9 8.6 1.1 1.9 2.1 1.2
Acquisitions/Dispositions, net - - - (0.2) (0.3) 0.5
Transfer/Reclassifications - - - - - -
Foreign Currency Translation 2.5 - - 0.9 1.2 0.4
December 31, 2017 $937.6 $585.4 $26.8 $110.9 $127.1 $87.4
* For the three months ended December 31, 2017 and September 30, 2017, reinvested dividends and capital gains of $5.9 billion and $1.1 billion, respectively are included in long-term inflows. ** As of December 31, 2017, the company changed the presentation of long-term inflows, outflows, and AUM to exclude Unit Investment Trusts (UITs) and product leverage. All periods have been reclassified to conform to the new presentation. Non-management fee earning AUM include Invesco PowerShares QQQ, UITs, and product leverage.
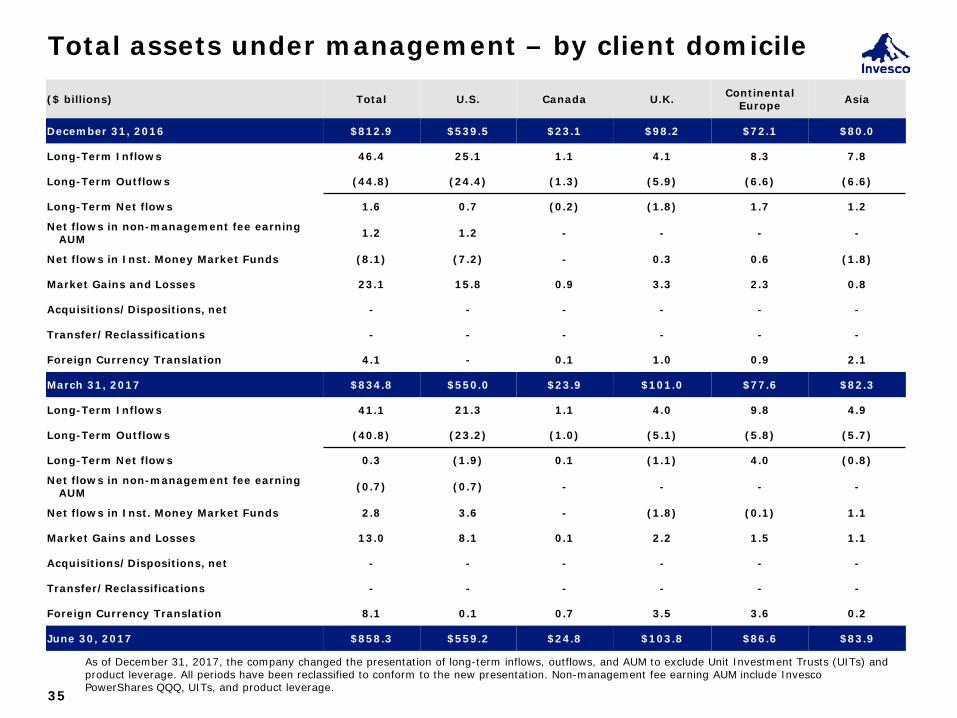
Total assets under management – by client domicile
35
($ billions) Total U.S. Canada U.K. Continental Europe Asia
December 31, 2016 $812.9 $539.5 $23.1 $98.2 $72.1 $80.0
Long-Term Inflows 46.4 25.1 1.1 4.1 8.3 7.8
Long-Term Outflows (44.8) (24.4) (1.3) (5.9) (6.6) (6.6)
Long-Term Net flows 1.6 0.7 (0.2) (1.8) 1.7 1.2
Net flows in non-management fee earning AUM 1.2 1.2 - - - -
Net flows in Inst. Money Market Funds (8.1) (7.2) - 0.3 0.6 (1.8)
Market Gains and Losses 23.1 15.8 0.9 3.3 2.3 0.8
Acquisitions/Dispositions, net - - - - - -
Transfer/Reclassifications - - - - - -
Foreign Currency Translation 4.1 - 0.1 1.0 0.9 2.1
March 31, 2017 $834.8 $550.0 $23.9 $101.0 $77.6 $82.3
Long-Term Inflows 41.1 21.3 1.1 4.0 9.8 4.9
Long-Term Outflows (40.8) (23.2) (1.0) (5.1) (5.8) (5.7)
Long-Term Net flows 0.3 (1.9) 0.1 (1.1) 4.0 (0.8)
Net flows in non-management fee earning AUM (0.7) (0.7) - - - -
Net flows in Inst. Money Market Funds 2.8 3.6 - (1.8) (0.1) 1.1
Market Gains and Losses 13.0 8.1 0.1 2.2 1.5 1.1
Acquisitions/Dispositions, net - - - - - -
Transfer/Reclassifications - - - - - -
Foreign Currency Translation 8.1 0.1 0.7 3.5 3.6 0.2
June 30, 2017 $858.3 $559.2 $24.8 $103.8 $86.6 $83.9
As of December 31, 2017, the company changed the presentation of long-term inflows, outflows, and AUM to exclude Unit Investment Trusts (UITs) and product leverage. All periods have been reclassified to conform to the new presentation. Non-management fee earning AUM include Invesco PowerShares QQQ, UITs, and product leverage.
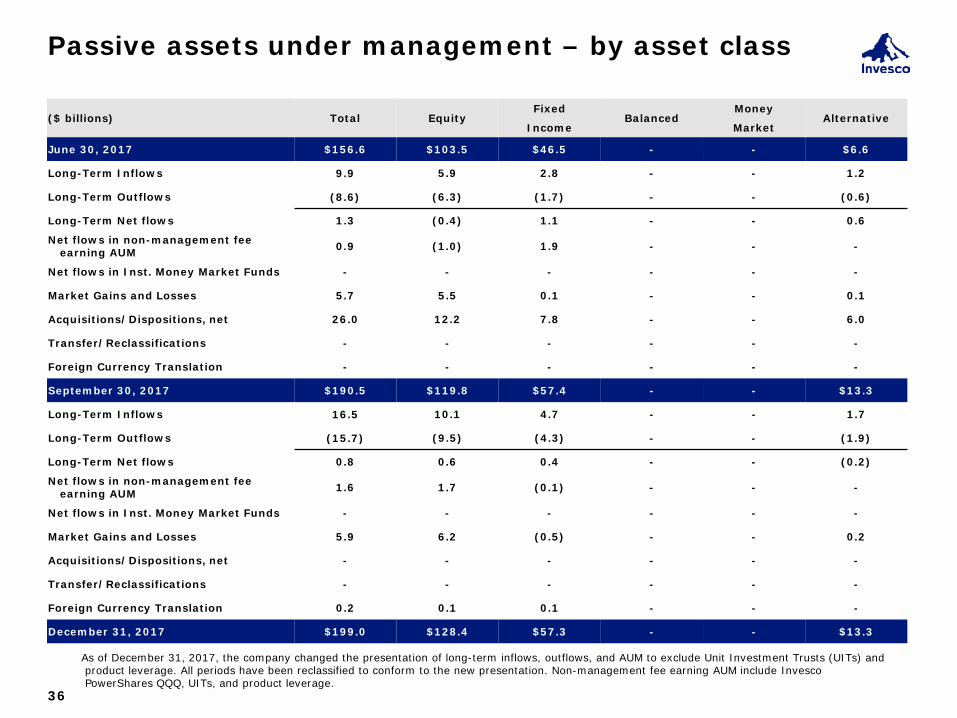
36
($ billions) Total Equity Fixed
Income Balanced
Money
Market Alternative
June 30, 2017 $156.6 $103.5 $46.5 - - $6.6
Long-Term Inflows 9.9 5.9 2.8 - - 1.2
Long-Term Outflows (8.6) (6.3) (1.7) - - (0.6)
Long-Term Net flows 1.3 (0.4) 1.1 - - 0.6
Net flows in non-management fee earning AUM 0.9 (1.0) 1.9 - - -
Net flows in Inst. Money Market Funds - - - - - -
Market Gains and Losses 5.7 5.5 0.1 - - 0.1
Acquisitions/Dispositions, net 26.0 12.2 7.8 - - 6.0
Transfer/Reclassifications - - - - - -
Foreign Currency Translation - - - - - -
September 30, 2017 $190.5 $119.8 $57.4 - - $13.3
Long-Term Inflows 16.5 10.1 4.7 - - 1.7
Long-Term Outflows (15.7) (9.5) (4.3) - - (1.9)
Long-Term Net flows 0.8 0.6 0.4 - - (0.2)
Net flows in non-management fee earning AUM 1.6 1.7 (0.1) - - -
Net flows in Inst. Money Market Funds - - - - - -
Market Gains and Losses 5.9 6.2 (0.5) - - 0.2
Acquisitions/Dispositions, net - - - - - -
Transfer/Reclassifications - - - - - -
Foreign Currency Translation 0.2 0.1 0.1 - - -
December 31, 2017 $199.0 $128.4 $57.3 - - $13.3
Passive assets under management – by asset class
As of December 31, 2017, the company changed the presentation of long-term inflows, outflows, and AUM to exclude Unit Investment Trusts (UITs) and product leverage. All periods have been reclassified to conform to the new presentation. Non-management fee earning AUM include Invesco PowerShares QQQ, UITs, and product leverage.
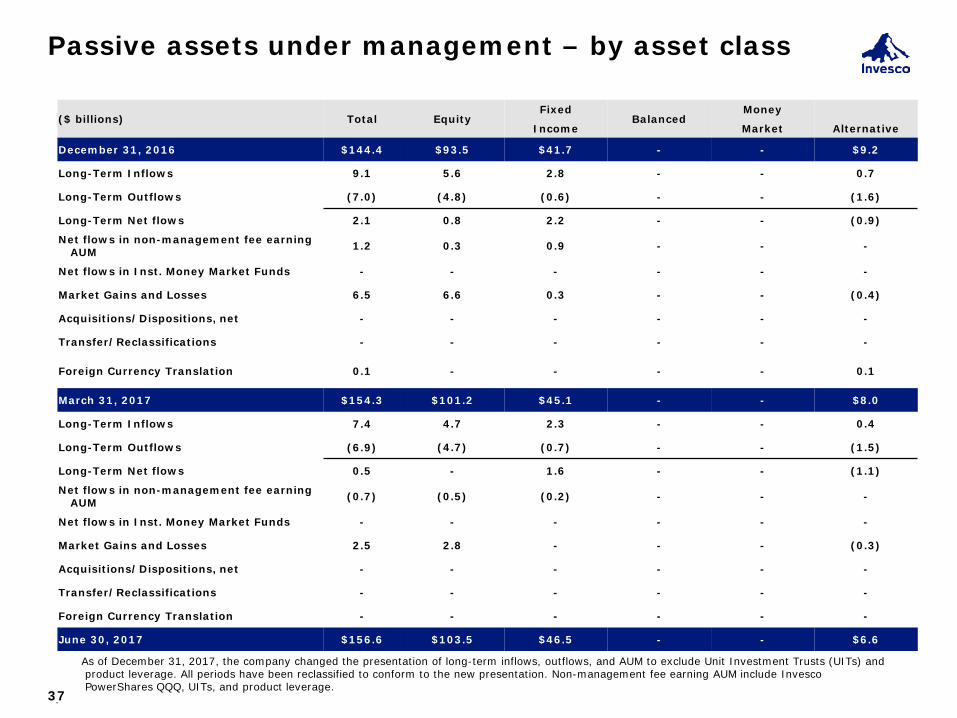
Passive assets under management – by asset class
37
($ billions) Total Equity Fixed
Income Balanced
Money
Market
Alternative
December 31, 2016 $144.4 $93.5 $41.7 - - $9.2
Long-Term Inflows 9.1 5.6 2.8 - - 0.7
Long-Term Outflows (7.0) (4.8) (0.6) - - (1.6)
Long-Term Net flows 2.1 0.8 2.2 - - (0.9)
Net flows in non-management fee earning AUM 1.2 0.3 0.9 - - -
Net flows in Inst. Money Market Funds - - - - - -
Market Gains and Losses 6.5 6.6 0.3 - - (0.4)
Acquisitions/Dispositions, net - - - - - -
Transfer/Reclassifications - - - - - -
Foreign Currency Translation 0.1 - - - - 0.1
March 31, 2017 $154.3 $101.2 $45.1 - - $8.0
Long-Term Inflows 7.4 4.7 2.3 - - 0.4
Long-Term Outflows (6.9) (4.7) (0.7) - - (1.5)
Long-Term Net flows 0.5 - 1.6 - - (1.1)
Net flows in non-management fee earning AUM (0.7) (0.5) (0.2) - - -
Net flows in Inst. Money Market Funds - - - - - -
Market Gains and Losses 2.5 2.8 - - - (0.3)
Acquisitions/Dispositions, net - - - - - -
Transfer/Reclassifications - - - - - -
Foreign Currency Translation - - - - - -
June 30, 2017 $156.6 $103.5 $46.5 - - $6.6
As of December 31, 2017, the company changed the presentation of long-term inflows, outflows, and AUM to exclude Unit Investment Trusts (UITs) and product leverage. All periods have been reclassified to conform to the new presentation. Non-management fee earning AUM include Invesco PowerShares QQQ, UITs, and product leverage. .
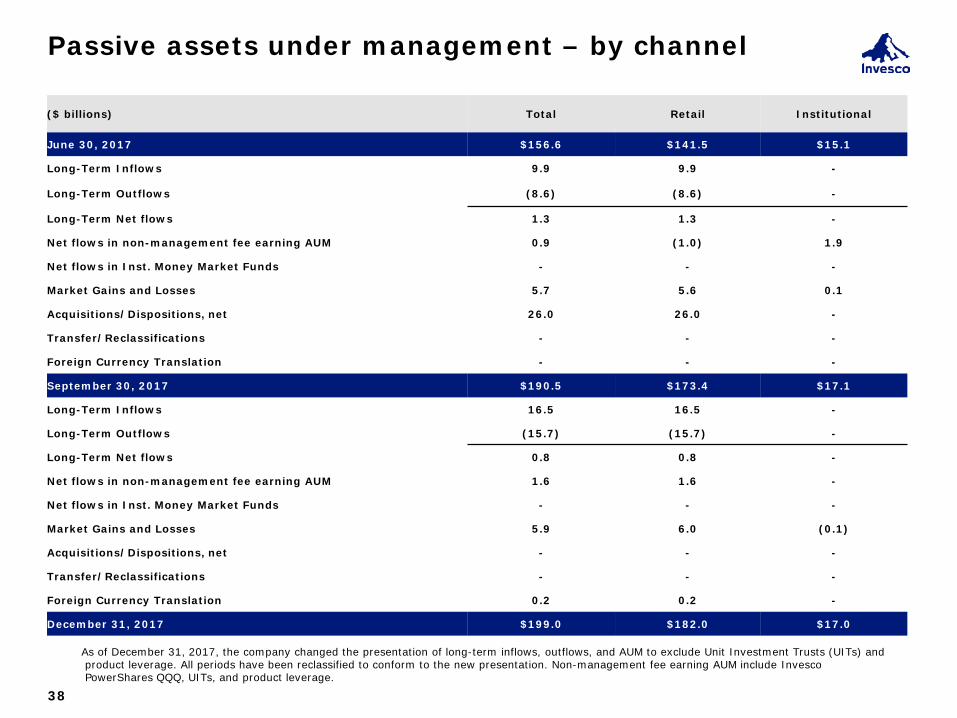
Passive assets under management – by channel
38
($ billions) Total Retail Institutional
June 30, 2017 $156.6 $141.5 $15.1
Long-Term Inflows 9.9 9.9 -
Long-Term Outflows (8.6) (8.6) -
Long-Term Net flows 1.3 1.3 -
Net flows in non-management fee earning AUM 0.9 (1.0) 1.9
Net flows in Inst. Money Market Funds - - -
Market Gains and Losses 5.7 5.6 0.1
Acquisitions/Dispositions, net 26.0 26.0 -
Transfer/Reclassifications - - -
Foreign Currency Translation - - -
September 30, 2017 $190.5 $173.4 $17.1
Long-Term Inflows 16.5 16.5 -
Long-Term Outflows (15.7) (15.7) -
Long-Term Net flows 0.8 0.8 -
Net flows in non-management fee earning AUM 1.6 1.6 -
Net flows in Inst. Money Market Funds - - -
Market Gains and Losses 5.9 6.0 (0.1)
Acquisitions/Dispositions, net - - -
Transfer/Reclassifications - - -
Foreign Currency Translation 0.2 0.2 -
December 31, 2017 $199.0 $182.0 $17.0
As of December 31, 2017, the company changed the presentation of long-term inflows, outflows, and AUM to exclude Unit Investment Trusts (UITs) and product leverage. All periods have been reclassified to conform to the new presentation. Non-management fee earning AUM include Invesco PowerShares QQQ, UITs, and product leverage.
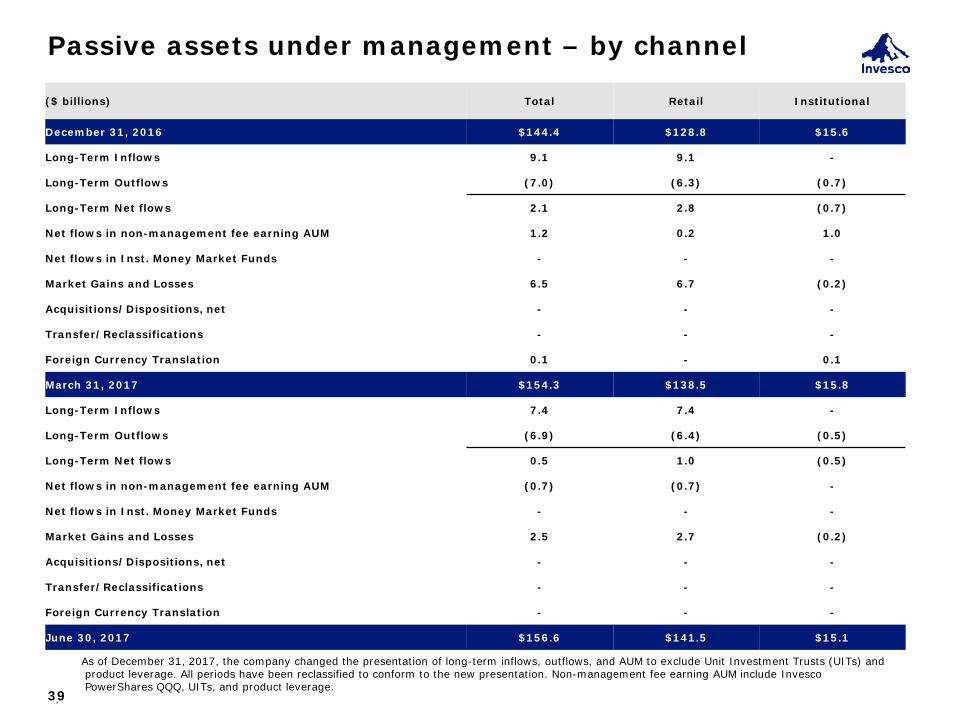
39
($ billions) Total Retail Institutional
December 31, 2016 $144.4 $128.8 $15.6
Long-Term Inflows 9.1 9.1 -
Long-Term Outflows (7.0) (6.3) (0.7)
Long-Term Net flows 2.1 2.8 (0.7)
Net flows in non-management fee earning AUM 1.2 0.2 1.0
Net flows in Inst. Money Market Funds - - -
Market Gains and Losses 6.5 6.7 (0.2)
Acquisitions/Dispositions, net - - -
Transfer/Reclassifications - - -
Foreign Currency Translation 0.1 - 0.1
March 31, 2017 $154.3 $138.5 $15.8
Long-Term Inflows 7.4 7.4 -
Long-Term Outflows (6.9) (6.4) (0.5)
Long-Term Net flows 0.5 1.0 (0.5)
Net flows in non-management fee earning AUM (0.7) (0.7) -
Net flows in Inst. Money Market Funds - - -
Market Gains and Losses 2.5 2.7 (0.2)
Acquisitions/Dispositions, net - - -
Transfer/Reclassifications - - -
Foreign Currency Translation - - -
June 30, 2017 $156.6 $141.5 $15.1
Passive assets under management – by channel
As of December 31, 2017, the company changed the presentation of long-term inflows, outflows, and AUM to exclude Unit Investment Trusts (UITs) and product leverage. All periods have been reclassified to conform to the new presentation. Non-management fee earning AUM include Invesco PowerShares QQQ, UITs, and product leverage. .

40
($ billions) Total U.S. Canada U.K. Continental Europe Asia
June 30, 2017 $156.6 $152.8 $0.6 - $2.1 $1.1
Long-Term Inflows 9.9 6.1 0.1 - 3.7 -
Long-Term Outflows (8.6) (5.1) (0.1) - (3.4) -
Long-Term Net flows 1.3 1.0 - - 0.3 - Net flows in non-management fee earning
AUM 0.9 0.9 - - - -
Net flows in Inst. Money Market Funds - - - - - -
Market Gains and Losses 5.7 5.1 - - 0.6 -
Acquisitions/Dispositions, net 26.0 - - - 26.0 -
Transfer/Reclassifications - - - - - -
Foreign Currency Translation - - - - - -
September 30, 2017 $190.5 $159.8 $0.6 - $29.0 $1.1
Long-Term Inflows 16.5 8.1 0.1 - 8.3 -
Long-Term Outflows (15.7) (7.6) - - (8.1) -
Long-Term Net flows 0.8 0.5 0.1 - 0.2 - Net flows in non-management fee earning
AUM 1.6 1.6 - - - -
Net flows in Inst. Money Market Funds - - - - - -
Market Gains and Losses 5.9 5.4 (0.1) - 0.6 -
Acquisitions/Dispositions, net - - - - - -
Transfer/Reclassifications - - - - - -
Foreign Currency Translation 0.2 - - - 0.2 -
December 31, 2017 $199.0 $167.3 $0.6 - $30.0 $1.1
Passive assets under management – by client domicile
As of December 31, 2017, the company changed the presentation of long-term inflows, outflows, and AUM to exclude Unit Investment Trusts (UITs) and product leverage. All periods have been reclassified to conform to the new presentation. Non-management fee earning AUM include Invesco PowerShares QQQ, UITs, and product leverage.

41
($ billions) Total U.S. Canada U.K. Continental Europe Asia
December 31, 2016 $144.4 $139.9 $0.5 - $1.9 $2.1
Long-Term Inflows 9.1 9.0 - - 0.1 -
Long-Term Outflows (7.0) (6.2) - - (0.1) (0.7)
Long-Term Net flows 2.1 2.8 - - - (0.7)
Net flows in non-management fee earning AUM 1.2 1.2 - - - -
Net flows in Inst. Money Market Funds - - - - - -
Market Gains and Losses 6.5 6.3 - - 0.1 0.1
Acquisitions/Dispositions, net - - - - - -
Transfer/Reclassifications - - - - - -
Foreign Currency Translation 0.1 - - - - 0.1
March 31, 2017 $154.3 $150.2 $0.5 - $2.0 $1.6
Long-Term Inflows 7.4 7.0 0.1 - 0.3 -
Long-Term Outflows (6.9) (6.1) - - (0.3) (0.5)
Long-Term Net flows 0.5 0.9 0.1 - - (0.5)
Net flows in non-management fee earning AUM (0.7) (0.7) - - - -
Net flows in Inst. Money Market Funds - - - - - -
Market Gains and Losses 2.5 2.4 - - 0.1 -
Acquisitions/Dispositions, net - - - - - -
Transfer/Reclassifications - - - - - -
Foreign Currency Translation - - - - - -
June 30, 2017 $156.6 $152.8 $0.6 - $2.1 $1.1
Passive assets under management – by client domicile
As of December 31, 2017, the company changed the presentation of long-term inflows, outflows, and AUM to exclude Unit Investment Trusts (UITs) and product leverage. All periods have been reclassified to conform to the new presentation. Non-management fee earning AUM include Invesco PowerShares QQQ, UITs, and product leverage.
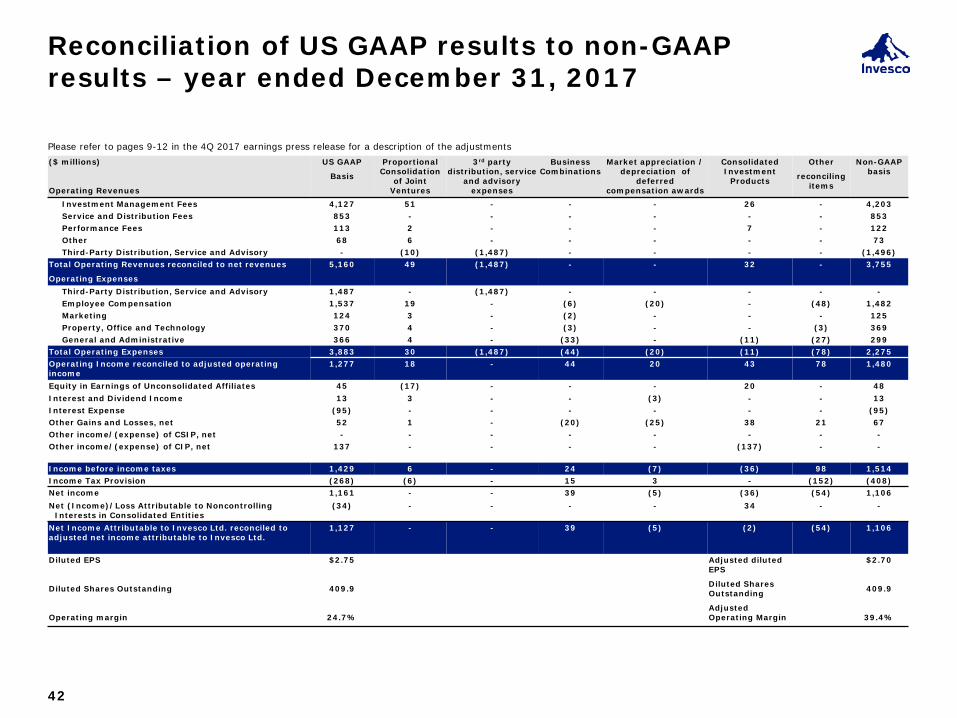
Reconciliation of US GAAP results to non-GAAP results – year ended December 31, 2017
42
($ millions)
Operating Revenues
US GAAP
Basis
Proportional Consolidation
of Joint Ventures
3rd party distribution, service
and advisory expenses
Business Combinations
Market appreciation / depreciation of
deferred compensation awards
Consolidated Investment
Products
Other
reconciling items
Non-GAAP basis
Investment Management Fees 4,127 51 - - - 26 - 4,203 Service and Distribution Fees 853 - - - - - - 853 Performance Fees 113 2 - - - 7 - 122 Other 68 6 - - - - - 73 Third-Party Distribution, Service and Advisory - (10) (1,487) - - - - (1,496) Total Operating Revenues reconciled to net revenues
Operating Expenses
5,160 49 (1,487) - - 32 - 3,755
Third-Party Distribution, Service and Advisory 1,487 - (1,487) - - - - - Employee Compensation 1,537 19 - (6) (20) - (48) 1,482 Marketing 124 3 - (2) - - - 125 Property, Office and Technology 370 4 - (3) - - (3) 369 General and Administrative 366 4 - (33) - (11) (27) 299 Total Operating Expenses 3,883 30 (1,487) (44) (20) (11) (78) 2,275 Operating Income reconciled to adjusted operating income
1,277 18 - 44 20 43 78 1,480
Equity in Earnings of Unconsolidated Affiliates 45 (17) - - - 20 - 48 Interest and Dividend Income 13 3 - - (3) - - 13 Interest Expense (95) - - - - - - (95) Other Gains and Losses, net 52 1 - (20) (25) 38 21 67 Other income/(expense) of CSIP, net - - - - - - - - Other income/(expense) of CIP, net 137 - - - - (137) - -
Income before income taxes 1,429 6 - 24 (7) (36) 98 1,514 Income Tax Provision (268) (6) - 15 3 - (152) (408) Net income 1,161 - - 39 (5) (36) (54) 1,106 Net (Income)/Loss Attributable to Noncontrolling
Interests in Consolidated Entities (34) - - - - 34 - -
Net Income Attributable to Invesco Ltd. reconciled to adjusted net income attributable to Invesco Ltd.
1,127 - - 39 (5) (2) (54) 1,106
Diluted EPS
Diluted Shares Outstanding
Operating margin
$2.75
409.9
24.7%
Adjusted diluted EPS
Diluted Shares Outstanding
Adjusted Operating Margin
$2.70
409.9
39.4%
Please refer to pages 9-12 in the 4Q 2017 earnings press release for a description of the adjustments

Reconciliation of US GAAP results to non-GAAP results – year ended December 31, 2016
43
($ millions)
Operating Revenues
US GAAP
Basis
Proportional Consolidation
of Joint Ventures
3rd party distribution, service
and advisory expenses
Business Combinations
Market appreciation / depreciation of
deferred compensation awards
Consolidated Investment
Products
Other
reconciling items
Non-GAAP basis
Investment Management Fees 3,773 47 - - - 21 - 3,841 Service and Distribution Fees 824 - - - - - - 824 Performance Fees 44 1 - - - 2 - 47 Other 93 5 - - - - - 98 Third-Party Distribution, Service and Advisory - (9) (1,407) - - - - (1,416) Total Operating Revenues reconciled to net revenues
Operating Expenses
4,734 44 (1,407) - - 22 - 3,393
Third-Party Distribution, Service and Advisory 1,407 - (1,407) - - - - - Employee Compensation 1,379 19 - (7) (8) - (18) 1,365 Marketing 115 2 - - - - - 117 Property, Office and Technology 326 4 - - - - 2 331 General and Administrative 332 3 - (15) - (29) (23) 268 Total Operating Expenses 3,558 28 (1,407) (22) (8) (29) (39) 2,080 Operating Income reconciled to adjusted operating income
1,176 16 - 22 8 51 39 1,313
Equity in Earnings of Unconsolidated Affiliates 9 (14) - 18 - 9 - 22 Interest and Dividend Income 12 2 - - (1) 0 - 14 Interest Expense (93) - - - - - - (93) Other Gains and Losses, net 23 0 - 7 (11) 7 (14) 7 Other income/(expense) of CSIP, net - - - - - - - - Other income/(expense) of CIP, net 79 - - - - (79) - -
Income before income taxes 1,207 5 - 48 (4) (17) 25 1,263 Income Tax Provision (338) (5) - 12 2 - (9) (338) Net income 868 - - 60 (3) (17) 16 924 Net (Income)/Loss Attributable to Noncontrolling
Interests in Consolidated Entities (14) - - - - 14 - (0)
Net Income Attributable to Invesco Ltd. reconciled to adjusted net income attributable to Invesco Ltd.
854 - - 60 (3) (3) 16 924
Diluted EPS
Diluted Shares Outstanding
Operating margin
$2.06
415.0
24.8%
Adjusted diluted EPS
Diluted Shares Outstanding
Adjusted Operating Margin
$2.23
415.0
38.7%
Please refer to pages 9-11 in the 4Q 2016 earnings press release for a description of the adjustments

44
Reconciliation of US GAAP results to non-GAAP results – three months ended December 31, 2017
($ millions)
Operating Revenues
US GAAP
Basis
Proportional Consolidation
of Joint Ventures
3rd party distribution, service
and advisory expenses
Business Combinations
Market appreciation / depreciation of
deferred compensation awards
Consolidated Investment
Products
Other
reconciling items
Non-GAAP basis
Investment Management Fees 1,099 14 - - - 7 - 1,119 Service and Distribution Fees 218 - - - - - - 218 Performance Fees 43 - - - - 0 - 43 Other 16 2 - - - - - 18 Third-Party Distribution, Service and Advisory - (3) (391) - - - - (394) Total Operating Revenues reconciled to net revenues
Operating Expenses
1,376 14 (391) - - 7 - 1,005
Third-Party Distribution, Service and Advisory 391 - (391) - - - - - Employee Compensation 382 5 - (1) (6) - (3) 376 Marketing 41 1 - (2) - - - 40 Property, Office and Technology 103 1 - (3) - - (1) 101 General and Administrative 115 - - (16) - (5) (6) 89 Total Operating Expenses 1,031 8 (391) (22) (6) (5) (9) 606 Operating Income reconciled to adjusted operating income
344 6 - 22 6 12 9 399
Equity in Earnings of Unconsolidated Affiliates 4 (6) - - - 12 - 9 Interest and Dividend Income 6 1 - - (2) - - 5 Interest Expense (24) - - - - - - (24) Other Gains and Losses, net 24 1 - (8) (4) 6 (1) 18 Other income/(expense) of CIP, net 45 - - - - (45) - -
Income before income taxes 399 2 - (14) - (15) 8 408 Income Tax Provision 23 (2) - 3 - - (134) (110) Net income 423 - - 17 - (15) (125) 299 Net (Income)/Loss Attributable to Noncontrolling
Interests in Consolidated Entities (14) - - - - 14 - -
Net Income Attributable to Invesco Ltd. reconciled to adjusted net income attributable to Invesco Ltd.
408 - - 17 - (1) (125) 299
Diluted EPS
Diluted Shares Outstanding
Operating margin
$0.99
410.6
25.0%
Adjusted diluted EPS
Diluted Shares Outstanding
Adjusted Operating Margin
$0.73
410.6
39.7%
Please refer to pages 9-12 in the 4Q 2017 earnings press release for a description of the adjustments
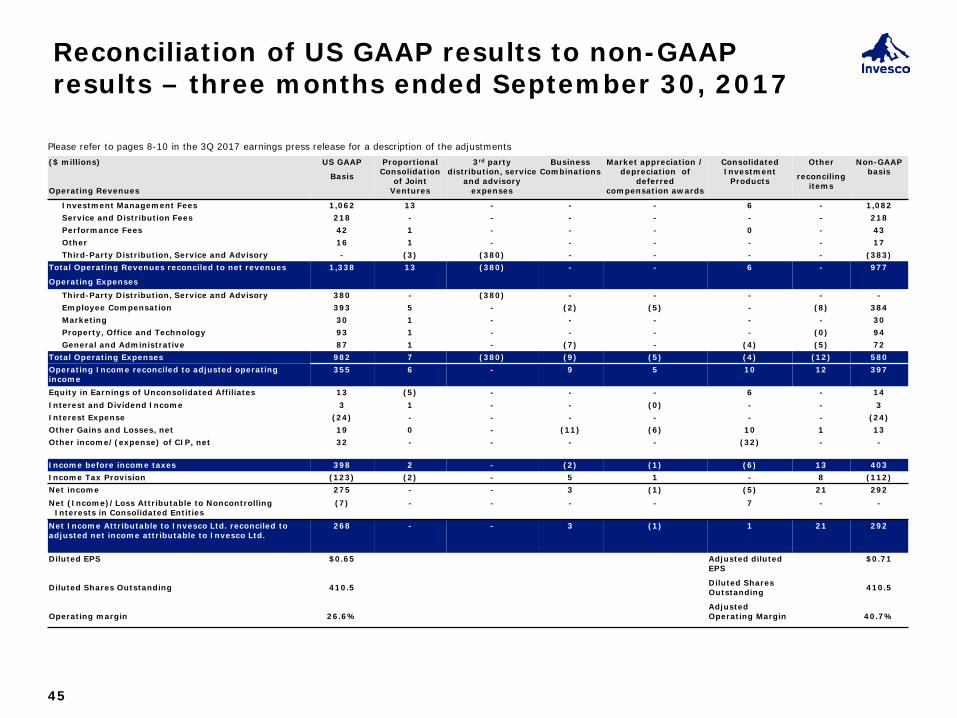
Reconciliation of US GAAP results to non-GAAP results – three months ended September 30, 2017
45
($ millions)
Operating Revenues
US GAAP
Basis
Proportional Consolidation
of Joint Ventures
3rd party distribution, service
and advisory expenses
Business Combinations
Market appreciation / depreciation of
deferred compensation awards
Consolidated Investment
Products
Other
reconciling items
Non-GAAP basis
Investment Management Fees 1,062 13 - - - 6 - 1,082 Service and Distribution Fees 218 - - - - - - 218 Performance Fees 42 1 - - - 0 - 43 Other 16 1 - - - - - 17 Third-Party Distribution, Service and Advisory - (3) (380) - - - - (383) Total Operating Revenues reconciled to net revenues
Operating Expenses
1,338 13 (380) - - 6 - 977
Third-Party Distribution, Service and Advisory 380 - (380) - - - - - Employee Compensation 393 5 - (2) (5) - (8) 384 Marketing 30 1 - - - - - 30 Property, Office and Technology 93 1 - - - - (0) 94 General and Administrative 87 1 - (7) - (4) (5) 72 Total Operating Expenses 982 7 (380) (9) (5) (4) (12) 580 Operating Income reconciled to adjusted operating income
355 6 - 9 5 10 12 397
Equity in Earnings of Unconsolidated Affiliates 13 (5) - - - 6 - 14 Interest and Dividend Income 3 1 - - (0) - - 3 Interest Expense (24) - - - - - - (24) Other Gains and Losses, net 19 0 - (11) (6) 10 1 13 Other income/(expense) of CIP, net 32 - - - - (32) - -
Income before income taxes 398 2 - (2) (1) (6) 13 403 Income Tax Provision (123) (2) - 5 1 - 8 (112) Net income 275 - - 3 (1) (5) 21 292 Net (Income)/Loss Attributable to Noncontrolling
Interests in Consolidated Entities (7) - - - - 7 - -
Net Income Attributable to Invesco Ltd. reconciled to adjusted net income attributable to Invesco Ltd.
268 - - 3 (1) 1 21 292
Diluted EPS
Diluted Shares Outstanding
Operating margin
$0.65
410.5
26.6%
Adjusted diluted EPS
Diluted Shares Outstanding
Adjusted Operating Margin
$0.71
410.5
40.7%
Please refer to pages 8-10 in the 3Q 2017 earnings press release for a description of the adjustments
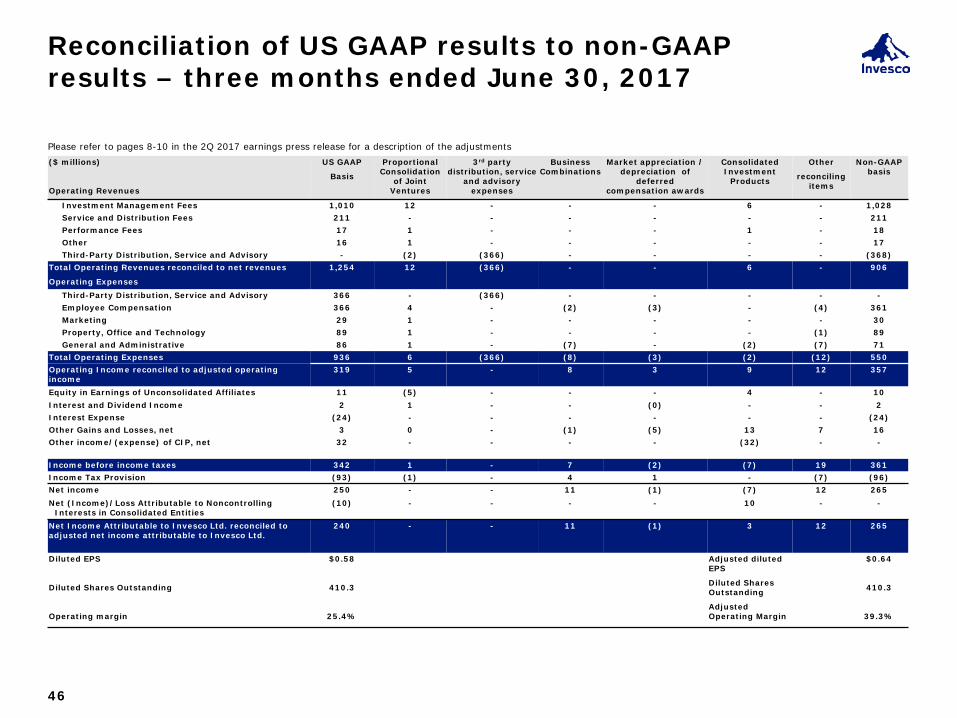
Reconciliation of US GAAP results to non-GAAP results – three months ended June 30, 2017
46
($ millions)
Operating Revenues
US GAAP
Basis
Proportional Consolidation
of Joint Ventures
3rd party distribution, service
and advisory expenses
Business Combinations
Market appreciation / depreciation of
deferred compensation awards
Consolidated Investment
Products
Other
reconciling items
Non-GAAP basis
Investment Management Fees 1,010 12 - - - 6 - 1,028 Service and Distribution Fees 211 - - - - - - 211 Performance Fees 17 1 - - - 1 - 18 Other 16 1 - - - - - 17 Third-Party Distribution, Service and Advisory - (2) (366) - - - - (368) Total Operating Revenues reconciled to net revenues
Operating Expenses
1,254 12 (366) - - 6 - 906
Third-Party Distribution, Service and Advisory 366 - (366) - - - - - Employee Compensation 366 4 - (2) (3) - (4) 361 Marketing 29 1 - - - - - 30 Property, Office and Technology 89 1 - - - - (1) 89 General and Administrative 86 1 - (7) - (2) (7) 71 Total Operating Expenses 936 6 (366) (8) (3) (2) (12) 550 Operating Income reconciled to adjusted operating income
319 5 - 8 3 9 12 357
Equity in Earnings of Unconsolidated Affiliates 11 (5) - - - 4 - 10 Interest and Dividend Income 2 1 - - (0) - - 2 Interest Expense (24) - - - - - - (24) Other Gains and Losses, net 3 0 - (1) (5) 13 7 16 Other income/(expense) of CIP, net 32 - - - - (32) - -
Income before income taxes 342 1 - 7 (2) (7) 19 361 Income Tax Provision (93) (1) - 4 1 - (7) (96) Net income 250 - - 11 (1) (7) 12 265 Net (Income)/Loss Attributable to Noncontrolling
Interests in Consolidated Entities (10) - - - - 10 - -
Net Income Attributable to Invesco Ltd. reconciled to adjusted net income attributable to Invesco Ltd.
240 - - 11 (1) 3 12 265
Diluted EPS
Diluted Shares Outstanding
Operating margin
$0.58
410.3
25.4%
Adjusted diluted EPS
Diluted Shares Outstanding
Adjusted Operating Margin
$0.64
410.3
39.3%
Please refer to pages 8-10 in the 2Q 2017 earnings press release for a description of the adjustments
Reconciliation of US GAAP results to non-GAAP results – three months ended March 31, 2017
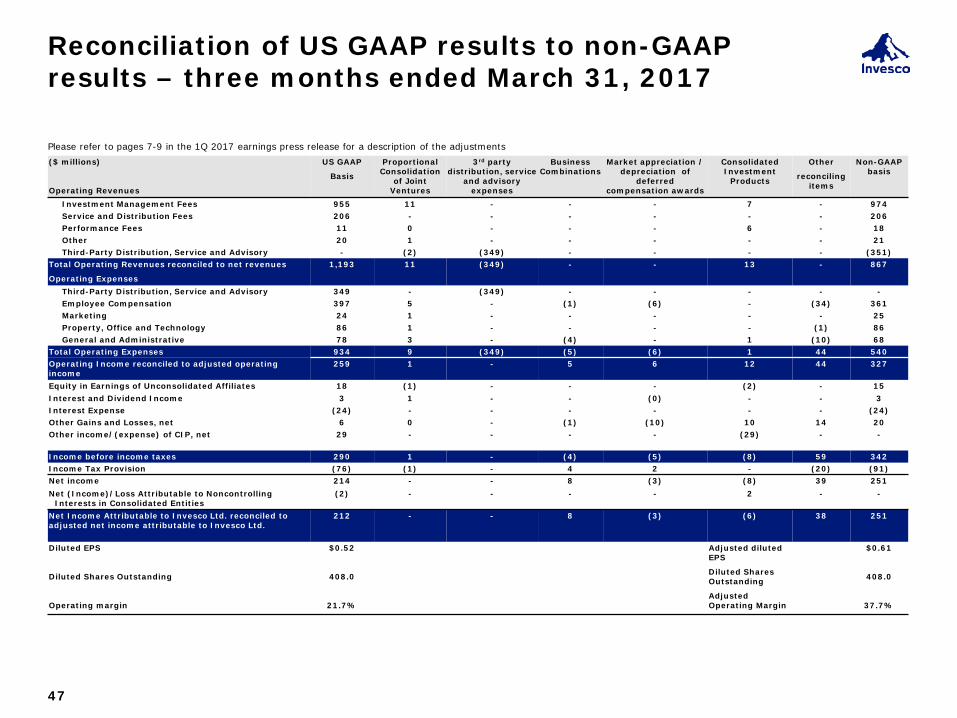
47
($ millions)
Operating Revenues
US GAAP
Basis
Proportional Consolidation
of Joint Ventures
3rd party distribution, service
and advisory expenses
Business Combinations
Market appreciation / depreciation of
deferred compensation awards
Consolidated Investment
Products
Other
reconciling items
Non-GAAP basis
Investment Management Fees 955 11 - - - 7 - 974 Service and Distribution Fees 206 - - - - - - 206 Performance Fees 11 0 - - - 6 - 18 Other 20 1 - - - - - 21 Third-Party Distribution, Service and Advisory - (2) (349) - - - - (351) Total Operating Revenues reconciled to net revenues
Operating Expenses
1,193 11 (349) - - 13 - 867
Third-Party Distribution, Service and Advisory 349 - (349) - - - - - Employee Compensation 397 5 - (1) (6) - (34) 361 Marketing 24 1 - - - - - 25 Property, Office and Technology 86 1 - - - - (1) 86 General and Administrative 78 3 - (4) - 1 (10) 68 Total Operating Expenses 934 9 (349) (5) (6) 1 44 540 Operating Income reconciled to adjusted operating income
259 1 - 5 6 12 44 327
Equity in Earnings of Unconsolidated Affiliates 18 (1) - - - (2) - 15 Interest and Dividend Income 3 1 - - (0) - - 3 Interest Expense (24) - - - - - - (24) Other Gains and Losses, net 6 0 - (1) (10) 10 14 20 Other income/(expense) of CIP, net 29 - - - - (29) - -
Income before income taxes 290 1 - (4) (5) (8) 59 342 Income Tax Provision (76) (1) - 4 2 - (20) (91) Net income 214 - - 8 (3) (8) 39 251 Net (Income)/Loss Attributable to Noncontrolling
Interests in Consolidated Entities (2) - - - - 2 - -
Net Income Attributable to Invesco Ltd. reconciled to adjusted net income attributable to Invesco Ltd.
212 - - 8 (3) (6) 38 251
Diluted EPS
Diluted Shares Outstanding
Operating margin
$0.52
408.0
21.7%
Adjusted diluted EPS
Diluted Shares Outstanding
Adjusted Operating Margin
$0.61
408.0
37.7%
Please refer to pages 7-9 in the 1Q 2017 earnings press release for a description of the adjustments
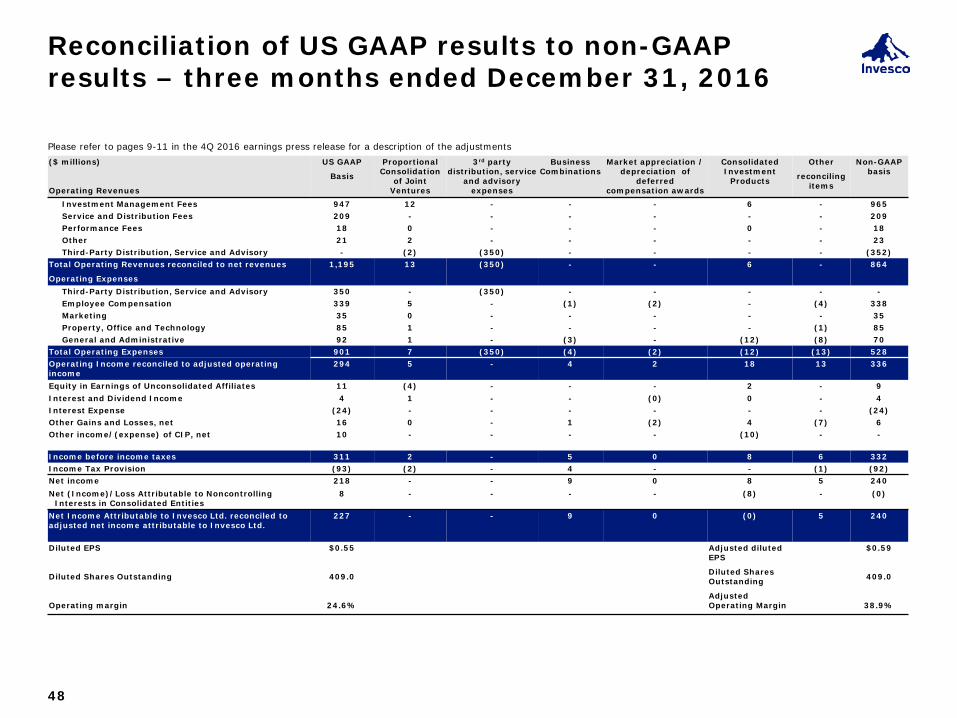
Reconciliation of US GAAP results to non-GAAP results – three months ended December 31, 2016
48
($ millions)
Operating Revenues
US GAAP
Basis
Proportional Consolidation
of Joint Ventures
3rd party distribution, service
and advisory expenses
Business Combinations
Market appreciation / depreciation of
deferred compensation awards
Consolidated Investment
Products
Other
reconciling items
Non-GAAP basis
Investment Management Fees 947 12 - - - 6 - 965 Service and Distribution Fees 209 - - - - - - 209 Performance Fees 18 0 - - - 0 - 18 Other 21 2 - - - - - 23 Third-Party Distribution, Service and Advisory - (2) (350) - - - - (352) Total Operating Revenues reconciled to net revenues
Operating Expenses
1,195 13 (350) - - 6 - 864
Third-Party Distribution, Service and Advisory 350 - (350) - - - - - Employee Compensation 339 5 - (1) (2) - (4) 338 Marketing 35 0 - - - - - 35 Property, Office and Technology 85 1 - - - - (1) 85 General and Administrative 92 1 - (3) - (12) (8) 70 Total Operating Expenses 901 7 (350) (4) (2) (12) (13) 528 Operating Income reconciled to adjusted operating income
294 5 - 4 2 18 13 336
Equity in Earnings of Unconsolidated Affiliates 11 (4) - - - 2 - 9 Interest and Dividend Income 4 1 - - (0) 0 - 4 Interest Expense (24) - - - - - - (24) Other Gains and Losses, net 16 0 - 1 (2) 4 (7) 6 Other income/(expense) of CIP, net 10 - - - - (10) - -
Income before income taxes 311 2 - 5 0 8 6 332 Income Tax Provision (93) (2) - 4 - - (1) (92) Net income 218 - - 9 0 8 5 240 Net (Income)/Loss Attributable to Noncontrolling
Interests in Consolidated Entities 8 - - - - (8) - (0)
Net Income Attributable to Invesco Ltd. reconciled to adjusted net income attributable to Invesco Ltd.
227 - - 9 0 (0) 5 240
Diluted EPS
Diluted Shares Outstanding
Operating margin
$0.55
409.0
24.6%
Adjusted diluted EPS
Diluted Shares Outstanding
Adjusted Operating Margin
$0.59
409.0
38.9%
Please refer to pages 9-11 in the 4Q 2016 earnings press release for a description of the adjustments
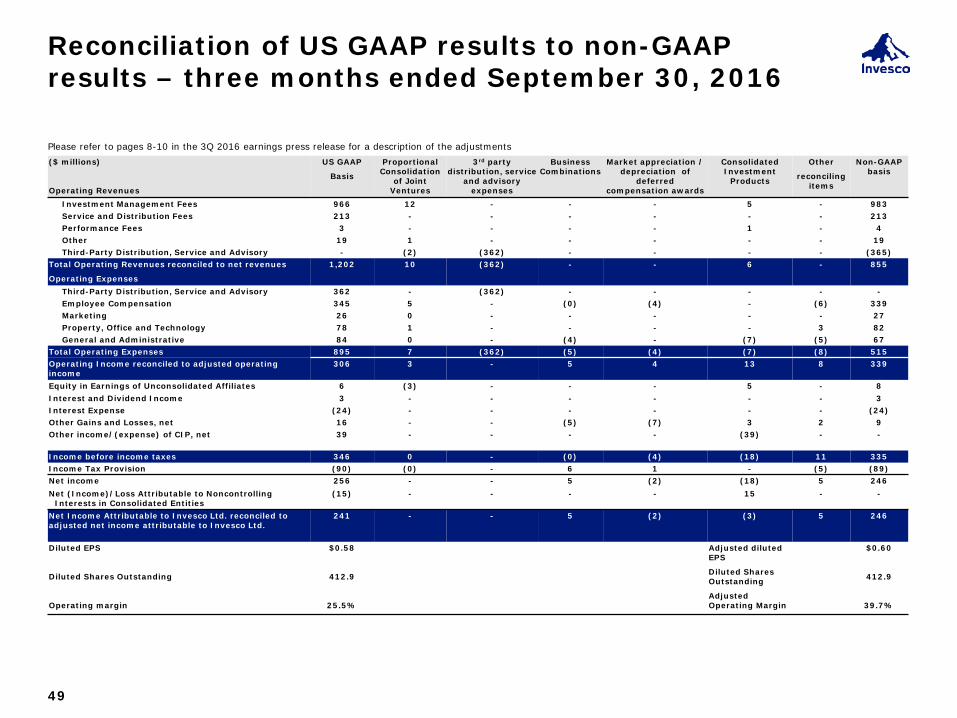
Reconciliation of US GAAP results to non-GAAP results – three months ended September 30, 2016
49
($ millions)
Operating Revenues
US GAAP
Basis
Proportional Consolidation
of Joint Ventures
3rd party distribution, service
and advisory expenses
Business Combinations
Market appreciation / depreciation of
deferred compensation awards
Consolidated Investment
Products
Other
reconciling items
Non-GAAP basis
Investment Management Fees 966 12 - - - 5 - 983 Service and Distribution Fees 213 - - - - - - 213 Performance Fees 3 - - - - 1 - 4 Other 19 1 - - - - - 19 Third-Party Distribution, Service and Advisory - (2) (362) - - - - (365) Total Operating Revenues reconciled to net revenues
Operating Expenses
1,202 10 (362) - - 6 - 855
Third-Party Distribution, Service and Advisory 362 - (362) - - - - - Employee Compensation 345 5 - (0) (4) - (6) 339 Marketing 26 0 - - - - - 27 Property, Office and Technology 78 1 - - - - 3 82 General and Administrative 84 0 - (4) - (7) (5) 67 Total Operating Expenses 895 7 (362) (5) (4) (7) (8) 515 Operating Income reconciled to adjusted operating income
306 3 - 5 4 13 8 339
Equity in Earnings of Unconsolidated Affiliates 6 (3) - - - 5 - 8 Interest and Dividend Income 3 - - - - - - 3 Interest Expense (24) - - - - - - (24) Other Gains and Losses, net 16 - - (5) (7) 3 2 9 Other income/(expense) of CIP, net 39 - - - - (39) - -
Income before income taxes 346 0 - (0) (4) (18) 11 335 Income Tax Provision (90) (0) - 6 1 - (5) (89) Net income 256 - - 5 (2) (18) 5 246 Net (Income)/Loss Attributable to Noncontrolling
Interests in Consolidated Entities (15) - - - - 15 - -
Net Income Attributable to Invesco Ltd. reconciled to adjusted net income attributable to Invesco Ltd.
241 - - 5 (2) (3) 5 246
Diluted EPS
Diluted Shares Outstanding
Operating margin
$0.58
412.9
25.5%
Adjusted diluted EPS
Diluted Shares Outstanding
Adjusted Operating Margin
$0.60
412.9
39.7%
Please refer to pages 8-10 in the 3Q 2016 earnings press release for a description of the adjustments

Reconciliation of US GAAP results to non-GAAP results – three months ended June 30, 2016
50
($ millions)
Operating Revenues
US GAAP
Basis
Proportional Consolidation
of Joint Ventures
3rd party distribution, service
and advisory expenses
Business Combinations
Market appreciation / depreciation of
deferred compensation awards
Consolidated Investment
Products
Other
reconciling items
Non-GAAP basis
Investment Management Fees 947 12 - - - 5 - 963 Service and Distribution Fees 203 - - - - - - 203 Performance Fees 9 - - - - - - 9 Other 30 1 - - - - - 32 Third-Party Distribution, Service and Advisory - (2) (348) - - - - (351) Total Operating Revenues reconciled to net revenues
Operating Expenses
1,189 11 (348) - - 5 - 857
Third-Party Distribution, Service and Advisory 348 - (348) - - - - - Employee Compensation 350 4 - (0) (2) - (4) 348 Marketing 28 1 - - - - - 29 Property, Office and Technology 82 1 - - - - (0) 83 General and Administrative 79 1 - (4) - (8) (1) 67 Total Operating Expenses 888 6 (348) (5) (2) (8) (5) 526 Operating Income reconciled to adjusted operating income
302 4 - 5 2 13 5 330
Equity in Earnings of Unconsolidated Affiliates 5 (4) - - - 5 - 6 Interest and Dividend Income 3 1 - - - - - 3 Interest Expense (22) - - - - - - (22) Other Gains and Losses, net (4) - - 15 (4) 1 (8) (0) Other income/(expense) of CIP, net 38 - - - - (38) - -
Income before income taxes 320 1 - 20 (2) (32) (3) 317 Income Tax Provision (84) (1) - (2) 1 - 2 (84) Net income 237 - - 18 (1) (19) (1) 233 Net (Income)/Loss Attributable to Noncontrolling
Interests in Consolidated Entities (11) - - - - 11 - -
Net Income Attributable to Invesco Ltd. reconciled to adjusted net income attributable to Invesco Ltd.
226 - - 18 (1) (8) (1) 233
Diluted EPS
Diluted Shares Outstanding
Operating margin
$0.54
419.1
25.3%
Adjusted diluted EPS
Diluted Shares Outstanding
Adjusted Operating Margin
$0.56
419.1
38.6%
Please refer to pages 8-10 in the 2Q 2016 earnings press release for a description of the adjustments
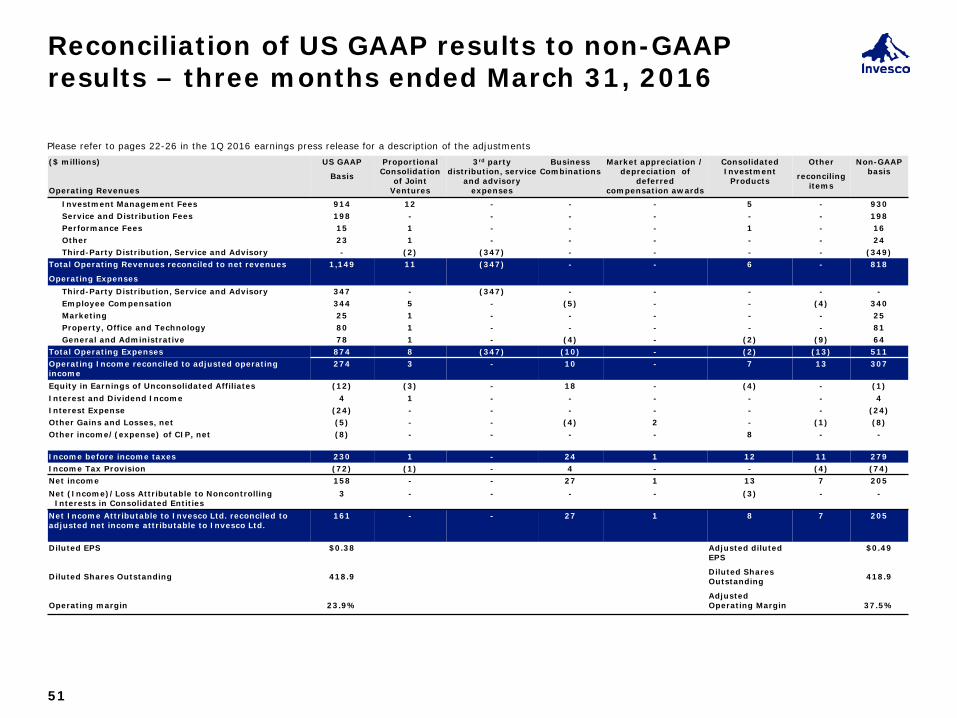
Please refer to pages 22-26 in the 1Q 2016 earnings press release for a description of the adjustments
Reconciliation of US GAAP results to non-GAAP results – three months ended March 31, 2016
51
($ millions)
Operating Revenues
US GAAP
Basis
Proportional Consolidation
of Joint Ventures
3rd party distribution, service
and advisory expenses
Business Combinations
Market appreciation / depreciation of
deferred compensation awards
Consolidated Investment
Products
Other
reconciling items
Non-GAAP basis
Investment Management Fees 914 12 - - - 5 - 930 Service and Distribution Fees 198 - - - - - - 198 Performance Fees 15 1 - - - 1 - 16 Other 23 1 - - - - - 24 Third-Party Distribution, Service and Advisory - (2) (347) - - - - (349) Total Operating Revenues reconciled to net revenues
Operating Expenses
1,149 11 (347) - - 6 - 818
Third-Party Distribution, Service and Advisory 347 - (347) - - - - - Employee Compensation 344 5 - (5) - - (4) 340 Marketing 25 1 - - - - - 25 Property, Office and Technology 80 1 - - - - - 81 General and Administrative 78 1 - (4) - (2) (9) 64 Total Operating Expenses 874 8 (347) (10) - (2) (13) 511 Operating Income reconciled to adjusted operating income
274 3 - 10 - 7 13 307
Equity in Earnings of Unconsolidated Affiliates (12) (3) - 18 - (4) - (1) Interest and Dividend Income 4 1 - - - - - 4 Interest Expense (24) - - - - - - (24) Other Gains and Losses, net (5) - - (4) 2 - (1) (8) Other income/(expense) of CIP, net (8) - - - - 8 - -
Income before income taxes 230 1 - 24 1 12 11 279 Income Tax Provision (72) (1) - 4 - - (4) (74) Net income 158 - - 27 1 13 7 205 Net (Income)/Loss Attributable to Noncontrolling
Interests in Consolidated Entities 3 - - - - (3) - -
Net Income Attributable to Invesco Ltd. reconciled to adjusted net income attributable to Invesco Ltd.
161 - - 27 1 8 7 205
Diluted EPS
Diluted Shares Outstanding
Operating margin
$0.38
418.9
23.9%
Adjusted diluted EPS
Diluted Shares Outstanding
Adjusted Operating Margin
$0.49
418.9
37.5%


