18
Martyn Vaughan – Managing Director 30% of Melrose 75% of Energy 73% 17% 10%

Martyn Vaughan – Managing Director
30% of
Melrose
75% of
Energy
73% 17% 10%
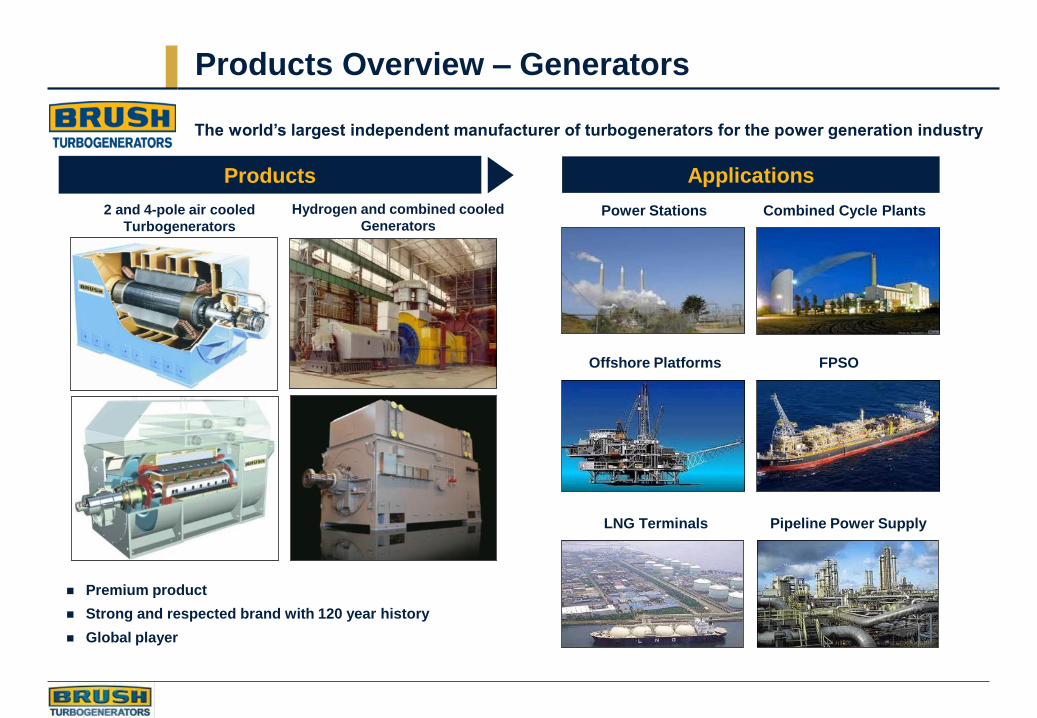
Products Overview – Generators
The world’s largest independent manufacturer of turbogenerators for the power generation industry
Power Stations Combined Cycle Plants
Offshore Platforms FPSO
LNG Terminals Pipeline Power Supply
Applications Products
2 and 4-pole air cooled
Turbogenerators
Hydrogen and combined cooled
Generators
Premium product
Strong and respected brand with 120 year history
Global player
Applications Products
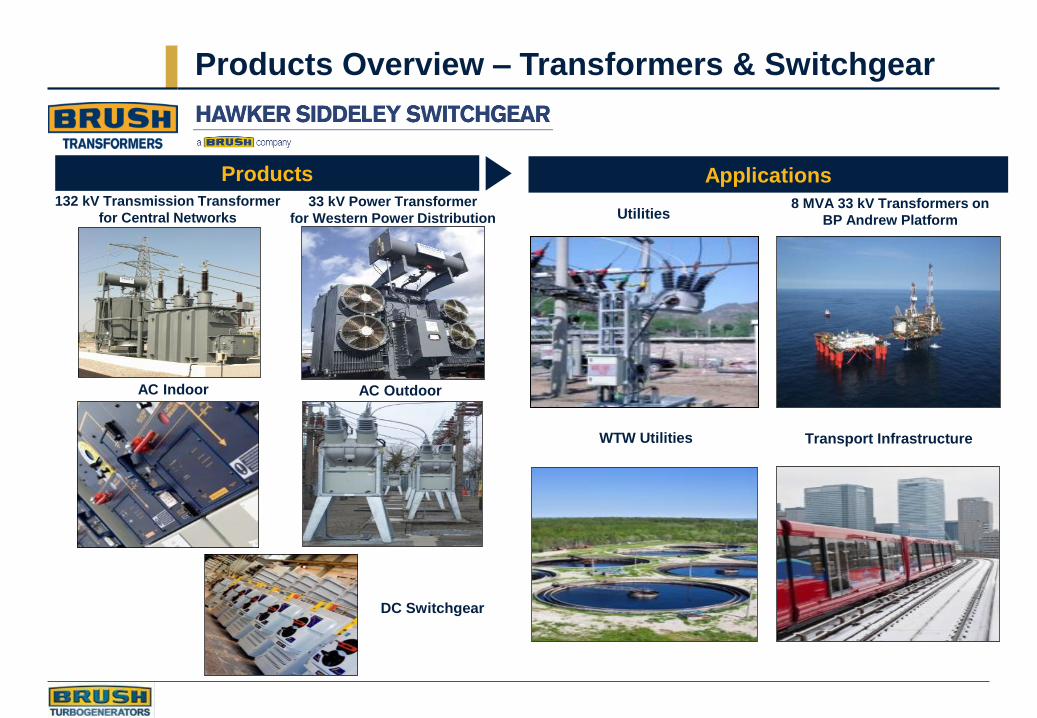
33 kV Power Transformer
for Western Power Distribution
Products Overview – Transformers & Switchgear
Utilities
WTW Utilities
AC Outdoor AC Indoor
132 kV Transmission Transformer
for Central Networks
DC Switchgear
8 MVA 33 kV Transformers on
BP Andrew Platform
Transport Infrastructure
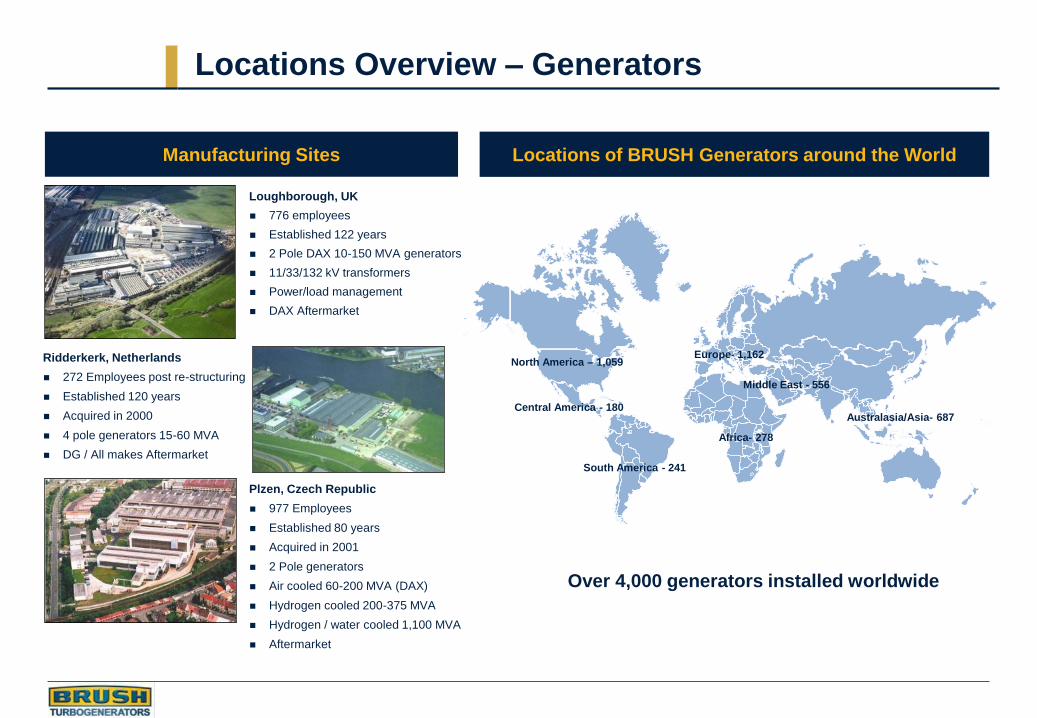
North America – 1,059 Europe- 1,162
Middle East - 556
Central America - 180
South America - 241
Africa- 278
Australasia/Asia- 687
Manufacturing Sites
Loughborough, UK
776 employees
Established 122 years
2 Pole DAX 10-150 MVA generators
11/33/132 kV transformers
Power/load management
DAX Aftermarket
Plzen, Czech Republic
977 Employees
Established 80 years
Acquired in 2001
2 Pole generators
Air cooled 60-200 MVA (DAX)
Hydrogen cooled 200-375 MVA
Hydrogen / water cooled 1,100 MVA
Aftermarket
Ridderkerk, Netherlands
272 Employees post re-structuring
Established 120 years
Acquired in 2000
4 pole generators 15-60 MVA
DG / All makes Aftermarket
Locations of BRUSH Generators around the World
Over 4,000 generators installed worldwide
Locations Overview – Generators

North America - 41 China
Middle East - 898
Central America - 147
South America - 50
Africa - 188
Australasia/Asia - 391
Manufacturing Sites Locations of BRUSH Transformers around the World
Europe - 2043
Japan
Blackwood, UK
242 employees
Established 100 years
AC Indoor Switchgear
AC Outdoor Switchgear
DC Switchgear
Aftermarket
Brisbane, Australia
41 Employees
Established >40 years
AC Outdoor Switchgear
AC Indoor Switchgear
Aftermarket
Over 3,850 Transformers installed worldwide
Locations of HSS Licensees around the World
South Africa
Locations Overview – Switchgear and Transformers
Loughborough, UK
162 employees
Established 122 years
145 kV up to 60 MVA
11/33/132 kV transformers
Tapchangers
Asia & China - 88
Notes
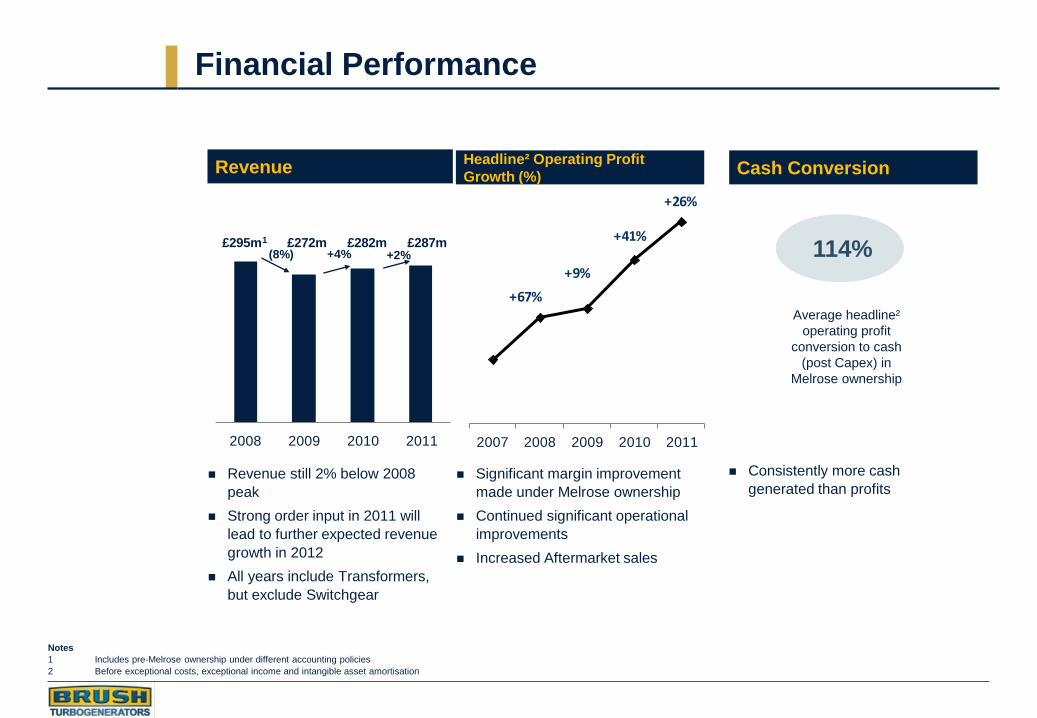
1 Includes pre-Melrose ownership under different accounting policies
2 Before exceptional costs, exceptional income and intangible asset amortisation
1 2008 2009 2010 2011
£295m1 £272m £282m £287m
Revenue
Revenue still 2% below 2008
peak
Strong order input in 2011 will
lead to further expected revenue
growth in 2012
All years include Transformers,
but exclude Switchgear
(8%) +4% +2%
Financial Performance
2007 2008 2009 2010 2011
+67%
+9%
+41%
+26%
Significant margin improvement
made under Melrose ownership
Continued significant operational
improvements
Increased Aftermarket sales
Headline² Operating Profit
Growth (%)
114%
Consistently more cash
generated than profits
Average headline²
operating profit
conversion to cash
(post Capex) in
Melrose ownership
Cash Conversion

Sales² Breakdown by Installation 2011 Sales¹ Breakdown by End Market 2011
Paper mills
Food processing plants
Aluminium smelters
Car plants
Mines
Offshore platforms
FPSO vessels
Oil refineries
LNG receiving terminals
Pipeline power supply
Base load power
Peak lopping
Combined heat/power plants
Combined cycle plants
Solar power plants
71% OEM
29% Aftermarket
Notes
1 Excludes Transformers
2 Excludes Transformers and Aftermarket
8%
9%
54%
35%
17%
19%
10%
15%
2% 2%
North America South America Europe
MEA Asia China
ROW
Generator Sales by End Market and Geography

Transformers & Switchgear Sales by End Market and Geography
Sales Breakdown by End Market 2011 Sales Breakdown by Installation 2011
Transformers
Switchgear

Generator Power Range

Source: McCoy database,
Turbine Competitive Position
Gas turbine Steam turbine
Gas
turbine
Steam
turbine
Key Customers All sectors > 20MW (1057 Machines) All sectors > 20MW (882 Machines)
Market Share by Unit Orders 2011 Market Share by Unit Orders 2010
Gas Turbine Sector 20 – 130MW (364 Machines) Gas Turbine Sector 20 – 130MW (266 Machines)
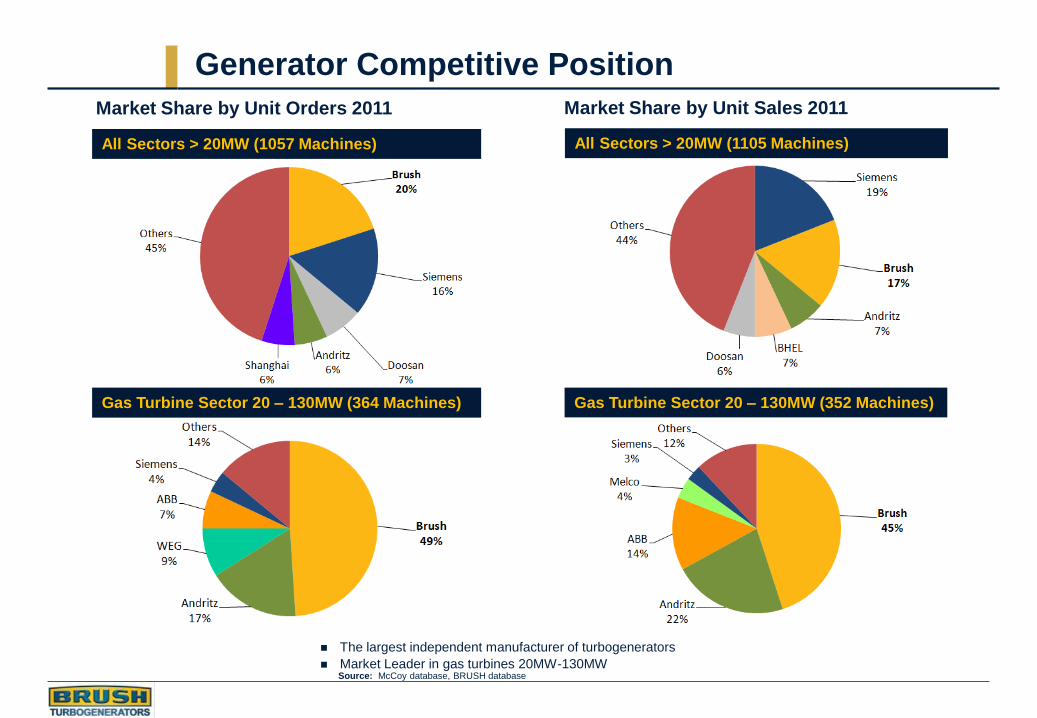
All Sectors > 20MW (1105 Machines)
Market Share by Unit Sales 2011
All Sectors > 20MW (1057 Machines)
Market Share by Unit Orders 2011
The largest independent manufacturer of turbogenerators
Market Leader in gas turbines 20MW-130MW Source: McCoy database, BRUSH database
Generator Competitive Position
Gas Turbine Sector 20 – 130MW (364 Machines) Gas Turbine Sector 20 – 130MW (352 Machines)

Source: Credit Suisse research
By Technology
The Global Power Market
Emerging markets in need of new capacity…
By Region
30%
24%17%
16%
6%6% 1%
Coal
Gas
Wind
Hydro
Oil
Nuclear
Other renewables
Electricity demand is closely correlated to GDP growth
Global GDP growth = 3.5% over next 5 years
New OE equipment demand over next 5 years to stabilise at 264GW p.a.
23% of demand is replacement of life-expired equipment
+32% on 2010 order levels over next 5 years
Gas turbine sector is big winner, +75% over next 5 years
39%
10%10%
9%
8%
8%
8%
8%
China
Middle East
Russia & Eastern Europe
USA
India
Europe
Asia (Other)
Other
264GW 264GW
Medium Term Growth Prospects
GW
G
W
Installed Plant Exceeding 40 Years of Age
…replacement capacity required in
mature economies
Source: Credit Suisse research
Source: Credit Suisse research
0
50
100
150
200
19
50
19
52
19
54
19
56
19
58
19
60
19
62
19
64
19
66
19
68
19
70
19
72
19
74
19
76
19
78
19
80
19
82
19
84
19
86
19
88
19
90
19
92
19
94
19
96
19
98
20
00
20
02
20
04
20
06
20
08
20
10
20
12
20
14
Target
Area:
110GW to
130GW
2011E
2015E
Global Power Plant Orders GW p.a. (excl Hydro, Wind & China Coal)
1950-2015E

Increased productivity
Greater focus on Aftermarket
Margin improvement
Reduced lead times
Extend current product range
Cash generation
Massive culture change
Increased Productivity
Starting from a low base
Professional factory management
Zero tolerance on reliance on overtime and hire/fire
Make versus buy on non-core components
Incentive system
Lean as a strategy not just a tool
Productivity - Sales and Profit per Employee Key Developments
Brush – the First Four Years
2008 2009 2010 2011
121 123
£295m £272m £282m £287m
No. of
employees
2898
No. of
employees
2397
No. of
employees
2335
No. of
employees
2335
+32%
+90%
+140%
102
114
Key Developments under Melrose Ownership
Sales
Sales/employee £k
Profit/employee cumulative % increase

Growing the Offering
“When they do
provide aftermarket
support they are very
knowledgeable and
helpful but they are
scarce.” – Prime
Mover PW (USA)
“I like their product, it’s
an excellent product.
The people we have
worked with have been
excellent.” – End User
(USA)
“If you can get the
engineers on site
they are the top of
the line.” – End User
(USA)
“Overall, its their
professionalism and you
know if BRUSH are doing a
job it gets done.” – End
User (Canada)
Strengths of BRUSH – Knowledge and Product strong … but need investment
Performance
Professional
Knowledge Responsive Engineers
“They are technologically
competent and the engineers
they have are very
experienced and competent
with our machines.” – End
User (UK)
“They have
knowledgeable
engineers but very
few of them.” – Prime
Mover GE (USA)
Target to get
to >30%
Focusing on Aftermarket
Large POC contract
replacement year.
Underlying 9% growth v 2010
57
78 79
20%
24%
Acquisition of GMS
Sales % of total Generator Sales
Notes
1 Includes Transformers
Why?
Exploit large Brush installed base and Brush brand
25 year average generator lifespan Aftermarket revenue potential
Attractive gross margins
End customer preference for OEM service
Brush historically under-represented
How?
New investment in people and Capex being put in place
Deep knowledge of market and customers
Global reach and local presence
Focused and integrated organisation to deliver
GMS acquisition in US
The Strategy
Focusing on Aftermarket
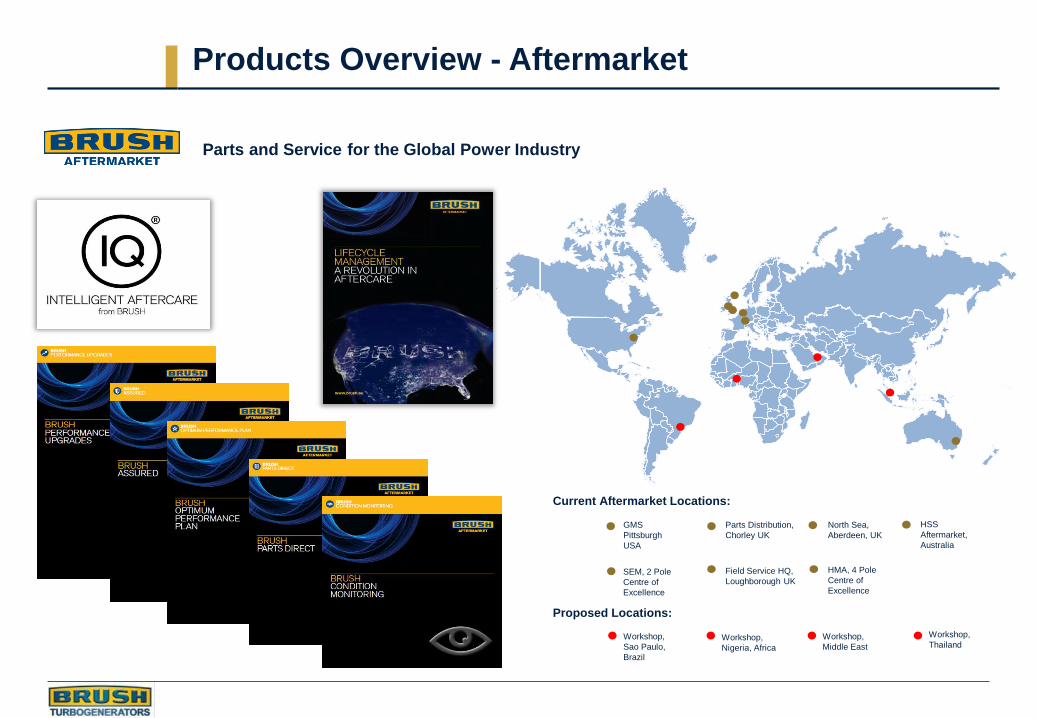
Products Overview - Aftermarket
Parts and Service for the Global Power Industry
Field Service HQ,
Loughborough UK
HMA, 4 Pole
Centre of
Excellence
SEM, 2 Pole
Centre of
Excellence
Current Aftermarket Locations:
Proposed Locations:
Workshop,
Sao Paulo,
Brazil
Workshop,
Nigeria, Africa
Workshop,
Middle East
Workshop,
Thailand
GMS
Pittsburgh
USA
Parts Distribution,
Chorley UK
North Sea,
Aberdeen, UK
HSS
Aftermarket,
Australia
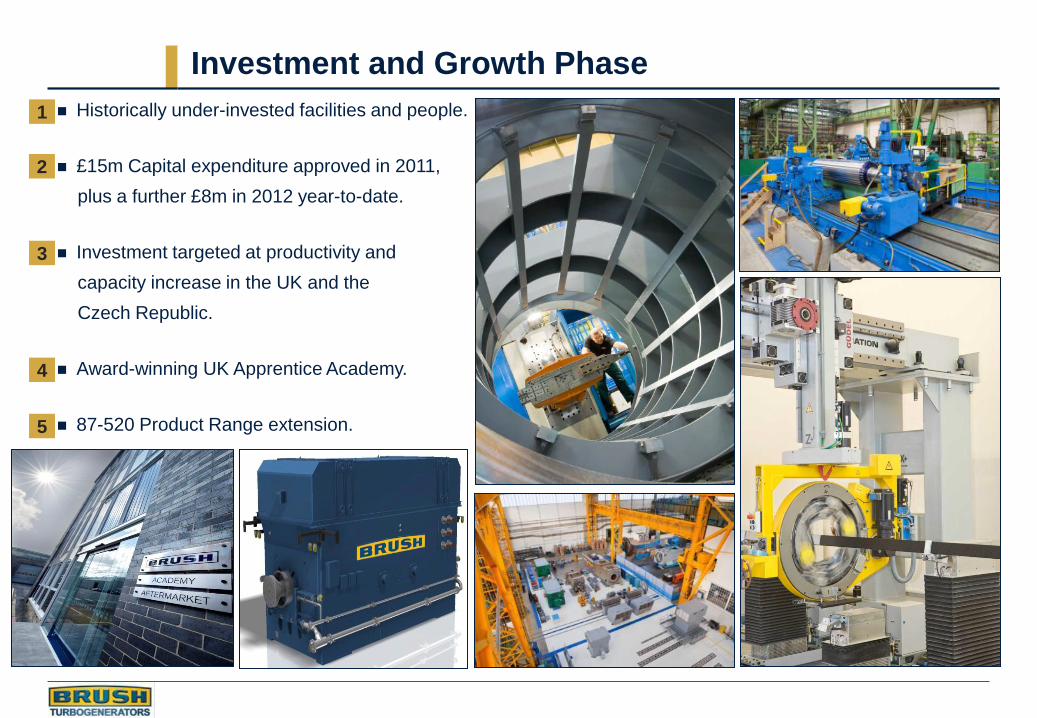
Investment and Growth Phase
Historically under-invested facilities and people.
£15m Capital expenditure approved in 2011,
plus a further £8m in 2012 year-to-date.
Investment targeted at productivity and
capacity increase in the UK and the
Czech Republic.
Award-winning UK Apprentice Academy.
87-520 Product Range extension.
2
3
1
4
5

Strong and respected brand with premium product
Supplying to over 130 markets worldwide
Good forecast market growth in next 5 years
Strong energy and Oil & Gas market exposure
Greater focus on Aftermarket
Installed fleet of 4,000+ generators
Significant investment opportunities
Strong productivity growth in the first 4 years – more of the same planned for the next 3
years as capital investment benefits come through
Growing profitability
Lean “as a way of life”
Reducing lead times even further
Extend current product range
1
2
3
4
5
Concluding Remarks


