Overview of error model for estimates of foreign-born immigration using data from the American Community Survey. Mary H. Mulry U.S. Census Bureau 2011 International Total Survey Error Workshop June 21, 2011. Background. - PowerPoint PPT Presentation
Overview of error model for estimates of foreign-born immigration using data from the American Community Survey Mary H. Mulry U.S. Census Bureau 2011 International Total Survey Error Workshop June 21, 2011
Transcript
Overview of error model for estimates of foreign-born immigration using data from the American Community Survey
Mary H. Mulry
U.S. Census Bureau
2011 International Total Survey Error Workshop
June 21, 2011
Background
• Two programs use estimates of foreign-born immigration based on data from the American Community Survey (ACS)– Demographic Analysis estimates of the U.S. population on
April 1, 2010 included estimates of foreign-born immigration each year between 2000 & 2010
– Population Estimates Program (PEP) estimates of the U.S. population on July 1 each year include estimates of foreign-born immigration in previous year.
• Main estimation method for foreign-born immigration uses the responses to two ACS questions – citizenship– residence one year ago (ROYA)
2
Goal
• Describe the uncertainty in the estimates of foreign-born immigration
• Design an error model that accounts for sampling and nonsampling errors
• Propose reasonable estimates based on studies of nonsampling errors in ACS for other purposes or studies of nonsampling errors in other surveys– Time limitations prevent us from conducting
studies to measure ACS nonsampling errors
3
Strategy
• Use the error model in the design of a simulation to study the propagation of errors
• Results of simulation study will produce sensitivity analyses that assess the uncertainty in estimates of foreign-born immigration
4
5
“Is this person a CITIZEN of the United States?”
Yes, U.S. citizen by naturalization – Print year of naturalization
____________ No, not a U.S citizen
ACS Question 8
Native
Foreign born
6
“Did this person live in this house or apartment 1 year ago?”
No, outside the United States and Puerto Rico – Print name of foreign country, or U.S. Virgin Islands, Guam, etc. below_____________________
ACS Question 15a
7
Estimate of foreign-born immigration T :
Notation (within a population control cell)
P = size of population
F = size of the foreign-born population (Question 8)
Y = size of foreign-born population whose residence one year ago was outside the U.S. (Question 14a)
= Postcensal Estimates Program estimate of P
= ACS estimate of proportion of household population who
are foreign-born (F/P) = ACS estimates of proportion of the foreign-born whose
residence one year ago was outside the U.S. (Y/F)
T P s rF Y
s F
rY
P
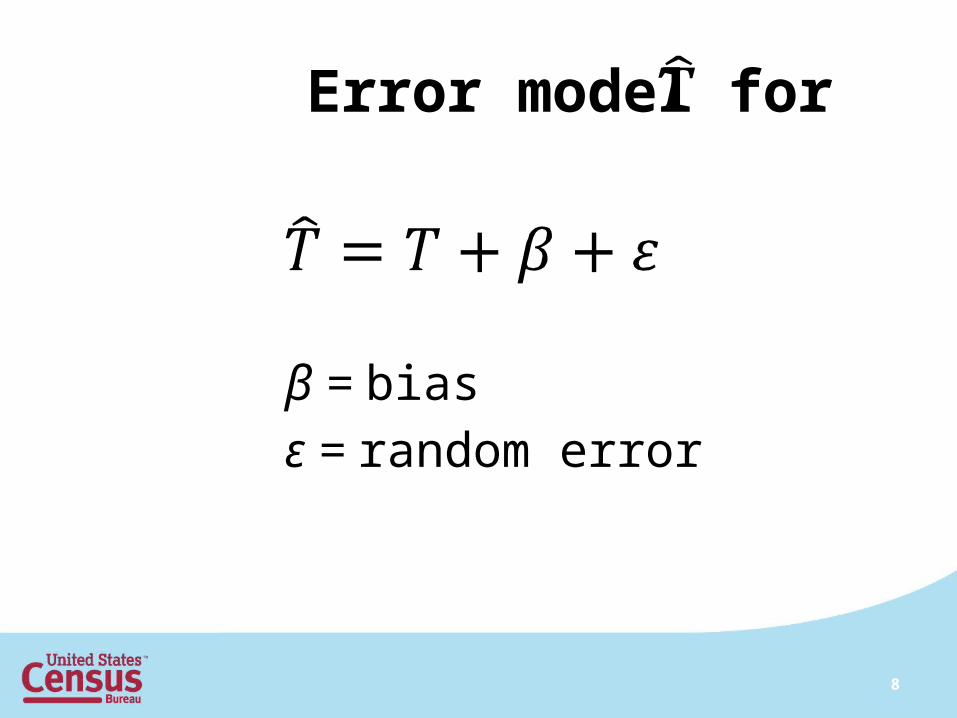
Error model for
β = bias
ε = random error
8
Model for bias in
β = βI + βD
βI = bias from inconsistency in characteristics
in ACS and PEP used in forming the control cells
βD = bias from errors in the data occurring
during collection and processing
9
Model for random error in
ε = εS + εS
εS = the random error due to sampling error
εM = the random error due to imputation for missing
data
10
Potential sources of inconsistencies in characteristics in PEP & ACS ( βI )
• ACS error in the coding of responses to race/Hispanic ethnicity questions
• Changes in reporting of race/Hispanic ethnicity since 2000• Census 2000 is the base for PEP estimates
• Differences between ACS & PEP data sources caused by errors or changes in methodology
11
Potential sources of data error in the PEP estimates ( βD )
• Coverage error in Census 2000 numbers (used as a base)
• Error in the data used to form updated population estimates during the decade
12
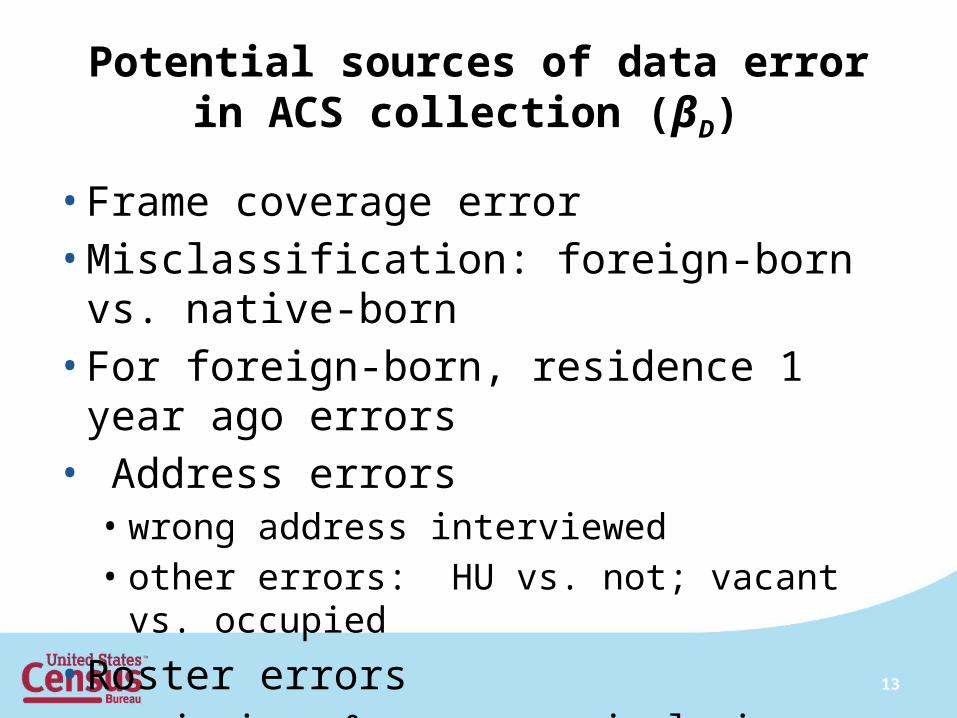
Potential sources of data errorin ACS collection (βD)
• Frame coverage error• Misclassification: foreign-born vs. native-born• For foreign-born, residence 1 year ago errors• Address errors
• wrong address interviewed• other errors: HU vs. not; vacant vs. occupied
• Roster errors• omissions & erroneous inclusions
13
Estimating bias due to ACS data collection error
ACS uses 3 modes in a sequence• mail, telephone, in-person
May have error estimates by mode only
Estimator of bias due to data collection error is weighted sum of estimated biases for modes
where weights are weighted proportion of responses by each mode
14
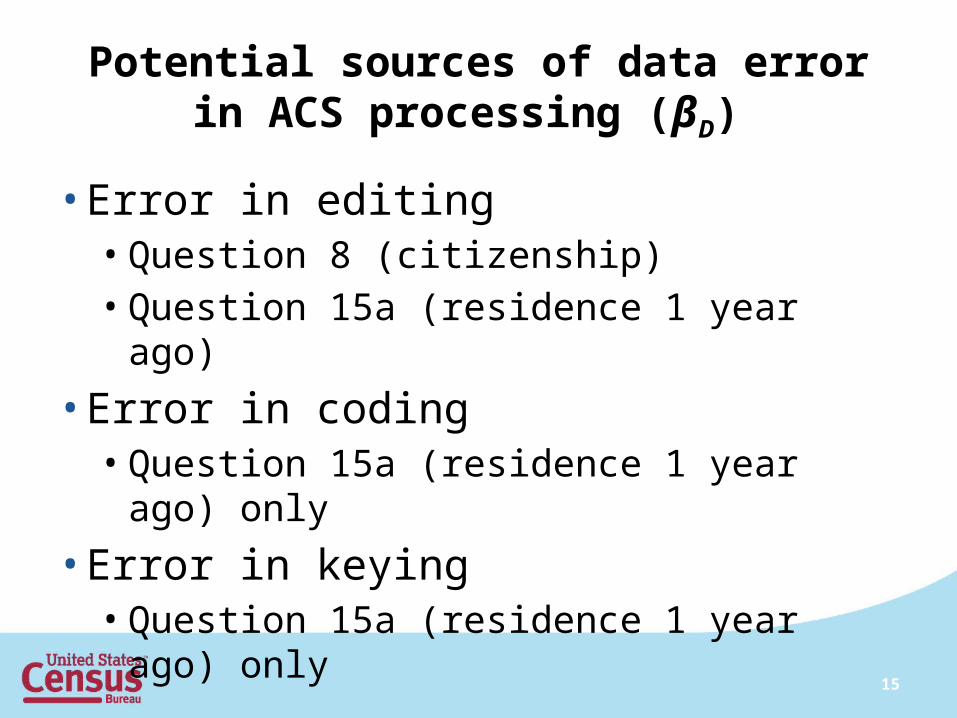
Potential sources of data errorin ACS processing (βD)
• Error in editing • Question 8 (citizenship) • Question 15a (residence 1 year ago)
• Error in coding • Question 15a (residence 1 year ago) only
• Error in keying • Question 15a (residence 1 year ago) only
15
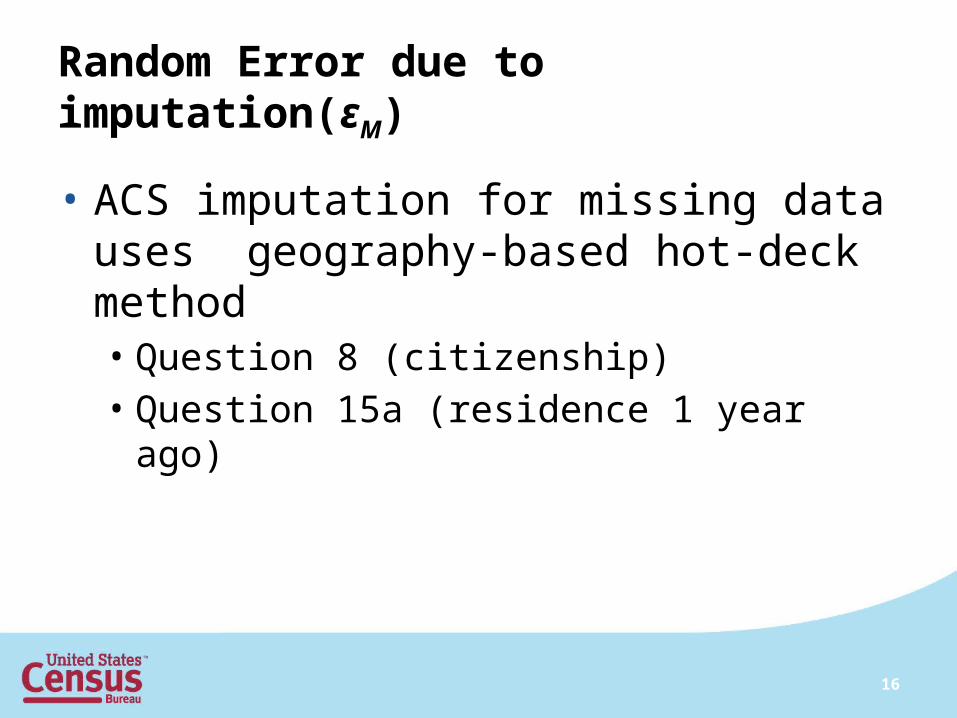
Random Error due to imputation(εM)
• ACS imputation for missing data uses geography-based hot-deck method• Question 8 (citizenship)• Question 15a (residence 1 year ago)
16
17
Random error due to sampling (εS)foreign-born immigration (thousands)
Period (July 1 to June 30) ACS year estimate standard error 1999-2000 2000 1,420 42.4 2000-2001 2001 1,421 35.2 2001-2002 2002 1,228 33.6 2002-2003 2003 1,025 28.82003-2004 2004 1,124 31.32004-2005 2005 1,188 17.82005-2006 2006 1,190 15.92006-2007 2007 1,114 20.32007-2008 2008 1,082 16.8
Notes: 1) Estimates are 3-year averages before 2005 due to smaller sample size 2) Standard errors calculated with weights prior to population controls
Indicators of General Quality of the ACS
• Coverage ratios for total populationACS estimate/PEP estimate
• Response ratesAccounts for ACS multi-mode collection and
selection of sub-sample for last mode
18
19
2000 2001 2002 2003 2004 2005 2006 2007 200860%
65%
70%
75%
80%
85%
90%
95%
100%
. Annual Response Rates: 2000-2008
ACS CPS NCVS NHIS SIPPYear
Rat
e
Note: ACS has longer response period and a sequence of 3 modes of collection.