Maryland HIV/AIDS Quarterly Update Second Quarter 2018 Data reported through June 30, 2018 Center for HIV Surveillance, Epidemiology and Evaluation Infectious Disease Prevention and Health Services Bureau Prevention and Health Promotion Administration Maryland Department of Health https://phpa.health.maryland.gov/OIDEOR/CHSE/pages/Home.aspx 1-800-358-9001 Table of Contents Table of Contents .................................................................................................................................................................. 1 Section I – Background Information ................................................................................................................................... 2 HIV/AIDS Reporting Requirements ......................................................................................................................................................... 2 For Assistance with HIV/AIDS Reporting ................................................................................................................................................ 2 Limitations in the HIV/AIDS Data ............................................................................................................................................................ 2 Stages of a Case of HIV/AIDS ................................................................................................................................................................ 3 Changes in Case Terminology................................................................................................................................................................ 3 Laboratory Data ...................................................................................................................................................................................... 4 Sources of Data ...................................................................................................................................................................................... 4 Tabulation of Column Totals ................................................................................................................................................................... 4 Data Suppression ................................................................................................................................................................................... 4 Glossary of Terms .................................................................................................................................................................................. 5 Section II – Adult/Adolescent Cases by Jurisdiction ........................................................................................................ 8 Table 1 – Adult/Adolescent HIV Diagnoses during 1/01/2017-12/31/2017, Linked to Care, Late Diagnosis, and First CD4 Test Result by Jurisdiction of Residence at HIV Diagnosis, Reported through 6/30/2018 .............................................................. 8 Table 2 – Adult/Adolescent AIDS Diagnoses during 1/01/2017-12/31/2017, Mean Years from HIV Diagnosis and Percent Late HIV Diagnosis, by Jurisdiction of Residence at AIDS Diagnosis, Reported through 6/30/2018 .............................................. 9 Table 3 – Adult/Adolescent HIV Cases Alive on 12/31/2017, by Jurisdiction of Residence at Diagnosis, Reported through 6/30/2018.............................................................................................................................................................................. 10 Table 4 – Adult/Adolescent HIV Cases Alive on 12/31/2017, by Jurisdiction of Residence at Diagnosis and Current Residence, Reported through 6/30/2018 ................................................................................................................................................. 11 Table 5 – CD4 Test Results during 1/01/2017-12/31/2017 for Adult/Adolescent HIV Cases Alive on 12/31/2017, by Jurisdiction of Current Residence, Reported through 6/30/2018 ................................................................................................................. 12 Table 6 – Viral Load Test Results during 1/01/2017-12/31/2017 for Adult/Adolescent HIV Cases Alive on 12/31/2017, by Jurisdiction of Current Residence, Reported through 6/30/2018 .......................................................................................... 13
Transcript
Maryland HIV/AIDS Quarterly Update Second Quarter 2018
Data reported through June 30, 2018
Center for HIV Surveillance, Epidemiology and Evaluation
Infectious Disease Prevention and Health Services Bureau
Table of Contents .................................................................................................................................................................. 1
Section I – Background Information ................................................................................................................................... 2 HIV/AIDS Reporting Requirements ......................................................................................................................................................... 2 For Assistance with HIV/AIDS Reporting ................................................................................................................................................ 2 Limitations in the HIV/AIDS Data ............................................................................................................................................................ 2 Stages of a Case of HIV/AIDS ................................................................................................................................................................ 3 Changes in Case Terminology ................................................................................................................................................................ 3 Laboratory Data ...................................................................................................................................................................................... 4 Sources of Data ...................................................................................................................................................................................... 4 Tabulation of Column Totals ................................................................................................................................................................... 4 Data Suppression ................................................................................................................................................................................... 4 Glossary of Terms .................................................................................................................................................................................. 5
Section II – Adult/Adolescent Cases by Jurisdiction ........................................................................................................ 8 Table 1 – Adult/Adolescent HIV Diagnoses during 1/01/2017-12/31/2017, Linked to Care, Late Diagnosis, and First CD4 Test
Result by Jurisdiction of Residence at HIV Diagnosis, Reported through 6/30/2018 .............................................................. 8 Table 2 – Adult/Adolescent AIDS Diagnoses during 1/01/2017-12/31/2017, Mean Years from HIV Diagnosis and Percent Late
HIV Diagnosis, by Jurisdiction of Residence at AIDS Diagnosis, Reported through 6/30/2018 .............................................. 9 Table 3 – Adult/Adolescent HIV Cases Alive on 12/31/2017, by Jurisdiction of Residence at Diagnosis, Reported through
6/30/2018 .............................................................................................................................................................................. 10 Table 4 – Adult/Adolescent HIV Cases Alive on 12/31/2017, by Jurisdiction of Residence at Diagnosis and Current Residence,
Reported through 6/30/2018 ................................................................................................................................................. 11 Table 5 – CD4 Test Results during 1/01/2017-12/31/2017 for Adult/Adolescent HIV Cases Alive on 12/31/2017, by Jurisdiction of
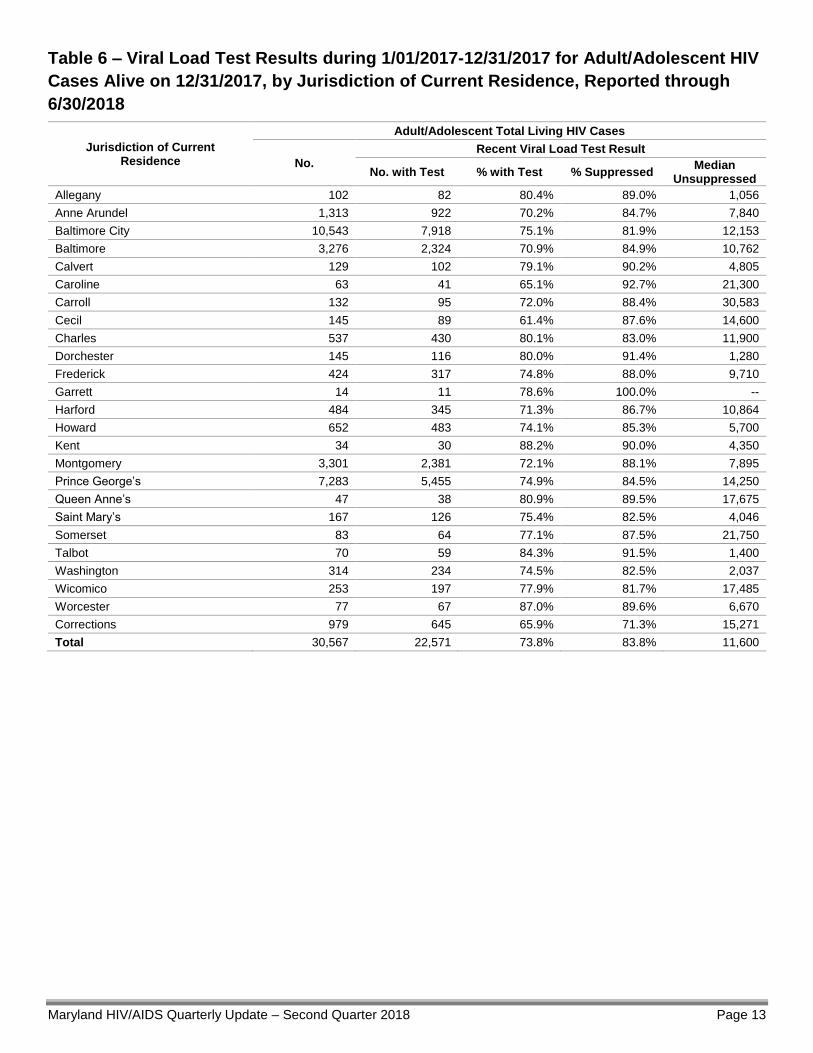
Current Residence, Reported through 6/30/2018 ................................................................................................................. 12 Table 6 – Viral Load Test Results during 1/01/2017-12/31/2017 for Adult/Adolescent HIV Cases Alive on 12/31/2017, by
Jurisdiction of Current Residence, Reported through 6/30/2018 .......................................................................................... 13
Maryland HIV/AIDS Quarterly Update – Second Quarter 2018 Page 2
Section I – Background Information
HIV/AIDS Reporting Requirements
The Maryland HIV/AIDS Reporting Act of 2007 went into effect on April 24, 2007. The law expanded HIV/AIDS reporting
and required that HIV cases be reported by name. The following highlights the reporting requirements of Health-General
Articles 18-201.1, 18-202.1, and 18-205 of the Annotated Code of Maryland, as specified in the Code of Maryland
Regulations (COMAR) 10.18.02.
• Physicians are required to report patients in their care with diagnoses of HIV or AIDS immediately to the Local
Health Department where the physician’s office is located by mailing the Maryland Confidential Morbidity Report
(DHMH 1140). Reports are also accepted by phone.
• Physicians are required to report infants born to HIV positive mothers within 48 hours to the Maryland Department
of Health by mailing the Maryland Confidential Morbidity Report (DHMH 1140). Reports are also accepted by
phone.
• Clinical and infection control practitioners in hospitals, nursing homes, hospice facilities, medical clinics in
correctional facilities, inpatient psychiatric facilities, and inpatient drug rehabilitation facilities are required to report
patients in the care of the institution with diagnoses of HIV or AIDS within 48 hours to the Local Health
Department where the institution is located by mailing the Maryland Confidential Morbidity Report (DHMH 1140).
Reports are also accepted by phone. Facilities with large volumes are encouraged to contact the Maryland
Department of Health to establish electronic reporting.
• Laboratory directors are required to report patients with laboratory results indicating HIV infection (e.g., positive
confirmatory HIV diagnostic tests, all CD4 immunological tests, all HIV viral load tests, and all HIV genotype and
phenotype tests) within 48 hours to the Local Health Department where the laboratory is located, or if out of state
to the Maryland Department of Health, by mailing the State of Maryland HIV/CD4 Laboratory Reporting Form
(DHMH 4492). Laboratories are encouraged to contact the Maryland Department of Health to establish electronic
reporting.
Reporting forms and instructions, including mailing addresses and phones numbers, are available on our website:
For assistance with reporting, including establishment of routine, electronic, or other alternate methods of reporting to the
Maryland Department of Health, please contact the Center for HIV Surveillance, Epidemiology and Evaluation in the
Maryland Department of Health at 410-767-5227.
Limitations in the HIV/AIDS Data
This epidemiological profile only contains data for HIV and AIDS cases that have been diagnosed by a health care
provider, were reported to the health department by name, and were residents of Maryland at the time of diagnosis or are
current residents of Maryland as of 12/31/2017. Nationally, it has been estimated that 14.5% of people living with HIV
infection are undiagnosed. In Maryland, it has been estimated that 14.0% of people living with HIV infection are
undiagnosed. Surveillance is the ongoing systematic collection, analysis, interpretation, and dissemination of case report
data. Case report data are only available for cases receiving medical care, often only at facilities in Maryland, and only
includes information that has been reported to the health department. Linkage to care data is based solely on laboratory
data reported to the health department.
This epidemiological profile provides estimates of living Maryland diagnosed cases by current residence as of 12/31/2017.
Residence at diagnosis and age at diagnosis are used exclusively to describe new HIV and AIDS diagnoses. Current
residence data are restricted to cases for which there is a case report form or laboratory test reported since 1/1/2009.
Restricting address data to recent years presents the most accurate data available and helps to account for cases that
Maryland HIV/AIDS Quarterly Update – Second Quarter 2018 Page 3
may have moved out of state whose data would no longer be reported in Maryland. However, current residence data
excludes cases that may still be residents of Maryland but have not received any HIV care during the most recent nine
and a half years. In addition, residence is dynamic, and cases may have resided at multiple addresses that cannot all be
represented in single time point estimates.
For additional information regarding current residence, please contact the Center for HIV Surveillance, Epidemiology and
Evaluation in the Maryland Department of Health at 410-767-5227.
Please note that data reported in the quarterly reports may not match data reported in the annual epidemiological
profiles due to differences in reporting periods. In addition, not all data has been geocoded in the quarterly reports
and therefore is preliminary. Geocoding is the process of assigning geographic identifiers to map features and
data records. Addresses are standard data elements required by law and submitted as part of reporting
requirements; however, the information may be incomplete which then requires a geocoding process to improve
the quality of data. This process is fully completed on the end-of-the-year data set.
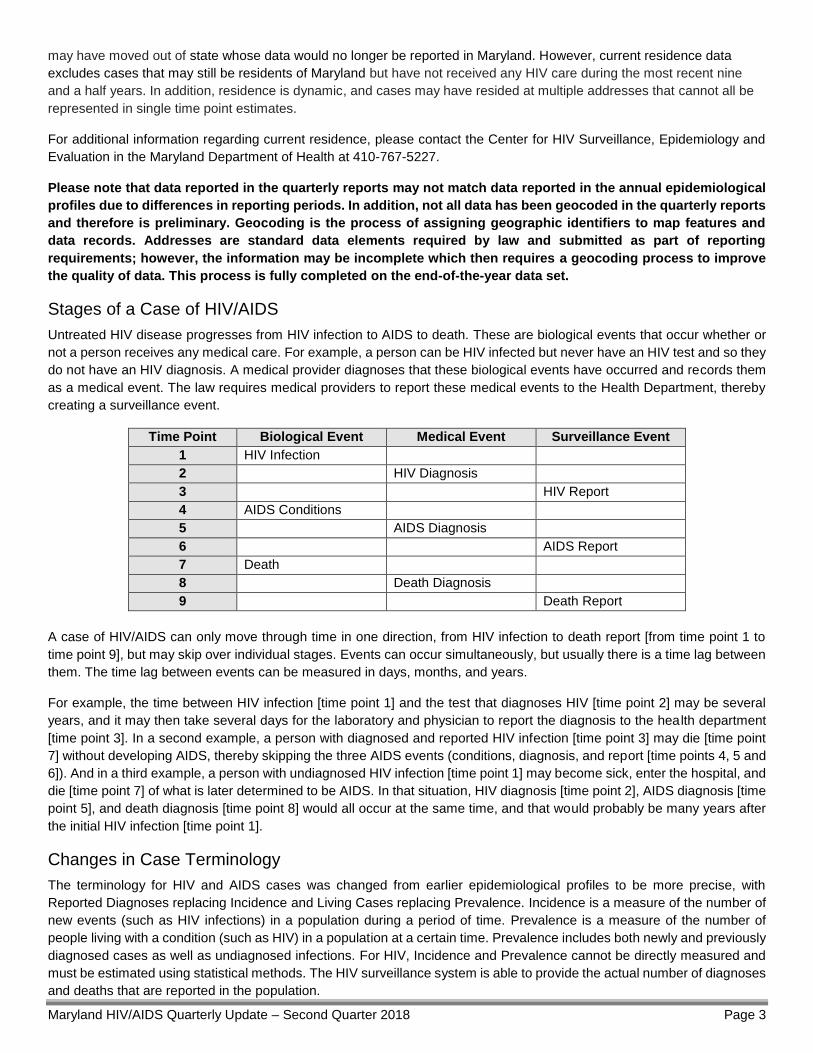
Stages of a Case of HIV/AIDS
Untreated HIV disease progresses from HIV infection to AIDS to death. These are biological events that occur whether or
not a person receives any medical care. For example, a person can be HIV infected but never have an HIV test and so they
do not have an HIV diagnosis. A medical provider diagnoses that these biological events have occurred and records them
as a medical event. The law requires medical providers to report these medical events to the Health Department, thereby
creating a surveillance event.
Time Point Biological Event Medical Event Surveillance Event
1 HIV Infection
2 HIV Diagnosis
3 HIV Report
4 AIDS Conditions
5 AIDS Diagnosis
6 AIDS Report
7 Death
8 Death Diagnosis
9 Death Report
A case of HIV/AIDS can only move through time in one direction, from HIV infection to death report [from time point 1 to
time point 9], but may skip over individual stages. Events can occur simultaneously, but usually there is a time lag between
them. The time lag between events can be measured in days, months, and years.
For example, the time between HIV infection [time point 1] and the test that diagnoses HIV [time point 2] may be several
years, and it may then take several days for the laboratory and physician to report the diagnosis to the health department
[time point 3]. In a second example, a person with diagnosed and reported HIV infection [time point 3] may die [time point
7] without developing AIDS, thereby skipping the three AIDS events (conditions, diagnosis, and report [time points 4, 5 and
6]). And in a third example, a person with undiagnosed HIV infection [time point 1] may become sick, enter the hospital, and
die [time point 7] of what is later determined to be AIDS. In that situation, HIV diagnosis [time point 2], AIDS diagnosis [time
point 5], and death diagnosis [time point 8] would all occur at the same time, and that would probably be many years after
the initial HIV infection [time point 1].
Changes in Case Terminology
The terminology for HIV and AIDS cases was changed from earlier epidemiological profiles to be more precise, with
Reported Diagnoses replacing Incidence and Living Cases replacing Prevalence. Incidence is a measure of the number of
new events (such as HIV infections) in a population during a period of time. Prevalence is a measure of the number of
people living with a condition (such as HIV) in a population at a certain time. Prevalence includes both newly and previously
diagnosed cases as well as undiagnosed infections. For HIV, Incidence and Prevalence cannot be directly measured and
must be estimated using statistical methods. The HIV surveillance system is able to provide the actual number of diagnoses
and deaths that are reported in the population.
Maryland HIV/AIDS Quarterly Update – Second Quarter 2018 Page 4
For this epidemiological profile, the reports received through a certain time (a quarter-year) are used to generate the number
of diagnoses during the prior years. This six-month lag allows for delays in reporting and time to complete investigations.
For example, the Reported HIV Diagnoses for 1/01/2017-12/31/2017 are the total of the reported HIV cases with or without
an AIDS diagnosis, diagnosed with HIV during 1/01/2017-12/31/2017, as reported by name through 6/30/2018.
To calculate the number of Living Cases we count all Reported Diagnoses from the beginning of the epidemic (all the
Reported HIV Diagnoses each year) and subtract all Reported Deaths. For example, the Total Living HIV Cases on
12/31/2017 are the total of the reported HIV Cases with or without an AIDS diagnosis and not reported to have died as of
6/30/2018 as reported by name through 6/30/2018.
Laboratory Data
CD4+ T-lymphocyte tests are measures of a person’s immune system function. An HIV infected adult is considered to have
AIDS if they have less than 200 CD4+ cells per microliter of blood or if the percent of T-Lymphocyte cells that are CD4+
cells is less than 14%. Viral load (VL) tests are measures of the amount of HIV in a person’s body. The goal of HIV treatment
is to have a very low number of copies of virus per milliliter of blood, below what the test can measure, which is called an
undetectable level. Low levels of VL, such as less than 200 copies per milliliter of blood, are known as viral suppression.
Treatment recommendations are that a person in HIV medical care should have their CD4 and VL levels measured regularly,
at least once per year. We use the presence of these lab tests as an indicator that someone has been “linked to care” after
diagnosis or is “retained in care.”
Sources of Data
Information on HIV and AIDS diagnoses, including residence at diagnosis, current residence, age, race/ethnicity, sex at
birth, current gender, country of birth, vital status, HIV exposure category, and CD4 and HIV viral load test results are from
the Maryland Department of Health’s Enhanced HIV/AIDS Reporting System (eHARS), June 30, 2018.
Population data by sex, age, and race/ethnicity are from the July 1, 2017 U.S. Census Estimates. Due to estimation
limitations, some population totals may not equal the sum of its components.
Tabulation of Column Totals
Numbers in figures, tables and generally in the text have been rounded. Discrepancies in tables between totals and sums
of components are due to rounding.
Data Suppression
In order to protect the confidentiality of reported HIV cases, data are suppressed in the following instances:
• Data describing a demographic group or geographic area (e.g. ZIP code) with a population less than 1,000 people.
• All clinical/laboratory information if it is describing less than 5 cases.
• If any cell is suppressed, additional cells are also suppressed as necessary to prevent back calculation of the
suppressed cell(s).
Maryland HIV/AIDS Quarterly Update – Second Quarter 2018 Page 5
Glossary of Terms Adult/Adolescent Living HIV Cases with AIDS: Reported HIV diagnoses with an AIDS diagnosis, age 13 years or older,
and not reported to have died as of 6/30/2018.
Adult/Adolescent Living HIV Cases without AIDS: Reported HIV diagnoses without an AIDS diagnosis, age 13 years
or older, and not reported to have died as of 6/30/2018.
Adult/Adolescent Reported AIDS Diagnoses: Reported HIV diagnoses, age 13 years or older at HIV diagnosis, with an
initial AIDS diagnosis during the specified year.
Adult/Adolescent Reported HIV Diagnoses: Reported HIV diagnoses, age 13 years or older at HIV diagnosis, with an
initial HIV diagnosis during the specified year.
Adult/Adolescent Total Living HIV Cases: Reported HIV diagnoses with or without an AIDS diagnosis, age 13 years or
older, and not reported to have died as of 6/30/2018.
CD4 Result Distribution (<200, 200-349, 350-499, 500+): Percent of adult/adolescent living HIV cases with a recent
CD4 test result distributed by the CD4 count results (cells per microliter).
CD4 With Test: Number and percent of adult/adolescent total living HIV cases with a recent CD4 test result.
Corrections: Residence in a state or federal prison. Does not include local jails and detention centers.
Current Residence: Jurisdiction of residence from the most recent report since 1/1/2009.
First CD4 Test Result Percent: Percent of adult/adolescent reported HIV diagnoses with the first CD4 test result
reported within 12 months following the initial HIV diagnosis.
First CD4 Test Result Median Count: Median CD4 count (cells per microliter) of the first CD4 test result reported within
12 months following initial HIV diagnosis.
Jurisdiction of Current Residence: Jurisdiction of residence from the most recent report since 1/1/2009.
Jurisdiction of Residence: Jurisdiction of residence at diagnosis or current residence.
Jurisdiction of Residence at AIDS Diagnosis: Jurisdiction of residence at time of initial AIDS diagnosis.
Jurisdiction of Residence at Diagnosis: Jurisdiction of residence at later time of initial HIV diagnosis or time of initial
AIDS diagnosis.
Jurisdiction of Residence at HIV Diagnosis: Jurisdiction of residence at time of initial HIV diagnosis.
Late HIV Diagnosis: Percent of adult/adolescent reported HIV diagnoses with an initial AIDS diagnosis less than or equal
to 12 months after their initial HIV diagnosis.
Linked to Care: Percent of adult/adolescent reported HIV diagnoses with a reported CD4 or viral load test performed less
than or equal to 1 month or 3 months after their initial HIV diagnosis.
Mean Years from HIV Diagnosis: Mean number of years from initial HIV diagnosis to initial AIDS diagnosis for cases
with a reported AIDS diagnosis.
Median Count: Median CD4 count (cells per microliter), among adult/adolescent total living HIV cases, of the most recent
CD4 test result measured in the specified year.
Median Unsuppressed: Median unsuppressed viral load (copies per milliliter) among adult/adolescent total living HIV
cases with the most recent viral load test result measured in the specified year of 200 copies per milliliter or greater.
Percent Change: The percent change in number of adult/adolescent total living HIV cases from residence at diagnosis to
current residence.
Percent Late HIV Diagnosis: Percent of adult/adolescent reported AIDS diagnoses with an initial HIV diagnosis less than
or equal to 12 months prior to their initial AIDS diagnosis.
Percent Suppressed: Percent of adult/adolescent total living HIV cases with the most recent viral load measured in the
specified year of less than 200 copies per milliliter.
Population Age 13+: Population age 13 years or older, estimate for 7/1/2017.
Maryland HIV/AIDS Quarterly Update – Second Quarter 2018 Page 6
Rate: Number of HIV cases divided by the population and multiplied by 100,000.
Ratio (1 in X): Number of people for every 1 living HIV case in the population, or 1 living HIV case in every X number of
people.
Recent CD4 Test Result: The most recent CD4 test result measured in the specified year.
Recent Viral Load Test Result: The most recent viral load test result measured in the specified year.
Residence at Diagnosis: Jurisdiction of residence at later time of initial HIV diagnosis or initial AIDS diagnosis.
Viral Load With Test: Number and percent of adult/adolescent total living HIV cases with a recent viral load test result.
Maryland HIV/AIDS Quarterly Update – Second Quarter 2018 Page 7
MDH Non-Discrimination Statement
The Maryland Department of Health (MDH) complies with applicable Federal civil right laws and does not discriminate on the basis of race, color, national origin, age, disability in its health programs and activities.
English Help is available in your language: 410-767-5227 (TTY: 1-800-735-2258). These services are available for free.
Español/Spanish Hay ayuda disponible en su idioma: 410-767-5227 (TTY: 1-800-735-2258). Estos servicios están disponibles gratis.
Suggested Citation: Maryland HIV/AIDS Quarterly Update, Second Quarter 2018. Baltimore, MD: Center for HIV Surveillance, Epidemiology and Evaluation, Infectious Disease Prevention and Health Services Bureau, Prevention and Health Promotion Administration, Maryland Department of Health. July 2018.
Maryland HIV/AIDS Quarterly Update – Second Quarter 2018 Page 8
Section II – Adult/Adolescent Cases by Jurisdiction Table 1 – Adult/Adolescent HIV Diagnoses during 1/01/2017-12/31/2017, Linked to Care,
Late Diagnosis, and First CD4 Test Result by Jurisdiction of Residence at HIV