34


Maryland Medicaid Nursing Facility Reimbursement as of January 1, 2017 (and beyond)
Presented By: Patrick V. Trotta, CPA, CHCPartner – Hertzbach and Company

Overview of Presentation
• Changes effective January 1, 2017
• Review of (New) Prospective Payment System/Methodologies• Administrative and Routine• Other Patient Care• Nursing• Capital
• Budget Adjustment Factor
• Pay for Improvement / Performance
• Key Areas for Management to Monitor
• Other Issues for the Future

Medicaid Rates and Changes – January 1, 2017
• 100% of rates under the “New” System• Current rates are 25% of the indexed 2012 rates plus 75% of the new
methodology rates
• New Budget Adjustment Factor
• New CMI quarterly adjustment
• No Hold Harmless
• Prices

New Reimbursement SystemAdministrative and Routine Costs
• Indexed from mid-point of cost report period to mid-point of rate year
• Adjusted for minimum occupancy, if needed (currently 91%)
• For each region, total cost ppd’s are arrayed to find the median cost based on accumulated Medicaid days
• The median cost x 1.025 = final price for each region

2015 Medicaid Cost ReportsAdministrative & Routine (non-indexed raw data)
Administration and Routine CostsCurrent
Average Median High Low Price
Baltimore Metro 80.04 76.44 149.22 54.16 79.43
Baltimore City 92.95 81.42 196.22 63.20 84.48
Non-Metro 74.13 70.81 102.82 54.70 72.30
Washington 84.87 76.79 220.60 56.78 79.39
ADMINISTRATIVE
& ROUTINE
ADMINISTRATIVE
& ROUTINE

2015 Medicaid Cost ReportsAdministrative & Routine (non-indexed raw data)
Administration and Routine Costs
Average Median High Low Average Median High Low
Baltimore Metro 40.03 37.54 73.54 22.45 40.01 38.09 89.30 25.53
Baltimore City 46.20 39.90 112.05 27.86 46.75 40.59 84.17 33.44
Non-Metro 35.63 34.21 56.41 21.72 38.50 35.03 61.09 25.99
Washington 42.43 37.67 114.63 23.15 42.44 39.96 105.97 26.46
ROUTINEADMINISTRATIVE ROUTINEADMINISTRATIVE

Administration and Routine CostsAverage Median Average Median Average Median Average Median
Baltimore Metro 12.60 11.57 4.35 4.04 6.81 6.25 11.80 11.36
Baltimore City 11.82 10.39 4.74 4.30 7.87 7.86 16.71 13.00
Non-Metro 12.92 9.73 4.18 3.96 5.97 5.65 12.33 11.00
Washington 10.72 11.26 4.11 4.40 6.76 6.67 14.31 13.39
Dietary Laundry Housekeping Maintenance
2015 Medicaid Cost ReportsAdministrative & Routine (non-indexed raw data)

New Reimbursement SystemOther Patient Care Costs
• Indexed from mid-point of cost report period to mid-point of rate year
• Adjusted for minimum occupancy, if needed
• For each region, total cost ppd’s are arrayed to find the median cost based on accumulated Medicaid days.
• The median cost x 1.07 = final price for each region

2015 Medicaid Cost ReportsOther Patient Care (non-indexed raw data)
Other Patient CareCurrent
Average Median High Low Price
Baltimore Metro 17.04 16.11 36.01 7.26 19.64
Baltimore City 17.17 15.50 34.09 9.34 21.58
Non-Metro 17.00 16.36 37.43 8.44 18.24
Washington 17.20 15.33 40.68 8.62 20.07
OPC OPC
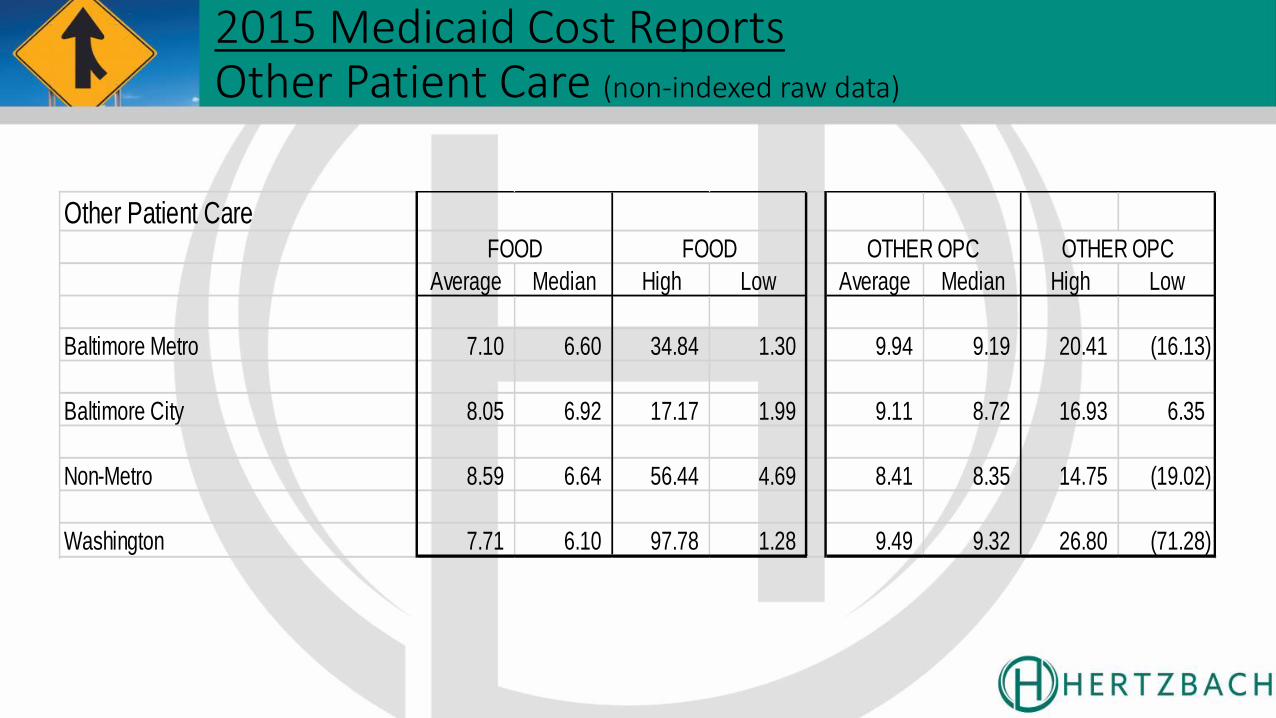
2015 Medicaid Cost ReportsOther Patient Care (non-indexed raw data)
Other Patient Care
Average Median High Low Average Median High Low
Baltimore Metro 7.10 6.60 34.84 1.30 9.94 9.19 20.41 (16.13)
Baltimore City 8.05 6.92 17.17 1.99 9.11 8.72 16.93 6.35
Non-Metro 8.59 6.64 56.44 4.69 8.41 8.35 14.75 (19.02)
Washington 7.71 6.10 97.78 1.28 9.49 9.32 26.80 (71.28)
OTHER OPC OTHER OPCFOOD FOOD
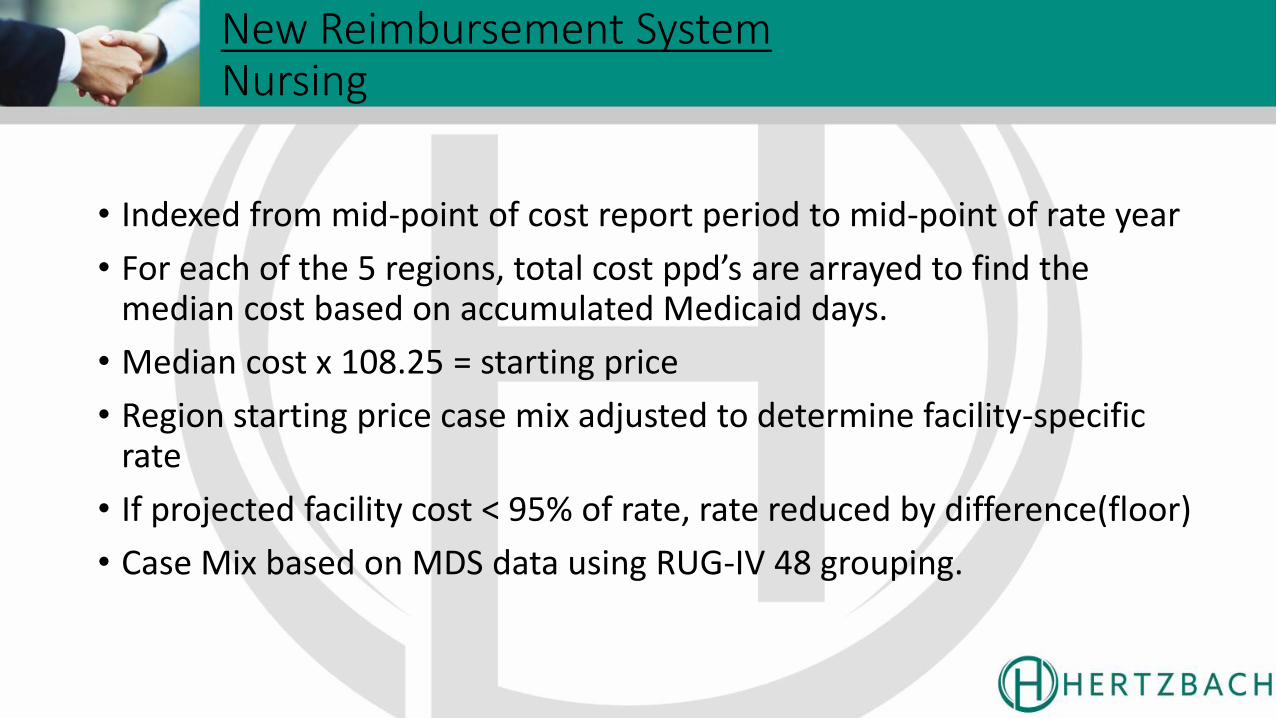
New Reimbursement SystemNursing
• Indexed from mid-point of cost report period to mid-point of rate year
• For each of the 5 regions, total cost ppd’s are arrayed to find the median cost based on accumulated Medicaid days.
• Median cost x 108.25 = starting price
• Region starting price case mix adjusted to determine facility-specific rate
• If projected facility cost < 95% of rate, rate reduced by difference(floor)
• Case Mix based on MDS data using RUG-IV 48 grouping.
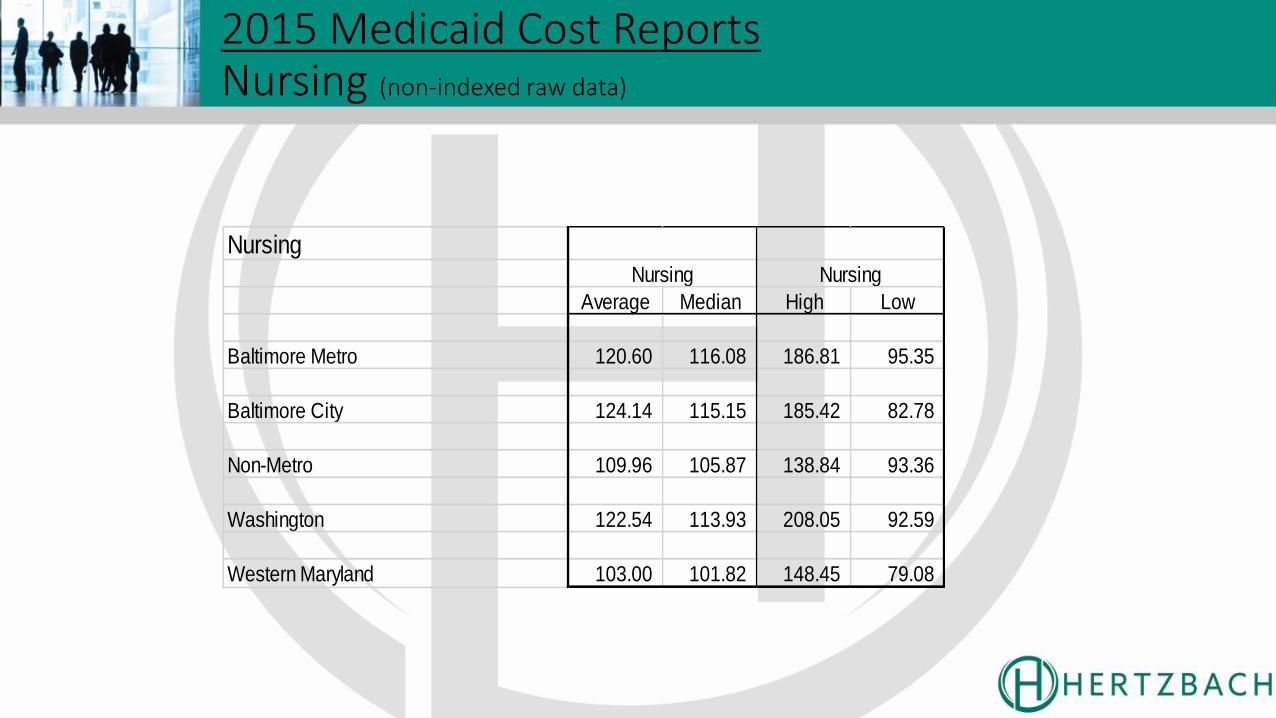
2015 Medicaid Cost ReportsNursing (non-indexed raw data)
Nursing
Average Median High Low
Baltimore Metro 120.60 116.08 186.81 95.35
Baltimore City 124.14 115.15 185.42 82.78
Non-Metro 109.96 105.87 138.84 93.36
Washington 122.54 113.93 208.05 92.59
Western Maryland 103.00 101.82 148.45 79.08
Nursing Nursing

New Reimbursement SystemNursing Rates and CMI Creep
• Case Mix Index Creep:
• All new reimbursement systems that start utilizing CMI indexes experience what is known as “CMI Creep”
• Most facility’s CMI’s go up during the first 3 years of the new system, due to better training / recognition / utilization of MDS programs.
• Most reimbursement methodologies that utilize CMI’s have designed methods that negate the overall increases in funding that are suggested by the increased CMI’s.

New Reimbursement SystemNursing Rates and CMI Creep
• After the region Nursing Price is set:
• The facility’s rate is adjusted in by the facility’s Cost Report CMI
• Then, the facility’s rate is adjusted out by the State Average Medicaid CMI****
• Next, the facility’s rate is adjusted in by the facility’s Quarterly Medicaid CMI
• Then, the facility’s rate is adjusted back out by the facility’s Cost Report CMI
• ***** Key Step – “Normalization”
• Step 2 uses quarterly Case Mix Proportional Adjustment

New Reimbursement SystemNursing Rates and CMI Creep
October 2016 Rate Letter
15 Latest indexed Nursing Service Cost 125.25 for facility
16 Indexed Nursing Service Price 129.71 for region
10 Cost Report Period CMI 0.9609 for facility
11 Statewide Average Medicaid CMI 1.0721
12 Quarter Ending Facility Medicaid CMI 1.0055 for facility
13 Case Mix Proportional Adjustment 0.991674 "creep" and acuity adjustment factor
14 Qtr Ending Adjusted Facility Medicaid CMI 0.9971 12 x 13
17 Adjusted to Facility Total Facility CMI a 124.64 16 (Price) x 10 (Cost Report CMI)
17 Adjusted to Facility Total Facility CMI b 116.26 / 11 (State Average Medicaid CMI)
"Normalization"
18 Initial Nursing Service Rate 120.64 17 (Adjusted Rate Facility Total CMI)
x 14 (Qtr Ending Facility Adjusted Mcaid CMI)
/ 10 (Cost Report Period CMI)

New Reimbursement SystemNursing Rates and CMI
• CMI Summary:
• Changes in a facility’s Quarterly index are relative to changes to the State Medicaid CMI.
• If both go up or down the same %, the facility’s rate will stay the same.
• Conversely, the facility’s rate will change based on the comparative % changes between the 2 indexes.
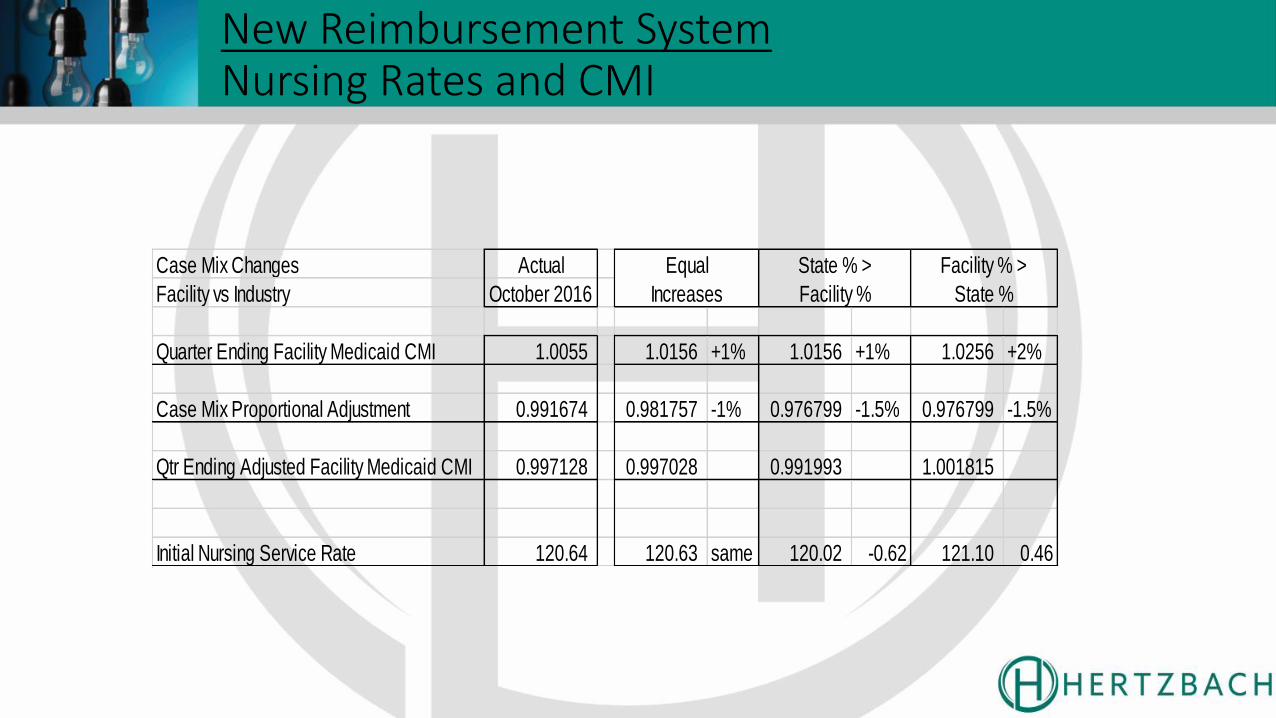
New Reimbursement SystemNursing Rates and CMI
Case Mix Changes Actual
Facility vs Industry October 2016
Quarter Ending Facility Medicaid CMI 1.0055 1.0156 +1% 1.0156 +1% 1.0256 +2%
Case Mix Proportional Adjustment 0.991674 0.981757 -1% 0.976799 -1.5% 0.976799 -1.5%
Qtr Ending Adjusted Facility Medicaid CMI 0.997128 0.997028 0.991993 1.001815
Initial Nursing Service Rate 120.64 120.63 same 120.02 -0.62 121.10 0.46
Equal
Increases
State % >
Facility %
Facility % >
State %

New Reimbursement SystemCapital Costs
• Fair Rental Value
• Real Estate Taxes pass through
• Quality Assessment (Provider Tax) pass through (under Capital in old system)
• Lessor of $110,000 per bed or Appraisal Value per bed
• Rental factor of 10% for Baltimore City and 8% for everywhere else
• Sum divided by actual or minimum occupancy days for rate
• Real Estate taxes -> pass-thru of actual

New Reimbursement SystemCapital Costs
Appraisal: March 2015 March 2015
Land 900,000 1,300,000
Building 7,000,000 9,000,000
Equipment 150,000 200,000
8,050,000 10,500,000
# of beds 90 90
Value per bed 89,444 116,667
Maximum Allowed 110,000 110,000
Allowed Value 89,444 110,000
Allowed Total 8,050,000 9,900,000
Rental Factor*** 8% 10%
Facility FRV 644,000 990,000
Census 92% 30,200 30,200
FRV per day 21.32 32.78
*** not Balto. City *** Balto. City
under Ceiling over ceiling
Medicaid Rates and Changes – January 1, 2017Budget Adjustment Factor (BAF)
• Used to adjust total program costs calculated by the reimbursement system compared to the actual program budget.
• New system is “budget neutral”

Medicaid Rates and Changes – January 1, 2017Budget Adjustment Factor
New Budget Adjustment Factor (BAF)
Currently 93.924%
January 1, 2017 91.788%
DIFFERENCE (2.1365%)
What does this mean?

Medicaid Rates and Changes – January 1, 2017100% New System with New BAF
Maryland Nursing Home
Total
Rate Q/A Net Rate
10/1/16 Medicaid Rate 236.78 19.90 216.88
Paid Gross
Rate Factor Rate
Prospective Rate 175.09 75% 233.45
2012 Rate + 2% 55.82 25% 223.28
Sub-Total 230.91
Budget Adjustment Factor 0.9392
Net Rate 216.88
Maryland Nursing Home
Total
Rate Q/A Net Rate
1/1/17 Medicaid Rate 234.18 19.90 214.28
Paid Gross
Rate Factor Rate
Prospective Rate 233.45 100% 233.45
2012 Rate + 2% - 0% 223.28
Sub-Total 233.45
Budget Adjustment Factor 0.9179
Net Rate 214.28
New System Change 2.54
BAF Change (5.14)
Net Rate Change (2.60)

Pay 4 Performance
• Funding – from rates – no “new” monies
• Nursing staffing levels and staff stability – 40%• Staffing Levels – 20% Goal Hours (Acuity) vs Actual Hours• Staff Stability – 20% % > 2 years
• MD Health Care Commission Family Satisfaction Survey – 40%• General Satisfaction – 20%• Care and Environment – 20%
• MDS Quality Indicators – 16%• 6 Quality indicators – 2.67% each
• Infection Control Professional on staff – 2%
• Staff Immunizations – 2%
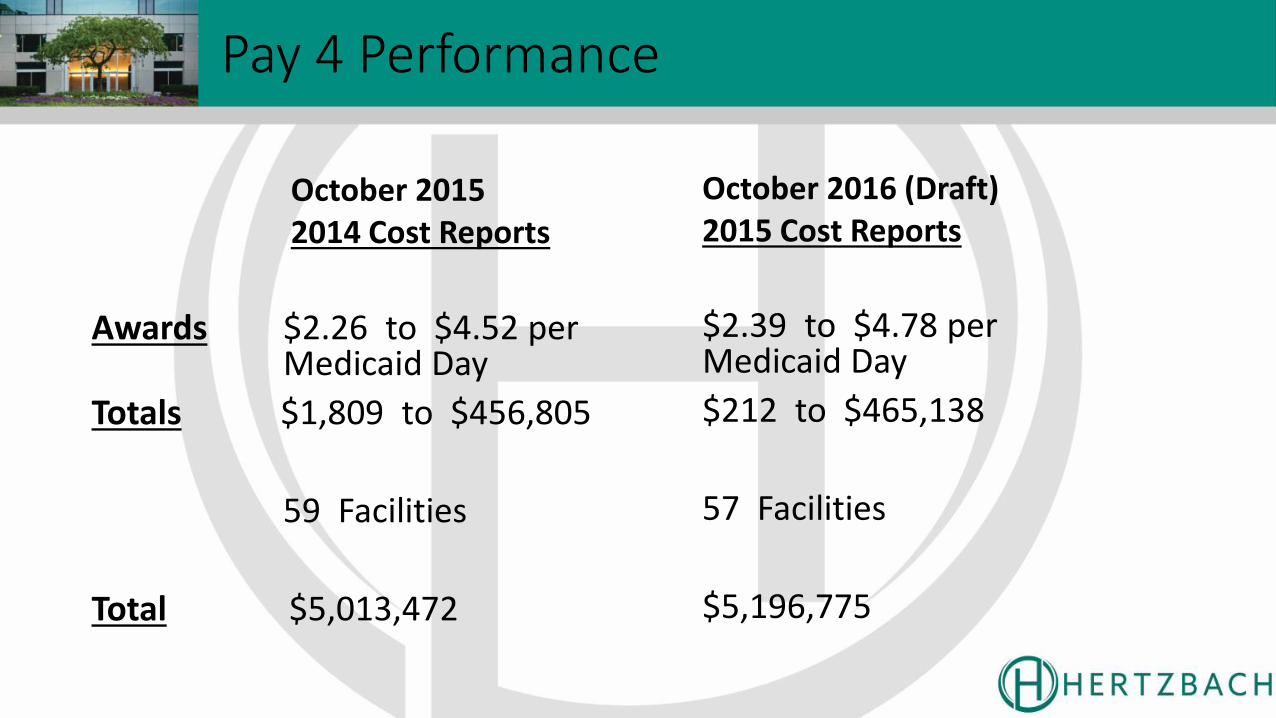
Pay 4 Performance
October 20152014 Cost Reports
Awards $2.26 to $4.52 per Medicaid Day
Totals $1,809 to $456,805
59 Facilities
Total $5,013,472
October 2016 (Draft)2015 Cost Reports
$2.39 to $4.78 per Medicaid Day
$212 to $465,138
57 Facilities
$5,196,775

Pay 4 Improvement
• Total Points this year, less
• Total Points last year
• Benchmark (highest difference) and Cut-Off (lowest difference awarded)
• Will not receive an improvement score or award if receiving an award for Performance

Pay 4 Improvement
October 20152014 Cost Reports
Range $.43 to $.86 per Medicaid Day
Totals $5,699 to $43,537
54 Facilities
Total $900,005
October 2016 (Draft)2015 Cost Reports
$.51 to $1.02 per Medicaid Day
$6,947 to $48,845
48 Facilities
$916,654

Key Areas to Monitor
Nursing
• CMI as compared to industry• CMI changes
• Full phase-in
• Continue to train staff on MDS/Case Mix• Remember – you are competing with your peers
• Control costs

Key Areas to Monitor
Routine and Administrative / Other Patient Care
• Monitor Rates and specific costs within industry / region
• Incentives to operate effiently and control costs

Key Areas to Monitor
Capital
• No changes in Capital Rate (increase/decrease) between re-basings
• No provisions for $110,000 ceiling change
• Monitor appraisal process – especially if under the ceiling• Done at least every 4 years
• Not indexed each year
• Monitor appraisal timing for inclusion in rates• Done by April 30th for July 1 rates
• Real Estate taxes

Key Areas to Monitor
General
• Monitor Budget Adjustment Factor
• Budget increase versus “fully funded” (State funding)
• Rate changes due to 100% “New” system phase-in on January 1, 2017
• CMI change compared to industry (quarterly)
• New appraisals

New Strategies
• Patient Centered Systems
• Patient Outcomes
• Performance Based Reimbursement
• Bundled Payments
• Managed Care
• Integrated Practice Units (IPU’s)
• Measurement of Outcomes and Costs for Every Patient
New Strategies (con’t)
• Integration of Care Delivered Across Separate Facilities
• Expansion of Excellence Geographically
• Integrate IT Systems (EMR)
• HEDIS (Healthcare Effectiveness Data & Information Set)
• Patient Centered Medical Homes
• Outcomes that Matter to Residents / Patients

Questions?


