Maryland Department of Health and Mental Hygiene Center for Maternal and Child Health Vital Statistics Administration Robert L. Ehrlich, Jr., Governor; Michael S. Steele, Lieutenant Governor; S. Anthony McCann, Secretary Maryland PRAMS Report 2003 Births PRAMS Pregnancy Risk Assessment Monitoring System M A R Y L A N D
Transcript
Maryland Department of Health and Mental HygieneCenter for Maternal and Child Health Vital Statistics Administration
PRAMSPRAMSPRAMSPregnancy Risk Assessment Monitoring System
Robert L. Ehrlich, Jr., Governor; Michael S. Steele, Lieutenant Governor; S. Anthony McCann, Secretary
MarylandPRAMSReport2003 Births
PRAMSPregnancy Risk Assessment
Monitoring System
M A R Y L A N D
“I hope the information I provided will help keep mothersand babies healthier and happier!”
PRAMS mother
Maryland PRAMSReport
2003 Births
Family Health AdministrationCenter for Maternal and Child Health
Bonnie Birkel, C.R.N.P., M.P.H., DirectorMaureen Edwards, M.D., M.P.H., Medical Director
Vital Statistics AdministrationIsabelle Horon, Dr.P.H., Director
Maryland PRAMS 2001, 2002, and 2003 Surveillance and Selected Healthy People 2010 Objectives . . . . .
Preconception Factors . . . . . . . . . . . . . . . . . . . . . . . . . . . . . . . . . . . . . . . . . . . . . . . . . . . . . . . . . . . . . . . . . .Comments from PRAMS MothersIntendedness of PregnancyContraceptive Use Among Mothers with an Unintended PregnancyReasons for Not Using Birth Control Among Mothers With an Unintended PregnancyMultivitamin Use in Month Before PregnancyUse of Fertility DrugsUse of Assisted Reproductive Technology
Prenatal Factors . . . . . . . . . . . . . . . . . . . . . . . . . . . . . . . . . . . . . . . . . . . . . . . . . . . . . . . . . . . . . . . . . . . . . . .Comments from PRAMS MothersTrimester of Pregnancy ConfirmationTrimester Prenatal Care BeganSatisfaction with Time of Initiation of Prenatal CareReasons for Late Prenatal CareTopics Discussed During Prenatal Care VisitsStress during the 12 Months Before DeliveryComplications During PregnancyHospital Admissions and Bedrest During Pregnancy Due to ComplicationsRecommendation of One or More Weeks of Bedrest During PregnancyDental Care During Pregnancy
Health Care Coverage and WIC Participation . . . . . . . . . . . . . . . . . . . . . . . . . . . . . . . . . . . . . . . . . . . . .Comments from PRAMS MothersHealth Insurance Just Before PregnancyMedicaid Coverage Just Before PregnancySource of Payment for Prenatal CareWIC Participation during PregnancySource of Payment for Delivery
v
vv
vivi
vi
1
2
3
56789
101112
131415161718192021222324
25262728293031
TABLE OF CONTENTS
iii
iv
Selected Risk Factors . . . . . . . . . . . . . . . . . . . . . . . . . . . . . . . . . . . . . . . . . . . . . . . . . . . . . . . . . . . . . . . . . . .Comments from PRAMS MothersAsked About Smoking During Prenatal CareSmoking During the Three Months Before PregnancySmoking During the Last Three Months of PregnancySmoking After PregnancyAsked About Alcohol Use During Prenatal CareAlcohol Use During the Three Months Before PregnancyAlcohol Use During the Last Three Months of PregnancyAlcohol Binges During the Three Months Before PregnancyAlcohol Binges During the Last Three Months of PregnancyPhysical Abuse by Husband or Partner During the 12 Months Before PregnancyPhysical Abuse by Non-Partner During the 12 Months Before PregnancyPhysical Abuse by Husband or Partner During PregnancyPhysical Abuse by Non-Partner During PregnancySeat Belt Use by Mother During PregnancySeat Belt Use by Mother Postpartum
Postpartum Factors: Maternal and Infant Health . . . . . . . . . . . . . . . . . . . . . . . . . . . . . . . . . . . . . . . . . . .Comments from PRAMS MothersUse of Birth ControlReasons for Not Using Postpartum Birth ControlPostpartum DepressionNeonatal Intensive Care Unit AdmissionLength of Hospital Stay for NewbornBreastfeeding InitiationBreastfeeding Length of TimeInfant Sleep PositionInfant Health Care Visit in the First Week After Leaving Hospital
This report highlights 2003 data collected in Maryland through the Pregnancy Risk AssessmentMonitoring System (PRAMS). PRAMS is a surveillance system established by the Centers for DiseaseControl and Prevention (CDC) in 1987 to obtain information about maternal behaviors and experiences thatmay be associated with adverse pregnancy outcomes. Data are collected by surveying women who haverecently delivered live born infants.
PRAMS projects are conducted through cooperative agreements between the CDC and state healthdepartments. PRAMS projects are currently underway in 29 states and New York City. All surveys include acore set of standardized questions, which allows for multi-state analyses. In addition, each state can addquestions tailored to meet its needs. The core section of the survey includes questions relating to prenatal care,obstetric history, smoking, alcohol use, physical abuse, contraception, economic status, maternal stress, andinfant health. The Maryland-specific section of the survey includes questions on assisted reproduction, contra-ceptive use, depression, oral health, bedrest during pregnancy, social services, and seatbelt use.
The PRAMS project in Maryland is a collaborative effort of the Center for Maternal and Child Health(CMCH), the Vital Statistics Administration (VSA) of the Maryland Department of Health and MentalHygiene, and the CDC. Maryland began collecting PRAMS data from mothers who delivered in 2000.
METHODOLOGY
Sampling and Data Collection
Women eligible to participate in PRAMS are selected from Maryland’s live birth certificate files. Eachmonth, a stratified, random sample of approximately 200 live births is selected. The sample is stratified bymaternal age (<35 years, ≥35 years) and infant birth weight (<2500 grams, ≥2500 grams). This sampling frameover-samples mothers who have delivered a low birth weight infant (<2500 grams) as well as mothers whoare 35 years of age or older.
PRAMS combines two modes of data collection, a survey conducted by mailed questionnaire withmultiple follow-up attempts, and if mail is not successful, a survey conducted by telephone interview. Surveyquestionnaires and other materials are available in both English and Spanish.
The first mailing, which is done two to four months after delivery, is a letter that introduces PRAMSto the mother and informs her that a questionnaire will soon arrive. Within seven days of this letter, thequestionnaire packet is mailed. This packet includes the 86-item survey, PRAMS brochure, calendar andresource brochure. In addition, a telephone card is sent as an incentive for completing the survey. Seven to 10days after the initial packet is mailed, a tickler that serves as a thank you and reminder note is sent. Motherswho do not respond to the tickler within seven to 14 days are mailed a second questionnaire packet. A thirdquestionnaire packet is mailed to all remaining nonrespondents seven to 14 days later. Telephone follow-up isinitiated for all nonrespondents.
vi
Weighting Procedures
Data collected through PRAMS are linked to birth certificate data, which allows for the survey datato be weighted to reflect the total birth population. Sampling, nonresponse and noncoverage adjustmentfactors are applied to the data in order to make the results generalizable to the state’s population of womendelivering live born infants during the study period. Further information on PRAMS methodology,including weighting procedures, may be found on the CDC website at http://www.cdc.gov/reproductivehealth/methodology.htm.
Data Analysis
CDC recommends that states obtain a response rate of at least 70% for analysis of PRAMS. Theweighted response rate among women delivering in Maryland between January 1, 2003 and December 31,2003 was 73%. During this period, 1,627 mothers completed the PRAMS questionnaire with a weightedresponse reflecting 66,063 mothers. The weighted figure included 39,779 births to white women and20,375 births to black women.
All data in this report were prepared using weighted PRAMS data and SUDAAN software.Percentages shown for each survey item are based on the number of mothers who responded to that item,with missing observations excluded. With the exception of questions relating to smoking (Questions39-41), alcohol binges before pregnancy (Question 43b) and duration of breastfeeding (Question 61), thepercentage of missing observations was less than 5% for each survey item. Percentages for subcategoriesof survey items based on fewer than five respondents are not reported since estimates based on smallnumbers may be unreliable.
ACKNOWLEDGMENTS
The Maryland PRAMS Project would like to acknowledge the CDC PRAMS Team for their techni-cal assistance and support, especially Nedra Whitehead, Ph.D. and Denise D’Angelo, M.P.H. our formerand present project managers, who have expertly guided and assisted our program.
Additionally, our thanks go to the Maryland PRAMS Steering Committee for their invaluable inputto many aspects of our project.
Most importantly, we very much appreciate all the 1,627 mothers who took the time to completethe questionnaires that are represented in this report. Their answers will contribute greatly towards ourcontinuing efforts to improve the health of Maryland mothers and babies.
1
MARYLAND PRAMS STEERING COMMITTEE (as of May 2005)
*Maryland Department of Health and Mental Hygiene (DHMH)
PRAMS Staff: Diana Cheng, MD, PRAMS Project Director, Center for Maternal and Child Health (CMCH)Helen Espitallier, MS, PRAMS Project Coordinator, CMCHAndrew Hannon, LCSW-C, CMCHIsabelle Horon, DrPH, Vital Statistics AdministrationLaurie Kettinger, MS, CMCHJodi Shaefer, RN, PhD, CMCH
Meena Abraham, MPHMedChi, Maryland State Medical Society
Carla Bailey, RN, PhDMaryland Institute for Emergency Medical
Services SystemsMaryland Perinatal Association
Bonnie S. Birkel, CRNP, MPHCenter for Maternal and Child HealthDHMH*
Mary Dallavalle, RD, LD, MSOffice of Maryland WIC ProgramDHMH*
Anne EderProgram Services March of Dimes, Maryland Chapter
Maureen Edwards, MD, MPH Center for Maternal and Child HealthDHMH*
Jennean Everett-ReynoldsAdvocates for Children and Youth
Michelle Fox, M.D.Obstetrics, Gynecology and Reproductive SciencesUniversity of Maryland Medical System
Sue Roberson JenkinsAlcohol and Drug Abuse AdministrationDHMH*
Betsy LehmannMaryland Health Care Coalition Against
Domestic Violence
Jade LeungCenter for Health Promotion, Education and
Tobacco Use PreventionDHMH*
Elisabeth Liebow, MPHPerinatal Infections Outreach ProgramBaltimore County Health Department
Yvette McEachernCenter for Maternal and Child HealthDHMH*
Christine McKee, MAMental Health Association of Maryland
Nadine Smith, RNDivision of Outreach and Care CoordinationHealth Choice: Acute Care AdministrationDHMH*
Donna Strobino, PhDPopulation & Family Health SciencesJohns Hopkins University Bloomberg School of Public Health
2
MARYLAND PRAMS HIGHLIGHTS – 2003
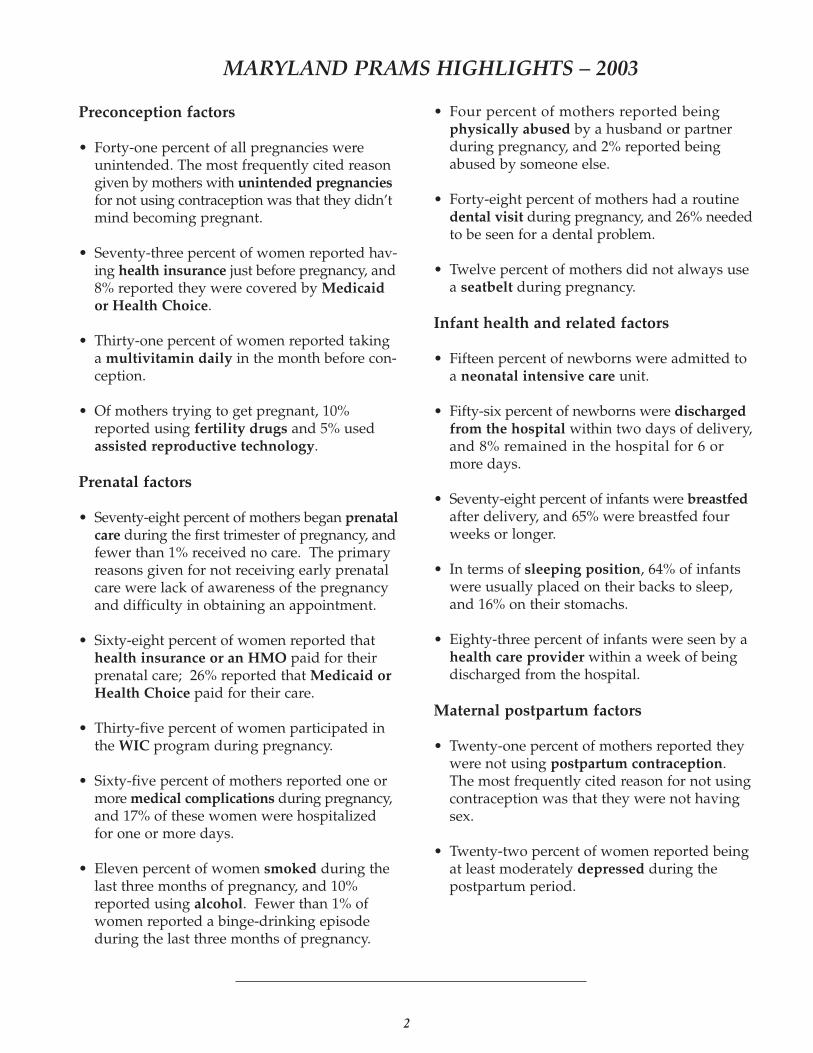
Preconception factors
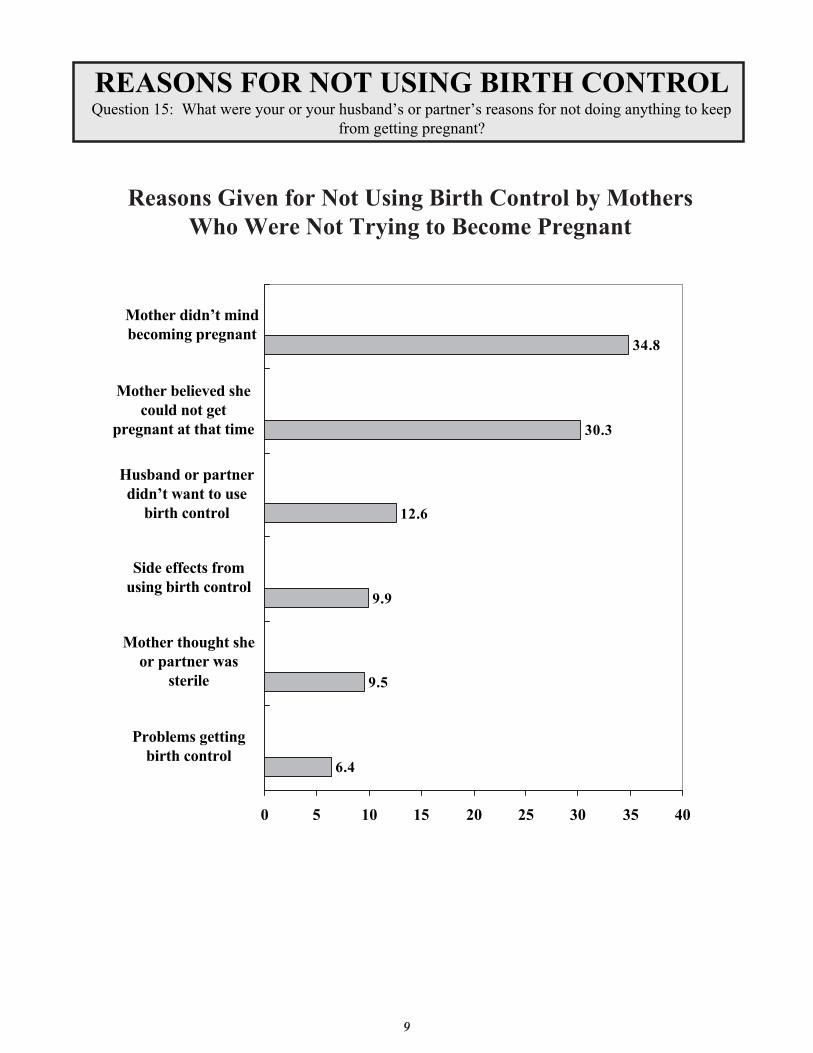
• Forty-one percent of all pregnancies wereunintended. The most frequently cited reasongiven by mothers with unintended pregnanciesfor not using contraception was that they didn’tmind becoming pregnant.
• Seventy-three percent of women reported hav-ing health insurance just before pregnancy, and8% reported they were covered by Medicaidor Health Choice.
• Thirty-one percent of women reported takinga multivitamin daily in the month before con-ception.
• Of mothers trying to get pregnant, 10%reported using fertility drugs and 5% usedassisted reproductive technology.
Prenatal factors
• Seventy-eight percent of mothers began prenatalcare during the first trimester of pregnancy, andfewer than 1% received no care. The primaryreasons given for not receiving early prenatalcare were lack of awareness of the pregnancyand difficulty in obtaining an appointment.
• Sixty-eight percent of women reported thathealth insurance or an HMO paid for theirprenatal care; 26% reported that Medicaid orHealth Choice paid for their care.
• Thirty-five percent of women participated inthe WIC program during pregnancy.
• Sixty-five percent of mothers reported one ormore medical complications during pregnancy,and 17% of these women were hospitalizedfor one or more days.
• Eleven percent of women smoked during thelast three months of pregnancy, and 10%reported using alcohol. Fewer than 1% ofwomen reported a binge-drinking episodeduring the last three months of pregnancy.
• Four percent of mothers reported beingphysically abused by a husband or partnerduring pregnancy, and 2% reported beingabused by someone else.
• Forty-eight percent of mothers had a routinedental visit during pregnancy, and 26% neededto be seen for a dental problem.
• Twelve percent of mothers did not always usea seatbelt during pregnancy.
Infant health and related factors
• Fifteen percent of newborns were admitted toa neonatal intensive care unit.
• Fifty-six percent of newborns were dischargedfrom the hospital within two days of delivery,and 8% remained in the hospital for 6 ormore days.
• Seventy-eight percent of infants were breastfedafter delivery, and 65% were breastfed fourweeks or longer.
• In terms of sleeping position, 64% of infantswere usually placed on their backs to sleep,and 16% on their stomachs.
• Eighty-three percent of infants were seen by ahealth care provider within a week of beingdischarged from the hospital.
Maternal postpartum factors
• Twenty-one percent of mothers reported theywere not using postpartum contraception.The most frequently cited reason for not usingcontraception was that they were not havingsex.
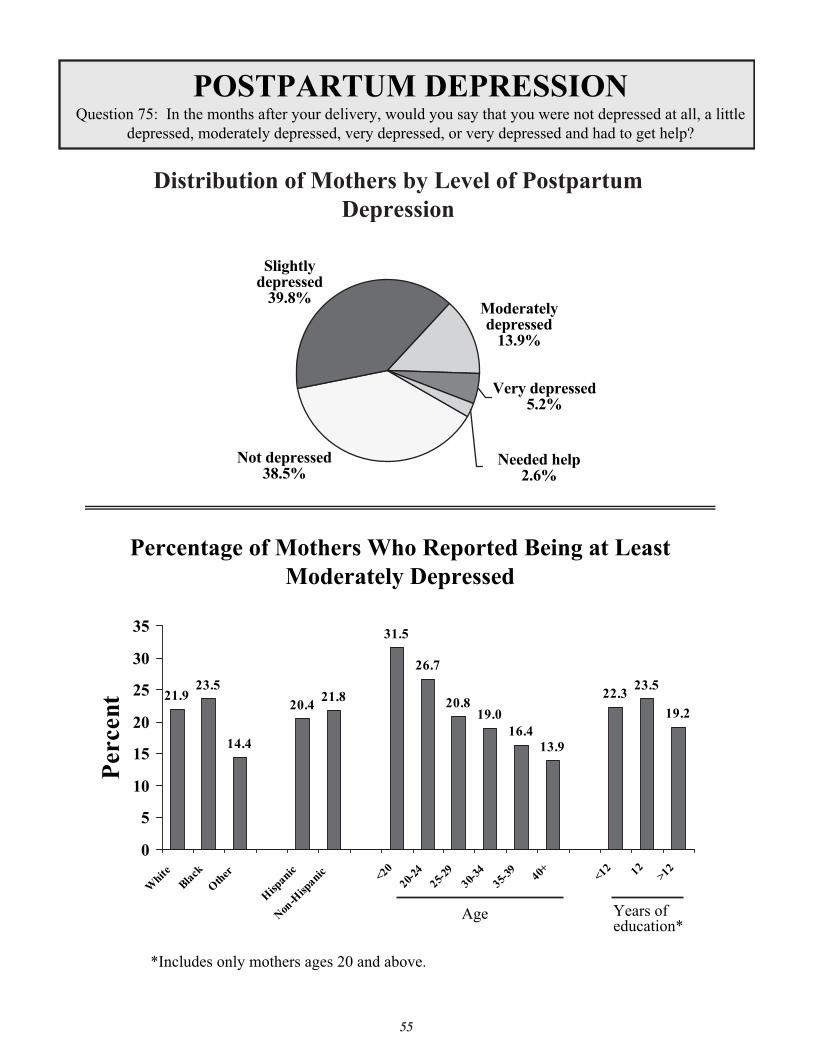
• Twenty-two percent of women reported beingat least moderately depressed during thepostpartum period.
3
MARYLAND PRAMS 2001, 2002 and 2003 SURVEILLANCE AND SELECTED HEALTHY PEOPLE 2010 OBJECTIVES
4
Preconception Factors
“Doctor took me off birth control...said I was pre-menopausal and there was no need for it.”
“My husband wanted a baby very much – I didn’t really,but told him it was okay to try, thinking that at age 43, I probably wouldn’t become pregnant anyway.”
“…the coverage of fertility treatments as mandated byMD law needs to be expanded. It's nice to see MD isattempting to recognize the importance of coverage. Moresupport should be provided in the form of mental healthprograms for infertility patients.”
PRAMS mothers
6
7
Distribution of Mothers by Intendedness of Pregnancy
33.6
57.2
39.0
54.2
39.5
83.8
62.3
35.4
26.422.5
28.5
55.7
46.9
28.6
0
10
20
30
40
50
60
70
80
90
White
Black
Oth
er
Hisp
anic
Non-H
ispanic <20
20-24
25-29
30-34
35-39 40+ <12 12
>12
Per
cent
Percentage of Mothers With Unintended Pregnancies
Age Years of education*
*Includes only mothers ages 20 and above.
Unintendedpregnancies41.2%
Intendedpregnancies58.8%
INTENDEDNESS OF PREGNANCYQuestion 12: Thinking back to just before you got pregnant, how did you feel about
becoming pregnant?
Didn’t want to bepregnant then
or later11.3%
Want to bepregnant sooner
19.7%
Wanted to bepregnant then
39.1%
Wanted to bepregnant later
29.9%
8
Distribution of Mothers With An Unintended Pregnancy by Use of Birth Control at the Time of Pregnancy
39.9 41.337.7
41.2 40.2 40.9 42.0 41.838.0 36.9 37.4
27.5
46.041.8
05
101520253035404550
White
Black
Oth
er
Hisp
anic
Non-H
ispanic <20
20-24
25-29
30-34
35-39 40+ <12 12
>12
Per
cent
Percentage of Mothers With an Unintended Pregnancy Who Reported Use of Birth Control at Time of Pregnancy
Age Years of education*
*Includes only mothers ages 20 and above.
Did not usebirth control
59.7%
Used birthcontrol40.3%
USE OF BIRTH CONTROL AMONG MOTHERS WITH AN UNINTENDED PREGNANCY
or your husband or partner doinganything to keep from getting pregnant?
Question 14: When you got pregnant with your new baby, were you
9
Reasons Given for Not Using Birth Control by Mothers Who Were Not Trying to Become Pregnant
6.4
9.5
9.9
12.6
30.3
34.8
0 5 10 15 20 25 30 35 40
Mother believed shecould not get
pregnant at that time
Husband or partnerdidn’t want to use
birth control
Side effects fromusing birth control
Mother thought sheor partner was
sterile
Problems gettingbirth control
Mother didn’t mindbecoming pregnant
REASONS FOR NOT USING BIRTH CONTROLQuestion 15: What were your or your husband’s or partner’s reasons for not doing anything to keep
from getting pregnant?
10
Distribution of Mothers by Frequency of Multivitamin Use in the Month Before Pregnancy
64.5
76.3 74.6
85.4
66.9
88.1 91.1
61 59.2 57.7
36.5
87.5
77
58.5
0102030405060708090
100
White
Black
Oth
er
Hisp
anic
Non-H
ispanic <20
20-24
25-29
30-34
35-39 40+ <12 12
>12
Per
cent
Percentage of Mothers Who Reported Less Than Daily Multivitamin Use in the Month Before Pregnancy
Age Years of education*
*Includes only mothers ages 20 and above.
Every day31.0%
4-6 times/week7.2%
1-3 times/week9.2%
Didn’t take52.6%
MULTIVITAMIN USEQuestion 3: In the month you got pregnant with your new baby, how many times a week did
you take a multivitamin (a pill that contains many different vitamins and minerals)?before
11
Distribution of Mothers Who Were Attempting to Become Pregnant by Use of Fertility Drugs
9.4
6.6
19.6
10.08.5
12.0 11.5
14.0
10.4 10.2
0
5
10
15
20
25
White
Black
Oth
er
Hisp
anic
Non-H
ispanic <20
20-24
25-29
30-34
35-39 40+ <12 12
>12
Per
cent
Did not usefertility drugs
90.0%
Used fertilitydrugs10.0%
Percentage of Mothers Attempting to Become Pregnant Who Reported Using Fertility Drugs
Age Years of education*
*Includes only mothers ages 20 and above.Note: Percentages are not reported if the number of respondents was less than five.
FERTILITY DRUGSQuestion 16: Did you take any fertility drugs to help you get pregnant with your new baby?
(Fertility drugs include Clomid , Serophene , Pergonal , or any other drugs that you may have taken to help you get pregnant.)
12
Distribution of Mothers Attempting to Become Pregnant by Use of Assisted Reproductive Technology (ART)
4.45.7
8.0
5.44.1
5.5
7.7
13.6
5.2 5.6
0
2
4
6
8
10
12
14
16
White
Black
Oth
er
Hisp
anic
Non-H
ispanic <20
20-24
25-29
30-34
35-39 40+ <12 12
>12
Per
cent
Did not use ART94.9%
Used ART5.1%
Percentage of Mothers Attempting to Become Pregnant Who Reported Using Assisted Reproductive Technology (ART)
Age Years of education*
*Includes only mothers ages 20 and above.Note: Percentages are not reported if the number of respondents was less than five.
ASSISTED REPRODUCTIVE TECHNOLOGYQuestion 17: Did you use any medical procedures (assisted reproductive technology) to help you get
pregnant with your new baby? (Assisted reproductive technology procedures include in vitro fertilization [IVF], GIFT, ZIFT, embryo transfer and donor oocytes.)
Prenatal Factors
“I became very nervous and began having problems withmy pregnancy due to stress. My son was born prematureand stayed in NICU for a while. The experience hasallowed me to see that financial burdens and stress playan unbelievable role in premature births.”
“I could have eaten healthier if there was a dental program for low income people. By having bad teeth andnot being able to find a dentist to accept me while I wason Medical Assistance, I am now forced to have all myteeth pulled…”
“I think the doctors should be better educated for mothersof multiples; a lot of information I received about my twinpregnancy and after their birth came from friends or people they knew. I had to call to get information from my doctor.”
“I am concerned (about the)… lack of ob/gyns in thelower eastern shore, for low income families. The closesthospital is 30 minutes away. There are women who haveto drive maybe an hour to get to the hospital.”
PRAMS mothers
14
15
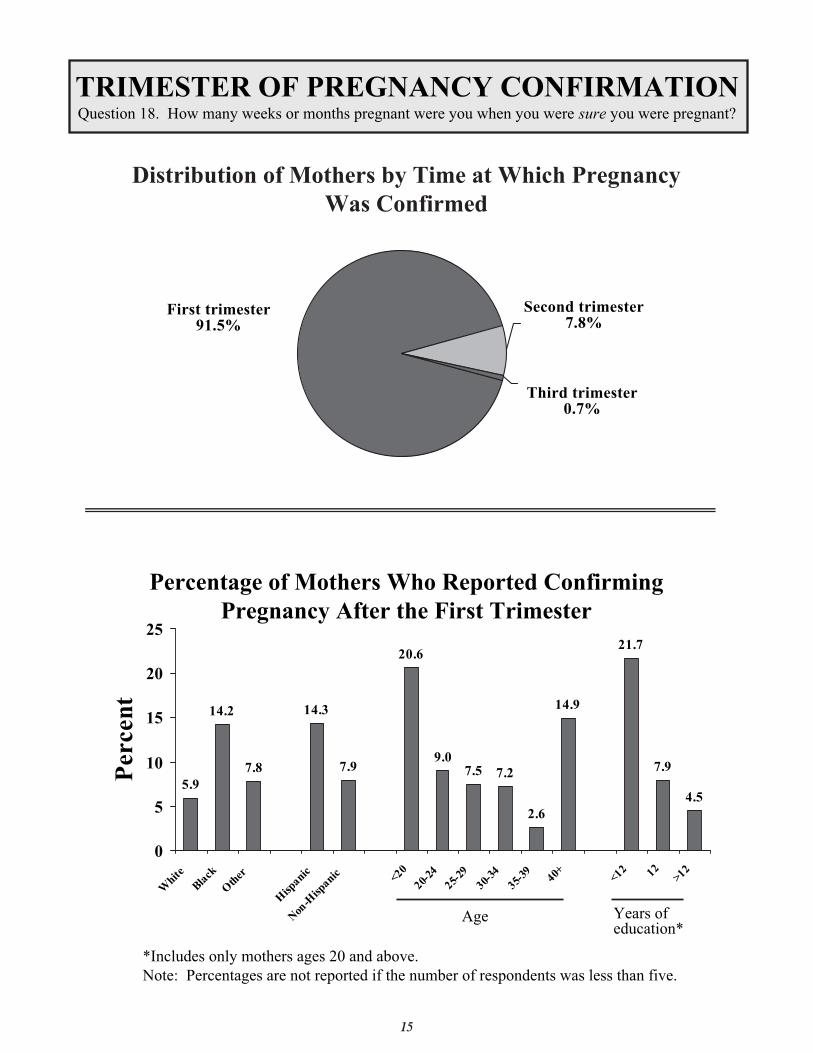
Distribution of Mothers by Time at Which Pregnancy Was Confirmed
5.9
14.2
7.8
14.3
7.9
20.6
9.07.5 7.2
2.6
14.9
21.7
7.9
4.5
0
5
10
15
20
25
White
Black
Oth
er
Hisp
anic
Non-H
ispanic <20
20-24
25-29
30-34
35-39 40+ <12 12
>12
Per
cent
Percentage of Mothers Who Reported Confirming Pregnancy After the First Trimester
Age Years of education*
*Includes only mothers ages 20 and above.Note: Percentages are not reported if the number of respondents was less than five.
TRIMESTER OF PREGNANCY CONFIRMATIONQuestion 18. How many weeks or months pregnant were you when you were sure you were pregnant?
First trimester91.5%
Second trimester7.8%
Third trimester0.7%
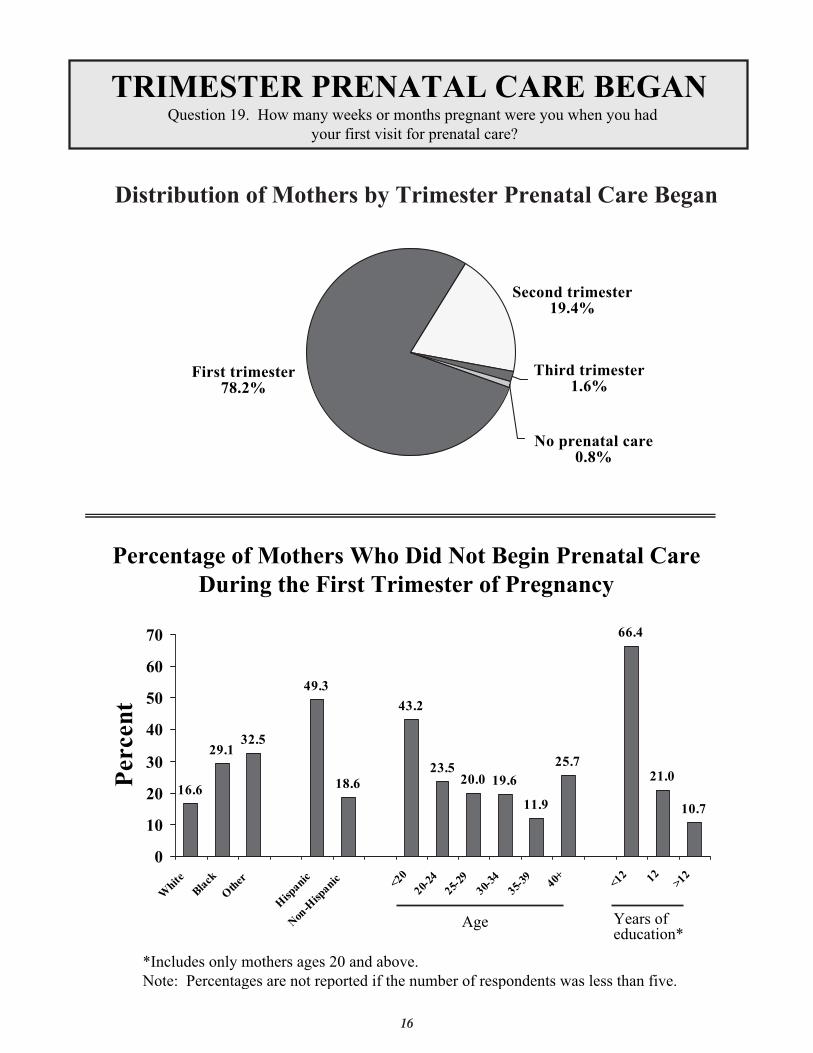
16
Distribution of Mothers by Trimester Prenatal Care Began
16.6
29.132.5
49.3
18.6
43.2
23.520.0 19.6
11.9
25.7
66.4
21.0
10.7
0
10
20
30
40
50
60
70
White
Black
Oth
er
Hisp
anic
Non-H
ispanic <20
20-24
25-29
30-34
35-39 40+ <12 12
>12
Per
cent
Percentage of Mothers Who Did Not Begin Prenatal Care During the First Trimester of Pregnancy
Age Years of education*
*Includes only mothers ages 20 and above.Note: Percentages are not reported if the number of respondents was less than five.
TRIMESTER PRENATAL CARE BEGANQuestion 19. How many weeks or months pregnant were you when you had
your first visit for prenatal care?
First trimester78.2%
Second trimester19.4%
Third trimester1.6%
No prenatal care0.8%
17
Distribution of Mothers Who Did Not Begin Prenatal Care in the First Trimester by Satisfaction With Time
During Pregnancy That Prenatal Care Began
42.5
61.055.4
32.3
57.7
49.7
66.0
50.2
43.739.8
64.7
50.4 52.8 51.8
0
10
20
30
40
50
60
70
White
Black
Oth
er
Hisp
anic
Non-H
ispanic <20
20-24
25-29
30-34
35-39 40+ <12 12
>12
Per
cent
Percentage of Mothers Who Did Not Begin Prenatal Care in the First Trimester and Reported that Prenatal Care
Did Not Begin Early Enough in Pregnancy
Age Years of education*
*Includes only mothers ages 20 and above.Note: Percentages are not reported if the number of respondents was less than five.
Did not want care2.2%
Did not beginearly enough
51.7%
Began earlyenough46.1%
PRENATAL CARE AS EARLY AS DESIREDQuestion 20: Did you get prenatal care as early in your pregnancy as you wanted?
18
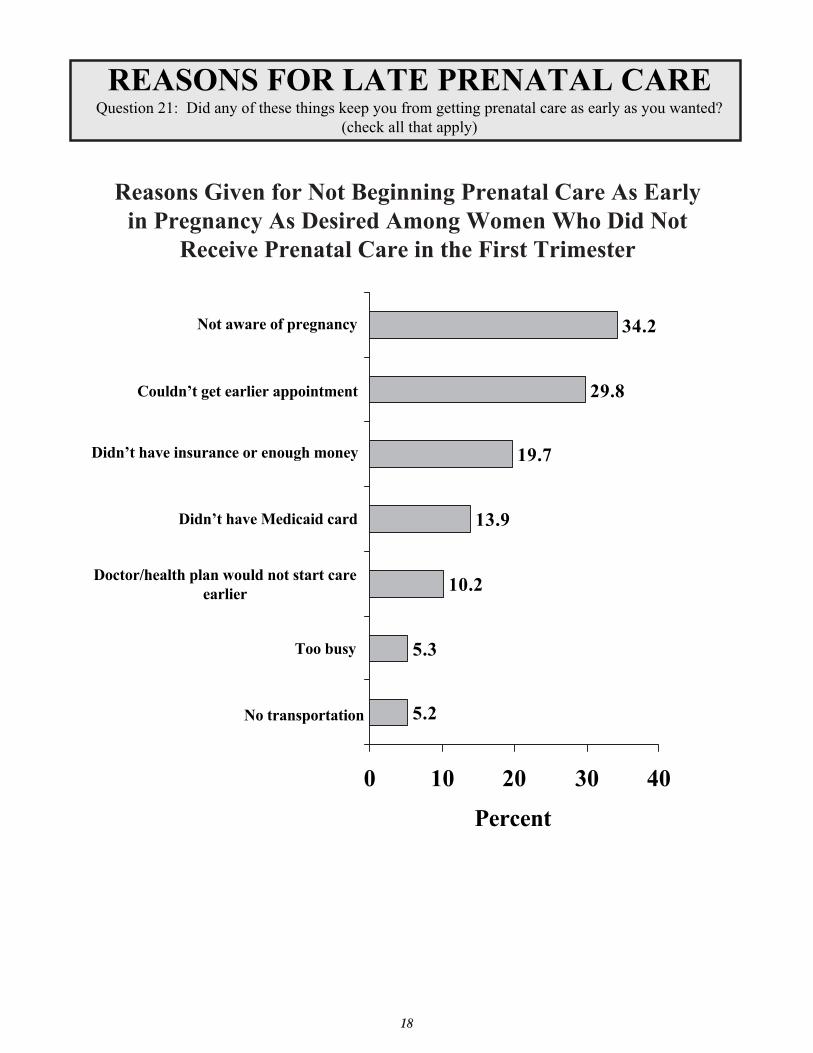
Reasons Given for Not Beginning Prenatal Care As Early in Pregnancy As Desired Among Women Who Did Not
Receive Prenatal Care in the First Trimester
5.2
5.3
10.2
13.9
19.7
29.8
34.2
0 10 20 30 40
Didn’t have Medicaid card
Didn’t have insurance or enough money
Couldn’t get earlier appointment
Not aware of pregnancy
Doctor/health plan would not start careearlier
Too busy
No transportation
Percent
REASONS FOR LATE PRENATAL CAREQuestion 21: Did any of these things keep you from getting prenatal care as early as you wanted?
(check all that apply)
19
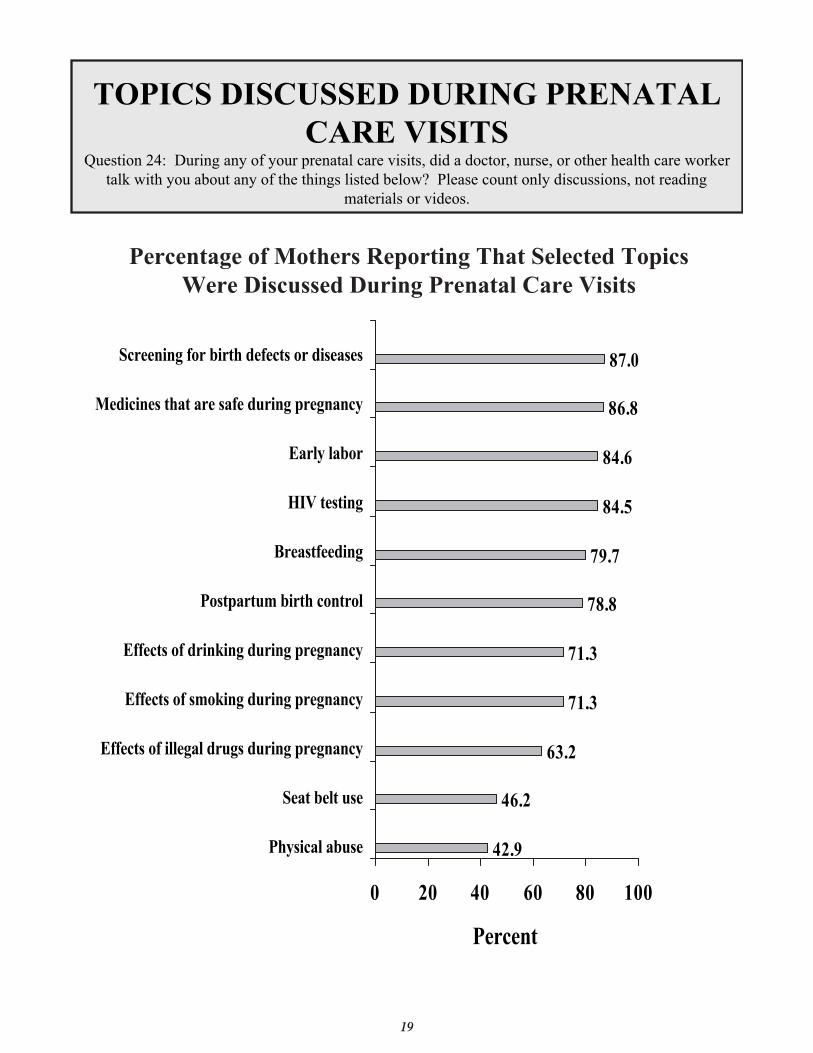
Percentage of Mothers Reporting That Selected Topics Were Discussed During Prenatal Care Visits
42.9
46.2
63.2
71.3
71.3
78.8
79.7
84.5
84.6
86.8
87.0
0 20 40 60 80 100
Screening for birth defects or diseases
Medicines that are safe during pregnancy
Early labor
HIV testing
Breastfeeding
Postpartum birth control
Effects of drinking during pregnancy
Effects of smoking during pregnancy
Effects of illegal drugs during pregnancy
Seat belt use
Physical abuse
Percent
TOPICS DISCUSSED DURING PRENATAL CARE VISITS
Question 24: During any of your prenatal care visits, did a doctor, nurse, or other health care workertalk with you about any of the things listed below? Please count only discussions, not reading
materials or videos.
20
Percentage of Mothers Reporting Stress by Type of Event
4.4
4.9
6.8
10.3
10.7
10.8
11.5
12.4
17.6
24.8
26.4
30.2
32.0
0 10 20 30 40
Percent
None30.8%
One or more69.2%
Distribution of mothers by number of stressors
Moved to a new address
Argued with partner more than usual
Couldn’t pay bills
Family member hospitalized
Someone close died
Husband/partner lost job
Someone close had alcohol/drug problem
Mother lost job
Husband/partner didn’t want pregnancy
Separation/divorce
In physical fight
Mother or partner went to jail
Homeless
STRESSQuestion 45: This question is about things that may have happened during the 12 months before
your new baby was born. For each item, circle ye if it happened to you or no if it did not.s
21
Percentage of Mothers Reporting Pregnancy Complications by Type of Complication
2.1
3.2
5.5
7.1
7.1
15.4
17.8
18.5
26.7
26.9
0 5 10 15 20 25 30Percent
None34.8%
One or more65.2%
Distribution of mothers by number of complications
COMPLICATIONS DURING PREGNANCYQuestion 30: Did you have any of these problems during your pregnancy?
Preterm labor
Severe nausea, vomiting or dehydration
Vaginal bellding
High blood pressure or edema
Kidney or bladder infection
Diabetes
Premature rupture of membranes
Problems with the placenta
Incompetent cervix
Automobile accident
22
Percentage of Mothers With Problems During Pregnancy Who Had Hospital Admissions or Were Advised Bedrest
19.8
25.4
9.7
18.721.0
28.9
20.121.5
18.321.2
14.3
24.1 24.0
19.6
0
5
10
15
20
25
30
35
White
Black
Oth
er
Hisp
anic
Non-H
ispanic <20
20-24
25-29
30-34
35-39 40+ <12 12
>12
Per
cent
Percentage of Mothers With Problems During Pregnancy Who Spent One or More Days in the Hospital
Age Years of education*
*Includes only mothers ages 20 and above.
42.0
16.8
4.0
33.2
05
1015202530354045
Hospital <1 day Hospital 1-7 days Hospital >7 days Bedrest athome >2 days
Per
cent
HOSPITAL ADMISSIONS AND BEDRESTQuestion 31: Did you do any of the following things because of these problem(s)?
(Note: Refers to problems listed in Question 30)
23
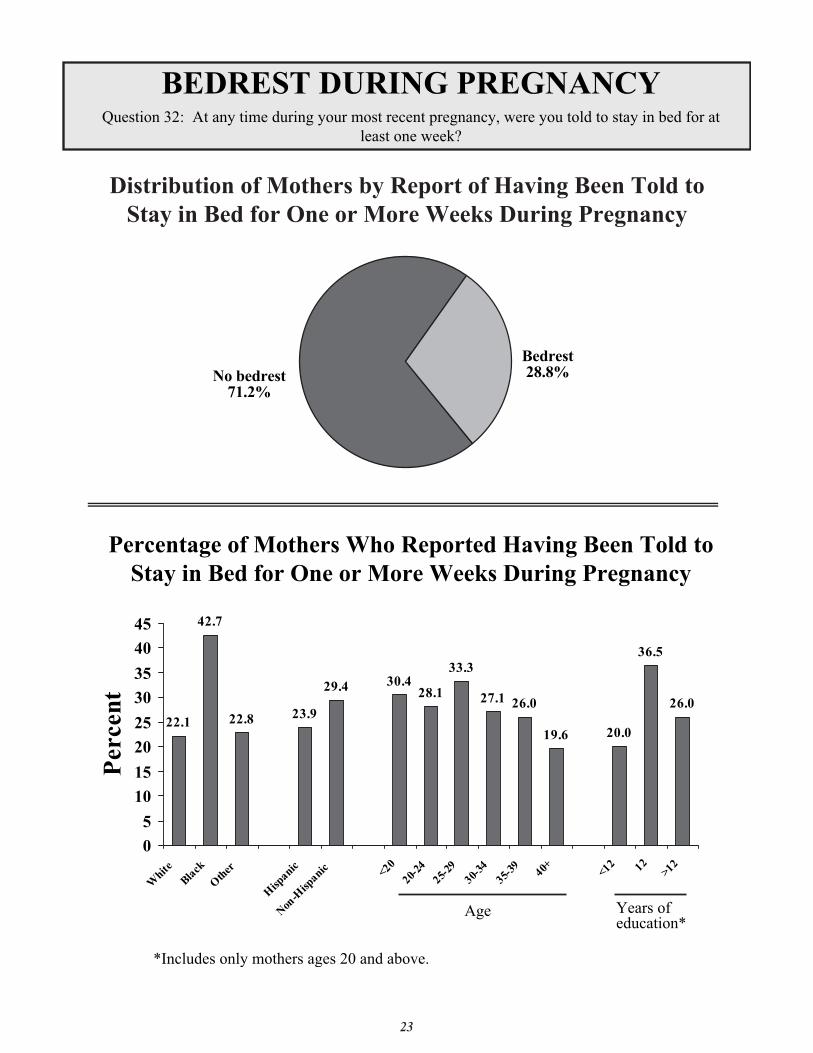
Distribution of Mothers by Report of Having Been Told to Stay in Bed for One or More Weeks During Pregnancy
22.1
42.7
22.8 23.9
29.4 30.428.1
33.3
27.1 26.0
19.6 20.0
36.5
26.0
0
5
10
15
20
25
30
35
40
45
White
Black
Oth
er
Hisp
anic
Non-H
ispanic <20
20-24
25-29
30-34
35-39 40+ <12 12
>12
Per
cent
Percentage of Mothers Who Reported Having Been Told to Stay in Bed for One or More Weeks During Pregnancy
Age Years of education*
*Includes only mothers ages 20 and above.
BEDREST DURING PREGNANCYQuestion 32: At any time during your most recent pregnancy, were you told to stay in bed for at
least one week?
No bedrest71.2%
Bedrest28.8%
Distribution of Mothers by Dental Care During Pregnancy
45.7
63.0
54.8
76.1
48.8
66.7 65.3
47.742.6
47.3 47.6
75.1
57.2
42.0
0
10
20
30
40
50
60
70
80
White
Black
Oth
er
Hisp
anic
Non-H
ispanic <20
20-24
25-29
30-34
35-39 40+ <12 12
>12
Per
cent
Percentage of Mothers Who Did Not Report Going to a Dentist or Dental Clinic During Pregnancy
Age Years of education*
*Includes only mothers ages 20 and above.
47.1 48.3
26.2
0
10
20
30
40
50
60
Per
cent
Dental or other health careworker told me how to
care for my teeth and gums
Went to dentist ordental clinic
Needed to see dentistfor a problem
DENTAL CARE DURING PREGNANCYQuestion 82: This question is about the care of your teeth during your most recent pregnancy.
(Indicate all that apply)
24
Health Care Coverageand WIC Participation
“I think it's great the State of MD has help availableto those who need it. If they didn't assist me, my babyprobably wouldn't have been as healthy and strong ashe was. Thru WIC and their educational classes, Iwas a more knowledgeable, responsible, healthy youngparent.”
“I was unaware that in the state of MD that materni-ty leave was not give with pay. In my former countryof Jamaica, mothers received three months off with sixweeks of pay. I was also the 1st person at a company offive employees to becomre pregnant. There was no policy on the books regarding maternity leave. We followed the family medical leave act and I receivedthree months off without pay. This put a severe strainon my finances - especially since I went into labor fiveweeks early.”
“It is unfortunate that women have only six to eightweeks post-partum leave after delivery in this county.It is not enough time to recover and look for adequatecare for children. As in my case, looking for carewhile I was pregnant was impossible because I was onbed-rest since nineteen weeks.”
PRAMS mothers
26
27
Distribution of Mothers by Health Insurance StatusJust Before Pregnancy
25.0 27.2
42.0
70.4
21.8
41.0
48.6
25.6
17.113.1 11.6
73.7
38.5
11.5
0
10
20
30
40
50
60
70
80
White
Black
Oth
er
Hisp
anic
Non-H
ispanic <20
20-24
25-29
30-34
35-39 40+ <12 12
>12
Per
cent
Percentage of Mothers Who Reported Having No Health Insurance Just Before Pregnancy
Age Years of education*
*Includes only mothers ages 20 and above.
HEALTH INSURANCE BEFORE PREGNANCYQuestion 1: Just before you got pregnant, did you have health insurance?
(Do not count Medicaid [including HealthChoice]).
Insurance72.7%
No insurance27.3%
28
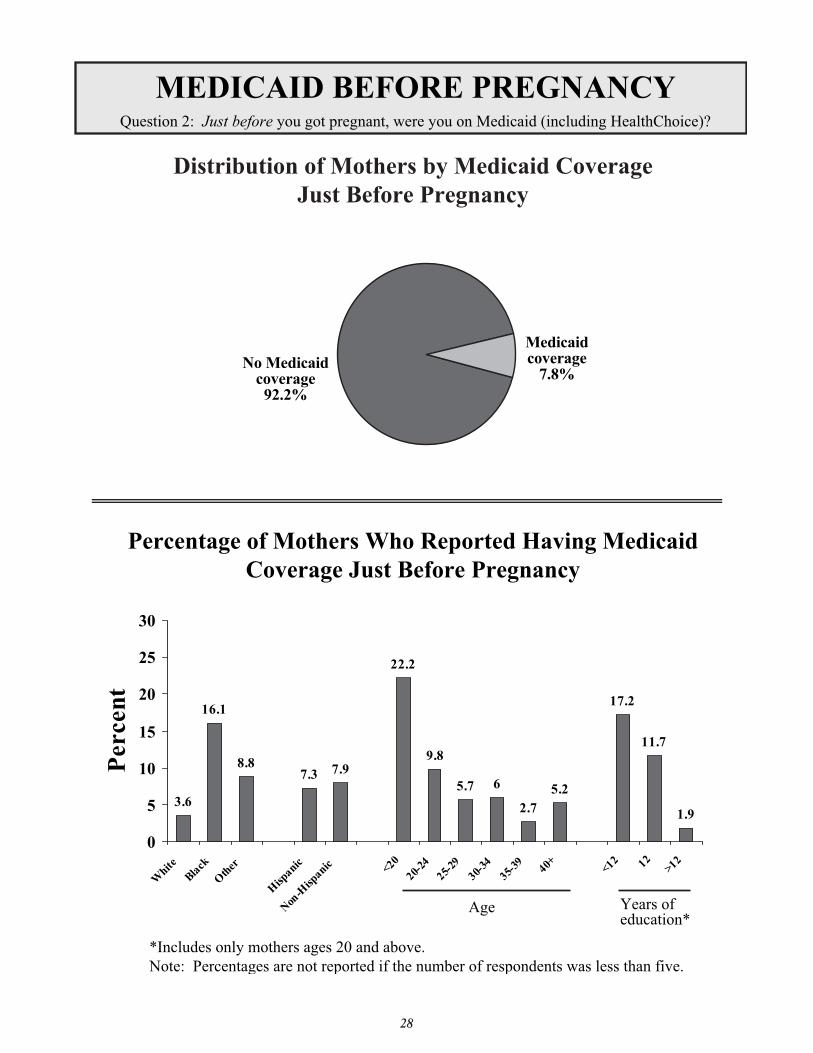
Distribution of Mothers by Medicaid CoverageJust Before Pregnancy
3.6
16.1
8.87.3 7.9
22.2
9.8
5.7 6
2.75.2
17.2
11.7
1.9
0
5
10
15
20
25
30
White
Black
Oth
er
Hisp
anic
Non-H
ispanic <20
20-24
25-29
30-34
35-39 40+ <12 12
>12
Per
cent
Percentage of Mothers Who Reported Having Medicaid Coverage Just Before Pregnancy
Age Years of education*
*Includes only mothers ages 20 and above.Note: Percentages are not reported if the number of respondents was less than five.
MEDICAID BEFORE PREGNANCYQuestion 2: Just before you got pregnant, were you on Medicaid (including HealthChoice)?
No Medicaidcoverage92.2%
Medicaidcoverage
7.8%
29
Source(s) of Payment for Prenatal Care*
0
20
40
60
80
100
White
Black
Oth
er
Hisp
anic
Non-H
ispanic <20
20-24
25-29
30-34
35-39 40+ <12 12
>12
Per
cent
Insurance or HMO Medicaid or Health Choice
68
25.5
13.56.4
01020
30405060
7080
Healthinsurance/HMO
Medicaid/HealthChoice
Personal income
Other
Per
cent
Percentage of Mothers Who Identified Insurance/HMO or Medicaid/Health Choice as a Source of Payment for Prenatal Care
Age Years of education*
*Includes only mothers ages 20 and above.
*Respondents were instructed to identify all sources of payment, therefore percentages do not sum to 100.
SOURCE OF PAYMENT FOR PRENATAL CAREQuestion 23: How was your prenatal care paid for? Check all that apply.
72.1
19.0
61.8
39.6
59.5
23.9 27.5
44.2
73.0
23.2
34.0
63.7
52.1
37.6
69.6
24.3
78.2
15.0
85.9
86.1
7.7 14
.8
34.1
53.0 57
.135
.9
84.6
9.4
30
Distribution of Mothers by Participation in the WIC Program During Pregnancy
27.3
51.8
35.9
61.6
32.1
68.0 65.6
29.0
20.514.6 13.3
62.155.2
15.8
0
10
20
30
40
50
60
70
80
White
Black
Oth
er
Hisp
anic
Non-H
ispanic <20
20-24
25-29
30-34
35-39 40+ <12 12
>12
Per
cent
Percentage of Mothers Who Participated in the WIC Program During Pregnancy
Age Years ofeducation*
*Includes only mothers ages 20 and above.
WIC PARTICIPATIONQuestion 29: During your pregnancy, were you on WIC (the Special Supplemental Nutrition
Program for Women, Infants and Children)?
Did notparticipate
64.6%
Participated35.4%
31
Source(s) of Payment for Delivery*
0102030405060708090
100
White
Black
Oth
er
Hisp
anic
Non-H
ispanic <20
20-24
25-29
30-34
35-39 40+ <12 12
>12
Per
cent
Insurance or HMO Medicaid or Health Choice
68.0
28.9
13.55.1
01020
30405060
7080
Healthinsurance/HMO
Medicaid/HealthChoice
Personal income
Other
Per
cent
Percentage of Mothers Who Identified Insurance/HMO or Medicaid/Health Choice as a Source of Payment for Delivery
Age Years of education*
*Includes only mothers ages 20 and above.
*Respondents were instructed to identify all sources of payment, therefore percentages do not sum to 100.
SOURCE OF PAYMENT FOR DELIVERYQuestion 54: How was your delivery paid for? Check all that apply.
72.6
23.4
60.3
39.7
62.5
31.0
26.5
64.4
73.1
24.6
33.5
67.9
54.3
41.9
68.0
26.8
78.5
18.6
85.9
10.9
88.0
12.5
31.4
65.6
56.4
40.8
85.9
10.0
32
Selected Risk Factors
“… Without the Center for Addition and Pregnancy, I would have been lost and feeling all alone. I got the treatment I needed and now I am clean, off of drugs forthe last 6 months.”
“A State Trooper talked to our childbirth class aboutproper installation of car seats. I had no idea so manypeople put them in wrong. We had ours checked by thepolice officer…before we used it with our baby.”
“…que no dejen que su esposo las golpeen durante elembarazo, ni que las maltraten, cuerpo y mente.”
(…don’t let your husband hit or mistreat you duringyour pregnancy, body and mind.)
PRAMS mothers
34
35
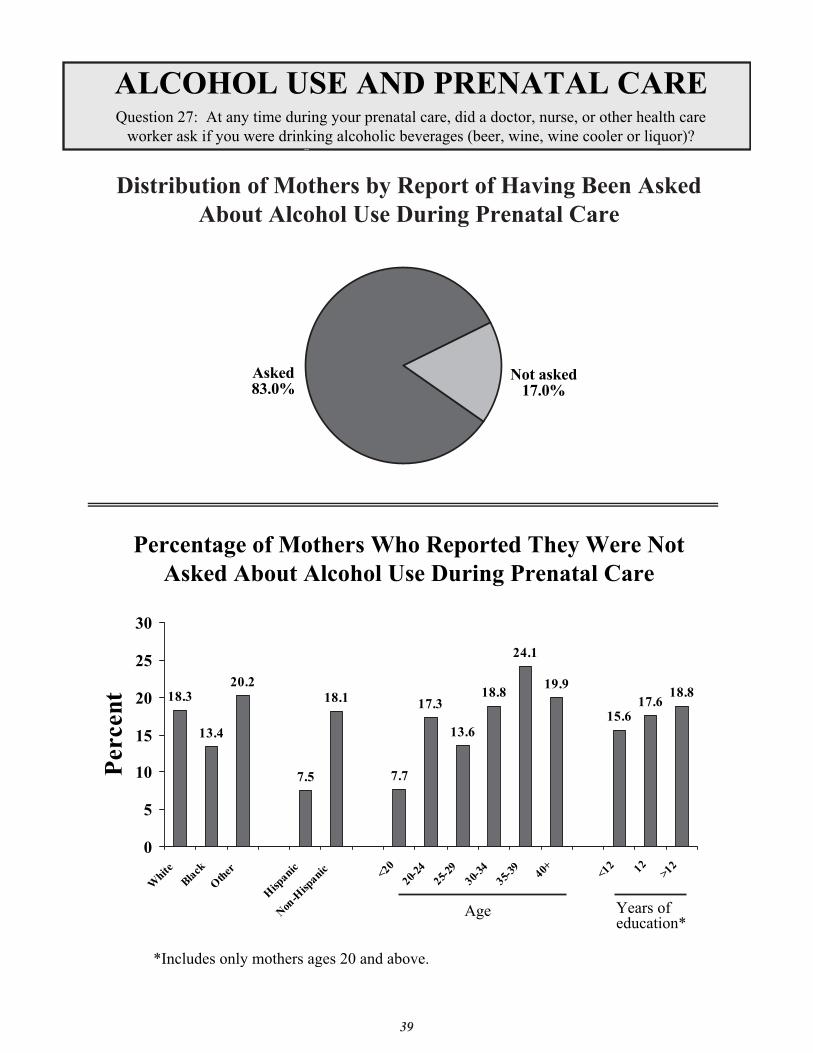
Distribution of Mothers By Report of Having Been Asked About Smoking During Prenatal Care
1112.7
16.2
6.7
12.7
9.110.9
9.1
11.8
19.2 18.4
9.9
15.3
11.4
0
5
10
15
20
25
White
Black
Oth
er
Hisp
anic
Non-H
ispanic <20
20-24
25-29
30-34
35-39 40+ <12 12
>12
Per
cent
Percentage of Mothers Who Reported They Were Not Asked About Smoking During Prenatal Care
Age Years of education*
*Includes only mothers ages 20 and above.
SMOKING AND PRENATAL CAREQuestion 26: At any time during your prenatal care, did a doctor, nurse, or other health care
worker ask if you were smoking cigarettes?
Asked88.0%
Not asked12.0%
36
Distribution of Mothers by Smoking Status During the Three Month Period Before Pregnancy Began
25.6
13.6
9.1 9.1
22.0
37.039.2
19.0
9.1 9.211.9
35.8
22.4
14.3
0
5
10
15
20
25
30
35
40
45
White
Black
Oth
er
Hisp
anic
Non-H
ispanic <20
20-24
25-29
30-34
35-39 40+ <12 12
>12
Per
cent
Percentage of Mothers Who Reported They Smoked During the Three Month Period Before Pregnancy Began
Age Years of education*
*Includes only mothers ages 20 and above.
SMOKING BEFORE PREGNANCYQuestion 39: In the three months before you got pregnant, how many cigarettes or packs of
cigarettes did you smoke on an average day?
Did not smoke79.4%
Smoked20.6%
37
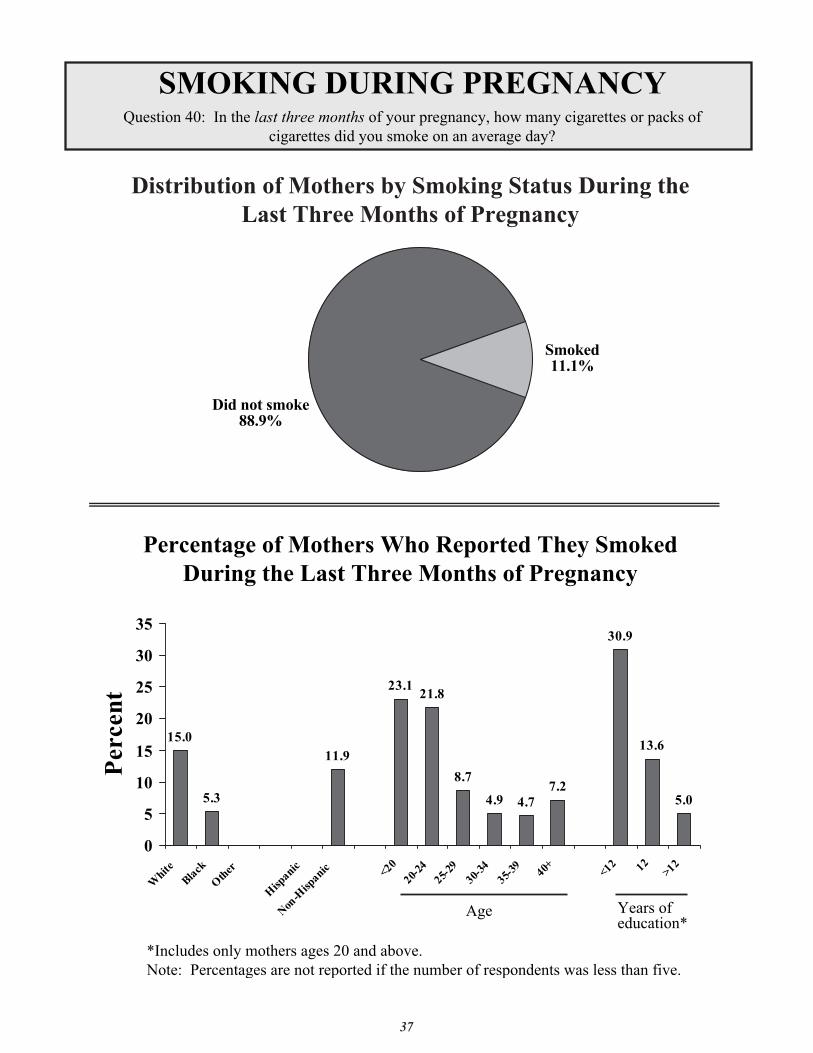
Distribution of Mothers by Smoking Status During the Last Three Months of Pregnancy
15.0
5.3
11.9
23.121.8
8.7
4.9 4.77.2
30.9
13.6
5.0
0
5
10
15
20
25
30
35
White
Black
Oth
er
Hisp
anic
Non-H
ispanic <20
20-24
25-29
30-34
35-39 40+ <12 12
>12
Per
cent
Percentage of Mothers Who Reported They Smoked During the Last Three Months of Pregnancy
Age Years of education*
*Includes only mothers ages 20 and above.Note: Percentages are not reported if the number of respondents was less than five.
SMOKING DURING PREGNANCYQuestion 40: In the last three months of your pregnancy, how many cigarettes or packs of
cigarettes did you smoke on an average day?
Did not smoke88.9%
Smoked11.1%
38
Distribution of Mothers by Smoking Status in the Postpartum Period
20.5
11.9
17.8
31.9 32.1
14.1
6.8 7.2
11.2
37.5
17.8
9.5
0
5
10
15
20
25
30
35
40
White
Black
Oth
er
Hisp
anic
Non-H
ispanic <20
20-24
25-29
30-34
35-39 40+ <12 12
>12
Per
cent
Percentage of Mothers Who Reported They Smoked in the Postpartum Period
Age Years of education*
*Includes only mothers ages 20 and above.
Did not smoke83.6%
Smoked16.4%
SMOKING AFTER PREGNANCYQuestion 41: How many cigarettes or packs of cigarettes do you smoke on an average day now?
39
Distribution of Mothers by Report of Having Been Asked About Alcohol Use During Prenatal Care
18.3
13.4
20.2
7.5
18.1
7.7
17.3
13.6
18.8
24.1
19.9
15.617.6
18.8
0
5
10
15
20
25
30
White
Black
Oth
er
Hisp
anic
Non-H
ispanic <20
20-24
25-29
30-34
35-39 40+ <12 12
>12
Per
cent
Percentage of Mothers Who Reported They Were Not Asked About Alcohol Use During Prenatal Care
Age Years of education*
*Includes only mothers ages 20 and above.
ALCOHOL USE AND PRENATAL CAREme during your prenatal care, did a doctor, nurse, or other health care
wine cooler or liquor)Question 27: At any ti
worker ask if you were drinking alcoholic beverages (beer, wine, ?
Asked83.0%
Not asked17.0%
40
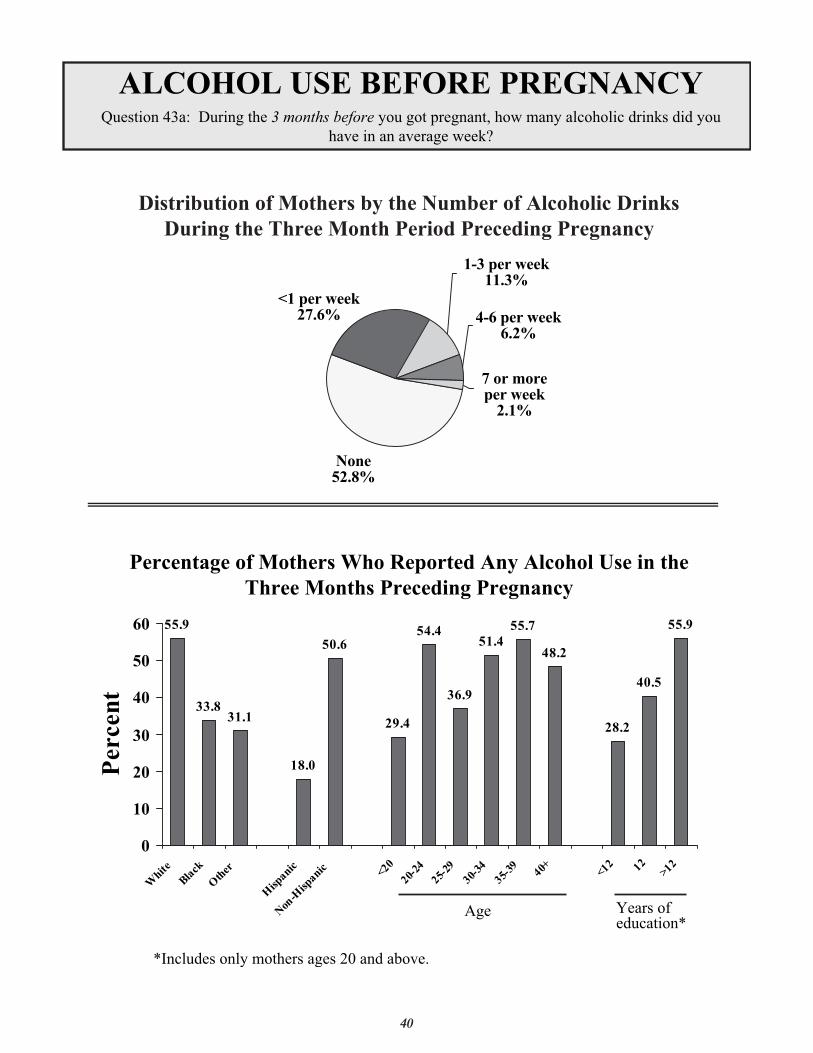
Distribution of Mothers by the Number of Alcoholic Drinks During the Three Month Period Preceding Pregnancy
55.9
33.831.1
18.0
50.6
29.4
54.4
36.9
51.455.7
48.2
28.2
40.5
55.9
0
10
20
30
40
50
60
White
Black
Oth
er
Hisp
anic
Non-H
ispanic <20
20-24
25-29
30-34
35-39 40+ <12 12
>12
Per
cent
Percentage of Mothers Who Reported Any Alcohol Use in the Three Months Preceding Pregnancy
Age Years of education*
*Includes only mothers ages 20 and above.
<1 per week27.6%
1-3 per week11.3%
4-6 per week6.2%
7 or moreper week
2.1%
None52.8%
ALCOHOL USE BEFORE PREGNANCYQuestion 43a: During the 3 months before you got pregnant, how many alcoholic drinks did you
have in an average week?
41
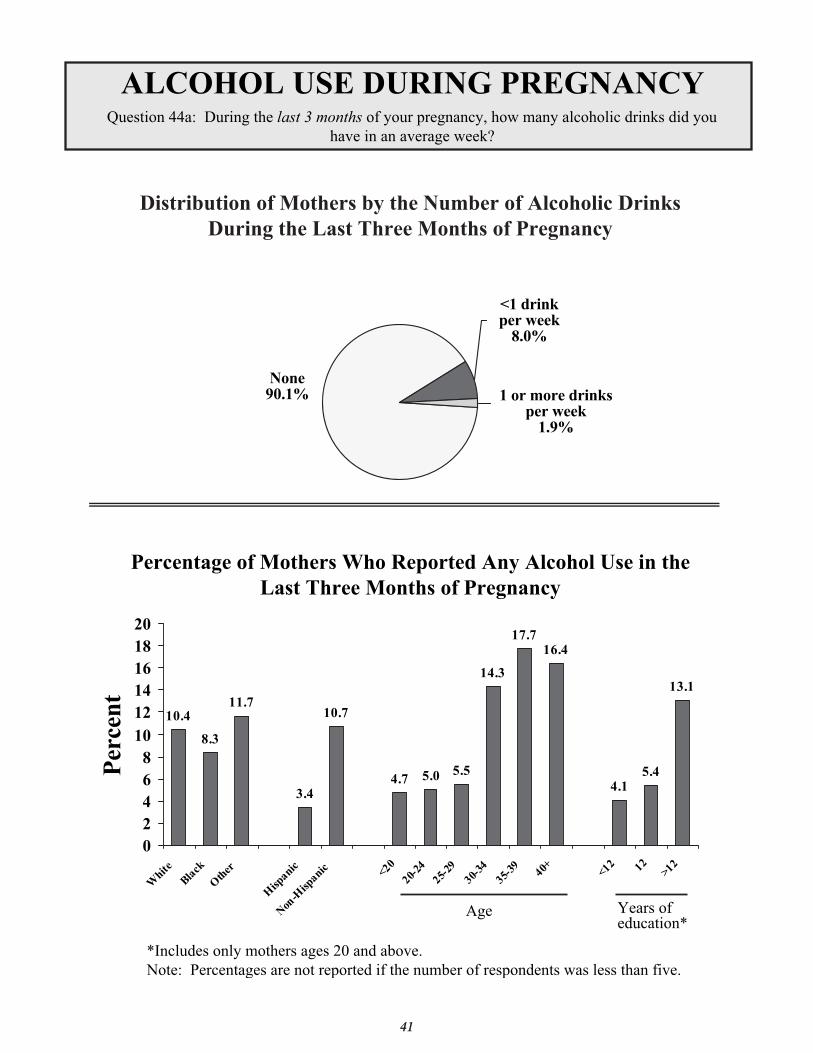
Distribution of Mothers by the Number of Alcoholic Drinks During the Last Three Months of Pregnancy
10.4
8.3
11.7
3.4
10.7
4.7 5.0 5.5
14.3
17.716.4
4.15.4
13.1
02468
101214161820
White
Black
Oth
er
Hisp
anic
Non-H
ispanic <20
20-24
25-29
30-34
35-39 40+ <12 12
>12
Per
cent
Percentage of Mothers Who Reported Any Alcohol Use in the Last Three Months of Pregnancy
Age Years of education*
*Includes only mothers ages 20 and above.Note: Percentages are not reported if the number of respondents was less than five.
ALCOHOL USE DURING PREGNANCYQuestion 44a: During the last 3 months of your pregnancy, how many alcoholic drinks did you
have in an average week?
None90.1%
<1 drinkper week
8.0%
1 or more drinksper week
1.9%
42
Distribution of Mothers by the Number of Alcohol Binges(5+ Drinks in One Sitting) During the Three Month Period
Preceding Pregnancy
15.7
8.49.8
10.9
13.2 12.7
21.7
10.411.7
9.5
5.7
10.511.5
13.7
0
5
10
15
20
25
White
Black
Oth
er
Hisp
anic
Non-H
ispanic <20
20-24
25-29
30-34
35-39 40+ <12 12
>12
Per
cent
Percentage of Mothers Who Reported Any Binge Drinking in the Three Months Preceding Pregnancy
Age Years ofeducation*
*Includes only mothers ages 20 and above.
None87.1%
One6.2%
Two or more6.7%
ALCOHOL BINGES BEFORE PREGNANCYQuestion 43b: During the 3 months before your got pregnant, how many times did you drink 5
alcoholic drinks or more in one sitting?
43
Distribution of Mothers by the Number of Alcohol Binges (5+ Drinks in One Sitting) During the Last Three
Months of Pregnancy
0.2 1.1 0.5 0.7 0.20
5
10
15
20
25
White
Black
Oth
er
Hisp
anic
Non-H
ispanic <20
20-24
25-29
30-34
35-39 40+ <12 12
>12
Per
cent
Percentage of Mothers Who Reported Any Binge Drinking in the Last Three Months of Pregnancy
Age Years of education*
*Includes only mothers ages 20 and above.Note: Percentages are not reported if the number of respondents was less than five.
No binges99.5% One or more
binges0.5%
ALCOHOL BINGES DURING PREGNANCYQuestion 44b: During the last 3 months of your pregnancy, how many times did you drink 5 alcoholic
drinks or more in one sitting?
44
Distribution of Mothers by Abuse Before Pregnancy by Husband or Partner
3.8
8.8
14.2
4.5
9.5
11.1
4.03.2
2.1
6.5
8.1
3.2
0
2
4
6
8
10
12
14
16
White
Black
Oth
er
Hisp
anic
Non-H
ispanic <20
20-24
25-29
30-34
35-39 40+ <12 12
>12
Per
cent
Percentage of Mothers Who Reported Having Been Physically Abused Before Pregnancy by Their Husband or Partner
Age Years of education*
*Includes only mothers ages 20 and above.Note: Percentages are not reported if the number of respondents was less than five.
PHYSICAL ABUSE BEFORE PREGNANCYQuestion 46a: During the 12 months before you got pregnant, did your husband or partner push, hit, slap,
kick, choke, or physically hurt you in any other way?
No abuse94.4%
Abuse5.6%
45
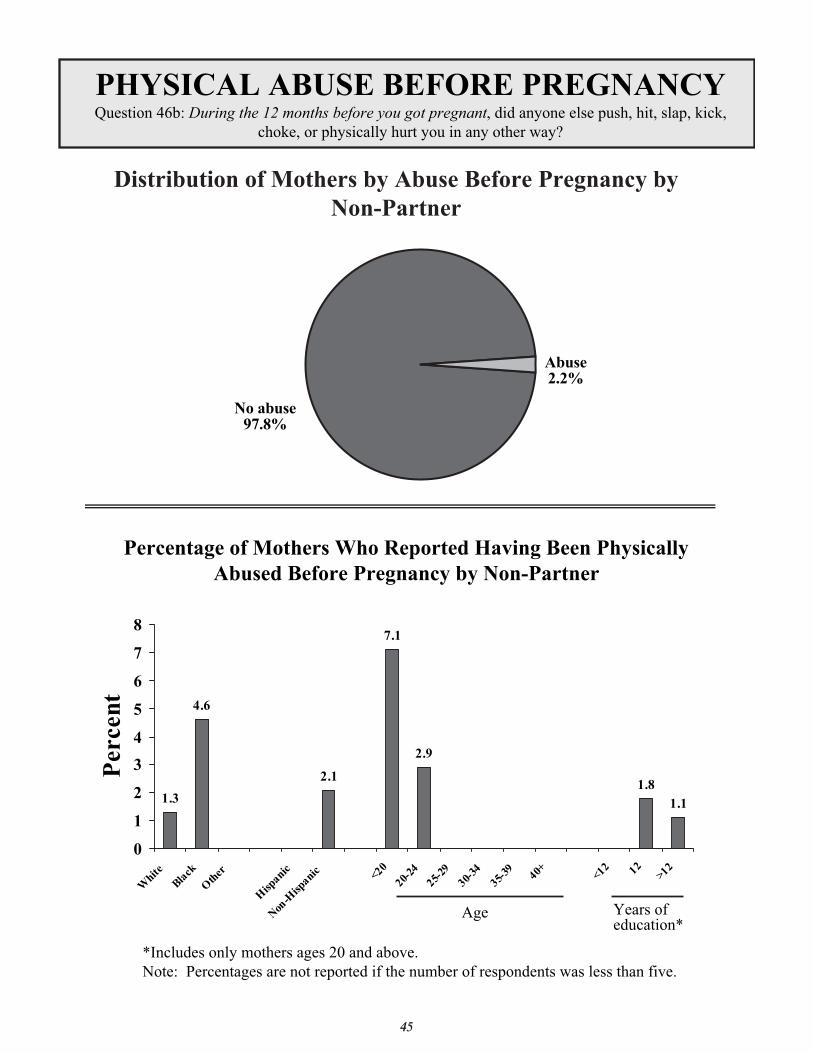
Distribution of Mothers by Abuse Before Pregnancy by Non-Partner
1.3
4.6
2.1
7.1
2.9
1.81.1
0
1
2
3
4
5
6
7
8
White
Black
Oth
er
Hisp
anic
Non-H
ispanic <20
20-24
25-29
30-34
35-39 40+ <12 12
>12
Per
cent
Percentage of Mothers Who Reported Having Been Physically Abused Before Pregnancy by Non-Partner
Age Years of education*
*Includes only mothers ages 20 and above.Note: Percentages are not reported if the number of respondents was less than five.
PHYSICAL ABUSE BEFORE PREGNANCYQuestion 46b: During the 12 months before you got pregnant, did anyone else push, hit, slap, kick,
choke, or physically hurt you in any other way?
No abuse97.8%
Abuse2.2%
46
Distribution of Mothers by Abuse During Pregnancy by Husband or Partner
2.2
7.1
9.1
10.9
3.4
7.7
4.7
2.5
4.45.3
3.3
0
2
4
6
8
10
12
White
Black
Oth
er
Hisp
anic
Non-H
ispanic <20
20-24
25-29
30-34
35-39 40+ <12 12
>12
Per
cent
Percentage of Mothers Who Reported Having Been Physically Abused During Pregnancy by Their Husband or Partner
Age Years of education*
*Includes only mothers ages 20 and above.Note: Percentages are not reported if the number of respondents was less than five.
PHYSICAL ABUSE DURING PREGNANCYQuestion 47a: During your most recent pregnanc , did your husband or partner push, hit, slap, kick,
choke, or physically hurt you in any other way?y
No abuse95.7%
Abuse4.3%
47
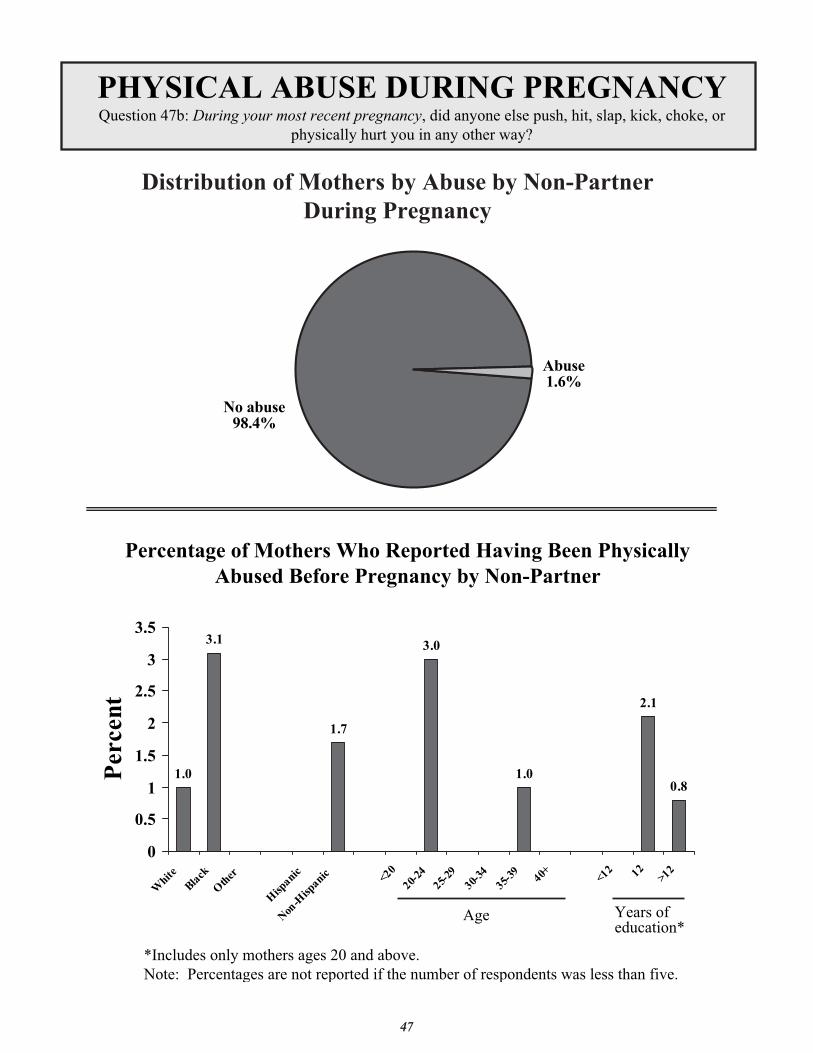
Distribution of Mothers by Abuse by Non-Partner During Pregnancy
1.0
3.1
1.7
3.0
1.0
2.1
0.8
0
0.5
1
1.5
2
2.5
3
3.5
White
Black
Oth
er
Hisp
anic
Non-H
ispanic <20
20-24
25-29
30-34
35-39 40+ <12 12
>12
Per
cent
Percentage of Mothers Who Reported Having Been Physically Abused Before Pregnancy by Non-Partner
Age Years of education*
*Includes only mothers ages 20 and above.Note: Percentages are not reported if the number of respondents was less than five.
PHYSICAL ABUSE DURING PREGNANCYQuestion 47b: During your most recent pregnanc , did anyone else push, hit, slap, kick, choke, or
physically hurt you in any other way?y
No abuse98.4%
Abuse1.6%
48
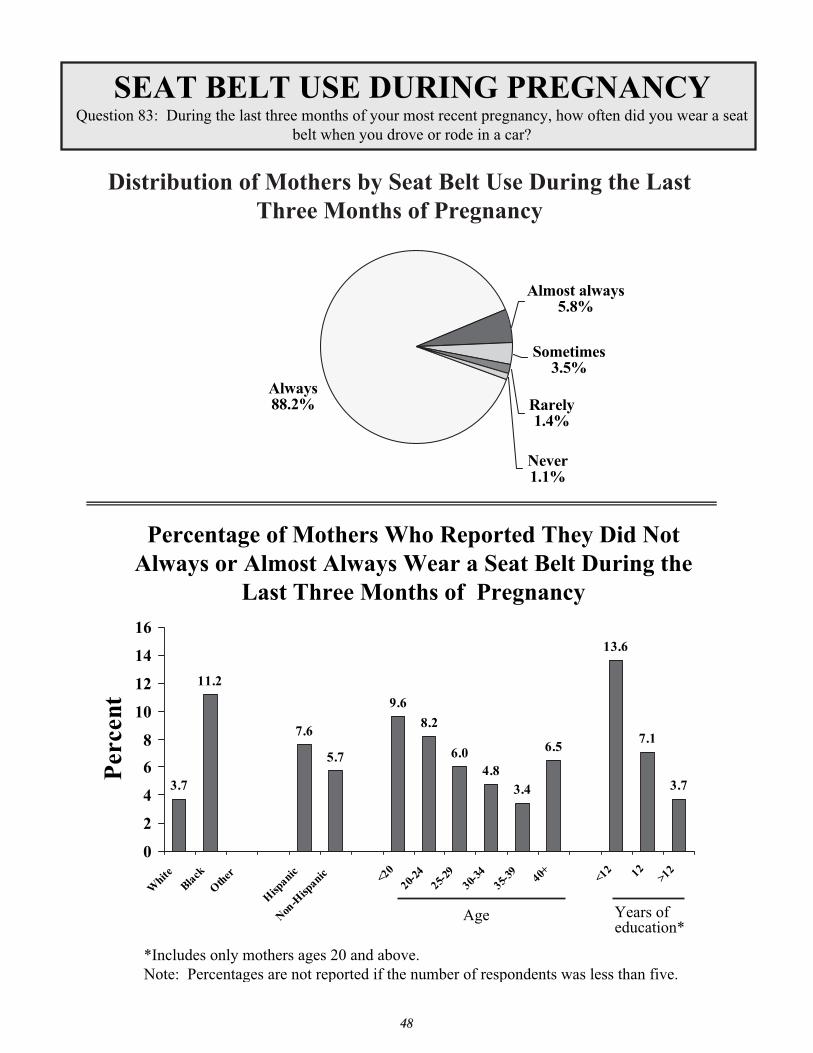
Distribution of Mothers by Seat Belt Use During the Last Three Months of Pregnancy
3.7
11.2
7.6
5.7
9.6
8.2
6.04.8
3.4
6.5
13.6
7.1
3.7
0
2
4
6
8
10
12
14
16
White
Black
Oth
er
Hisp
anic
Non-H
ispanic <20
20-24
25-29
30-34
35-39 40+ <12 12
>12
Per
cent
Percentage of Mothers Who Reported They Did Not Always or Almost Always Wear a Seat Belt During the
Last Three Months of Pregnancy
Age Years of education*
*Includes only mothers ages 20 and above.Note: Percentages are not reported if the number of respondents was less than five.
SEAT BELT USE DURING PREGNANCYQuestion 83: During the last three months of your most recent pregnancy, how often did you wear a seat
belt when you drove or rode in a car?
Always88.2%
Almost always5.8%
Sometimes3.5%
Rarely1.4%
Never1.1%
49
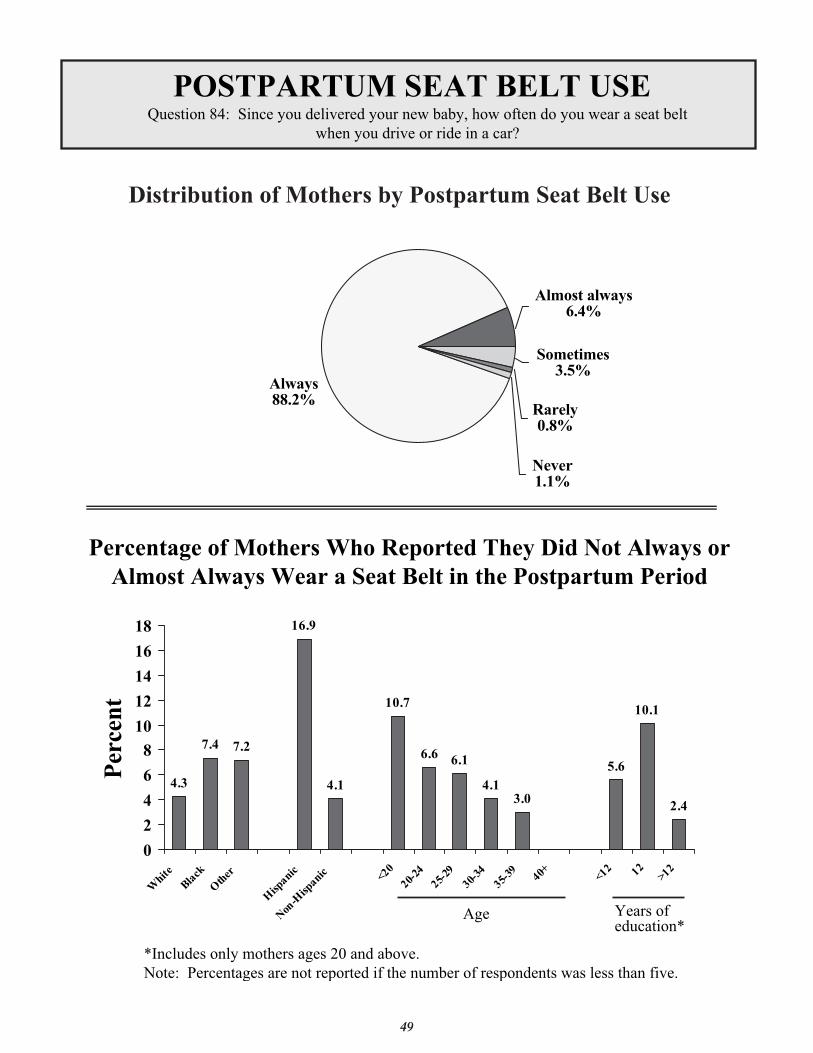
Distribution of Mothers by Postpartum Seat Belt Use
4.3
7.4 7.2
16.9
4.1
10.7
6.6 6.1
4.13.0
5.6
10.1
2.4
0
2
4
6
8
10
12
14
16
18
White
Black
Oth
er
Hisp
anic
Non-H
ispanic <20
20-24
25-29
30-34
35-39 40+ <12 12
>12
Per
cent
Percentage of Mothers Who Reported They Did Not Always or Almost Always Wear a Seat Belt in the Postpartum Period
Age Years of education*
*Includes only mothers ages 20 and above.Note: Percentages are not reported if the number of respondents was less than five.
POSTPARTUM SEAT BELT USEQuestion 84: Since you delivered your new baby, how often do you wear a seat belt
when you drive or ride in a car?
Always88.2%
Almost always6.4%
Sometimes3.5%
Rarely0.8%
Never1.1%
50
Postpartum Factors:Maternal and Infant Health
“Having our baby in the NICU, we needed some supportand counseling, being first time parents, but didn't getany. Also, after the baby was discharged, we should havehad some local support group call to make sure all waswell.”
“Before you leave the hospital, they (doctors) should talkto you more about how to care for your baby. They justsort of say, here's your baby, you're a mom!”
“Need more support for breastfeeding. Formula manufac-turers push their formula in doctor's offices and hospitalsby providing lots of freebies and free samples; this should-n't be allowed.”
PRAMS mothers
52
53
Distribution of Mothers by Use of Postpartum Birth Control
19.5 19.1
35.4
27.5
20.0
11.9
17.3 16.6
26.9 25.9 26.9
18.4
23.021.1
0
5
10
15
20
25
30
35
40
White
Black
Oth
er
Hisp
anicNon
-Hisp
anic <2020-
2425-
29
30-34
35-39 40+ <12 12
>12
Per
cent
Percentage of Mothers Who Reported No Use of Postpartum Birth Control
Age Years of education*
*Includes only mothers ages 20 and above.
Using birthcontrol79.2%
Not using birthcontrol20.8%
POSTPARTUM BIRTH CONTROLQuestion 72: Are you or your husband or partner doing anything now to keep from getting pregnant?
54
Reasons Reported for Not Using Postpartum Birth Control
2.6
4.6
7.1
11.2
13.6
25.4
33.1
0 10 20 30 40
Percent
REASONS FOR NO POSTPARTUM BIRTH CONTROLQuestion 73: What are your or your husband’s or partner’s reasons for not doing anything
to keep from getting pregnant now?
Not having sex
Don’t want to
Want to get pregnant
Husband or partner doesn’t want to
Can’t afford
Infertile
Pregnant
55
Distribution of Mothers by Level of Postpartum Depression
21.923.5
14.4
20.421.8
31.5
26.7
20.819.0
16.413.9
22.323.5
19.2
0
5
10
15
20
25
30
35
White
Black
Oth
er
Hisp
anicNon
-Hisp
anic <2020-
2425-
29
30-34
35-39 40+ <12 12
>12
Per
cent
Percentage of Mothers Who Reported Being at Least Moderately Depressed
Age Years of education*
*Includes only mothers ages 20 and above.
Slightlydepressed
39.8%
Not depressed38.5%
Moderatelydepressed
13.9%
Very depressed5.2%
Needed help2.6%
POSTPARTUM DEPRESSIONQuestion 75: In the months after your delivery, would you say that you were not depressed at all, a little
depressed, moderately depressed, very depressed, or very depressed and had to get help?
56
Distribution of Infants by Admission to a Neonatal Intensive Care Unit
13.9
18.4
14.4 14.115.4 15.0
17.3
12.3
16.214.9
18.920.0
14.8 14.9
0
5
10
15
20
25
White
Black
Oth
er
Hisp
anicNon
-Hisp
anic <2020-
2425-
29
30-34
35-39 40+ <12 12
>12
Per
cent
Percentage of Mothers Who Reported Their Newborn was Admitted to the Neonatal Intensive Care Unit
Age Years of education*
*Includes only mothers ages 20 and above.
NEONATAL INTENSIVE CAREQuestion 52: After your baby was born, was he or she put in an intensive care unit?
No intensive care84.7%
Intensive care15.3%
57
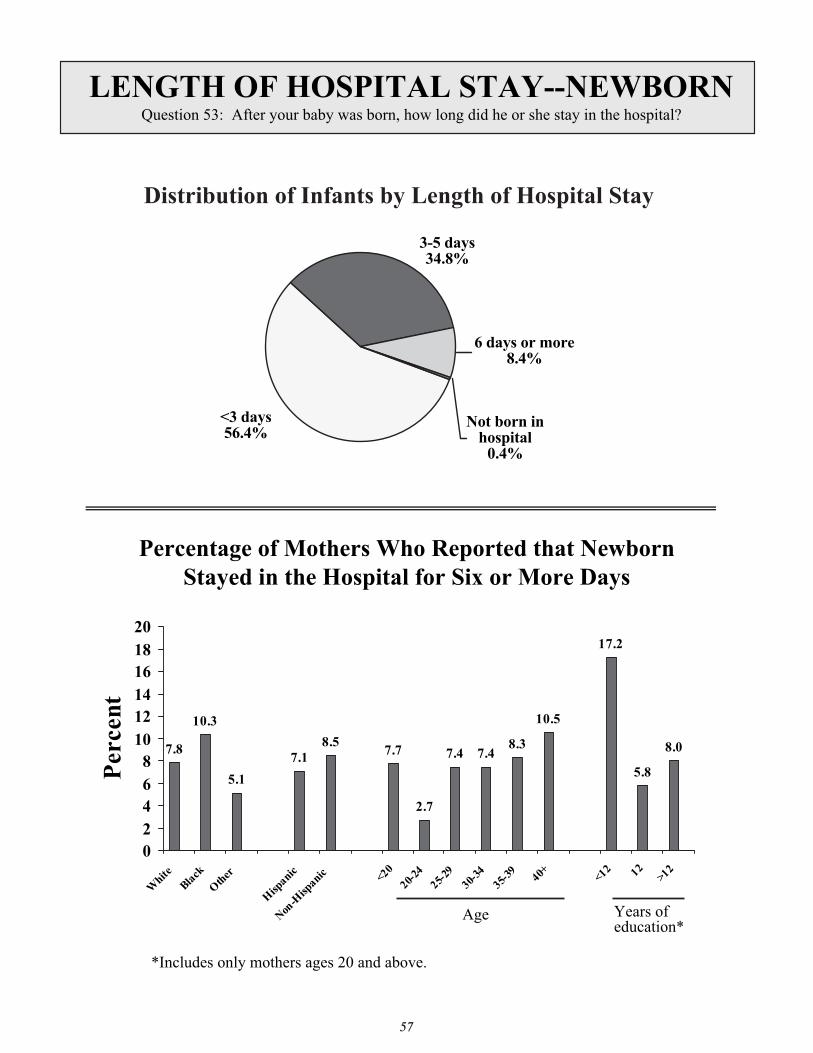
Distribution of Infants by Length of Hospital Stay
7.8
10.3
5.1
7.18.5
7.7
2.7
7.4 7.48.3
10.5
17.2
5.8
8.0
02468
101214161820
White
Black
Oth
er
Hisp
anic
Non-H
ispanic <20
20-24
25-29
30-34
35-39 40+ <12 12
>12
Per
cent
Percentage of Mothers Who Reported that Newborn Stayed in the Hospital for Six or More Days
Age Years of education*
*Includes only mothers ages 20 and above.
<3 days56.4%
3-5 days34.8%
6 days or more8.4%
Not born inhospital
0.4%
LENGTH OF HOSPITAL STAY--NEWBORNQuestion 53: After your baby was born, how long did he or she stay in the hospital?
58
Distribution of Mothers by Breastfeeding Status
81.6
65.4
89.595.1
75.4
63.758.9
84.1 84.9 85.9 86.3
65.2 65.2
87.4
0102030405060708090
100
White
Black
Oth
er
Hisp
anic
Non-H
ispanic <20
20-24
25-29
30-34
35-39 40+ <12 12
>12
Per
cent
Percentage of Mothers Who Reported Ever Breastfeeding Their Infant
Age Years of education*
*Includes only mothers ages 20 and above.
Breastfed77.5%
Did notbreastfeed
22.5%
BREASTFEEDING INITIATIONQuestion 59: Did you ever breastfeed or pump breast milk to feed your new baby after delivery?
59
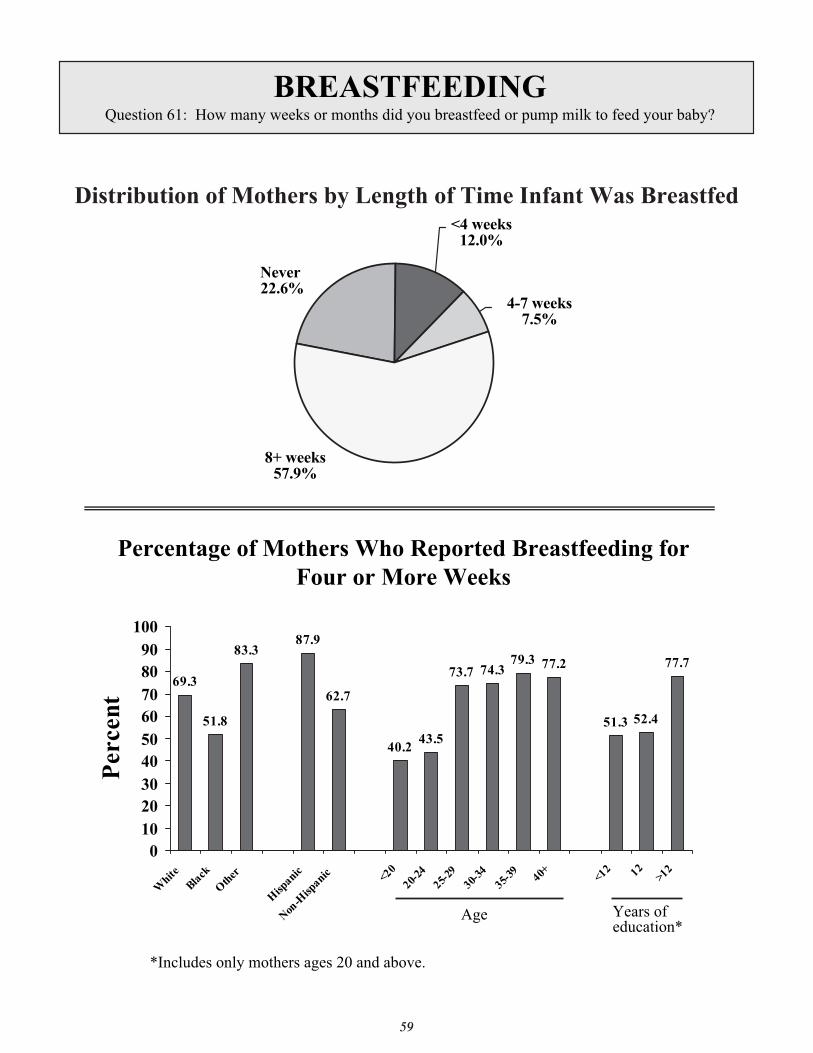
Distribution of Mothers by Length of Time Infant Was Breastfed
69.3
51.8
83.387.9
62.7
40.243.5
73.7 74.379.3 77.2
51.3 52.4
77.7
0102030405060708090
100
White
Black
Oth
er
Hisp
anic
Non-H
ispanic <20
20-24
25-29
30-34
35-39 40+ <12 12
>12
Per
cent
Percentage of Mothers Who Reported Breastfeeding for Four or More Weeks
Age Years of education*
*Includes only mothers ages 20 and above.
Never 22.6%
<4 weeks12.0%
4-7 weeks7.5%
8+ weeks57.9%
BREASTFEEDINGQuestion 61: How many weeks or months did you breastfeed or pump milk to feed your baby?
60
Distribution of Infants by Sleep Position
10.7
27.2
10.9
4.7
16.9 17.2
25.0
11.4
14.012.3
11.19.3
17.315.4
0
5
10
15
20
25
30
White
Black
Oth
er
Hisp
anic
Non-H
ispanic <20
20-24
25-29
30-34
35-39 40+ <12 12
>12
Per
cent
Percentage of Infants Usually Placed on Stomach to Sleep
Age Years of education*
*Includes only mothers ages 20 and above.
Back64.0%
Stomach15.6%
Combination6.8%
Side13.6%
SLEEP POSITIONQuestion 64: How do you lay your baby down to sleep now?most often
61
Distribution of Births by Health Care Visit in the First Week After Leaving the Hospital
16.0
18.716.7
7.0
16.8
24.6
12.3
16.217.4 17.7 17.9
21.2 20.5
12.1
0
5
10
15
20
25
30
White
Black
Oth
er
Hisp
anic
Non-H
ispanic <20
20-24
25-29
30-34
35-39 40+ <12 12
>12
Per
cent
Percentage of Mothers Who Reported Their Baby Did Not Have a Health Care Visit in the First Week After Leaving the Hospital
Age Years of education*
*Includes only mothers ages 20 and above.
INFANT HEALTH CARE VISITQuestion 67: Was your baby seen by a doctor, nurse, or other health care provider in the first week after
he or she left the hospital?
No16.8%
Yes83.2%
62
Maryland PRAMSPhase 4 Questionnaire
“I hope with these answers that I've given will help youwith the survey and will help the Mothers and babies ofMaryland.”
“I think this is wonderful what you are doing with this survey. I am glad I could help out and I hope I did. Thankyou for picking me. “
“I hope this survey helps babies in Maryland and everywhere be healthier.”
PRAMS mothers
64
65
66
67
68
69
70
71
72
73
74
75
¤�
76
77
78
79
80
81
82
May 2005
The services and facilities of the Maryland Department of Health and Mental Hygiene (DHMH) are operated on a non-discriminatory basis. This policy prohibits discrimination on the basis of race, color, sex, or national origin and applies to the provisions of employment and granting of advantages, privileges, and accommodations.
The Department, in compliance with the Americans With Disabilities Act, ensures that qualified individuals with disabilities are given an opportunity to participate in and benefit from DHMH services, programs, benefits, and employment opportunities.
Funding for this publication was provided by the Maryland Department of Health and Mental Hygieneand by grant #U50/CCU317134-05 from the Centers for Disease Control and Prevention, Pregnancy Risk Assessment Monitoring System (PRAMS)