New Listings A count of the properties that have been newly listed on the market in a given month. For the Week Ending Current Activity One Year Ago +/- 12/4/2010 2,900 2,978 - 2.6% 12/11/2010 2,664 2,789 - 4.5% 12/18/2010 2,352 2,209 + 6.5% 12/25/2010 1,657 1,295 + 28.0% 1/1/2011 1,602 1,875 - 14.6% 1/8/2011 3,161 3,400 - 7.0% 1/15/2011 3,071 3,644 - 15.7% 1/22/2011 3,069 3,618 - 15.2% 1/29/2011 2,626 3,730 - 29.6% 2/5/2011 3,145 3,393 - 7.3% 2/12/2011 3,184 2,055 + 54.9% 2/19/2011 3,326 3,309 + 0.5% 2/26/2011 3,103 3,793 - 18.2% 3-Month Total 35,860 38, 0 88 - 5.8% All data provided by Rea lEstate Business Intelligence, LLC | An MRIS Company. This report may be reproduce d by MRIS members. Data current as of March 7, 2011. Powered by 10K Resea rch and Marketing. | Click for Cover | 2 900 1,400 1,900 2,400 2,900 3,400 3,900 4,400 12 /4/1 0 12 /11/ 10 12 /1 8/ 10 12 /25/ 10 1/ 1/ 11 1/ 8/ 11 1/ 15 /1 1 1/ 22 /11 1/ 29 /11 2/ 5/ 11 2/ 12 /11 2/ 19 /1 1 2/ 26 /11 Last Three Months Cu rr ent Ac ti vit y One Ye ar Ag o 0 1,000 2,000 3,000 4,000 5,000 6,000 7,000 8,000 9,000 1-2003 1-2004 1-2005 1-2006 1-2007 1-2008 1-2009 1-2010 1-2011 Historical New Listing Activity
Transcript
8/7/2019 Maryland Real Estate Market Activity, March 7, 2011, New Listings, Pending Sales, Days on Market
New ListingsA count of the properties that have been newly listed on the market in a given month.
For the
Week Ending
Current
Activity
One Year
Ago+/-
12/4/2010 2,900 2,978 - 2.6
12/11/2010 2,664 2,789 - 4.5
12/18/2010 2,352 2,209 + 6.5
12/25/2010 1,657 1,295 + 28.0
1/1/2011 1,602 1,875 - 14.6
1/8/2011 3,161 3,400 - 7.0
1/15/2011 3,071 3,644 - 15.7
1/22/2011 3,069 3,618 - 15.2
1/29/2011 2,626 3,730 - 29.6
2/5/2011 3,145 3,393 - 7.3
2/12/2011 3,184 2,055 + 54.9
2/19/2011 3,326 3,309 + 0.5
2/26/2011 3,103 3,793 - 18.2
3-Month Total 35,860 38,088 - 5.8
All data provided by RealEstate Business Intelligence, LLC | An MRIS Company. This report may be reproduced by MRIS members. Data current as of March 7, 2011. Powered by 10K Research and Marketing. | Click for Co
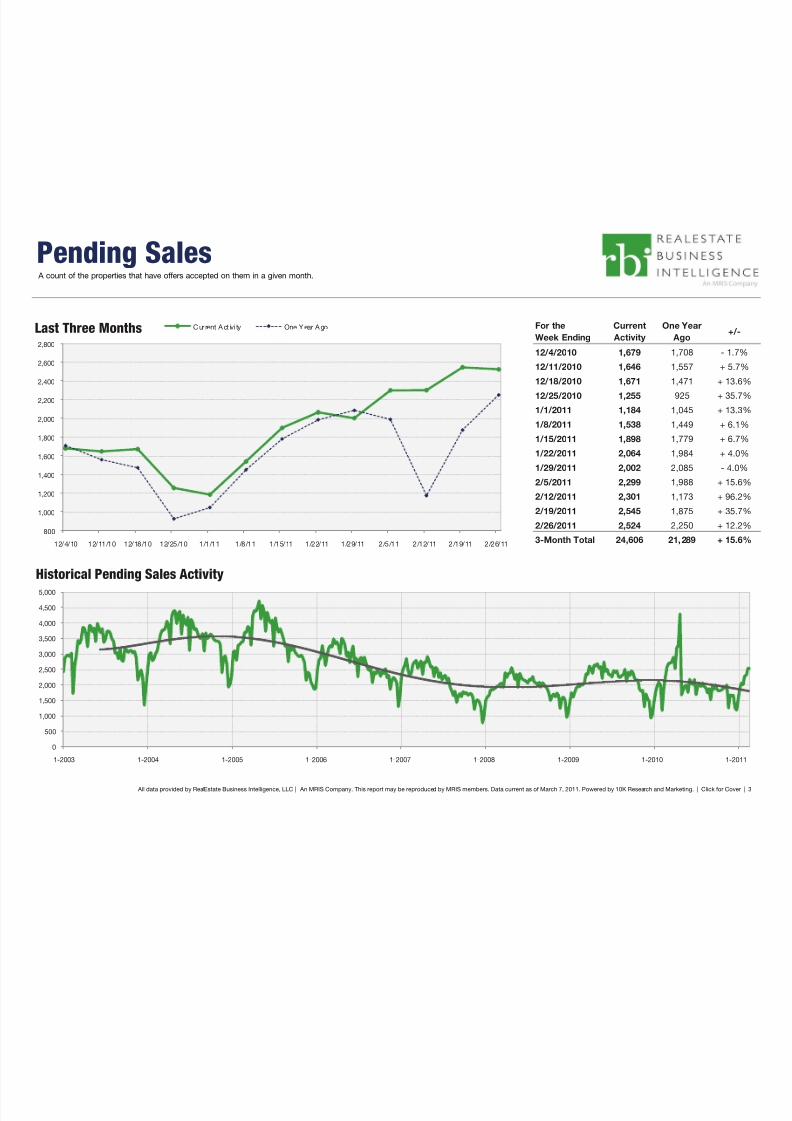
Pending SalesA count of the properties that have offers accepted on them in a given month.
For the
Week Ending
Current
Activity
One Year
Ago+/-
12/4/2010 1,679 1,708 - 1.7
12/11/2010 1,646 1,557 + 5.7
12/18/2010 1,671 1,471 + 13.6
12/25/2010 1,255 925 + 35.7
1/1/2011 1,184 1,045 + 13.3
1/8/2011 1,538 1,449 + 6.1
1/15/2011 1,898 1,779 + 6.7
1/22/2011 2,064 1,984 + 4.0
1/29/2011 2,002 2,085 - 4.0
2/5/2011 2,299 1,988 + 15.6
2/12/2011 2,301 1,173 + 96.2
2/19/2011 2,545 1,875 + 35.7
2/26/2011 2,524 2,250 + 12.2
3-Month Total 24,606 21,289 + 15.6
All data provided by RealEstate Business Intelligence, LLC | An MRIS Company. This report may be reproduced by MRIS members. Data current as of March 7, 2011. Powered by 10K Research and Marketing. | Click for Co
Inventory of Homes for SaleThe number of properties available for sale in active status at the end of the month.
For the
Week Ending
Current
Activity
One Year
Ago+/-
12/4/2010 63,364 61,215 + 3.5%
12/11/2010 61,975 60,712 + 2.1%
12/18/2010 61,230 60,149 + 1.8%
12/25/2010 60,132 59,347 + 1.3%
1/1/2011 59,614 59,021 + 1.0%
1/8/2011 56,507 56,398 + 0.2%
1/15/2011 56,481 56,866 - 0.7%
1/22/2011 56,203 57,232 - 1.8%
1/29/2011 55,899 57,537 - 2.8%
2/5/2011 54,753 57,420 - 4.6%
2/12/2011 54,297 57,656 - 5.8%
2/19/2011 53,942 57,724 - 6.6%
2/26/2011 53,479 57,746 - 7.4%
3-Month Avg 57,529 58,386 - 1.5%
All data provided by RealEstate Business Intelligence, LLC | An MRIS Company. This report may be reproduced by MRIS members. Data current as of March 7, 2011. Powered by 10K Research and Marketing. | Click for Cove
Days on Market Until SaleThe average number of days between when a property is first listed and when an offer is accepted. Sold properties only.
MonthCurrent
Activity
One Year
Previous+/-
February 86 123 - 30.3
March 85 119 - 29.0
April 78 110 - 29.6
May 74 108 - 31.5
June 72 100 - 28.0
July 71 95 - 24.9
August 76 92 - 17.5
September 81 91 - 10.6
October 83 90 - 7.7
November 86 84 + 1.5
December 90 85 + 5.8
January 97 86 + 13.8
12-Month Avg 80 98 - 17.8
All data provided by RealEstate Business Intelligence, LLC | An MRIS Company. This report may be reproduced by MRIS members. Data current as of March 7, 2011. Powered by 10K Research and Marketing. | Click for Co
Median Sales PriceThe median sales price for all closed sales in a given month. Sold properties only. Does not account for seller concessions.
MonthCurrent
Activity
One Year
Previous+/-
February $250,000 $245,700 + 1.8
March $250,000 $253,000 - 1.2
April $260,000 $252,500 + 3.0
May $268,800 $270,000 - 0.4
June $280,000 $280,000 0.0%
July $285,000 $280,000 + 1.8
August $281,000 $275,000 + 2.2
September $265,000 $260,000 + 1.9
October $265,000 $255,000 + 3.9
November $268,000 $255,000 + 5.1
December $260,000 $260,000 0.0%
January $238,000 $245,000 - 2.9
12-Month Avg $265,000 $262,129 + 1.1
All data provided by RealEstate Business Intelligence, LLC | An MRIS Company. This report may be reproduced by MRIS members. Data current as of March 7, 2011. Powered by 10K Research and Marketing. | Click for Co