30
Maryland’s Budget Benjamin Orr UMD School of Social Work Baltimore, MD March 27, 2017 @mdeconomy A moral document at a turning point
| Date post: | 11-Apr-2017 |
| Category: |
Government & Nonprofit |
| Upload: | kali-schumitz |
| View: | 30 times |
| Download: | 0 times |

Maryland’s Budget
Benjamin Orr
UMD School of Social Work
Baltimore, MD
March 27, 2017
@mdeconomy
A moral document at a turning point
All MDers should be able
to achieve their full
potential in a healthy
economy that offers a
widely shared, rising
standard of living

What do we value as a state?
Where do we invest our money?

$43.5 Billion Operating BudgetProposed FY 2018
Health
$14.1
Education
$8.0
Higher Education
$6.4
Transportation
$5.2
Human
Services
$3.0
Public Safety
$2.2
Other
$1.7
Public Debt
$1.3
Natural Resources
$1.0
Legislative, Judicial,
Legal
$0.8 $ in billions

$4.5 Billion Capital BudgetState Facilities
$118.0
Health/Social
$58.4
Environment
$799.8
Public Safety
$7.5
Education
$371.5
Higher Education
$384.8
Housing/Economic
Development
$131.5
Local Projects (Administration)
$19.5 Proposed FY 2018
$ in millions
Transportation
=
$2.7 billion
Remaining $1.8 billion =

Debt Affordability Criteria
Balancing act between needs and ability to pay (also bond ratings)
Borrowing caps on state debt (driven by GO bonds)
• All debt service: 8% of State revenues
• All debt outstanding: 4% of State personal income
Legislators recommended: $1,065 million GO bonds
• 1% growth over FY 2017
Governor’s proposal: $995 million GO bonds (zero growth)
http://www.treasurer.state.md.us/media/95474/2016_cdac_report.pdf
http://mgaleg.maryland.gov/Pubs/BudgetFiscal/2016-spending-affordability-interim-report.pdf
Fiscal Year 2018
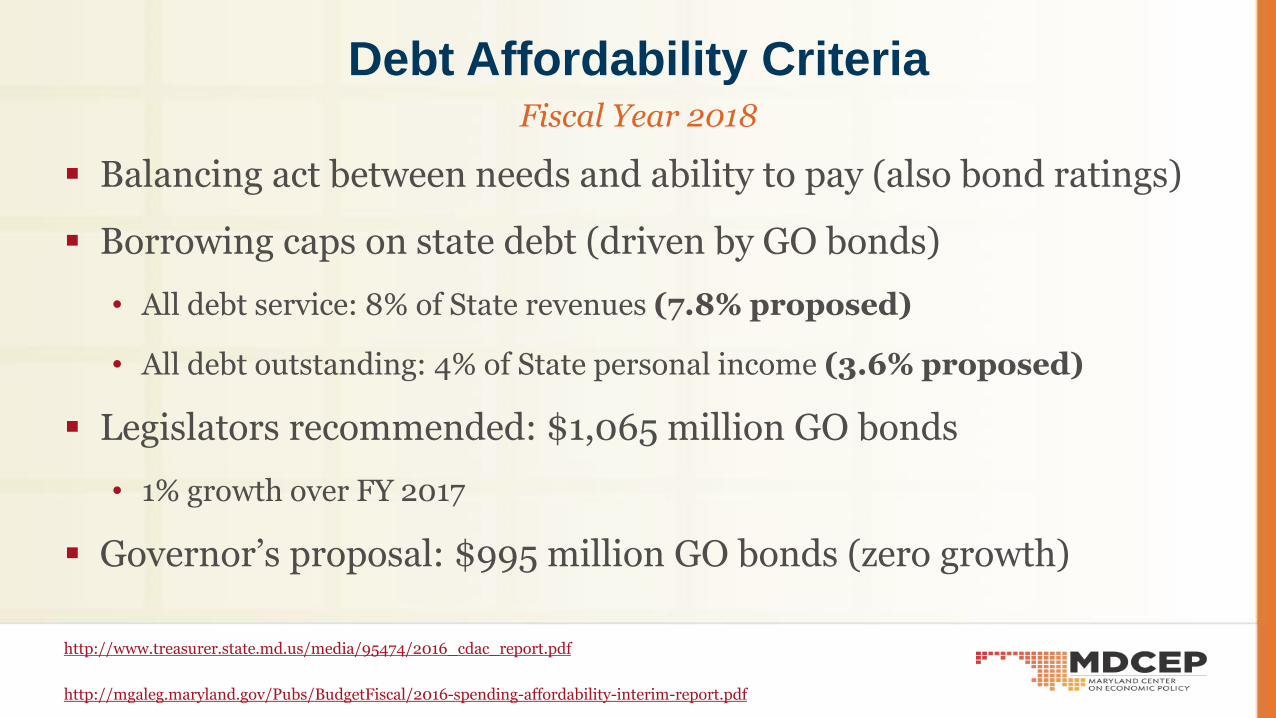
Debt Affordability Criteria
Balancing act between needs and ability to pay (also bond ratings)
Borrowing caps on state debt (driven by GO bonds)
• All debt service: 8% of State revenues (7.8% proposed)
• All debt outstanding: 4% of State personal income (3.6% proposed)
Legislators recommended: $1,065 million GO bonds
• 1% growth over FY 2017
Governor’s proposal: $995 million GO bonds (zero growth)
http://www.treasurer.state.md.us/media/95474/2016_cdac_report.pdf
http://mgaleg.maryland.gov/Pubs/BudgetFiscal/2016-spending-affordability-interim-report.pdf
Fiscal Year 2018

How do we pay for these investments?
And who pays?

$43 Billion Operating BudgetProposed FY 2018
General Funds
$17.1
Special Funds
$9.1
Federal Funds
$13.0
Higher
Education
Funds
$4.4
$ in billions
General Fund
Revenue Sources
FY 18
Projection
Individual Income Tax $9,406 million
Sales & Use Tax $4,727 million
Corporate Income Tax $830 million
Other Business Taxes $532 million
State Lottery $505 million
Tobacco & Alcohol Taxes $426 million
Estate & Inheritance Taxes $185 million
Court revenue $107 million
Other revenues $420 million
At least $400
million at risk in
President Trump’s
budget

9.7% 9.5% 10.3%9.7%
8.5% 8.8%
6.7%
0%
2%
4%
6%
8%
10%
12%
Lowest
20%
Second
20%
Middle
20%
Fourth 20% Next 15% Next 4% Top 1%
Low income MDers pay greater share of income in
state/local taxesShares of family income for taxpayers under 65
Who Pays? A Distributional Analysis of the Tax System in All 50 States. (2015). Institute on Taxation and Economic Policy. See: http://www.itep.org/whopays/full_report.php
<$24,000 >$481,000$44k-$67k $111k-$211k

Maryland Has Room to Raise More Revenue
1 “State and Local Tax Revenue as a Share of Personal Income,” Tax Policy Center, 2016, http://www.taxpolicycenter.org/statistics/state-and-local-tax-revenue-percentage-personal-income.
U.S. Average
0.00%
2.00%
4.00%
6.00%
8.00%
10.00%
12.00%
14.00%
New
Yo
rk
Wyo
min
g
Dis
tric
t o
f C
olu
mb
ia
Ma
ssa
ch
use
tts
New
Me
xic
o
Haw
aii
Mic
hig
an
Mo
nta
na
Wis
co
nsin
Min
nesota
Ore
gon
Ma
ine
Ve
rmo
nt
Rh
ode
Isla
nd
Uta
h
Lou
isia
na
We
st
Virg
inia
Illin
ois
Iow
a
Dela
ware
Calif
orn
ia
Pe
nn
sylv
an
ia
New
Je
rsey
Nort
h D
akota
Ma
ryla
nd
Ari
zo
na
Okla
ho
ma
Neb
raska
Mis
sis
sip
pi
So
uth
Da
ko
ta
Ge
org
ia
Ka
nsa
s
Ke
ntu
cky
So
uth
Ca
rolin
a
Con
ne
cticut
Nort
h C
aro
lina
Ala
ba
ma
Wa
sh
ing
ton
Idah
o
Te
xa
s
Co
lora
do
Neva
da
Oh
io
India
na
Te
nn
essee
Vir
gin
ia
Ark
an
sa
s
Mis
so
uri
Flo
rid
a
New
Ha
mp
sh
ireS
tate
and L
ocal T
axes a
s a
Share
of P
ers
onal In
com
e, 2014
Source: Tax Policy Center 2016. Note: Alaska is omitted because its tax system has limited comparability to other states. State and local taxes in Alaska are 36 percent of the state's personal income due to high severance tax revenues.

MDers of color more likely to pay a
greater share of their income in taxes
Maryland Center on Economic Policy. Maryland’s Poor Taxed More Than Rich; Communities of Color Feel Biggest Pinch. March 2015.
0%
5%
10%
15%
20%
25%
30%
35%
40%
Poorest20% ≤$24,000
Second20%$24,000-$44,000
Middle 20%$44,000-$67,000
Fourth 20%$67,000-$111,000
Richest 20% ≥$111,000
White alone Non whites Excluding Asians

Female-headed HH more likely to pay
greater share of their income in taxes
Maryland Center on Economic Policy.
0%
5%
10%
15%
20%
25%
30%
Poorest20% ≤$24,000
Second 20%$24,000-$44,000
Middle 20%$44,000-$67,000
Fourth 20%$67,000-$111,000
Richest 20% ≥$111,000
Total Male-Headed Households Total Female-Headed Households

Business taxes are a smaller share of
MD’s economy than in other states
Ernst & Young, FY14 COST report on state and local taxes
4.6%3.8%
0%
2%
4%
6%
8%
10%
12%
14%
ND AL
VT
WY
NM M
I
HI
ME
WV
NY
MT
MV
WA RI
FL NJ IL AZ
SC TX DC KS
KY
OK
MN SK
USA ID IA P
A
WI
AL
CA
DE
AK
CO
NB
TN MA
NH
OH LA GA
MD
UT
VA IN MI
MO
NC CT
OR
MD business gets a $1 return for every 70
cents invested in state and local taxes

Why MD Needs More Revenue Still recovering from Great Recession
• Returning jobs are lower-quality
• Still have fifth highest foreclosure rate
Lots of unmet needs across state
• $2.6 billion investment needed in K-12 education
• 19,000 students on waitlist for state need-based financial aid
• We only support 61% of the Maryland Minimum Living Level
Revenues growing slower than mandated costs
Direct and indirect federal cuts
Debt service costs rising

Potential Resources for Investment
Eliminate corporate “nowhere income”, level the playing field for local business: $53 to $69 million
Stop cutting the multi-millionaire estate tax: $17 million in fiscal year 2019, increasing to $60 million in fiscal year 2022
Close the carried interest loophole benefiting hedge fund managers: $50 million
Modernize the sales tax: $320 million
Tax marijuana like alcohol: $200 million
http://www.mdeconomy.org/wp-content/uploads/2014/12/Revenue-options-brief.pdf
Annual Revenue Estimates

How can Marylanders
influence the state’s budget?

Agencies develop recommendations
• Governor provides guidance to agencies
• Summer-Fall
DBM drafts budget
• Incorporates agency feedback, governor priorities
• Through early January
Spending Affordability Committee
• Joint legislative committee
• Makes recommendation on how much budget, workforce should grow
• November -December
Governor introduces
budget
• Mid-January
• DLS fiscal briefing Monday after budget introduced
Legislature holds
hearings
• January to April
• Chambers take turns originating
Budget passed
• Deadline is one week before Sine Die
• Budget does not require governor’s signature
Agencies implement
budget
• Start work on next budget
Budget LifecycleFiscal year starts July 1st
BRE stands for Board of Revenue Estimates Sine Die is the name for the last day of sessionDBM stands for Department of Budget and ManagementDLS stands for Department of Legislative Services
September
BRE
estimates
March
BRE
estimates
Governor can cut up
to 25% of individual
line items through
Board of Public
Works
December
BRE
estimates

How Much State Spending is Discretionary?
FY 15 Mandated Appropriations In The Maryland State Budget Exhibit 1

Threats from Washington

Massive Threats on the Horizon
Repealing the Affordable Care Act (including Medicaid expansion)
• Half a million Marylanders would lose health insurance
• $1.4 Billion budget hole ($14 billion over 10 years)
Ending the safety net as we know it, esp. SNAP & Medicaid
Deep budget cuts to other programs that help struggling people
Major tax cuts for the wealthy, including corporations, that would
force deeper cuts

It all comes down to non-defense discretionary
spending (NDD)
NDD spending already at historically low levels
Already scheduled to get hit even harder by the return of the sequester
Republicans have talked about undoing the sequester for defense spending but leaving it – or even deepening it – for NDD spending
Huge consequences for states (receive 25% of NDD)

NDD Spending Falling to Historic Lows as
Percentage of GDP
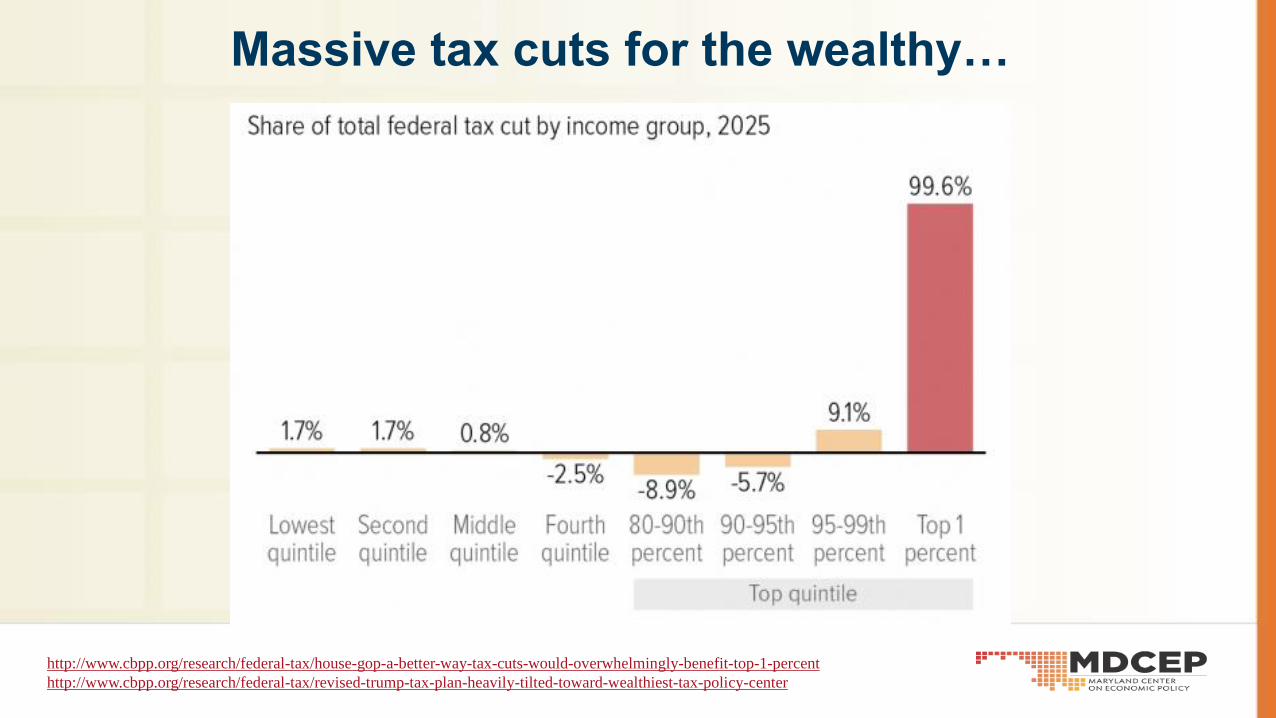
Massive tax cuts for the wealthy…
http://www.cbpp.org/research/federal-tax/house-gop-a-better-way-tax-cuts-would-overwhelmingly-benefit-top-1-percent
http://www.cbpp.org/research/federal-tax/revised-trump-tax-plan-heavily-tilted-toward-wealthiest-tax-policy-center

… Which means
even less funding
for human needs
programs

Reconciliation = Key Vehicle
Only need 51
votes in Senate
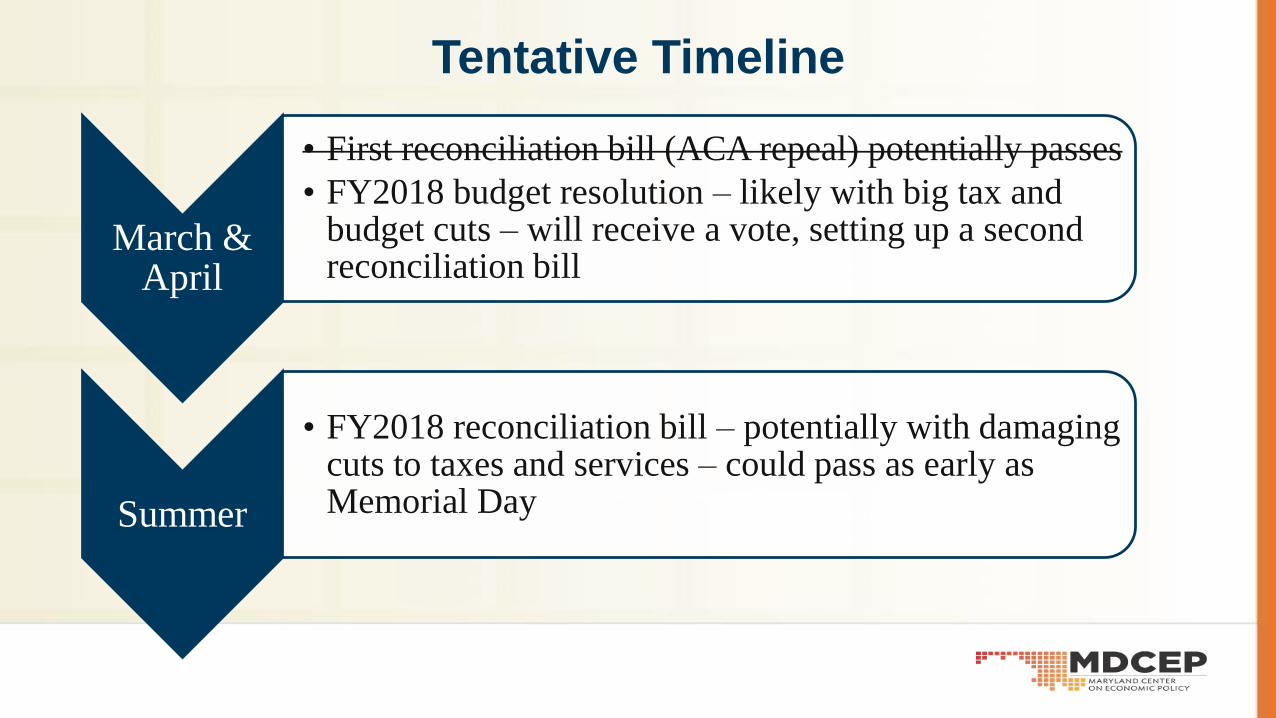
Tentative Timeline
March & April
• First reconciliation bill (ACA repeal) potentially passes
• FY2018 budget resolution – likely with big tax and budget cuts – will receive a vote, setting up a second reconciliation bill
Summer
• FY2018 reconciliation bill – potentially with damaging cuts to taxes and services – could pass as early as Memorial Day

Threats from Washington: Solutions?
Protect structure of the safety net (vital)
Increase the NDD funding caps (unlikely)
• Democrats may have a little leverage because appropriations bills require 60 votes in the Senate
• Republicans most interested in increasing DEFENSE spending, which would put even more pressure on NDD spending if they continue deficit reduction
• President Trump also said during the campaign that he would pay for his massive tax cuts by cutting more from NDD spending
MD must get creative to make up the difference, ask all to pay their fair share to protect building blocks of modern economy

Bottom line:
Will Maryland and the
federal government
continue to invest in
the pillars of our
modern economy, or
will we make cuts to
education, healthcare,
and public safety?

www.mdeconomy.org
@mdeconomy


