70
“Developing Springfield” Mason Square Supermarket Nathan Schmidt Justin Hence Abimael Mercado Nicholas Benson Alex Dymek
“Developing Springfield”
Mason Square Supermarket
Nathan Schmidt
Justin Hence
Abimael Mercado
Nicholas Benson
Alex Dymek
1 | M a s o n S q u a r e S u p e r m a r k e t
Table of Contents Mission Statement ........................................................................................................................... 2
Project Objectives ........................................................................................................................... 3
Acknowledgements ......................................................................................................................... 4
Abstract ........................................................................................................................................... 5
Executive Summary ........................................................................................................................ 6
Methodology ................................................................................................................................... 8
Results and Discussion ................................................................................................................. 10
Strategic Business and Finance Issues ...................................................................................... 10
Introduction ........................................................................................................................... 10
Operation Models.................................................................................................................. 10
Financial Model .................................................................................................................... 15
Tactical Recommendations and Analysis ................................................................................. 16
Introduction ........................................................................................................................... 16
Possible Grants...................................................................................................................... 17
Incorporating a Bank............................................................................................................. 17
Promotional Offers................................................................................................................ 18
Lottery Sales ......................................................................................................................... 18
Green Technology/Eco ......................................................................................................... 19
Security/Loss Prevention ...................................................................................................... 24
Public Image ......................................................................................................................... 34
Conclusion .................................................................................................................................... 36
Process Paper ................................................................................................................................ 39
Appendix A: Green Technologies ................................................................................................ 41
Appendix B: Xcelerator Savings .................................................................................................. 42
Appendix C: Store Loss ................................................................................................................ 43
Appendix D: Market Analysis ...................................................................................................... 44
Introduction And Overview .......................................................................................................... 46
Marketing Analysis ....................................................................................................................... 47
STP Analysis ............................................................................................................................. 47
SWOT Analysis ........................................................................................................................ 51
Marketing Strategy Recommendation ...................................................................................... 57
2 | M a s o n S q u a r e S u p e r m a r k e t
Financial Model ............................................................................................................................ 59
Conclusion .................................................................................................................................... 61
Appendix: Marketing Survey (for STCC) .................................................................................... 62
References ..................................................................................................................................... 65
Bibliography ................................................................................................................................. 67
Mission Statement
The Mason Square neighborhood of Springfield, MA is composed largely of low income
residents, and a significant portion of the population is ½ mile or greater from a supermarket. In
addition to this, outside research has shown that those markets that are in the area tend to be
discount markets, lacking in fresh quality food. These characteristics make the area a food desert.
The goal of this phase of the project was to determine the feasibility of various aspects of energy
efficiency, security, and community image, and to demonstrate how they would impact the success
of the market. Each of these are imperative to the feasibility and long term success of the market.
3 | M a s o n S q u a r e S u p e r m a r k e t
Project Objectives The Mason Square Supermarket project was conducted over C and D-Terms of 2015. The
research included in this report was conducted by undergraduate students at the Worcester
Polytechnic Institute (WPI) as part of the Intermediate Qualifying Project (IQP). This research was
assisted by honors students at the Springfield Technical Community College and graduate students
from WPI’s Graduate Business School.
The cumulative results of the research conducted are presented in this report. In addition
to this report, a presentation given to Mr. Minkarah on May 5th, 2015. The goal was to provide
DevelopSpringfield with reliable information to be able to make informed decisions when moving
forward with the Mason Square Supermarket.
4 | M a s o n S q u a r e S u p e r m a r k e t
Acknowledgements The research team would like to thank DevelopSpringfield for making this project possible.
We would like to thank the President and CEO of DevelopSpringfield, Jay Minkarah, as well as
the project advisor, Professor Kevin Sweeney for all of your support and guidance.
We would also like to thank the WPI graduate students, Kaimin Huang, Sayan Sengupta,
Yifan Zhang, and Yuan Suo. We would also like to thank the student team from the Springfield
Technical Community College, Anthony Grandoit, Carissa Walters, Dylan Romaniak, and Chris
LeValle, for their help on this project. Additionally, we would like to extend our gratitude to
Professor Diane Sabato of the Springfield Technical Community College, who provided an
immense level of support, guidance, and facilitation through the course of the both terms.

5 | M a s o n S q u a r e S u p e r m a r k e t
Abstract The D-Term Mason Square Supermarket project was aimed at building on the work of the
C-Term project and determining the feasibility of various aspects of a new market, including public
image/perception, business and finance, green technology, security/loss prevention, and banking.
The topics to be studied were distributed among the team members. A bulk of information was
found, then used to analyze the subject for feasibility and impact. This report discusses the
feasibility of various solutions in each area. Additionally, the D-Term team addressed questions
posed by the C-Term team.
6 | M a s o n S q u a r e S u p e r m a r k e t
Executive Summary The Mason Square neighborhood is a food desert. The USDA defines a food desert “as
urban neighborhoods and rural towns without ready access to fresh, healthy, and affordable food.
Instead of supermarkets and grocery stores, these communities may have no food access or are
served only by fast food restaurants and convenience stores that offer few healthy, affordable food
options. The lack of access contributes to a poor diet and can lead to higher levels of obesity and
other diet-related diseases, such as diabetes and heart disease” (United States Deparment of
Agriculture, n.d.). To help alleviate this deficiency, and begin to rebuild Springfield to its true
potential, a full-line, health conscious supermarket is being planned.
DevelopSpringfield, a nonprofit corporation with the goal of stimulating development and
redevelopment of Springfield, has set out to develop a full-line supermarket in Mason Square. A
plot of land has already been purchased by DevelopSpringfield, and current plans propose a 43,000
square foot store. In C-Term, three operating models were explored for feasibility; independent
operator, the Independent Grocers Alliance (IGA), and and Cooperative (CO-OP). These three
options were chosen based on the requirement of operating without a market anchor.
Additional requirements for the market are that it be environmentally friendly, energy
efficient, present a positive image to the community and surrounding areas, and be safe and secure.
Additionally, to help the community fiscally, the idea of opening a bank branch, either inside the
store, or as a standalone building was explored. Based on these requirements, the D-Term group
divided the project into the following topic areas:
-Public image/perception
-Business and finance

7 | M a s o n S q u a r e S u p e r m a r k e t
-Green technology
-Security/loss prevention
- Banking

8 | M a s o n S q u a r e S u p e r m a r k e t
Methodology To complete this project, the report from the C-Term team was reviewed. This was used as
a starting point for information gathering and goal setting. Before work was started, the team met
with Professor Kevin Sweeney to discuss what direction the team should take, suggested goals,
etc. The main goal of this project was to continue exploring the operational models, but also to
begin looking into the feasibility and possible impacts of various technologies and operational
options. It was decided that the topics that would be researched were energy efficiency, green
technologies/sustainability, security, public image, business/finance, and banking. The team would
be researching how each of these things would be able to be implemented into the operational
models and what effect they might have.
Using this information, the tasks were divided among the team members. Each team
member was assigned a “primary” and “secondary” topic. This ensured that each topic was
thoroughly examined, and that everybody had support.
Each team member began searching for information related to his individual topic. As the
focus of this project was to determine the feasibility and impact of various aspects of each topic,
internet searches for the current uses was the primary search technique initially. A meeting was
held between the team and a research librarian at WPI’s Gordon Library. This meeting informed
the team of optimal ways to find reliable, verifiable data that would make the research tasks both
more efficient and more effective.
In person meetings were held with two individuals pertaining to different topics within the
project. The two team members who were researching banking met with Kevin O’Connor of
Westfield Bank. Mr. O’Connor is the Senior Vice President of Retail Banking, and brings a great
deal of experience and expertise opening new bank branches and understanding what goes into
9 | M a s o n S q u a r e S u p e r m a r k e t
making a new branch successful. Another team member met with Elizabeth Tomaszewski, Facility
Systems Manager at WPI. She was able to provide a great deal of information on the systems that
were employed on the WPI Recreation Center, which is LEED Gold certified, as well as other
technologies used throughout campus. Team members reached out to vendors, installers, and
operators of various technologies for additional information.
Due to the fact that so much of the material that was found during the course of the research
could be applied to more than one topic, information sharing was essential. In addition to the
information collected by the WPI team, it important to share with and incorporate information
from the STCC team. To accomplish this, the Basecamp site was utilized as the primary file sharing
location. This allowed everyone to be able to access documents and information posted by all team
members.
10 | M a s o n S q u a r e S u p e r m a r k e t
Results and Discussion
Strategic Business and Finance Issues
Introduction
The goal of this project is to provide direction for a sustainable supermarket within a food
desert. In economics, sustainability is development or growth without being a harmful to the
current environment. With this goal in mind, business and marketing become a very large part of
the process of developing a model that may prove to be sustainable if implemented. Along with
help from a graduate marketing student and a graduate assistant we will provide suggestions and
analysis that may ensure stability to a new supermarket in the Mason Square food desert. To
generate a more thorough report, a market analysis was performed by Kaimin Huang, of WPI’s
Graduate School of Business. Her report can be read in Appendix D.
Operation Models
One of the biggest decisions to make with this supermarket development is which type of
operational model should be implemented that would best suit the Mason Square area in
Springfield. As researched by the preceding team we know that there are (2) main types of
operational models that are implemented in supermarkets are the Cooperative Market model and
the Independent Market model. These both have their strengths and there weaknesses when applied
to the area of interest. One thing that could drastically effect the operational model is the backing
of a supplier. Different suppliers have different services as discussed in the paper written by the
C–Term students. We will explain what services are offered by the two large distributors in our
area, being Buzzuto’s and C & S Wholesale Grocers, and provide a list of strengths and weaknesses
for each supplier.
a. Independent Market
11 | M a s o n S q u a r e S u p e r m a r k e t
Entering D–Term, we were left with many questions posed by the C–Term
students. A few of these being:
Between C&S Wholesale Grocers and Bozzuto’s, which supplier
supplies the best means to support the grocery store?
What are the costs of having to use these services from the supplier if
there any at all?
What are these costs compared to IGA’s?
Will the store be able to do any of these means without the help from
either of the suppliers or IGA?
(Sloat & West, 2015)
Unfortunately we were not be able to answer all of these questions due to the difficulty
obtaining business information without a business plan. The question we will be able
to provide insight upon would be the initial question.
Q: Between C&S Wholesale Grocers and Bozzuto’s which supplier supplies the best
means to support the grocery store (Sloat & West, 2015)?
A: To answer this question we will refer directly to the services that each of these
suppliers provide, and where the differences between the two suppliers lay. Each
corporation has their own website respectively and list out different ancillary services
they provide aside from their main service.
Bozzuto’s:
From the Bozzuto’s website the list of retail services is as follows:
12 | M a s o n S q u a r e S u p e r m a r k e t
New Store Site and Demographic Analysis.
Retail merchandising specialists and sales support.
Retail financial services/accounting/payroll.
Operational analysis.
Shelf management programs.
Market/pricing strategies.
Employee training, seminars and workshops.
Profit building ideas.
Retail Technology.
(Buzzuto's Incorperated, 2015)
A few of these categories are discussed with greater detail on the Bozzuto’s website. The
categories being retail merchandising, retail accounting, and retail technology.
C&S Wholesale Grocers:
Category Management
o Sales analysis and assortment reviews
o Store layout planning
o Coordination of store remodel and reset needs from category sets to full-
store program
o Retail pricing support tailored to your market and competitive needs
o Enhanced shelf tag programs to communicate effectively to your consumers
o Host support for front-end systems
o A full lineup of reports to help you run your business efficiently
13 | M a s o n S q u a r e S u p e r m a r k e t
Pricing
Marketing and Advertising
Store Design
Business and Accounting
(C&S Wholesale Grocers, 2015)
More details of each category can be found through C&S Wholesale Grocers’ website for
each category, where a short description and features and each category are provided. For
the first category in the list we listed the services within to present a clearer image as to
what falls within Category Management.
Comparison:
Out of these two main suppliers, Bozzuto’s seems to be the stronger choice. The things
that stand out about this company is they offer employee training. This is a huge plus for a new
market in any area. The training seminars could help this new business develop its employee
standards and set its training methods for new employees, which will be a factor for this
supermarket to survive and continue to grow. Another positive about Bozzuto’s is the new store
site and demographic analysis. This could help further any research that is done by Develop
Springfield and help decide what sort of variety of product should be put on the shelves. Other
than these two differences these companies seem very similar with the services that they would be
able to provide.
b. Cooperative Market
The C-Term group also left a short list of questions to be acknowledged by us
this term. These questions are as follows:
14 | M a s o n S q u a r e S u p e r m a r k e t
Will there be enough willing consumers that would become members in the
store?
Can a CO-OP this big or not having as selective products survive?
(Sloat & West, 2015)
These are the two questions provided by the C–Term students in terms of a
cooperative market. To the research team, these two questions pose questions about
the stability of the community. As outlined for use by the preceding students, a
cooperative is run by an elected board of members to the cooperative market.
Gaining members may be difficult due to the fact that the area is low income. Even
though monthly payments may only range anywhere from $150 - $200 depending
on the food cooperative (Cumbie, 2015), this may be out of the price range for this
particular community. Unless this market would be enticing enough to people
working in the area or members of a wealthier community to sway the balance of
income it seems rather unfeasible
Independent vs. Cooperative
Out of these two different operational models, the team believes an
independent market is the stronger choice for several reasons. First being a
cooperative model depends heavily on the members. This is because members
make a very large percentage of the total sales of a cooperative market. The
members are also the people that would own and operate this market. This presents
itself as a draw back in the Mason Square area due in large to the fact that the
surrounding area is low income. Being a low income area it would be extremely
difficult to attract the residents of the immediate area to become members and
15 | M a s o n S q u a r e S u p e r m a r k e t
endorse a new bill. This is also an issue for operating the supermarket. The
members are the people running this market. Knowing this, we could have any
person, possibly someone with little to no business experience, running the store.
Having zero experience could really put a strain on front office operations. As has
been shown, there are several reasons that stack against a cooperative model. For
these reasons, the team recommends an independent as it does not rely on the
immediate area to operate and fund the supermarket.
Financial Model
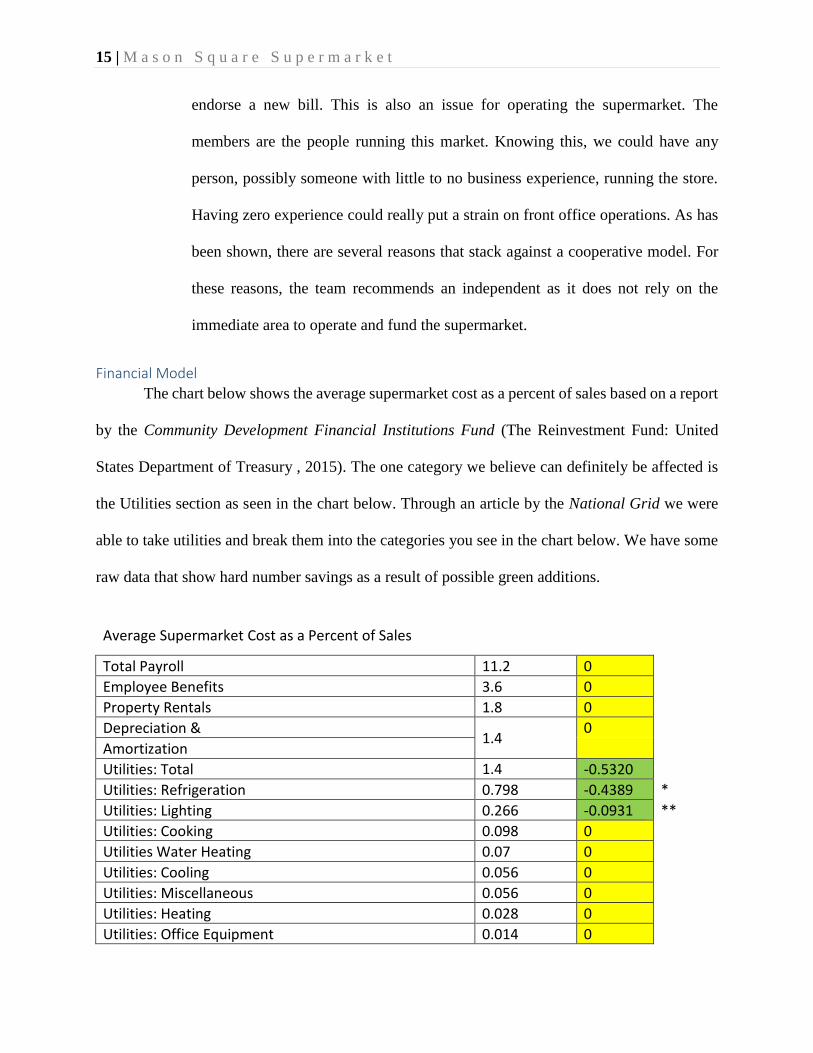
The chart below shows the average supermarket cost as a percent of sales based on a report
by the Community Development Financial Institutions Fund (The Reinvestment Fund: United
States Department of Treasury , 2015). The one category we believe can definitely be affected is
the Utilities section as seen in the chart below. Through an article by the National Grid we were
able to take utilities and break them into the categories you see in the chart below. We have some
raw data that show hard number savings as a result of possible green additions.
Average Supermarket Cost as a Percent of Sales
Total Payroll 11.2 0
Employee Benefits 3.6 0
Property Rentals 1.8 0
Depreciation & 1.4
0
Amortization
Utilities: Total 1.4 -0.5320
Utilities: Refrigeration 0.798 -0.4389 *
Utilities: Lighting 0.266 -0.0931 **
Utilities: Cooking 0.098 0
Utilities Water Heating 0.07 0
Utilities: Cooling 0.056 0
Utilities: Miscellaneous 0.056 0
Utilities: Heating 0.028 0
Utilities: Office Equipment 0.014 0
16 | M a s o n S q u a r e S u p e r m a r k e t
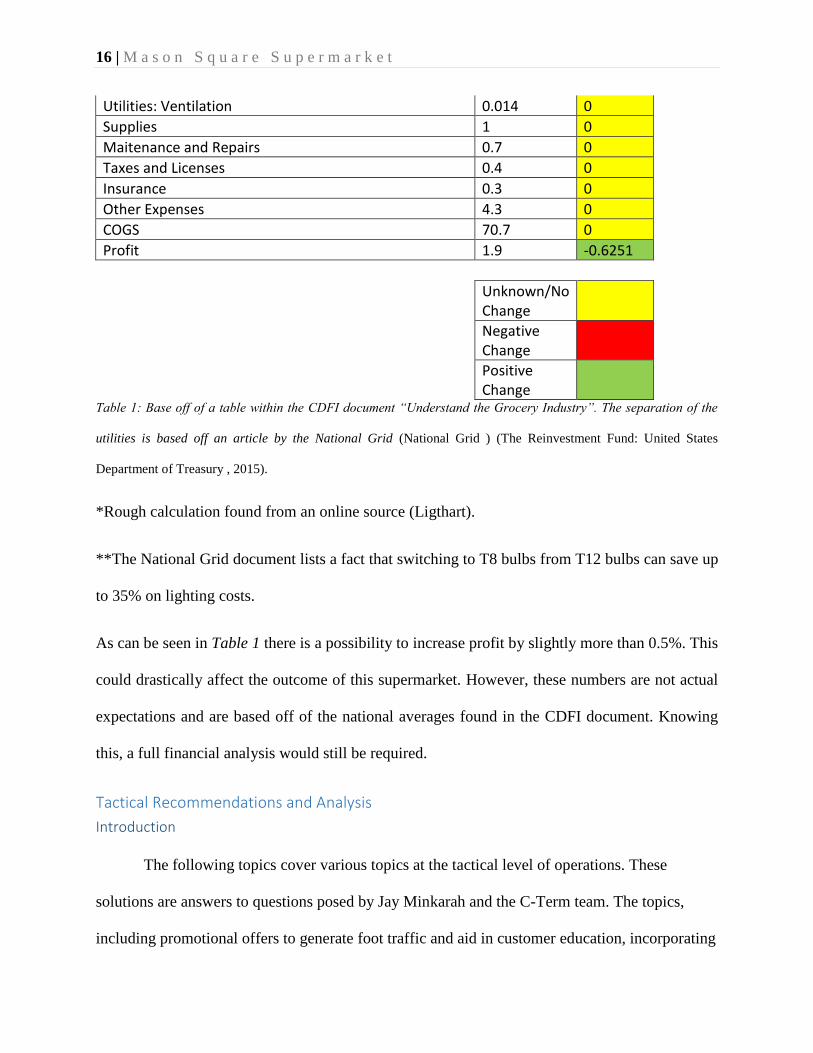
Utilities: Ventilation 0.014 0
Supplies 1 0
Maitenance and Repairs 0.7 0
Taxes and Licenses 0.4 0
Insurance 0.3 0
Other Expenses 4.3 0
COGS 70.7 0
Profit 1.9 -0.6251
Unknown/No Change
Negative Change
Positive Change
Table 1: Base off of a table within the CDFI document “Understand the Grocery Industry”. The separation of the
utilities is based off an article by the National Grid (National Grid ) (The Reinvestment Fund: United States
Department of Treasury , 2015).
*Rough calculation found from an online source (Ligthart).
**The National Grid document lists a fact that switching to T8 bulbs from T12 bulbs can save up
to 35% on lighting costs.
As can be seen in Table 1 there is a possibility to increase profit by slightly more than 0.5%. This
could drastically affect the outcome of this supermarket. However, these numbers are not actual
expectations and are based off of the national averages found in the CDFI document. Knowing
this, a full financial analysis would still be required.
Tactical Recommendations and Analysis
Introduction
The following topics cover various topics at the tactical level of operations. These
solutions are answers to questions posed by Jay Minkarah and the C-Term team. The topics,
including promotional offers to generate foot traffic and aid in customer education, incorporating
17 | M a s o n S q u a r e S u p e r m a r k e t
banking, environmental technologies, and safety and security are aspects whose inclusion will
help drive the success of the market.
Possible Grants
The main purpose of the analysis and research being performed is to provide the
necessary research to attempt to acquire new market tax credits. As pointed out by the C–Term
group, there are other types of grants available for green energy. The Solar Renewable Energy
Credit is described in C-Term’s paper. This made our team think, maybe there are other grants
available that may be able help finance the construction of this new supermarket. Through this
research we were able to find an agricultural grant that may be a possibility. The grant is found
on the website for The Commonwealth of Massachusetts, specifically in the Environment and
Energy Affairs page on this website. The grant is title the Agricultural Energy Grant Program or
Ag – Energy Grant Program. This grant program is available for farms implementing the use of
energy efficient practices (Commonwealth of Massachusetts: Energy and Environmental Affairs,
2015). Since the roof top farm is not something that is currently running, the team is not sure if it
is possible to apply for the grant without having a farm in place or if the use of the roof top farm
would be considered an energy efficient entity by this agency by itself.
Incorporating a Bank
There are two main types of banks that could be implemented in this area. Those are the
traditional bank and credit union. Each of these has their own significant benefits. A credit union
is very similar to a cooperative market in the respect that a credit union is owned by its members
(National Credit Union Administration, 2015). Even still, a credit union is a fully functioning
bank. In some cases they may offer better interest rates and terms to their members compared to a
traditional bank. The good thing about a credit union is they are very community oriented, being
member owned, and may be more inclined to support the community.

18 | M a s o n S q u a r e S u p e r m a r k e t
The second bank is a traditional style, what most may consider a franchise bank or a chain
bank. This bank is very similar to an independent as it is owned by an individual or a small group.
This style bank will have its advantages within the community. If a bank is examined by the
Federal Reserve it is required to meet the credit needs of a community (Board of Governors of the
Federal Reserve System, 2014). Meeting the Credit Reinvestment Act (CRA) will incline this bank
a Federal bank to support the community. This support could even trump the support a credit union
may give since a credit union isn’t required to meet a CRA. The bank may even go beyond the
CRA requirements in order receive higher ratings.
Promotional Offers
One of the topics very important to DevelopSpringfield is presenting a healthy image and
promoting nutrition. This healthy image and the coinciding ideas got the team to put their heads
together to think of a few suggestions. The first suggestion was posting pads of healthy recipes
around the store to give the customers a variety of healthy recipes that they could cook on their
own. By doing this we would theoretically help individuals learn new healthy recipes and really
promote nutrition. The second suggestion was a sale, which acts as incentive for the first
suggestion. For example, if a recipe requires (4) different items, there could be a promotion where
if the consumer buys (3) parts to the recipe the last part will be free. The free item would more
than likely be the item with the lowest margin to prevent giving away too much profit. This idea
could potentially really aid the community in eating healthy and provide enough economic
incentive to appeal to the consumer.
Lottery Sales
Selling lottery is something that is often seen through a negative light, being directly
connected to gambling addiction and promotion of other unfavorable activities such as binge
drinking. Although there are negatives related to lottery, business wise it can be very useful. As

19 | M a s o n S q u a r e S u p e r m a r k e t
seen on page two of the Massachusetts State Lottery Commission: Info Packet, the place of sale
will receive 5% commission on every lottery item sold and 1% on all prizes claimed onsite
(Massachusetts State Lottery Commission, 2015). At the average retailer there are earnings of
approximately $37,000 annually (Massachusetts State Lottery Commission, 2015). Assuming the
store is profitable without the sale of lottery games, this could create a nice emergency fund for
the supermarket or even used in a way to support the community.
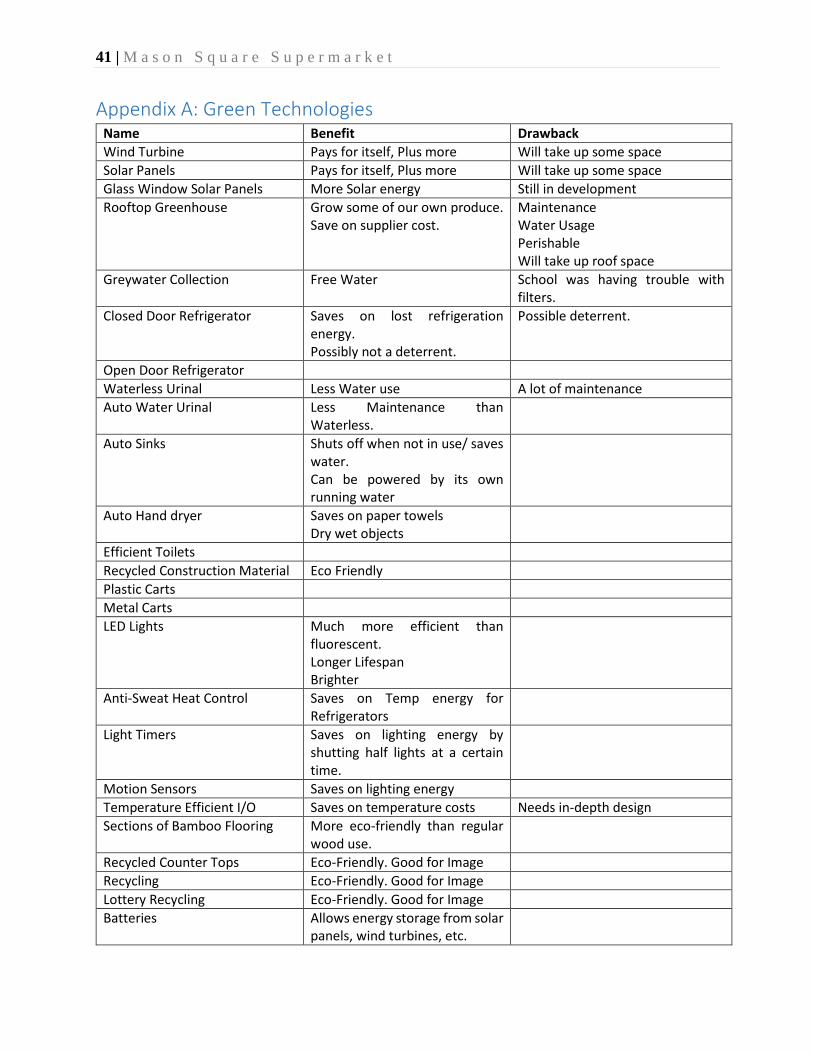
Green Technology/Eco
Energy efficiency and eco-friendliness are important to many aspects of this market, such
as cost, marketing, public image, and eco-responsibility. Arguably, the most important is cost
because the more money that the store can save on energy, the greater the ability to keep food
prices, and/or rent for the operator, lower and more affordable. A number of energy efficient and
environmentally friendly technologies are presented with some benefits and drawbacks in
Appendix A.
Numerous technologies in the realm of energy efficiency and eco-friendliness have been
thought of, researched, and analyzed by the team. Some of the most prominent things looked at by
the team were solar power, wind turbines, open versus closed refrigerator cabinets, rain water
collection, a rooftop green house, and recycling.
Solar panels are one of the first technologies many people think of in regards to energy
efficiency. Solar panels work well in both open fields and urban environments, and can potentially
be a source of various tax credits. As the C-Term team discussed in their paper, where information
on solar panels can be found in more detail, two potential manufactures/installers are Solar City
and Solar Flair. Also, refer to the future technologies section of this paper for information on glass
window solar panels. As for wind power, there are the current technologies that are seen in various
20 | M a s o n S q u a r e S u p e r m a r k e t
sites. These include the traditional fan style turbine, which can be beneficial, but, due to currently
technology constraints, tend to be less efficient in certain urban areas. There are two wind turbine
technologies also discussed in the future technologies section.
Another interesting eco-friendly and money saving idea the team has looked into is having
a rooftop greenhouse to grow some the store’s produce product. A company located in Somerville,
MA called Recover Green Roofs will inspect the roof, design and build the greenhouse, and
maintain it. This is a very positive for image and will make sourcing some produce a little easier
and cheaper by cutting out the middle man. And also, it is a possible opportunity to work with, and
integrate further into, the community. There is a group called “Gardening the Community” that
operates in and around the Springfield area developing and running public gardens. For future
work, it would be a good idea to explore a possible partnership with this group to see if they would
potentially take care of, or at least help take care of, the store’s rooftop garden. Another potential
utilization of rooftop space that was considered is skylights. Skylights are a design of putting
windows in the ceiling that add a more interesting look to the interior and rooftop. Not only that,
skylights also allow for more natural lighting and heating. Additionally, it would also be another
efficient and effective location for glass window solar panels. Skylights are a design technology
that businesses, including grocery stores, are implementing for energy efficiency purposes.
Rain water collection is another interesting green technology that the team looked into.
Rain water is collected from roof top areas not used for gardens/greenhouse, etc, and stored in
underground cistern. Collected water would be filtered and pumped to the cooling towers on the
roof to provide cooling. For example of how much could be saved, the WPI Recreation Center
saves 850,000 gallons of fresh water per year.
21 | M a s o n S q u a r e S u p e r m a r k e t
Refrigeration is the biggest energy consumer in a grocery store. The greatest differentiator
is closed door vs open door refrigerators. Open door units increase refrigeration costs and store
heating, but the idea is that they are more inviting and purchase inducing than closed door.
However, a study conducted by F.A.T.M. Ligthart shows to the contrary; closed door is just as
inviting and purchase inducing as open door, and it is much more energy efficient than open door.
For more on the percentage of energy savings of this topic, see the financials section. To go along
with using closed door refrigeration, refrigeration efficiency can further be increased by utilizing
anti-sweat technology can help better regulate temperature inside the refrigerator, so unnecessary
extra temperature control energy is used.
In second for highest energy consumption in a grocery store is lighting. Based on research,
the team recommends that LED lights should be used for the store. It is a brighter, longer lasting,
and more energy efficient option. One such LED light option is the Philips T8 LED light bulb.
While the initial investment is slightly more than that of a standard florescent light, the long life
and power saving make for a significantly lower total cost of ownership. As for technologies to
supplement the lighting system, motion sensing and self-adjusting sensors could be implemented.
Lights in the store – ceiling, and refrigeration – can be on a timer and will either dim or turn off
until someone walks by and activates the motion sensor, turning on the lights. Doing so could help
save almost half on lighting. It is noteworthy that this method could also be implemented on the
security cameras, which would help the cameras save both energy and hard drive space. Another
technology that could be implemented is smart lighting. Sensors are placed throughout an area that
is exposed to natural light, and adjust the lights to avoid attempting to light
Recycling metals, plastics, glass and cardboard is the most environmentally responsible
way to dispose of them. One way to do this is the bottle return machines, which process aluminum
22 | M a s o n S q u a r e S u p e r m a r k e t
beverage cans, plastic bottles, and glass bottles. One novel technology is the Greenbean reverse
vending machines. Greenbean utilizes gaming and social media to encourage people to recycle
beverage containers. Competitions are held with prizes awarded to the biggest recycler.
Additionally, the method of paying out redemptions is different than conventional machines.
Instead of paper slips that are redeemed for cash, the value of the returned containers can be
deposited to a card, such as a student card. It can also be applied to a PayPal account or donated
to any of a number of charities. Also, there could be bins for any recyclable material, including
containers the bottle return machines reject. And with paper being one of the most wasted materials
in a supermarket, this is a very smart and eco-friendly option. A bailer could be out back to compact
cardboard to be tied, trucked out, and properly disposed of. One difficult item to recycle is lottery
tickets. Though they can be recycled, the must do so in a separate manner than regular paper. To
accommodate this, a bin would be placed at the service desk specifically for lottery. There can also
be plastic bag bins that will be used to collect used plastic bags which can be recycled into new
bags, or composite wood products. In addition to recycling plastic bags, selling reusable bags
would also be a smart green option, as it would decrease the use of disposable bags. They save on
cost of plastic bags and helps the environment, and create a further positive image for the store.
As an added bonus, but they can be used for marketing by having the store’s logo on the outside.
And finally, they could potentially be made of recycled materials.
For flooring, bamboo is an eco-friendly option that should be considered. Bamboo grows
up to an amazing 35 inches per day, which is about 1064.583 feet per year. A Red Maple growing
at moderate speed grows 1 to 2 feet per year, which is significantly less. Using bamboo for flooring
is much more environmentally friendly than conventional tree wood because it replenishes quickly.
And as example of cost if bought retail, Home Depot sells bamboo flooring for $1.69/sqft. So this

23 | M a s o n S q u a r e S u p e r m a r k e t
is not really a more expensive option than regular flooring, and not only that, could probably be
bought even cheaper industrially.
Bathroom fixtures were also considered by the team. Firstly, as the C-Term team had
discussed, there are toilets made by Sloan that have two flush modes, low and high, operated by
two buttons to more efficiently use water for flushing. Secondly, urinals were also looked at. Auto
flush urinals flush for people that forget. There are different types of auto flush urinals – regular,
ultra-low flush urinals, and high efficiency flush urinals. No matter what of these three types, they
all create cost via water use. There are also waterless urinals. They sound like a great idea and in
some respects are. They save large amounts of water and have a high unlikelihood of overflow or
splash, but they have their issues too. According to Facilities faculty of the Worcester Polytechnic
Institute’s Recreation and Fitness Center, where waterless urinals are utilized in all the men’s
restrooms, two main issues with them are that they tend to smell, and are high maintenance and
range from a need of monthly to weekly cartridge changes. These are a great concept, but they are
just not quite there yet.
Auto hand dryers have become common place in public restrooms, and for this market the
team recommends Xlerator Auto Hand Dryer. This would be dealing with a local Springfield
company which is good for the local economy and positive for the store’s image. Having an auto
hand dryer would help save on paper towel use. There is even a potential annual savings on paper
towels of over $1,000. However, even if there is an auto hand dryer, there would still need to be
single use paper towels at all sink fixtures.
There are also some very promising future technologies that were found that look to be
available soon. There are two wind turbine technologies that are in development or progressing
towards licensing to sell in the United States of America. The Liam F1 (based on the Archimedes
24 | M a s o n S q u a r e S u p e r m a r k e t
Screw), designed and produced by The Archimedes BV, and the Saphonian, developed by Saphon
Energy. These designs have achieved efficiencies greater that those achieved by traditional wind
turbines.
Security/Loss Prevention
During the D-Term portion of the “Mason Square Project” the objective of the team was
to analyze the research gathered by C-Term group throughout their seven week IQP term. We used
this information and researched each of the models on an individual basis. Our client,
DevelopSpringfield expected us to produce recommendations as to how each model would
operationally work best. With a substantial amount of time spent on the analysis of the gathered
information, we were able to identify the strengths and opportunities of each model and how the
models most accurately fit the needs of the client. We presented our recommendations to Jay
Minkarah, President of DevelopSpringfield.
The C-Term group took the information that they collected and developed a set of
“bundles.” The bundles included: The three Operational Models, Marketing, Physical Design,
Energy Efficiency, and Economic Impact. These bundles helped guide us in the right direction so
that we knew what target information we would need to focus on researching. As the project
progressed, we discovered that the scope of the research had changed. Our main objective was still
to create the best recommendations for each model, however we discovered that there were some
other areas related to operations that needed to be further pursued. Two of these areas were security
of the site and loss prevention.
As with any business, these two topics are extremely important. Although there are many
operational policies that a business needs to have in place to ensure success, the safety of the public
is paramount. A business needs its consumers to succeed and it is expected that a safe place to
25 | M a s o n S q u a r e S u p e r m a r k e t
conduct business will be provided. It is the responsibility of the design and development team,
such as the commercial architects, design architects, and engineers to take these needs into
consideration when designing the structural plans with security and safety as a number one priority.
The second important area that we needed to further research was loss prevention. A
supermarket that is measured on the same scale as the one envisioned in this project undoubtedly
carries millions of dollars in consumer products. Inevitably, it is impossible to eliminate loss when
carrying so many goods at one location and serving such a vast population of the city. Fortunately,
the amount of loss incurred can be minimized through the use of advanced technology coupled
with the proper training of staff members.
As mentioned previously, security plays a vital role in the success of the business. One may
ask why security is so important. The Merriam-Webster dictionary defines security as, “The state
of being protected or safe from harm.” As the definition suggests, we want the customers to feel
safe. It is instinctive for human beings to always want to feel safe wherever they go and a
supermarket is certainly no exception. Customers will not come to the supermarket to shop if they
feel threatened by the environment, so we must make sure our business model emphasizes the high
importance of this topic. The threats that are associated with the retail industry are pretty sizable.
These threats include: direct theft from random shoplifters, organized retail crime, dishonest store
clerks, product diversion, accidental loss, digital threats such as high-profile attacks like card
skimming and data theft through wireless networks, just to name a few (Slater, 2010).
The site of the supermarket for this project is in an urban environment, in a city that has
not yet been financially invested in or developed, so crime rates tend to be higher than other, more
developed cities. Threats such as robberies occurring on the property, vandalism, loitering, etc. are
realistic scenarios that require an action plan to be developed. Threats stemming internally and
26 | M a s o n S q u a r e S u p e r m a r k e t
externally from the store will certainly deter customers from shopping at the supermarket even if
the customers are not directly involved. For example, customers do not want to go to a place that
is known to be frequently robbed or have a poor credit card system that allows its customers to be
victims of identity theft. Additionally, graffiti splattered on the exterior of the buildings and
excessive loitering on the premise does not create an inviting or welcoming environment.
Developing an action plan that addresses how to deal with these threats will allow management to
be proactive. Being proactive in security operations will be apparent to customers and they will
feel confident that they are shopping in a safe environment. A business that has a positive
reputation in the eyes of its patrons will also result in a greater profit margin and customer loyalty.
The ways in which these threats can be handled and prevented will be discussed later in the section.
The second area that was previously stated as crucial to operational policies was loss
prevention. Every business needs to have a plan for managing inventory. How inventory is
managed is critical because it can have a significant impact on the businesses financial stability.
Stored inventory are the goods that a business uses to generate income so any loss in goods results
in a loss of assets on the financial statements. (Smith, n.d.). The majority of the loss associated
with supermarkets or retail in general is known as a term called shrink. Shrink is the portion of the
inventory that gets lost or stolen (Kokemuller, n.d.). The percent loss through shrink is known as
the “shrink rate.” This is expressed as a percentage based on the monetary value lost divided by
the stores sales through the period calculated. Keeping the shrink rate low is extremely critical to
the success of the business (Kokemuller, n.d.). “Inventory shrinkage depletes the business’
potential income, and thus, potential profit. Shrinkage can result in business changes, such as
increased prices, decreased employee bonuses and overall loss of sales due to several other external
or internal factors” (Smith, n.d.). Although contrary to the name, shrink is certainly not something

27 | M a s o n S q u a r e S u p e r m a r k e t
seen is small amounts. In fact, the latest Global Retail Theft Barometer study suggested that shrink
cost the global retail industry an astronomical $128 billion in 2014, $42 billion in the United States
alone. That number only represents 1.29% of global retail sales, on average (Wilson, 2014).
The biggest sources of retail shrink in the United States are from employee theft and
shoplifting. In 2014, a survey that was underwritten by Checkpoint System, and carried out by The
Smart Cube and retail loss prevention analyst Ernie Deyle, 16 out of 24 countries surveyed reported
that the majority of shrink was attributed to shoplifting. In the United States, however, employee
theft ranked first at 42.9%, with shoplifting next at 37.4% (Wilson, 2014). Goods such as fashion,
mobile accessories, wines, power tools, and cosmetic products ranked among the highest for most
stolen items due to the fact that they could be easily concealed and resold at a higher price in
underground markets. A key note to point out, the average shrink rate in the U.S. is 1.48%, slightly
down from 1.50% a few years back. This could mean that the economy as a whole is rebounding
from the recession and that businesses are now able to pay their employees more or provide a
better work environment. A loyal employee who feels they are valued and paid accordingly for the
work they do will be less likely to steal from their employer.
The shrink associated with supermarkets is slightly different than that of other retailers.
Research by FMI and THE RETAIL CONTROL GROUP conducted just for supermarkets found
overall shrink in 2011 at 2.70% of retail sales, with the best companies reporting shrink at 1.72%
(Where's My Shrink?, n.d.). Although, theft (from employees, customers, vendors) does account
for part of the loss due to shrink, it only accounts for 36% of it. The other 64% of shrink in
supermarkets is caused by operational shrink, which is the profit loss caused during normal
business operations. Shrink that happens during normal business hours is due to a breakdown in
management of not consistently following operational policies and best practices (Where's My
28 | M a s o n S q u a r e S u p e r m a r k e t
Shrink?, n.d.). An example of this would be a store clerk not checking the bagged items that a
customer is walking out of the store with if the alarm goes off. This happens frequently and many
times the store employee will disregard the alarm. This is failing to follow operational policies and
best practices. An operational business plan should have strategies in place that provide a means
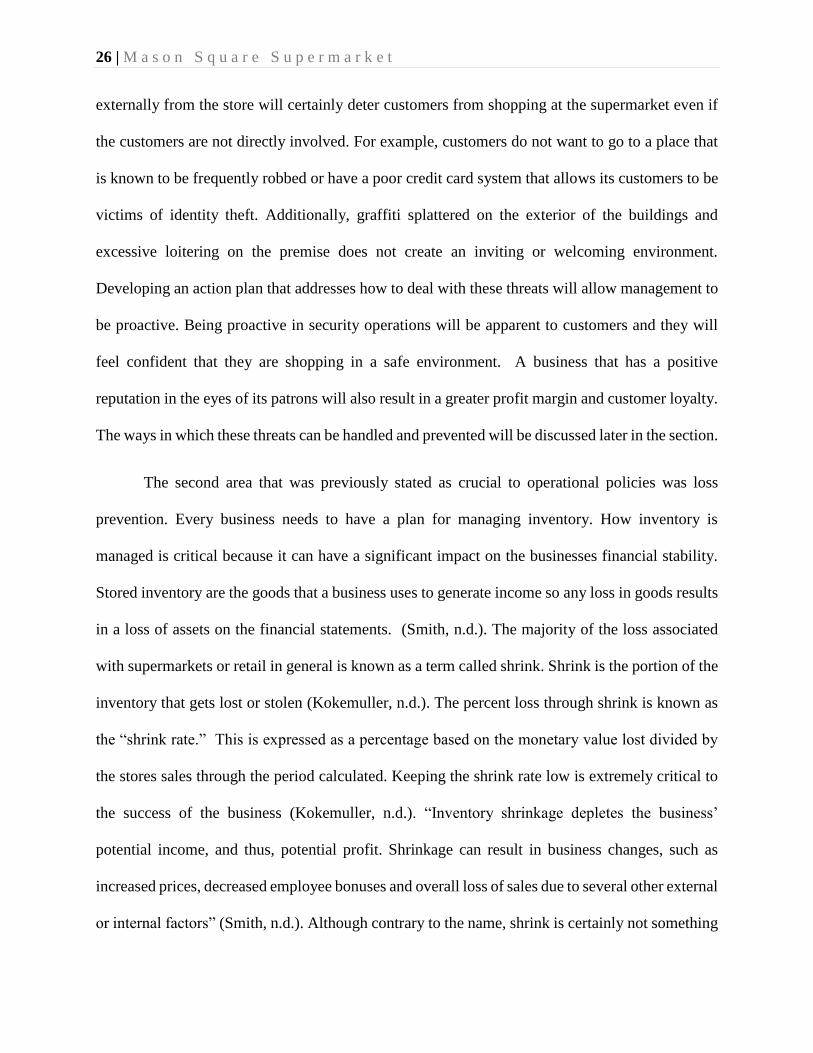
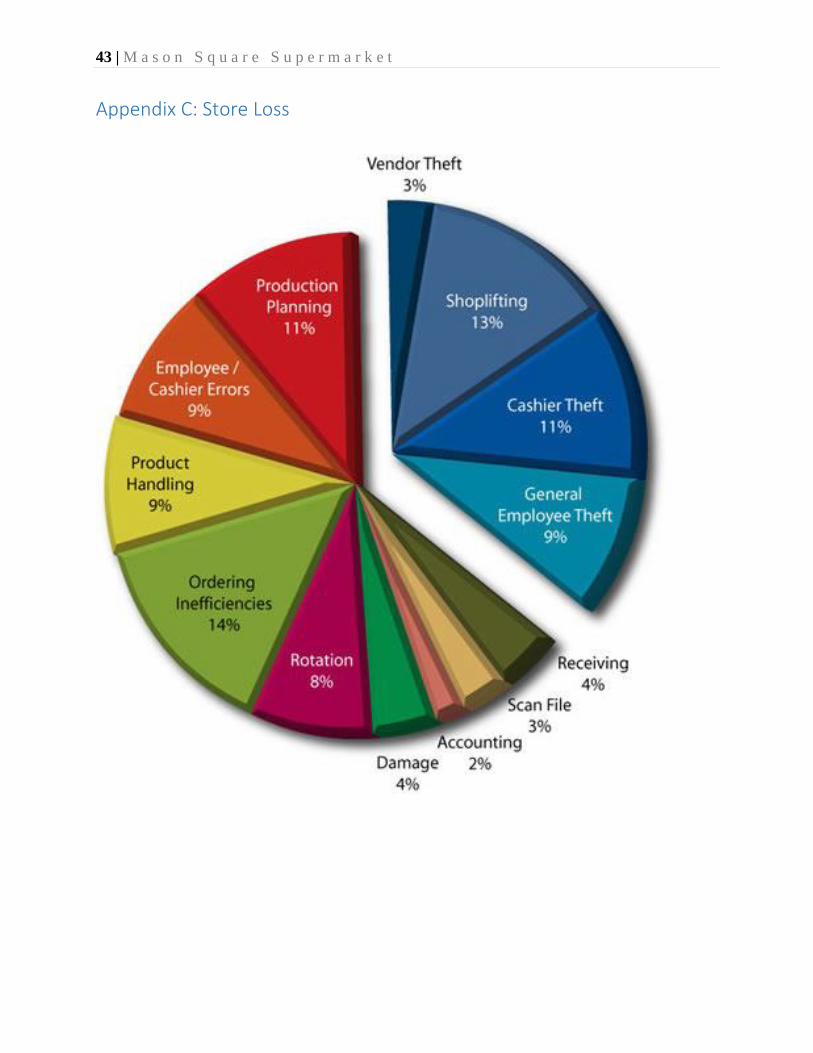
to cut down on shrink due to internal standards not being met. A chart of the shrink due to theft
and operations will be provided in the appendix section at the end of the paper. This pie chart
further breaks down each of the two categories into subcategories and gives a percent value of how
much loss in attributed from the sub categories.
In the retail supermarket business there are also two types of shrink that don’t typically
affect other types of retailers. The two types of shrink are known as perishable and non-perishable
shrink. Perishable shrink stems from inventory items that essentially lose their value over time and
are rendered worthless or useless. For example, milk that spoils and turns sour, unsold lottery
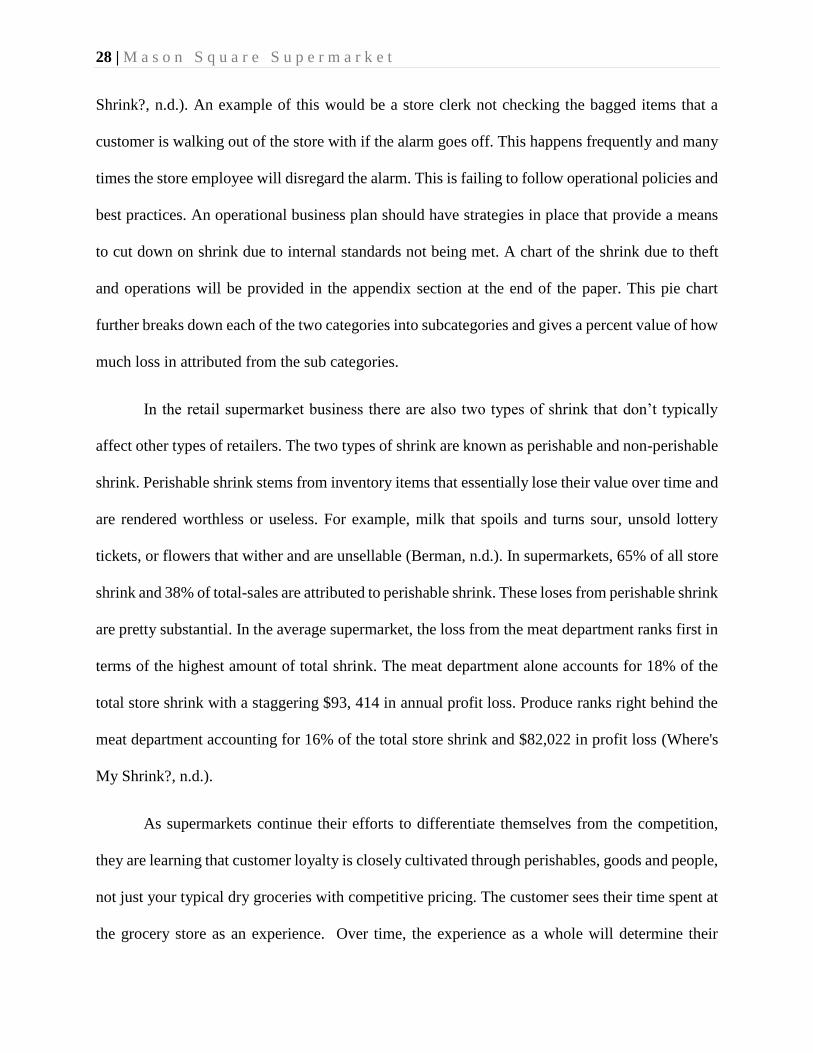
tickets, or flowers that wither and are unsellable (Berman, n.d.). In supermarkets, 65% of all store
shrink and 38% of total-sales are attributed to perishable shrink. These loses from perishable shrink
are pretty substantial. In the average supermarket, the loss from the meat department ranks first in
terms of the highest amount of total shrink. The meat department alone accounts for 18% of the
total store shrink with a staggering $93, 414 in annual profit loss. Produce ranks right behind the
meat department accounting for 16% of the total store shrink and $82,022 in profit loss (Where's
My Shrink?, n.d.).
As supermarkets continue their efforts to differentiate themselves from the competition,
they are learning that customer loyalty is closely cultivated through perishables, goods and people,
not just your typical dry groceries with competitive pricing. The customer sees their time spent at
the grocery store as an experience. Over time, the experience as a whole will determine their

29 | M a s o n S q u a r e S u p e r m a r k e t
loyalty. Supermarkets are using this information to their benefit and are increasing their focus
towards the enhancement and expansion of their perishable departments as a competitive
advantage. The Whole Foods chain of supermarkets has done a tremendous job of this throughout
the last several years that no other supermarket seems to have been able to compete with. The
product availability, freshness, and quality all attribute to the supermarket’s strategic advancement
in the competition to keep its customers and attract new ones. As mentioned from operation shrink,
if not closely managed, having a large availability of fresh produce, even at competitive prices,
can contribute to excessive amounts of shrink which bring huge amounts of profit loss. The top
operational causes of shrink are (Where's My Shrink?, n.d.):
Ineffective ordering contributed on averaging 28% of shrink across all perishable
departments.
Improper production planning and space allocation account for 26% of shrink
losses.
Poor product rotation was the third largest contributor to perishable shrink
accounting for 21% of perishable loss.
Receiving errors (including poor quality of product received from the supplier)
accounted for 12% of perishable shrink losses.
Non-perishable items are those that are not subject to spoilage or decay. Examples of non-
perishable inventory items include foods like canned goods, all types of pasta, sugar, flour, and
spices. In the average supermarket, the non-perishable departments (grocery and center store,
including dairy, frozen, beer/wine, health and beauty, general merchandise, and pharmacy)
account for about 62% of the total sales and contributes about 35% of the total store shrink or an
astronomical $172, 303 of total store shrink. In the supermarket, the average grocery department

30 | M a s o n S q u a r e S u p e r m a r k e t
totals 1.10% of the shrink, or about $71,010 in profit loss. General Merchandise ranks second at
2.71% shrink totaling approximately $41, 011 in profit loss. Unlike the perishable departments
where the life and profitability of the product begins the moment the store receives it, the non-
perishable departments experience uniquely different forms of shrink. Substantial improvements
in non-perishable shrink can be made by these five practices (Where's My Shrink?, n.d.).
Ensure proper and accurate measuring, recording, and accounting for shrink.
Known loss shrink must be accounted for and controlled in all departments.
Line item recognition of shrink should appear on all operational financial reports
and Profit & Loss statements.
Accurate inventory accounting at retail to reveal all shrink to its most accurate
levels.
Prohibit any means to manipulate numbers and/or create “positive Shrink” like Deal
Buys, Forward Buys, Breaking up larger packs of product to sell individually, and
Point of Sale (POS) to Host comparison report to prevent price manipulation at
POS.
A closer look at each individual department reveals significant improvement opportunities
for companies that adopt policies and best practices through a mixtures of collaborative measures
between stores operations and loss prevention (Where's My Shrink?, n.d.).
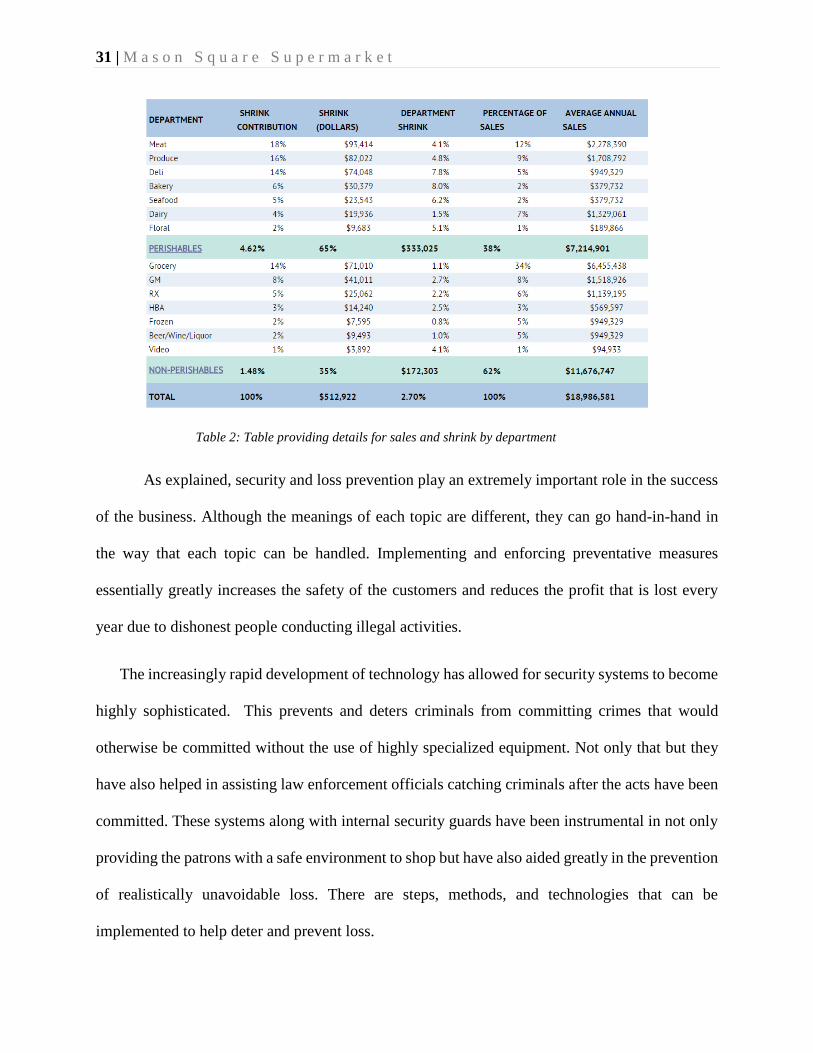
31 | M a s o n S q u a r e S u p e r m a r k e t
Table 2: Table providing details for sales and shrink by department
As explained, security and loss prevention play an extremely important role in the success
of the business. Although the meanings of each topic are different, they can go hand-in-hand in
the way that each topic can be handled. Implementing and enforcing preventative measures
essentially greatly increases the safety of the customers and reduces the profit that is lost every
year due to dishonest people conducting illegal activities.
The increasingly rapid development of technology has allowed for security systems to become
highly sophisticated. This prevents and deters criminals from committing crimes that would
otherwise be committed without the use of highly specialized equipment. Not only that but they
have also helped in assisting law enforcement officials catching criminals after the acts have been
committed. These systems along with internal security guards have been instrumental in not only
providing the patrons with a safe environment to shop but have also aided greatly in the prevention
of realistically unavoidable loss. There are steps, methods, and technologies that can be
implemented to help deter and prevent loss.

32 | M a s o n S q u a r e S u p e r m a r k e t
In the retail industry, carefully and thoughtfully applied measures can clearly benefit the
bottom line. Measures such as retail security and loss prevention certainly cover a lot of ground.
The best way to prevent any and all from occurring is to be prepared for the unexpected.
Throughout this section the most up to date equipment will be discussed. Careful consideration
has been thoroughly given in each of the security measures that that have been suggested.
Before the different types of equipment can be discussed a key point in terms of security is the
immediate front of the store. Solutions to mitigate people from walking in and walking out with a
cart full of unpaid store items is a problem that would need to be solved. Of course this project not
being completely finalized we have yet to determine what the actual store layout will be, but this
is not to say that ideas to implement a concrete system to avoid this from occurring shouldn’t be
discussed. A case study that was looked at for this problem came from the company Alvarado
which mainly deals with the protection of assets and the control of the flow of people. Alvarado’s
was hired by the Supermarket chain called SuperValu, the third largest grocery retailer in the
United States. SuperValu’s main operating store brands are Lucky and Albertson’s, as well as the
more familiar Shaw’s Supermarkets. Alvarado’s was asked to assess and create a solution for one
of SuperValu’s stores in Washington that was experiencing an extremely high rate of theft. Both
the entry and exit doors of the stores were either poorly monitored by store personnel or left
completely unattended. Because of this neglect, people were easily coming into the store and
essentially walking out the doors with “free” carts of food.
One of the immediate challenges that Alvarado faced was how to enhance the security of the
store without actually changing the store’s existing floor plan. The main problem being how to
create physical barriers at the front of the store that didn’t slow down the flow of incoming traffic
from customers, but also prevented the easy exiting and directed traffic to the checkout lanes.
33 | M a s o n S q u a r e S u p e r m a r k e t
Essentially, security measures needed to be implemented that would not change the feel of the
store, direct the flow of customers checking out, and reduce the amount of theft.
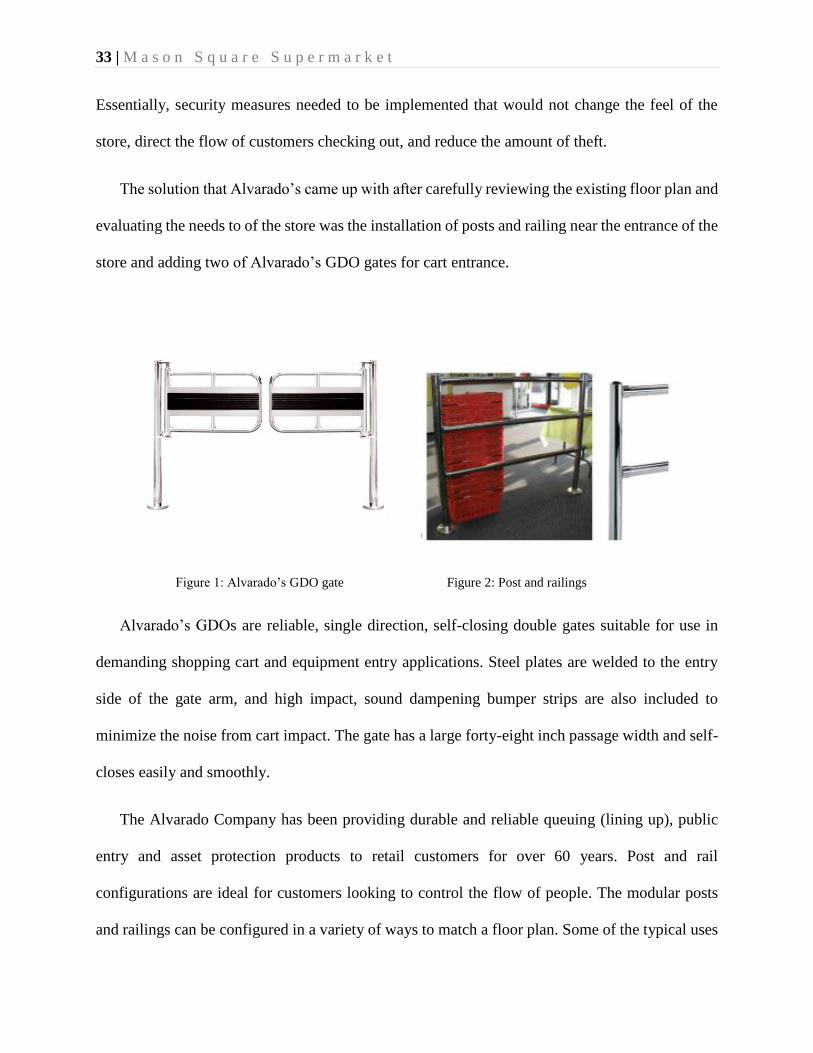
The solution that Alvarado’s came up with after carefully reviewing the existing floor plan and
evaluating the needs to of the store was the installation of posts and railing near the entrance of the
store and adding two of Alvarado’s GDO gates for cart entrance.
Figure 1: Alvarado’s GDO gate Figure 2: Post and railings
Alvarado’s GDOs are reliable, single direction, self-closing double gates suitable for use in
demanding shopping cart and equipment entry applications. Steel plates are welded to the entry
side of the gate arm, and high impact, sound dampening bumper strips are also included to
minimize the noise from cart impact. The gate has a large forty-eight inch passage width and self-
closes easily and smoothly.
The Alvarado Company has been providing durable and reliable queuing (lining up), public
entry and asset protection products to retail customers for over 60 years. Post and rail
configurations are ideal for customers looking to control the flow of people. The modular posts
and railings can be configured in a variety of ways to match a floor plan. Some of the typical uses

34 | M a s o n S q u a r e S u p e r m a r k e t
include queuing, channeling of customers, dividing areas and cart corrals. Pedestrian gates like the
GDO, function as “entry only” doors to complete the barrier that the post and rails create.
As has been shown, the need for adequate, modern, and adaptable security and loss
prevention is paramount. In an industry with operating margins in the 1-2% range, even the
smallest impact to the bottom line, good or bad, can sway the balance of success.
Public Image
One of the concerns raised with opening the supermarket was if, in addition to standard
grocery supplies, the store should also sell items such as alcohol, tobacco products and lottery
supplies.
All three of these items can be sold at Supermarkets in the state of Massachusetts, but
special licenses are required, and there are some restrictions on what can be sold. Applications for
retail liquor licenses must be approved by the local licensing authorities (LLA) as well as the
Alcoholic Beverages Control Commission (ABCC). Any license changes that occur must also be
approved. In Springfield, both Beer and Wine can be sold in supermarkets, and hard liquor may
be sold in stores that are granted special permission. Alcohol may not be poured on the premise
unless the retailer has a permit that allows them to do so. A license to sell tobacco can be easily
obtained by filling out an online form, but the retailer must also obtain a permit from the city. The
permit lasts one year, and a fee is required. If tobacco is sold at a location without a permit, then
the retailer will be charged a fine of $50 dollars a day until a permit is obtained. Lottery license
applications may only be submitted by retail businesses that do more than just sell lottery tickets.
Applicants are also put through finance and security assessments to determine eligibility for a
license. Some lottery tickets are only provided to retailers with a liquor pouring license.
35 | M a s o n S q u a r e S u p e r m a r k e t
The main problem is not if these products can be sold, but if the supermarket should
consider featuring them at all. The store’s purpose goes beyond just providing fresh affordable
goods to individuals in a low-income food desert, as the other goal is to educate individuals on
how to eat healthy and make healthier choices. With that in mind, it seemed almost
counterintuitive to carry these goods in the supermarket. Tobacco products have absolutely no
health benefits, are highly addictive, and cigarette smoke is harmful to other individuals nearby.
Alcohol, while it may be less risk-inducing then tobacco if consumed in low quantities, in large
doses it is linked to heart disease, liver disease, and cancer, as well as lowering the inhibitions of
the user and making them more prone to violence. Although lottery tickets do not cause health
issues in the same way as tobacco and alcohol, they can still have negative repercussions none-
the-less. Lottery games are random, and are designed to be unfair. Individuals can get addicted to
the games, and experience lottery dependency. This is especially devastating to lower-income
players, who make up almost 64% of people who play the lottery regularly.
Despite the negative perceptions surrounding these products, the main reason they were
considered was that they could be potentially profitable. Lottery tickets, as previously mentioned,
are very beneficial for business owners to sell. Stores that sell winning lottery tickets receive a
commission of about 5% of the ticket’s winnings, as well as 1% of ticket sales. With the extra
income from lottery sales, the store can afford to lower the prices of other products in the store.
Selling alcoholic beverages can also be a profitable endeavor. Most stores that sell alcohol are
allowed to set their own prices with few restrictions, although they are prohibited from selling
products for less than their actual value. As such, the most common mark-up value for liquor is
around 25-50%, although the price is often lower if nearby stores are in direct competition. If the
store were to sell liquor it would create competition with the nearby package store. This would

36 | M a s o n S q u a r e S u p e r m a r k e t
most likely affect the package store’s sales, and maybe even draw business from the package store,
though it would mean a smaller mark-up on alcohol and thus less potential profit. Also, alcoholic
beverages that are sold unopened and are consumes off-premises are tax-exempt under
Massachusetts law.
Tobacco products on the other hand, are not very profitable. Studies of cigarette sales by
store have shown that the majority of cigarettes sold are bought from small convenience stores
rather than supermarkets and pharmacies. Tobacco products are also a low margin item. In the
aforementioned studies of cigarette sales, the amount of revenue made by cigarettes in convenience
stores was an average of 20% of the total profits, despite making up 40% of the products stocked.
There is also a growing trend in stores and pharmacies to get rid of tobacco products completely,
with the most well-known example being CVS Pharmacies. Though CVS pharmacies lost all the
potential revenue they would have made with tobacco sales, the amount of revenue produced from
non-tobacco products was enough to balance out the loss. In addition, the lack of tobacco products
would allow for more space in the store for other goods. Although the idea of replacing cigarettes
with electronic cigarettes was also taken into consideration, this situation was decided against,
mostly due to the presence of a vapor store approximately two blocks away from the project site.
In short, the team came to the conclusion that lottery tickets would be very beneficial to
the store, and alcohol sales could also be viable, but there are less reasons to stock tobacco in store
than there are to not have tobacco products at all.
Conclusion The scope of this project, while broad, was manageable through a division of labor. The
individual topics, economics, green technology, public image/community impact, etc, were each
championed by an individual team member. A wealth of information was found and vetted. Topics

37 | M a s o n S q u a r e S u p e r m a r k e t
researched included public image, business and finance, including operational models, green
technology, and security and loss prevention.
The business and finance topic generated many sub-categories, including operational
models, promotional offers, possible grants, and the incorporation of a bank either inside the store
or on the property. For this iteration of research, the IGA and independent models were placed in
one section, and the co-op model in another. It was determined, based on a number of factors, that
the independent model, whether IGA or individual, would be best suited for this application.
Suggestions about ways to engage the customers and encourage healthy eating and education were
given. Additionally, the potential business impacts of lottery sales were explored.
Green technology and environmentally friendly aspects will aid in the success of the store
in a couple of different ways. First, by introducing more energy efficient fixtures and appliances,
regular operating costs can be trimmed by reducing power and water usage. Second, many green
technologies, including solar panels and wind power solution are eligible for public grants and tax
benefits. This would reduce the expenditures, and give the fledgling store a better chance at
survival. Lastly, presenting an environmentally friendly face sets a standard, and relates to the
community that the store and its operators care about more than just the bottom line.
Security and loss prevention were researched, and proved to be an absolutely irreplaceable
asset. A thorough and reliable security program will aid in protecting the store, its assets, and its
customers. Customers must feel safe and welcome in a store, and security is the key to that. If
customers do not feel comfortable in the market, they will find elsewhere to shop. Additionally,
loss and shrink must be controlled to the maximum extent possible. Grocery stores operate on very
thin margins, and any product that leaves the store in any manner other than through the register
takes away from that margin.

38 | M a s o n S q u a r e S u p e r m a r k e t
The Mason Square supermarket is a noble and ambitious project. It will take a great deal
of hard work and dedication to accomplish. Large amounts of work still remain to be done with
architects, urban planners, and business partners. But by implementing some of the techniques and
technologies discussed in this paper, it can be done.
39 | M a s o n S q u a r e S u p e r m a r k e t
Process Paper During the course of this past seven weeks we had a lot of very good moments as a team as well
as some areas in which we struggled. Having such a large team played a very large role in how the
process worked. A large benefit of the team size was setting a division of work. Throughout the
time working on this project we were able to resolve some of the issues brought forth by the C–
Term group. In this process paper we will discuss the struggles that we were faced with as well as
the facets of the project we found success.
First we will discuss the areas in the project that went well. First off, it was very beneficial
to already have an idea of project direction before being able to officially meet with the sponsor
of our project. Being able to use the research provided by the C–Term students was instrumental
in the analysis being performed in some areas of the project. Also, we were able to remedy some
of the complications of communicating clearly and effectively with the Springfield Technical
Community College (STCC) students. This was one of the largest struggles faced by the C–Term
group. The STCC students’ help allowed us to receive input from an even wider view, including
that of people who live and work in the community. Another positive aspect that we experienced
with this project was our ability to meet on a daily basis to discuss problems we may be having as
well as goals that we needed to reach for as a team. Our communication was fairly good for a team
of our size as well. This was important because in larger groups it can be easy to research topics
that have already been researched by one of the members of the team. Continuing with our group
dynamic, all members of the group were able to accept roles within the team. For example, Nathan
was able to lead with good ability, while Justin, Bobby, Nick, and Alex were able to accept
different research responsibilities.
40 | M a s o n S q u a r e S u p e r m a r k e t
On the negative side, there was some difficulty determining the level of detail to which the
topics would be researched. These difficulties extended to the final presentation, which turned out
to be about double the length that it needed to be. This meant that much of the details that were
included in the final research needed to be excluded and replaced with a high-level overview.
Additionally, the broad scope of the project created a lot of vagaries in the topics that needed to be
researched. The team had a tendency to grab ahold of one idea or concept, and being diving into
all of the technical aspects, as opposed to finding out how it could be used to make the market
more effective.
There was some delay in fully integrating the STCC students in to the scope of work. Along
this line, we did not effectively integrate their material into the final presentation. Coordinating
effectively with the STCC students proved to be a bit difficult. While we were available as needed,
they were also taking other classes and had jobs, so scheduling proved difficult. In the future, better
coordination of schedules as well as geography would be very beneficial.
Another source of confusion was the employment of the graduate students. Initially, there
was some unsureness on how to best utilize them. As non-business majors, we were not exactly
sure of how to engage them in the project or what their work would cover. We also had some
difficulty conveying what we needed from the Operations Design and Leadership graduate
students. We asked them for some data pertaining to supply chains, and how the store could best
source its products, but there was some miscommunication of expectations.
41 | M a s o n S q u a r e S u p e r m a r k e t
Appendix A: Green Technologies Name Benefit Drawback
Wind Turbine Pays for itself, Plus more Will take up some space
Solar Panels Pays for itself, Plus more Will take up some space
Glass Window Solar Panels More Solar energy Still in development
Rooftop Greenhouse Grow some of our own produce. Save on supplier cost.
Maintenance Water Usage Perishable Will take up roof space
Greywater Collection Free Water School was having trouble with filters.
Closed Door Refrigerator Saves on lost refrigeration energy. Possibly not a deterrent.
Possible deterrent.
Open Door Refrigerator
Waterless Urinal Less Water use A lot of maintenance
Auto Water Urinal Less Maintenance than Waterless.
Auto Sinks Shuts off when not in use/ saves water. Can be powered by its own running water
Auto Hand dryer Saves on paper towels Dry wet objects
Efficient Toilets
Recycled Construction Material Eco Friendly
Plastic Carts
Metal Carts
LED Lights Much more efficient than fluorescent. Longer Lifespan Brighter
Anti-Sweat Heat Control Saves on Temp energy for Refrigerators
Light Timers Saves on lighting energy by shutting half lights at a certain time.
Motion Sensors Saves on lighting energy
Temperature Efficient I/O Saves on temperature costs Needs in-depth design
Sections of Bamboo Flooring More eco-friendly than regular wood use.
Recycled Counter Tops Eco-Friendly. Good for Image
Recycling Eco-Friendly. Good for Image
Lottery Recycling Eco-Friendly. Good for Image
Batteries Allows energy storage from solar panels, wind turbines, etc.

42 | M a s o n S q u a r e S u p e r m a r k e t
Appendix B: Xcelerator Savings
43 | M a s o n S q u a r e S u p e r m a r k e t
Appendix C: Store Loss

44 | M a s o n S q u a r e S u p e r m a r k e t
Appendix D: Market Analysis
Developing Springfield – Mason Square Market Project
Kaimin Huang
Worcester Polytechnic Institute
School of Business
INDEPENDENT STUDY PROJECT
Kevin Sweeney
05/07/2015

45 | M a s o n S q u a r e S u p e r m a r k e t
Table of Contents Introduction And Overview .......................................................................................................... 46
Marketing Analysis ....................................................................................................................... 47
STP Analysis ............................................................................................................................. 47
SWOT Analysis ........................................................................................................................ 51
Marketing Strategy Recommendation ...................................................................................... 57
Financial Model ............................................................................................................................ 59
Conclusion .................................................................................................................................... 61
Appendix: Marketing Survey (for STCC) .................................................................................... 62
References ..................................................................................................................................... 65

46 | M a s o n S q u a r e S u p e r m a r k e t
Introduction And Overview Mason Square area of Springfield is a food desert, whose community is in urgent need of
a local source of fresh foods. The organization Develop Springfield has acquired parcels of land
in the middle of this area and has reached out to our team to develop models for a new full line
supermarket. We are planning to build this supermarket a destination where the community can
go to shop for healthier foods, with a majority of choices. The supermarket covers an area of
43,000 square foot. To make the best use of this space, our team made the design plan. (Table A)
Table A
The requirements were to design full line supermarket models without a market anchor,
yet remain a sustainable and profitable entity that offers quality food while catering to the

47 | M a s o n S q u a r e S u p e r m a r k e t
community’s cultural requirements with additional requests of being a “Green” store. To evaluate
the possibility, I’ll analyze the situation from marketing and financial view.
Marketing Analysis
To keep the store up and running, we need to know more about our consumers.
Therefore, I used the STP analysis to find and understand our targeting audience. After finding
the appropriate position, we’ll be able to analyze the supermarket itself, and give some useful
recommendations eventually.
STP Analysis
a. Segmenting
The supermarket is located one mail east of downtown Springfield on the south side of
State Street and is bordered by Walnut Street to the west, Oak Street to the east and Union Street
to the south (John, 2011). There are several organizations sited around this area, such as the
Springfield Technical Community College (STCC), which is located across State Street to the
west of Walnut Street. In addition, there are also some office buildings around. According to the
Table B, our main customers contain the following groups: residents, office tenants, students,
academic staff and thru traffic. In this case, the population of residents accounts 34%, and the
total potential spending of them is also the highest.
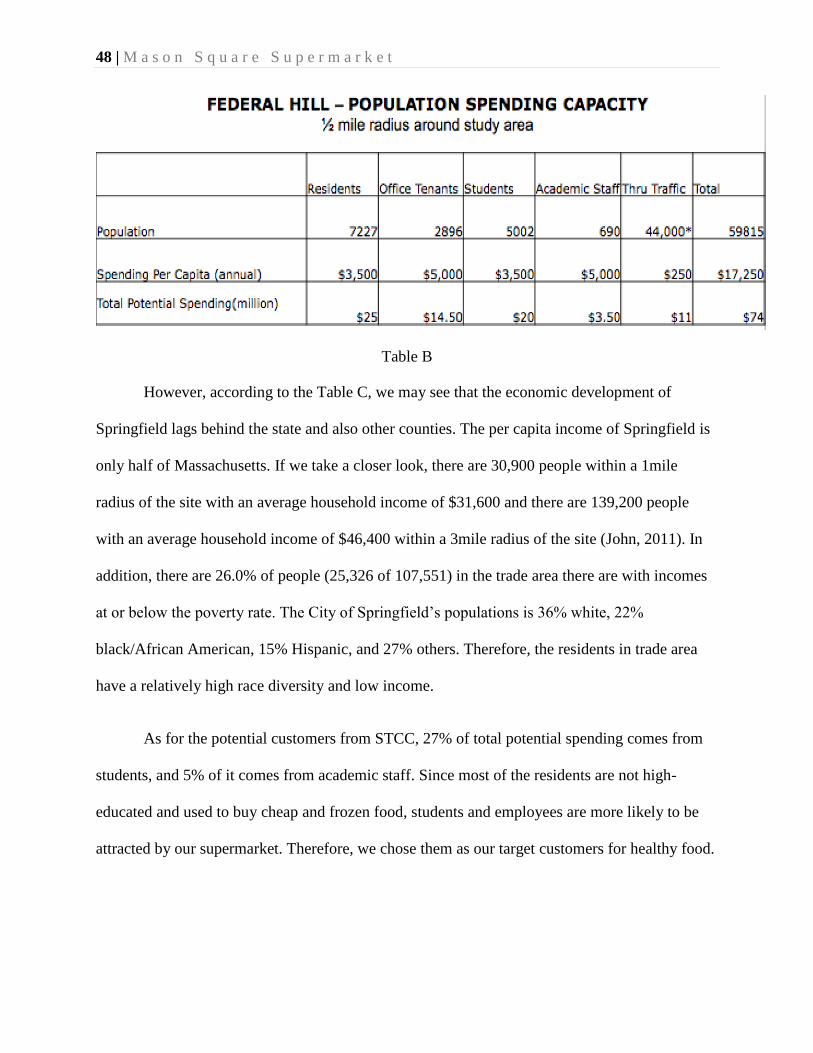
48 | M a s o n S q u a r e S u p e r m a r k e t
Table B
However, according to the Table C, we may see that the economic development of
Springfield lags behind the state and also other counties. The per capita income of Springfield is
only half of Massachusetts. If we take a closer look, there are 30,900 people within a 1mile
radius of the site with an average household income of $31,600 and there are 139,200 people
with an average household income of $46,400 within a 3mile radius of the site (John, 2011). In
addition, there are 26.0% of people (25,326 of 107,551) in the trade area there are with incomes
at or below the poverty rate. The City of Springfield’s populations is 36% white, 22%
black/African American, 15% Hispanic, and 27% others. Therefore, the residents in trade area
have a relatively high race diversity and low income.
As for the potential customers from STCC, 27% of total potential spending comes from
students, and 5% of it comes from academic staff. Since most of the residents are not high-
educated and used to buy cheap and frozen food, students and employees are more likely to be
attracted by our supermarket. Therefore, we chose them as our target customers for healthy food.

49 | M a s o n S q u a r e S u p e r m a r k e t
Table C
Source: http://en.wikipedia.org/wiki/Springfield,_Massachusetts#cite_note-69
b. Targeting
To understand our target customers better, we need to do some marketing research to
analyze their behaviors. We already analyzed the situation of residents, and may do more
research about the other groups. For instance, we can use questionnaire to reach the students and
staff of STCC (Appendix C). As for the office tenants and thru traffic, the situation of office
tenants is similar to the staff from STCC, and the shopping possibility is random for thru traffic.
In this circumstance, the STCC can be a good base for our research.
According to our research, 36% of students and academic staff will spend $51-100 per week for
groceries, and 27% of them will spend $101-150. Additionally, about 69% of them often go grocery
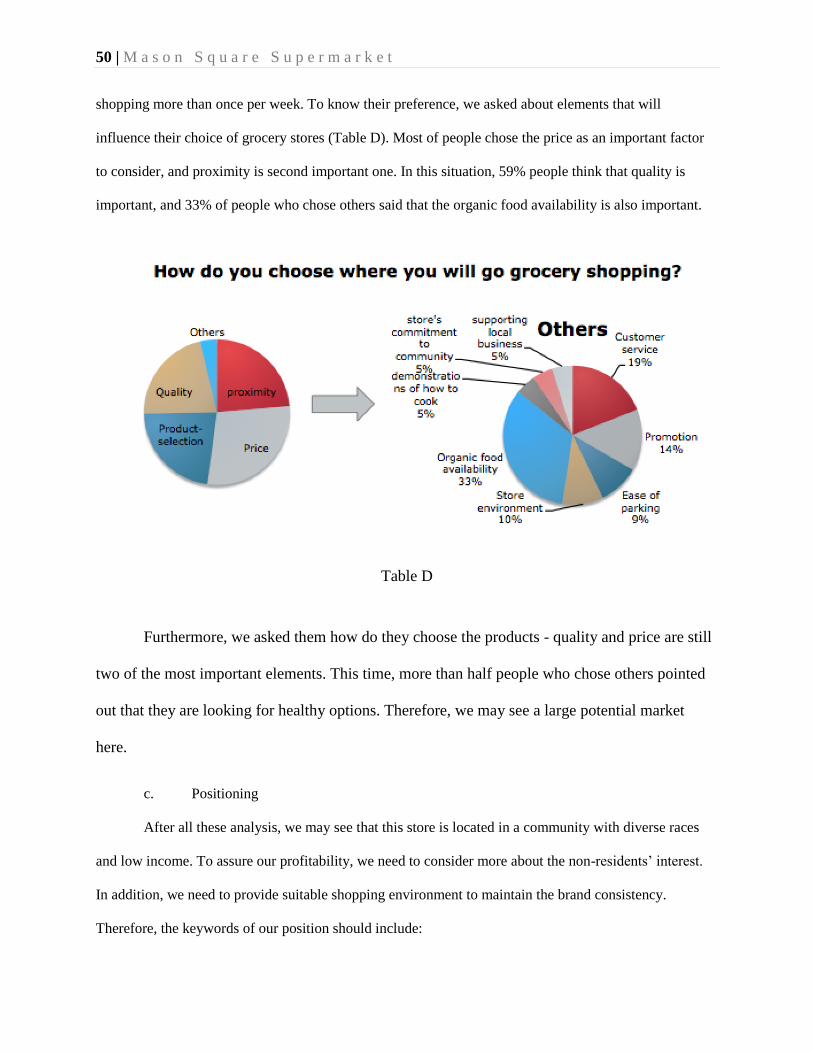
50 | M a s o n S q u a r e S u p e r m a r k e t
shopping more than once per week. To know their preference, we asked about elements that will
influence their choice of grocery stores (Table D). Most of people chose the price as an important factor
to consider, and proximity is second important one. In this situation, 59% people think that quality is
important, and 33% of people who chose others said that the organic food availability is also important.
Table D
Furthermore, we asked them how do they choose the products - quality and price are still
two of the most important elements. This time, more than half people who chose others pointed
out that they are looking for healthy options. Therefore, we may see a large potential market
here.
c. Positioning
After all these analysis, we may see that this store is located in a community with diverse races
and low income. To assure our profitability, we need to consider more about the non-residents’ interest.
In addition, we need to provide suitable shopping environment to maintain the brand consistency.
Therefore, the keywords of our position should include:
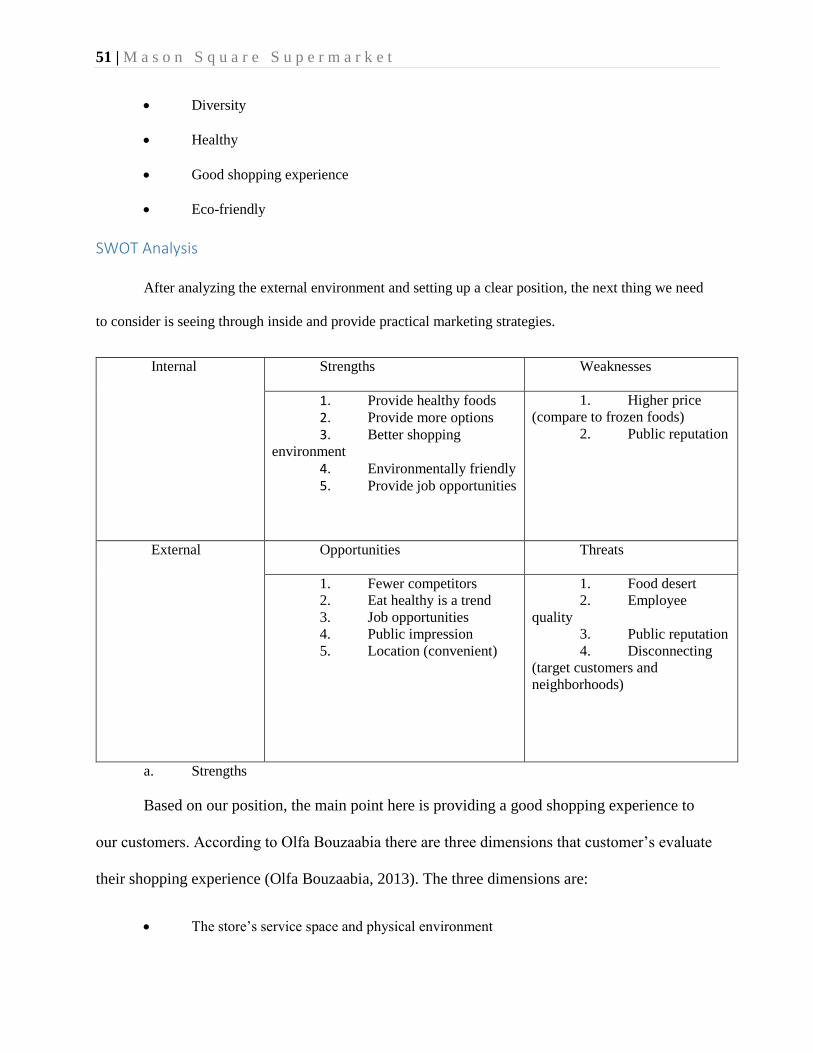
51 | M a s o n S q u a r e S u p e r m a r k e t
Diversity
Healthy
Good shopping experience
Eco-friendly
SWOT Analysis
After analyzing the external environment and setting up a clear position, the next thing we need
to consider is seeing through inside and provide practical marketing strategies.
Internal Strengths Weaknesses
1. Provide healthy foods
2. Provide more options
3. Better shopping
environment
4. Environmentally friendly
5. Provide job opportunities
1. Higher price
(compare to frozen foods)
2. Public reputation
External Opportunities Threats
1. Fewer competitors
2. Eat healthy is a trend
3. Job opportunities
4. Public impression
5. Location (convenient)
1. Food desert
2. Employee
quality
3. Public reputation
4. Disconnecting
(target customers and
neighborhoods)
a. Strengths
Based on our position, the main point here is providing a good shopping experience to
our customers. According to Olfa Bouzaabia there are three dimensions that customer’s evaluate
their shopping experience (Olfa Bouzaabia, 2013). The three dimensions are:
The store’s service space and physical environment
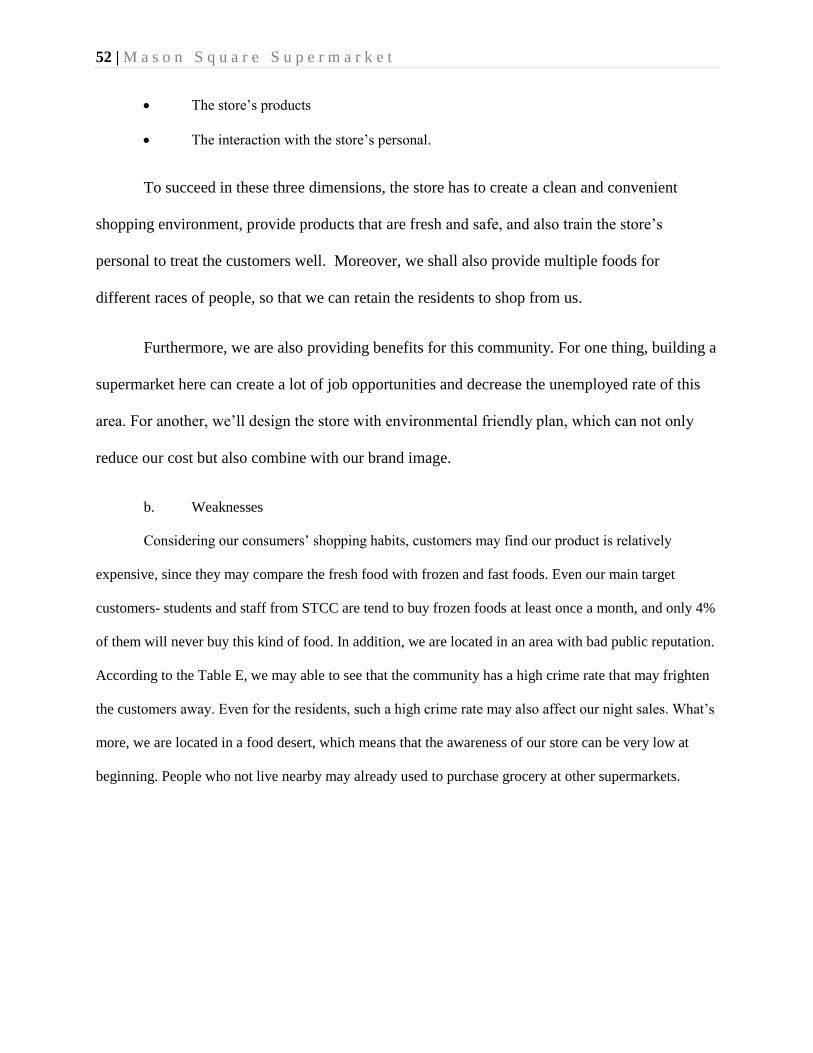
52 | M a s o n S q u a r e S u p e r m a r k e t
The store’s products
The interaction with the store’s personal.
To succeed in these three dimensions, the store has to create a clean and convenient
shopping environment, provide products that are fresh and safe, and also train the store’s
personal to treat the customers well. Moreover, we shall also provide multiple foods for
different races of people, so that we can retain the residents to shop from us.
Furthermore, we are also providing benefits for this community. For one thing, building a
supermarket here can create a lot of job opportunities and decrease the unemployed rate of this
area. For another, we’ll design the store with environmental friendly plan, which can not only
reduce our cost but also combine with our brand image.
b. Weaknesses
Considering our consumers’ shopping habits, customers may find our product is relatively
expensive, since they may compare the fresh food with frozen and fast foods. Even our main target
customers- students and staff from STCC are tend to buy frozen foods at least once a month, and only 4%
of them will never buy this kind of food. In addition, we are located in an area with bad public reputation.
According to the Table E, we may able to see that the community has a high crime rate that may frighten
the customers away. Even for the residents, such a high crime rate may also affect our night sales. What’s
more, we are located in a food desert, which means that the awareness of our store can be very low at
beginning. People who not live nearby may already used to purchase grocery at other supermarkets.
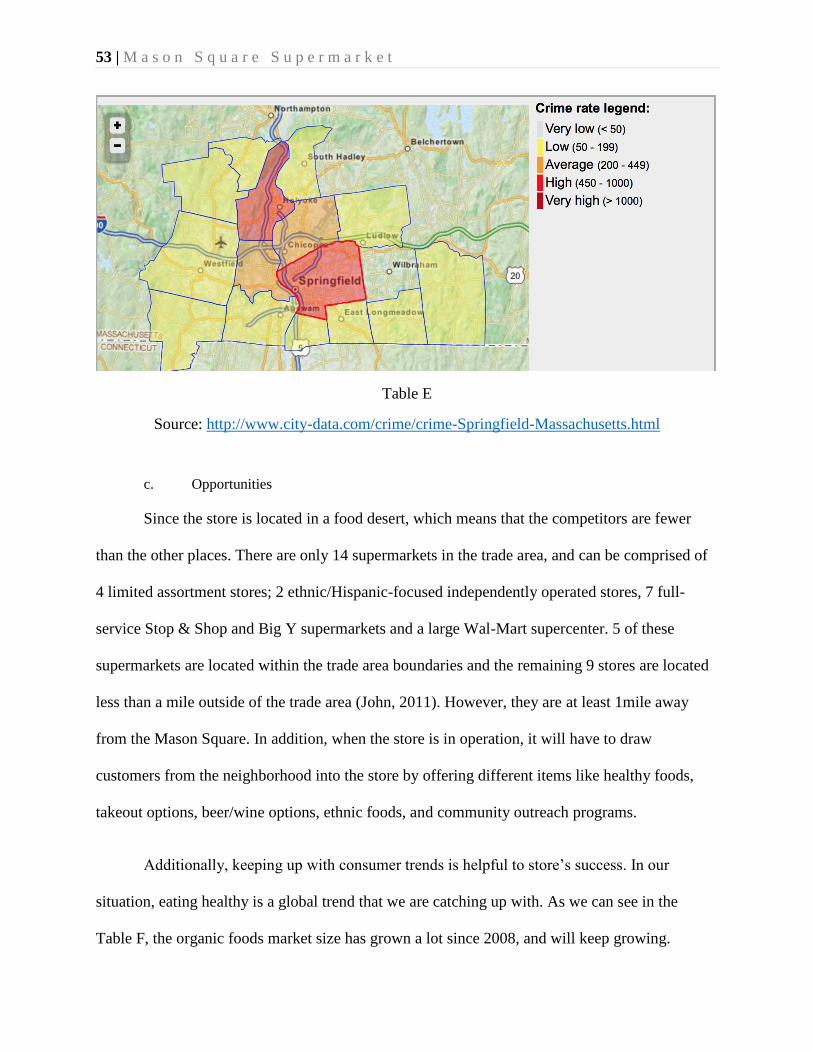
53 | M a s o n S q u a r e S u p e r m a r k e t
Table E
Source: http://www.city-data.com/crime/crime-Springfield-Massachusetts.html
c. Opportunities
Since the store is located in a food desert, which means that the competitors are fewer
than the other places. There are only 14 supermarkets in the trade area, and can be comprised of
4 limited assortment stores; 2 ethnic/Hispanic-focused independently operated stores, 7 full-
service Stop & Shop and Big Y supermarkets and a large Wal-Mart supercenter. 5 of these
supermarkets are located within the trade area boundaries and the remaining 9 stores are located
less than a mile outside of the trade area (John, 2011). However, they are at least 1mile away
from the Mason Square. In addition, when the store is in operation, it will have to draw
customers from the neighborhood into the store by offering different items like healthy foods,
takeout options, beer/wine options, ethnic foods, and community outreach programs.
Additionally, keeping up with consumer trends is helpful to store’s success. In our
situation, eating healthy is a global trend that we are catching up with. As we can see in the
Table F, the organic foods market size has grown a lot since 2008, and will keep growing.
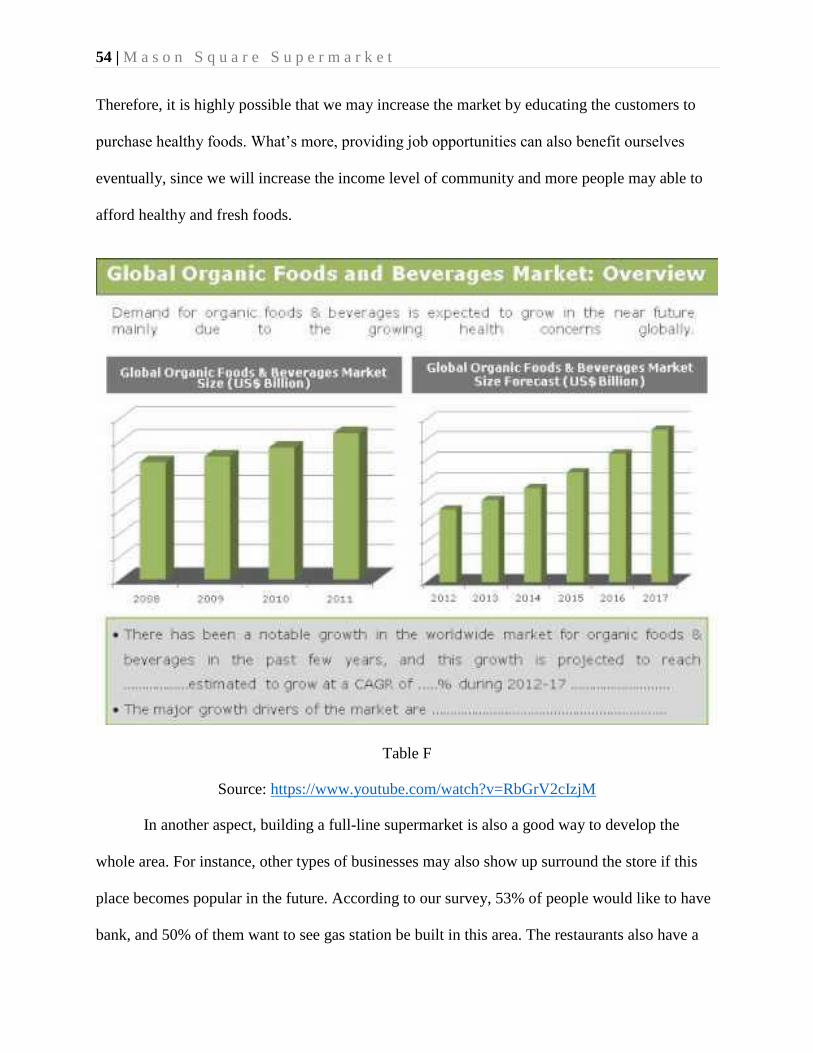
54 | M a s o n S q u a r e S u p e r m a r k e t
Therefore, it is highly possible that we may increase the market by educating the customers to
purchase healthy foods. What’s more, providing job opportunities can also benefit ourselves
eventually, since we will increase the income level of community and more people may able to
afford healthy and fresh foods.
Table F
Source: https://www.youtube.com/watch?v=RbGrV2cIzjM
In another aspect, building a full-line supermarket is also a good way to develop the
whole area. For instance, other types of businesses may also show up surround the store if this
place becomes popular in the future. According to our survey, 53% of people would like to have
bank, and 50% of them want to see gas station be built in this area. The restaurants also have a
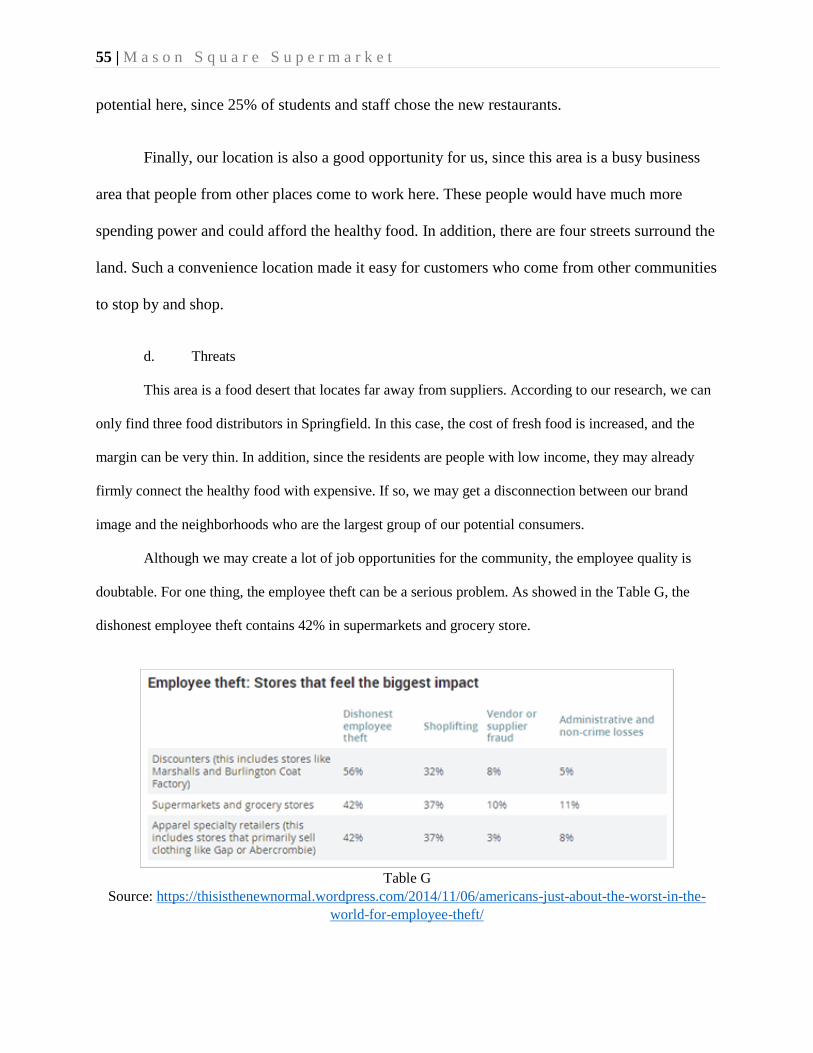
55 | M a s o n S q u a r e S u p e r m a r k e t
potential here, since 25% of students and staff chose the new restaurants.
Finally, our location is also a good opportunity for us, since this area is a busy business
area that people from other places come to work here. These people would have much more
spending power and could afford the healthy food. In addition, there are four streets surround the
land. Such a convenience location made it easy for customers who come from other communities
to stop by and shop.
d. Threats
This area is a food desert that locates far away from suppliers. According to our research, we can
only find three food distributors in Springfield. In this case, the cost of fresh food is increased, and the
margin can be very thin. In addition, since the residents are people with low income, they may already
firmly connect the healthy food with expensive. If so, we may get a disconnection between our brand
image and the neighborhoods who are the largest group of our potential consumers.
Although we may create a lot of job opportunities for the community, the employee quality is
doubtable. For one thing, the employee theft can be a serious problem. As showed in the Table G, the
dishonest employee theft contains 42% in supermarkets and grocery store.
Table G
Source: https://thisisthenewnormal.wordpress.com/2014/11/06/americans-just-about-the-worst-in-the-
world-for-employee-theft/
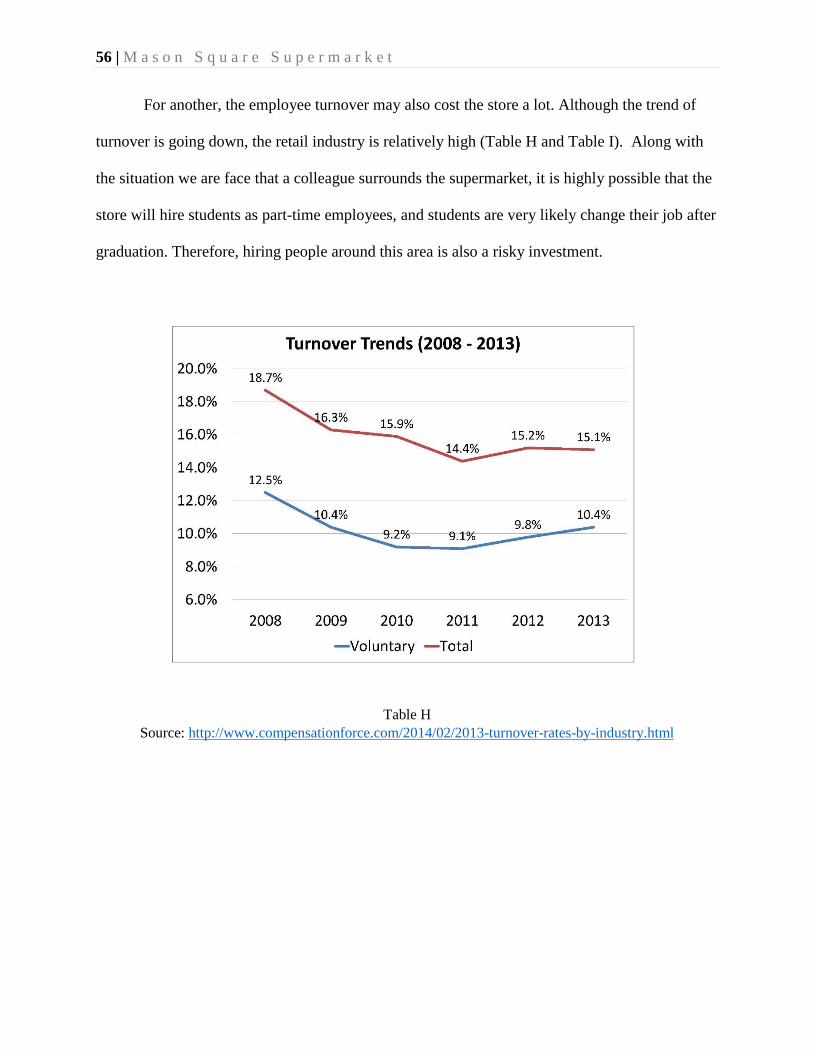
56 | M a s o n S q u a r e S u p e r m a r k e t
For another, the employee turnover may also cost the store a lot. Although the trend of
turnover is going down, the retail industry is relatively high (Table H and Table I). Along with
the situation we are face that a colleague surrounds the supermarket, it is highly possible that the
store will hire students as part-time employees, and students are very likely change their job after
graduation. Therefore, hiring people around this area is also a risky investment.
Table H
Source: http://www.compensationforce.com/2014/02/2013-turnover-rates-by-industry.html
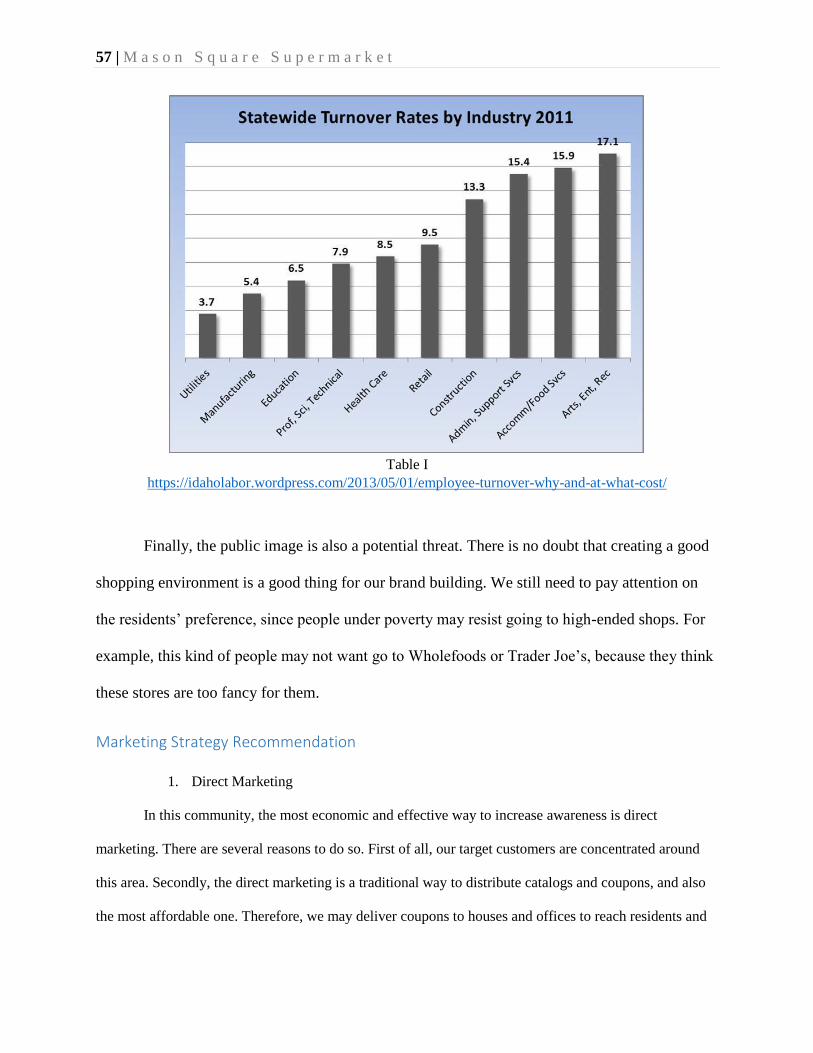
57 | M a s o n S q u a r e S u p e r m a r k e t
Table I
https://idaholabor.wordpress.com/2013/05/01/employee-turnover-why-and-at-what-cost/
Finally, the public image is also a potential threat. There is no doubt that creating a good
shopping environment is a good thing for our brand building. We still need to pay attention on
the residents’ preference, since people under poverty may resist going to high-ended shops. For
example, this kind of people may not want go to Wholefoods or Trader Joe’s, because they think
these stores are too fancy for them.
Marketing Strategy Recommendation
1. Direct Marketing
In this community, the most economic and effective way to increase awareness is direct
marketing. There are several reasons to do so. First of all, our target customers are concentrated around
this area. Secondly, the direct marketing is a traditional way to distribute catalogs and coupons, and also
the most affordable one. Therefore, we may deliver coupons to houses and offices to reach residents and
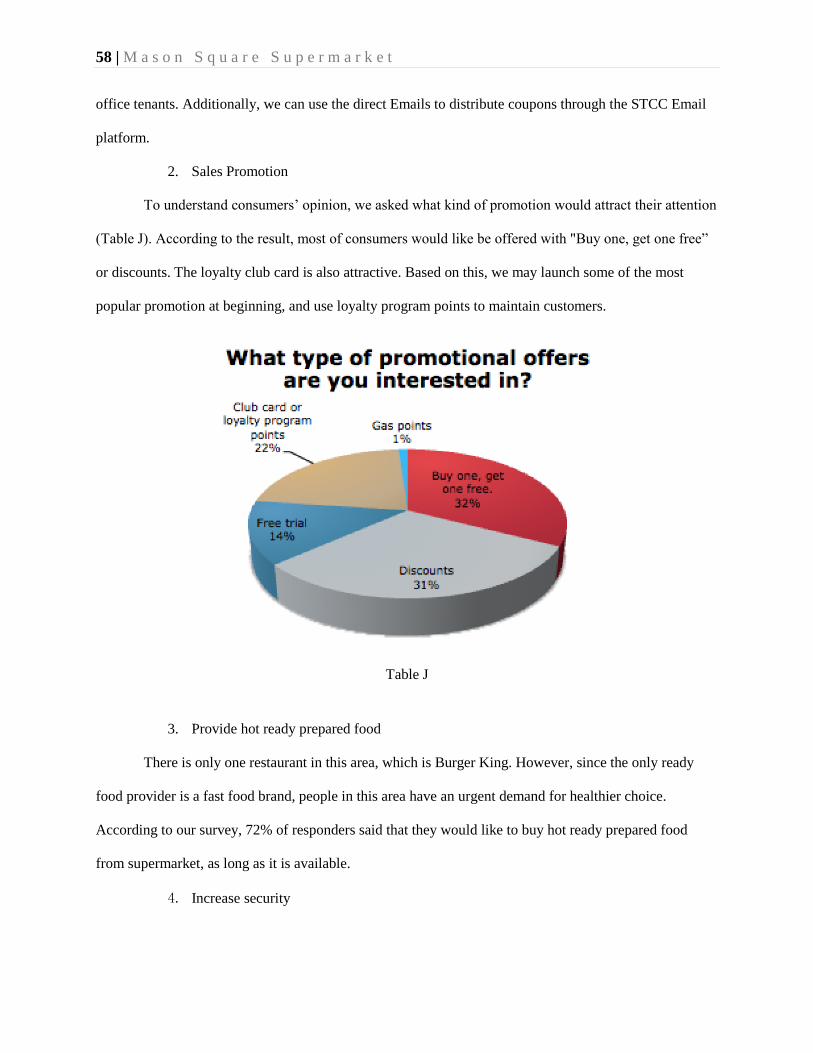
58 | M a s o n S q u a r e S u p e r m a r k e t
office tenants. Additionally, we can use the direct Emails to distribute coupons through the STCC Email
platform.
2. Sales Promotion
To understand consumers’ opinion, we asked what kind of promotion would attract their attention
(Table J). According to the result, most of consumers would like be offered with "Buy one, get one free”
or discounts. The loyalty club card is also attractive. Based on this, we may launch some of the most
popular promotion at beginning, and use loyalty program points to maintain customers.
Table J
3. Provide hot ready prepared food
There is only one restaurant in this area, which is Burger King. However, since the only ready
food provider is a fast food brand, people in this area have an urgent demand for healthier choice.
According to our survey, 72% of responders said that they would like to buy hot ready prepared food
from supermarket, as long as it is available.
4. Increase security

59 | M a s o n S q u a r e S u p e r m a r k e t
The biggest weakness that the supermarket contains is the bad reputation for insecure. To
overcome this problem, the store needs to adopt some measures to ensure consumers’ security and also
make them feel safe. First of all, the store needs to hire some guards to patrol around the land. Beside that,
it should also install the cameras to make sure that the police can get the first-hand information.
Additionally, the store can also set up a lot of lights in the parking lot, and light them up at night.
5. Others
To approach to the other group of consumers-thru traffic, we may consider using the billboard
around the road. For these consumers, the most possible reason for them to shop here is convenience. For
example, one person is driving ahead home and accidently remember that he or she need to buy
something. In this circumstance, our billboard needs to be the thing that will remind people that they need
to restock the grocery.
Cooperating with other business benefits us in two aspects. On one hand, a series of companies
will change the atmosphere of this area. On the other hand, surrounded by different kinds of organizations
can bring us more opportunities. For instance, people may come for banking, and look into the shop while
waiting.
Although 90% of respondents said that they have the car for shopping, most of residents with low
income do not own a car. Therefore, providing the shuttle can superbly increase our customer service and
more likely attract them to shop here.
Financial Model
To provide the financial model of this supermarket, we need to know the industry status
(Table K). Based on the data we got for the equipment, we may provide a rough model (Table
L).
Average Supermarket Data (Traditional or Conventional Supermarkets)
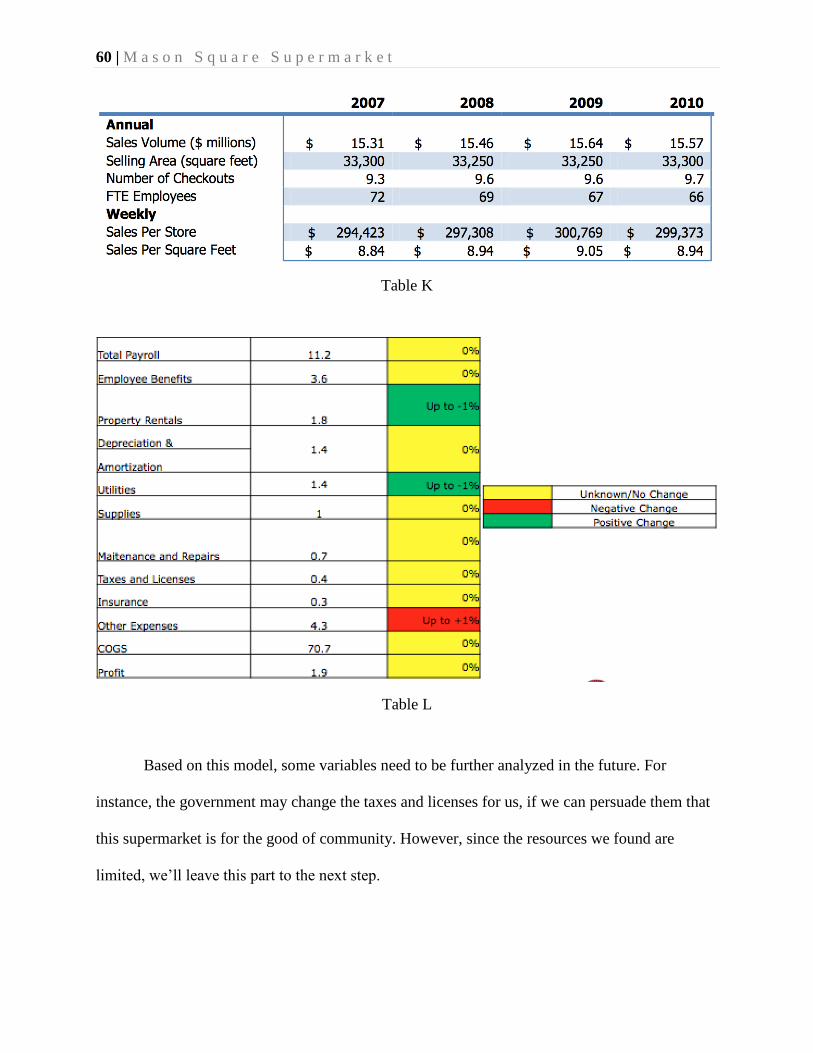
60 | M a s o n S q u a r e S u p e r m a r k e t
Table K
Table L
Based on this model, some variables need to be further analyzed in the future. For
instance, the government may change the taxes and licenses for us, if we can persuade them that
this supermarket is for the good of community. However, since the resources we found are
limited, we’ll leave this part to the next step.
61 | M a s o n S q u a r e S u p e r m a r k e t
Conclusion In this paper, I mainly analyzed the marketing situation for building a supermarket in
Mason Square. After STP Analysis and SWOT Analysis, we may see that this investment is
risky, but still has a large potential. To help the organization avoid some of the threats and make
up some weaknesses, we provided some marketing strategy recommendations. Based on that, we
provided a rough financial model to help the organization analyze the future situation.

62 | M a s o n S q u a r e S u p e r m a r k e t
Appendix: Marketing Survey (for STCC)
Mason Square Supermarket Survey
Q1 Are you a student or faculty/staff at STCC?
Student (1)
Faculty or staff (2)
Q2 How often do you go grocery shopping?
Daily (1)
2-3 Times a Week (2)
Once a Week (3)
2-3 Times a Month (4)
Once a Month (5)
Less than Once a Month (6)
Never (7)
If Never Is Selected, Then Skip To End of Survey
Q3 Which best describes the distance from your home to STCC?
Less than 1 mile (1)
1-5 miles (2)
5-10 miles (3)
Over 10 miles (4)
Q4 What is your monthly household income?
Less than $1000 (1)
$1000-2000 (2)
$2001-3000 (3)
$3001-4000 (4)
Greater than $4000 (5)

63 | M a s o n S q u a r e S u p e r m a r k e t
Q5 On average, how much do you spend for all your groceries each week?
Less than $10 (1)
$11-20 (2)
$21-30 (3)
$31-50 (4)
Over $50 (5)
Q6 Which transportation do you use most often to do grocery shopping?
Car (1)
Bus (2)
Bicycle (3)
Taxi (4)
By foot (5)
Other: please specify (6) ____________________
Q7 How do you choose where you will go grocery shopping? Mark all that apply.
Proximity (1)
Price (2)
Product selection (3)
Quality (4)
Other: please specify (5) ____________________
Q8 How do you choose the products you buy? Mark all that apply
Brand name (1)
Price (2)
Quality (3)
Habit (4)
Other: please specify (5) ____________________
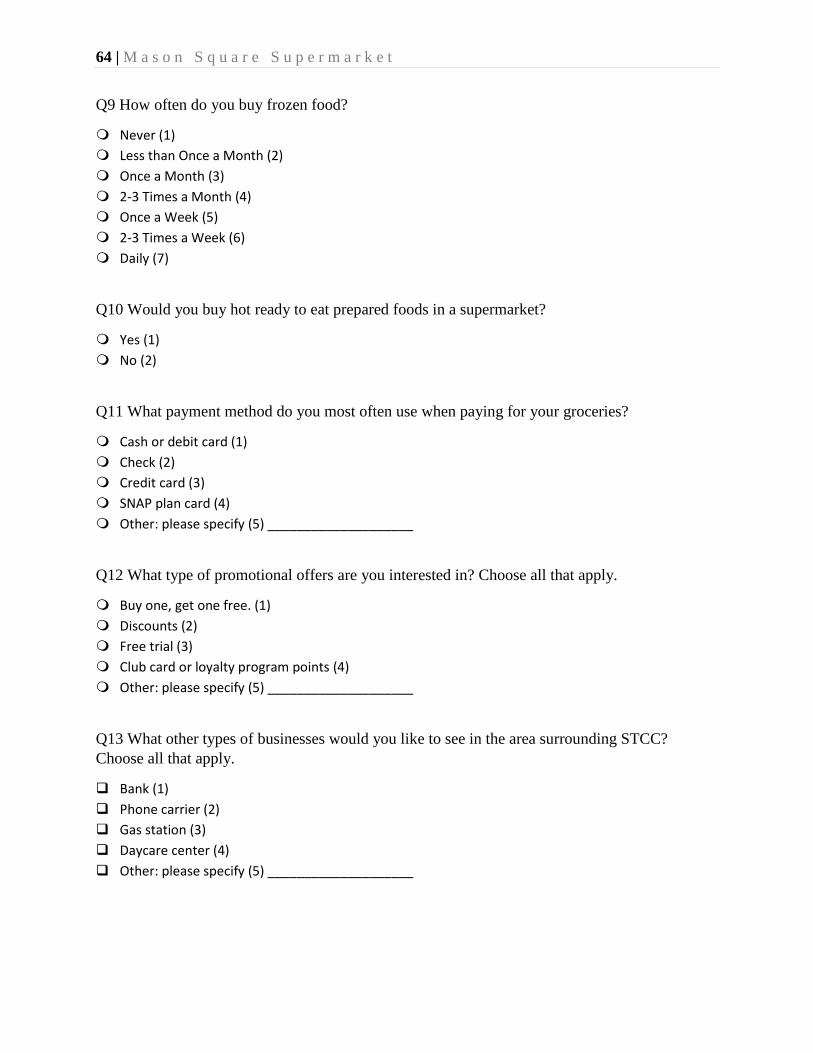
64 | M a s o n S q u a r e S u p e r m a r k e t
Q9 How often do you buy frozen food?
Never (1)
Less than Once a Month (2)
Once a Month (3)
2-3 Times a Month (4)
Once a Week (5)
2-3 Times a Week (6)
Daily (7)
Q10 Would you buy hot ready to eat prepared foods in a supermarket?
Yes (1)
No (2)
Q11 What payment method do you most often use when paying for your groceries?
Cash or debit card (1)
Check (2)
Credit card (3)
SNAP plan card (4)
Other: please specify (5) ____________________
Q12 What type of promotional offers are you interested in? Choose all that apply.
Buy one, get one free. (1)
Discounts (2)
Free trial (3)
Club card or loyalty program points (4)
Other: please specify (5) ____________________
Q13 What other types of businesses would you like to see in the area surrounding STCC?
Choose all that apply.
Bank (1)
Phone carrier (2)
Gas station (3)
Daycare center (4)
Other: please specify (5) ____________________
65 | M a s o n S q u a r e S u p e r m a r k e t
Q14. How much would you be willing to pay for a grocery shopping home delivery?
Less than $5 (1)
$5.01-10 (2)
Free delivery for orders greater than $40 (3)
I would not be interested in grocery shopping home delivery (4)
Other: please specify (5) ____________________
Q15 Is there anything we didn't ask you regarding building a full service grocery store in the
neighborhood surrounding STCC that you would like to add?
Yes (4)
Q16 Please enter your e-mail address here if you would like to be included in the drawing to win
a $50 Amazon gift card. Winner will be chosen randomly and will be notified using this e-mail
address.
References
Bouzaabia, Olfa, van Riel Allard CR, and Janjaap Semeijn. "Managing in-Store Logistics: A
Fresh Perspective on Retail Service." Journal of Service Management 24.2 (2013): 112-
29. ProQuest. Web. 26 Feb. 2015.
Domino, John. (2011). Supermarket Feasibility Analysis of State Street Development Site
Springfield, MA.
The Reinvestment Fund. (2011, September 30). Understanding Grocery Industry. Financing
Healthy Food Options: Implementation Handbook.

66 | M a s o n S q u a r e S u p e r m a r k e t
67 | M a s o n S q u a r e S u p e r m a r k e t
Bibliography
Alvarado Manufacturing Co. Inc. (2010, June 18). Case Study: Post and rail helps mitigate theft at
Albertsons. Retrieved from Alvarado Manufacturing Co. Inc.:
http://alvaradomfg.com/newsroom/case-studies/albertsons-post-and-rail/
Alvarado Manufacturing Co. Inc. (2015, May 25). Crowd Control Gate: GDO. Retrieved from Alvarado
Manufacturing Co. Inc.: http://alvaradomfg.com/crowd-control-gate-gdo/
Berman, C. (n.d.). What Is the Meaning of Perishable Inventory? Retrieved from Small Business (Demand
Media): http://smallbusiness.chron.com/meaning-perishable-inventory-75877.html
Board of Governors of the Federal Reserve System. (2014, February 11). Community Development:
Community Reivestment Act (RCA): Board of Governors of the Federal Reserve System. Retrieved
from http://www.federalreserve.gov/communitydev/cra_about.htm
Buzzuto's Incorperated. (2015, April 22). Retail Services: Buzzuto's Incorperated. Retrieved from
http://www.bozzutos.com/Retail_Services.html
C&S Wholesale Grocers. (2015, April 22). Services: C&S Wholesale Grocers. Retrieved from
http://www.cswg.com/services
Commonwealth of Massachusetts: Energy and Environmental Affairs. (2015, April 23). EEA Home:
Agencies: Department of Agriculture Resources: Agricultrual Energy Grant Program: Energy and
Environmental Affairs. Retrieved from
http://www.mass.gov/eea/agencies/agr/about/divisions/ag-energy.html
68 | M a s o n S q u a r e S u p e r m a r k e t
Cumbie, P. M. (2015, April 27). (PDF) How to Start a Food Co-op. Retrieved from
http://www.cooperativegrocer.coop/library/start-a-food-coop (PDF Found at this link)
Kokemuller, N. (n.d.). What is Retail Shrinkage? Retrieved from Small Business (Demand Media):
http://smallbusiness.chron.com/retail-shrinkage-55148.html
Ligthart, F. (n.d.). Closed supermarket refridgerator and freezer cabinets: a feasibility study: ECN (PDF).
Retrieved from ECN: http://www.ecn.nl/docs/library/report/2007/e07098.pdf
Massachusetts State Lottery Commission. (2015, April 22). Retrieved from
http://www.masslottery.com/lib/downloads/MSLC-Info-Pack-2013-v4.pdf
National Credit Union Administration. (2015, April 27). Learn about Credit Unions: What is a Credit
Union?: National Credit Union Administration. Retrieved from My Credit Union:
http://www.mycreditunion.gov/Pages/whats-a-credit-union.aspx
National Grid . (n.d.). Managing Energy Costs in Grocery Stores: National Grid. Retrieved from National
Grid (PDF): http://www.nationalgridus.com/non_html/shared_energyeff_groceries.pdf
Slater, D. (2010, July 28). Retail Security: Critical Strategies. Retrieved from CSO Online:
http://www.csoonline.com/article/2125650/investigations-forensics/retail-security--critical-
strategies.html
Sloat, N., & West, J. (2015). Developing Springfiled. Worcester, Massachusetts, USA.
Smith, C. (n.d.). What Causes Inventory Shrinkage? Retrieved from Small Business (Demand Media):
http://smallbusiness.chron.com/causes-inventory-shrinkage-20127.html
Solar Window Technologies Inc. (2015, April 8). Independent Validation Confirms One-Year
SolarWindow™ Financial Payback . Retrieved from Solar Window Technologies Inc.:
69 | M a s o n S q u a r e S u p e r m a r k e t
http://solarwindow.com/2015/04/independent-validation-confirms-one-year-solarwindow-
financial-payback/
Solar Window Technologies Inc. (2015, March 10). SOLARWINDOW™ ACCELERATES PRODUCT-
DURABILITY TESTING FOLLOWING PROMISING EARLY RESULTS. Retrieved from Solar Window
Technologies Inc.: http://solarwindow.com/2015/03/solarwindow-accelerates-product-
durability-testing-following-promising-early-results/
The Reinvestment Fund: United States Department of Treasury . (2015, May 15). What We
Do:Resources:Community Development Financial Institutions Fund. Retrieved from Community
Development Financial Institutions Fund:
http://www.cdfifund.gov/what_we_do/resources/Understanding%20Grocery%20Industry_for%
20fund_102411.pdf
United States Deparment of Agriculture. (n.d.). Food Deserts. Retrieved from United States Department
of Agriculture: http://apps.ams.usda.gov/fooddeserts/fooddeserts.aspx
Where's My Shrink? (n.d.). Shrink Research. Retrieved from Where's My Shrink?:
http://wheresmyshrink.com/executivesummary.html
Wilson, M. (2014, November 6). Study: Shrink costs U.S. retailers $42 billion; employee theft tops
shoplifting. Retrieved from Chain Store Age: http://www.chainstoreage.com/article/study-
shrink-costs-us-retailers-42-billion-employee-theft-tops-shoplifting


