Mass balance 4.3. minerals carbon dioxide water dioxygen nitrogen-waste. organics food structure reserve product. flux of compound i chemical index for element i in compound j for all compounds j. compounds. DEB model specifies organic fluxes - PowerPoint PPT Presentation
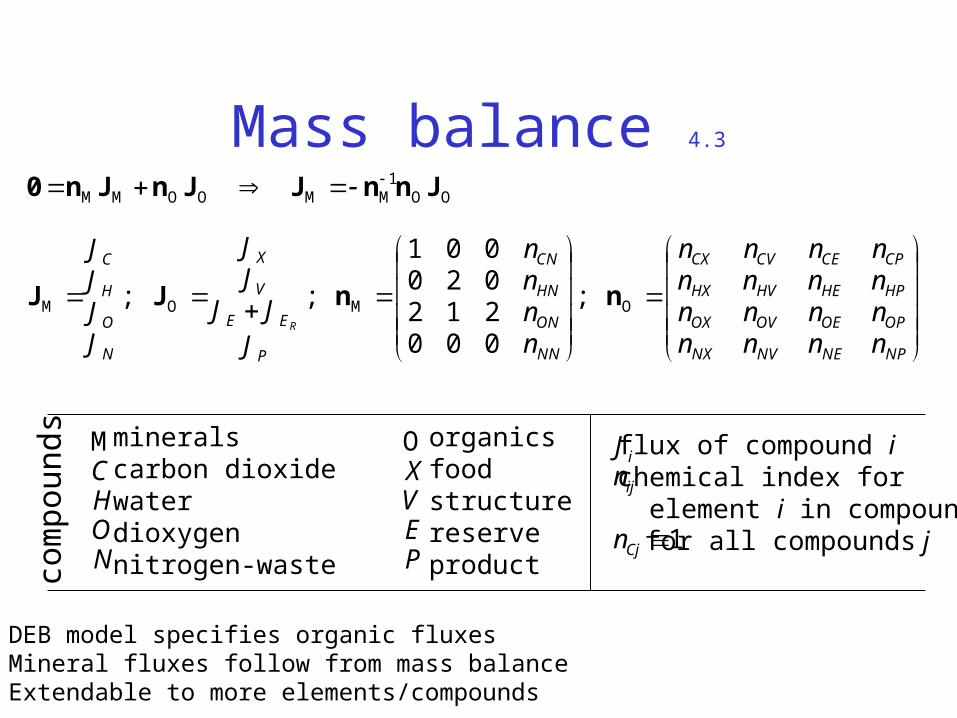
Mass balance 4.3 NP NE NV NX OP OE OV OX HP HE HV HX CP CE CV CX NN ON HN CN P E E V X N O H C n n n n n n n n n n n n n n n n n n n n J J J J J J J J J R O M O M O O M M O O M M n n J J J n n J J n J n 0 ; 0 0 0 2 1 2 0 2 0 0 0 1 ; ; 1 N O H C M P E V X O minerals carbon dioxide water dioxygen nitrogen-waste organics food structure reserve product 1 Cj ij i n n J flux of compound i chemical index for element i in compoun for all compounds j DEB model specifies organic fluxes Mineral fluxes follow from mass balance Extendable to more elements/compounds compounds
Transcript
Mass balance 4.3
NPNENVNX
OPOEOVOX
HPHEHVHX
CPCECVCX
NN
ON
HN
CN
P
EE
V
X
N
O
H
C
nnnnnnnnnnnnnnnn
nnnn
JJJ
JJ
JJJJ
R
OMOM
OOMMOOMM
nnJJ
JnnJJnJn0
;
000212020001
;;
1
NOHCM
PEVXOminerals
carbon dioxidewaterdioxygennitrogen-waste
organicsfoodstructurereserveproduct
1Cj
ij
i
n
nJ flux of compound i
chemical index for element i in compound j for all compounds j
DEB model specifies organic fluxesMineral fluxes follow from mass balanceExtendable to more elements/compounds
com
poun
ds
Mass-energy coupling 4.3
PGPDPA
EEE
VG
XA
G
D
A
P
EE
V
X
EVEVGVGVGEXEAXAXXA
ηηημμμ
ηη
ppp
JJJ
JJ
μyμμημyμμη
R
111
11
0000
;;
;;;;
OO
OO
ηpJ
pηJ
com
poun
ds
PEVXO organics
foodstructurereserveproduct
pow
ers
GDA assimilation
dissipationgrowth ij
ij
E
ηyμ chemical potential of E
yield of compound i on jcoupler of compound i to power j for faeces:
OOMMMOOMOOMM ηnnηpηpηnnJnnJ 111 for Decomposition of mineral fluxes into contributions from 3 basic energy fluxes:
0 PGPD ηη
Organic fluxesare linear combinations
of 3 energy fluxes
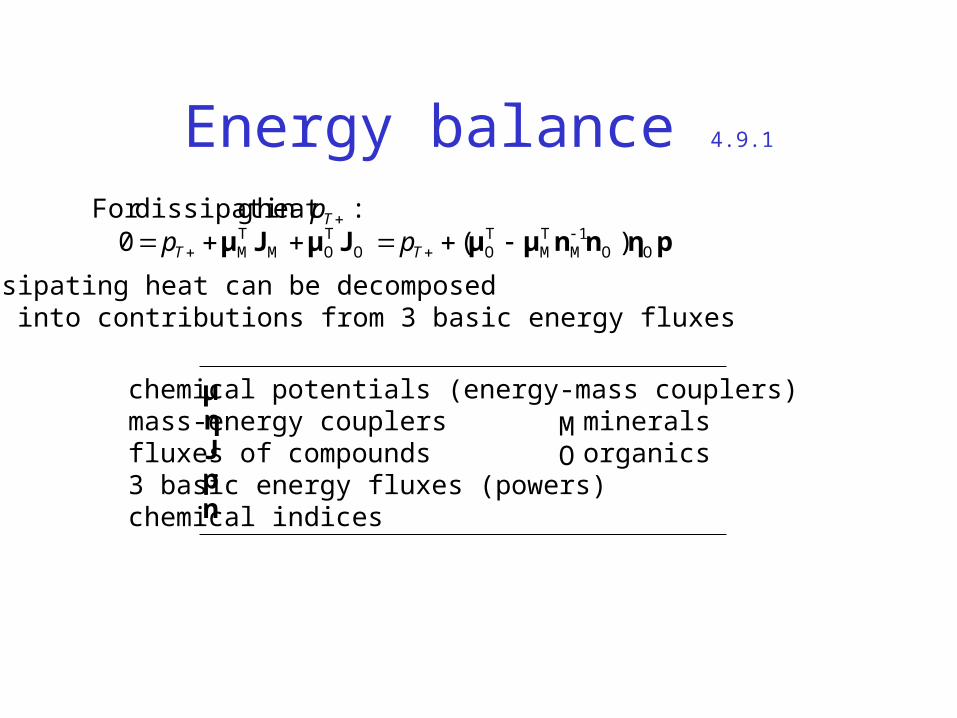
Energy balance 4.9.1
pηnnμμJμJμ OOMTM
TOO
TOM
TM )(0
:heat gdissipatinFor 1
TT
T
ppp
Dissipating heat can be decomposed into contributions from 3 basic energy fluxes
npJημ chemical potentials (energy-mass couplers)
mass-energy couplers fluxes of compounds3 basic energy fluxes (powers)chemical indices
Heat production = wC CO2-production + wO O2-consumption + wN N-waste production
DEB-explanation:Mass and heat fluxes = wA assimilation + wD dissipation + wG growthApplies to CO2, O2, N-waste, heat, food, faeces, …
For V1-morphs: dissipation maintenance
Mass fluxes 4.1
dioxidecarbon 2 CJ
water2 HJ
dioxygen2 OJ
ammonia10 NJ
foodXJ
structure40 VJ
reserve)(10
REE JJ faeces
PJ
llength scaled
f
lux
f
lux
bl pl
notice small dent due to transition
maturation reproductionAt abundant food: growth ceases at l = 1
allocation toreproduction
use of reservenot balanced by
feeding in embryo
bl pl
0 1
10
Methanotrophy 4.3.1
Yield coefficients Y and chemical indices n depend on (variable) specific growth rate rNWOWHW nnnWX3NX2OX2CX4 NOCH Y NH Y O Y CO Y CH
AC Assim (catabolic) -1 1 2 -2 0 0 0
AA Assim (anabolic) -1 0 1 0
M Maintenance 0 1 -1 0
GC Growth (catabolic) 0 1 -1 0
GA Growth (anabolic) 0 0 -1 1
C Carbon 1 1 0 0 0 1 1
H Hydrogen 4 0 2 0 3
O Oxygen 0 2 1 2 0
N Nitrogen 0 0 0 0 1
2/2/2/
2/32/2/
2/2/1
2/2/3
2/2/
2/2/32
From
GHEOVOE
GOE
GNEHVHE
GHE
NVNEG
NE
MHEOE
MOE
HENEM
HE
OEA
HXA
OX
HEA
NXA
HX
NEA
NX
YnnY
YnnY
nnY
YnY
nnY
nYY
nYY
nY
nY0
AHXY A
OXY ANXY
MHEY
GHEY
MHEY
MOEYM
OEYG
OEY GNEY
NEn
NEn
HEn
OEn
NEn
HVn
OVn
NVn
sym
bol
proc
ess
X: m
etha
ne
C: c
arbo
n di
oxid
e
H: w
ater
O: d
ioxy
gen
N: a
mm
onia
E: r
eser
ve
V: s
truc
ture
EAXE jy )1(
EAj
EGVE jy )1(
EGVE jy
EMj
EVE
EMEEVV
EVEG
MEVEM
EAmEA
ym
jkmM
dt
dMr
ryj
kyjXK
Xjj
1
For reserve density mE = ME/MV (ratio of amounts of reserve and structure), the macroscopic transformation can be decomposed into 5 microscopic ones with fixed coefficients
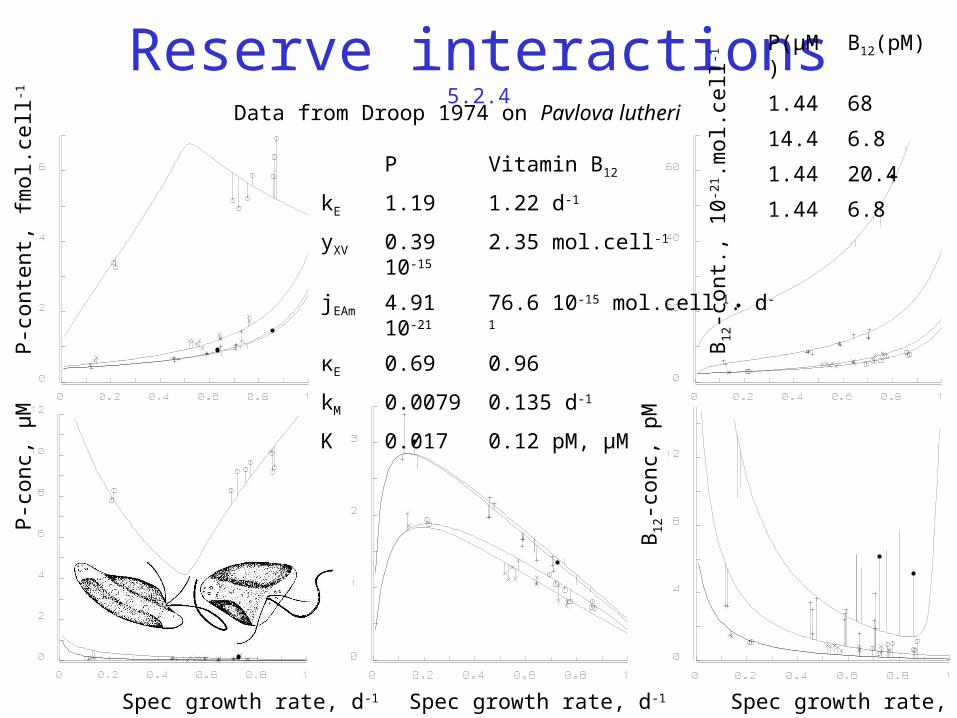
Only curves at 0 d are fittedNotice • slow response• gut content in down steps
Steps up
Steps down
Growth on reserve 7.1.3
Opt
ical
Den
sity
at 5
40 n
m
Con
c. p
otas
sium
, mM
Potassium limited growth of E. coli at 30 °CData Mulder 1988; DEB model fitted
OD increases by factor 4 during nutrient starvationinternal reserve fuels 9 hours of growth
time, h
Growth on reserve 7.1.3
Growth in starved Mytilus edulis at 21.8 °CData Strömgren & Cary 1984; DEB model fitted
internal reserve fuels 5 days of growth
time, d
grow
th r
ate,
mm
.d-1
Protein synthesis 7.5
spec growth rate, h-1 scaled spec growth rate
RN
A/d
ry w
eigh
t, μg
.μg-1
scal
ed e
long
atio
n ra
te
Data from Koch 1970Data from Bremer & Dennis 1987
RNA = wRV MV + wRE ME
dry weight = wdV MV + wdE ME
Scales of life 8.0
Life span
10log aVolume
10log m3earth
whale
bacterium
water molecule
life on earth
whale
bacteriumATP
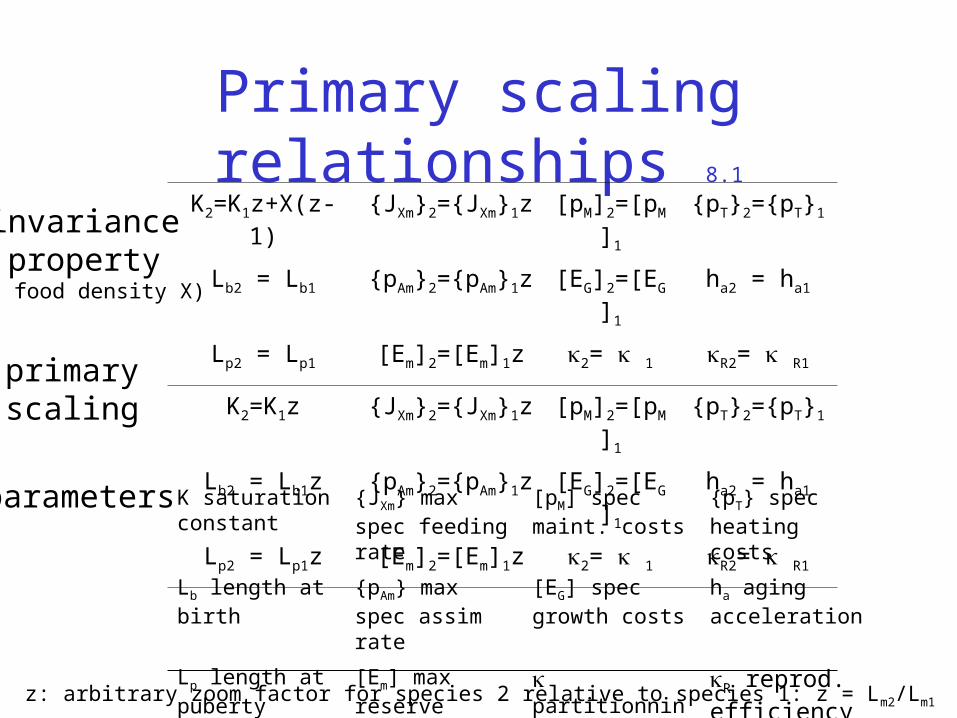
Invariance property 8.1
The parameters of two individuals can differ in a very special way such that both individuals behave identically at constant food density if they start with the same values for the state variables (reserve, structure, damage)
At varying food density, two individuals only behave identically if all their parameters are equal
Inter-species body size scaling 8.2
• parameter values tend to co-vary across species• parameters are either intensive or extensive• ratios of extensive parameters are intensive• maximum body length is allocation fraction to growth + maint. (intensive) volume-specific maintenance power (intensive) surface area-specific assimilation power (extensive)• conclusion : (so are all extensive parameters)• write physiological property as function of parameters (including maximum body weight)• evaluate this property as function of max body weight
]/[}{ MAm ppL
}{ Ap
][ Mp
mA Lp }{
Kooijman 1986 Energy budgets can explain body size scaling relationsJ. Theor. Biol. 121: 269-282