56

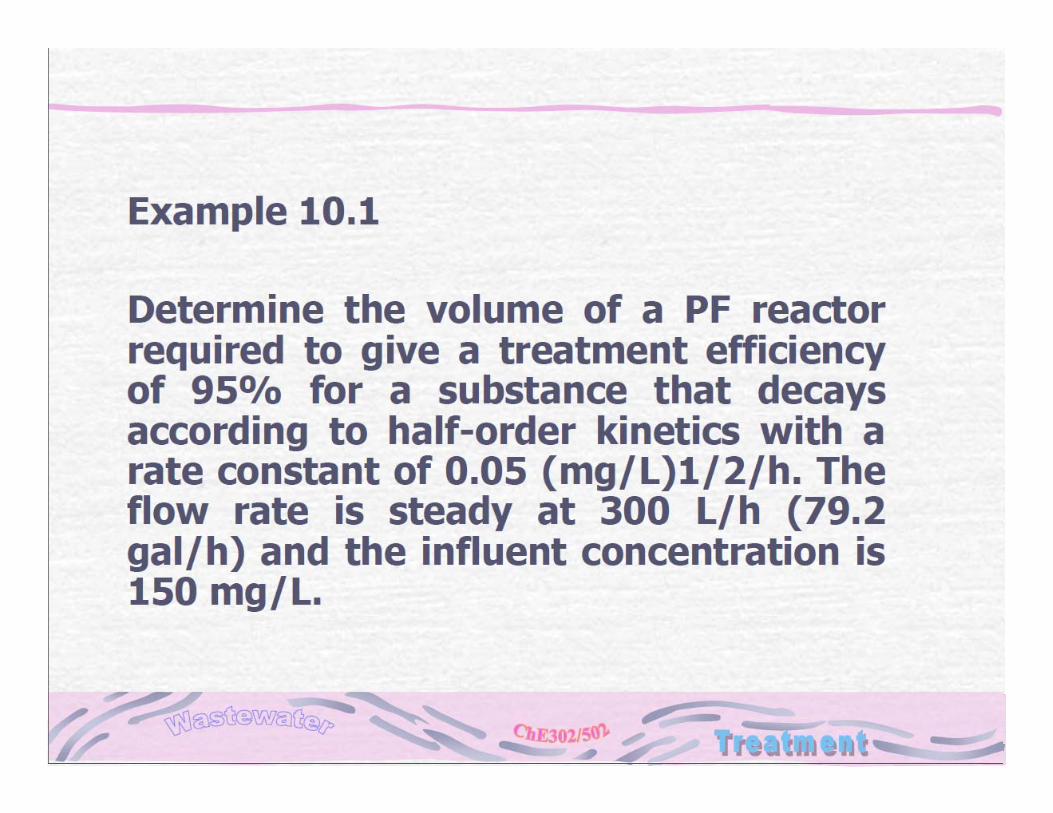
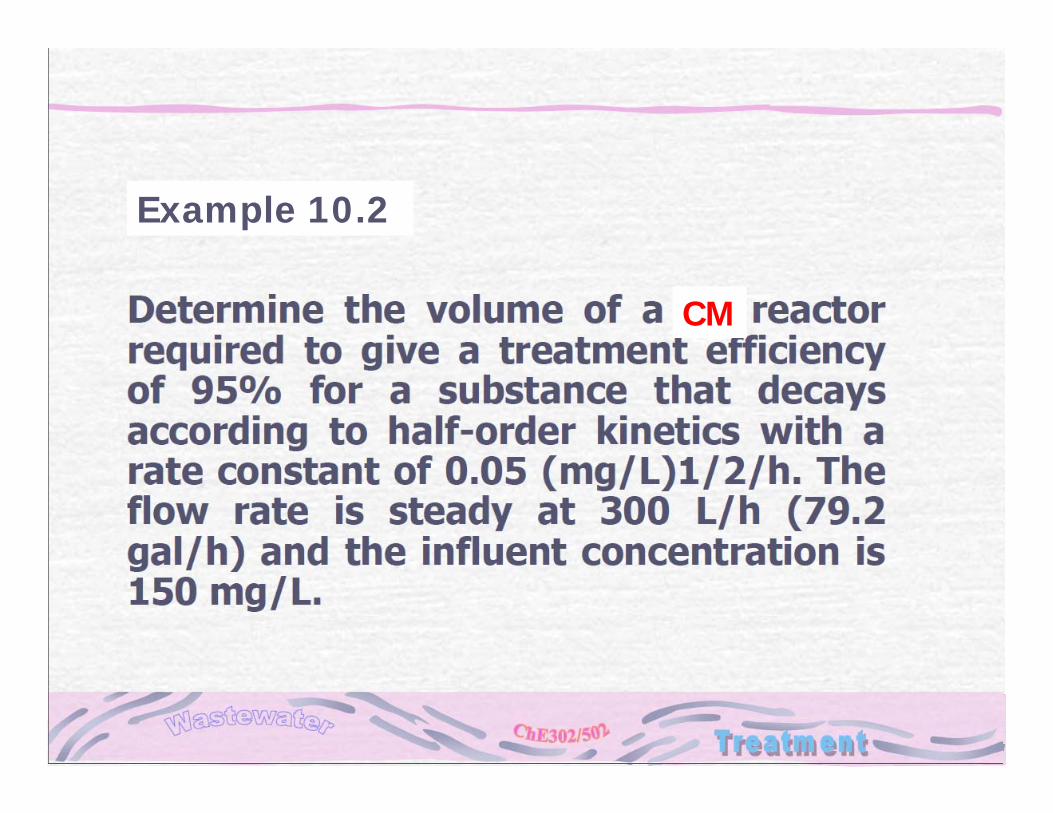
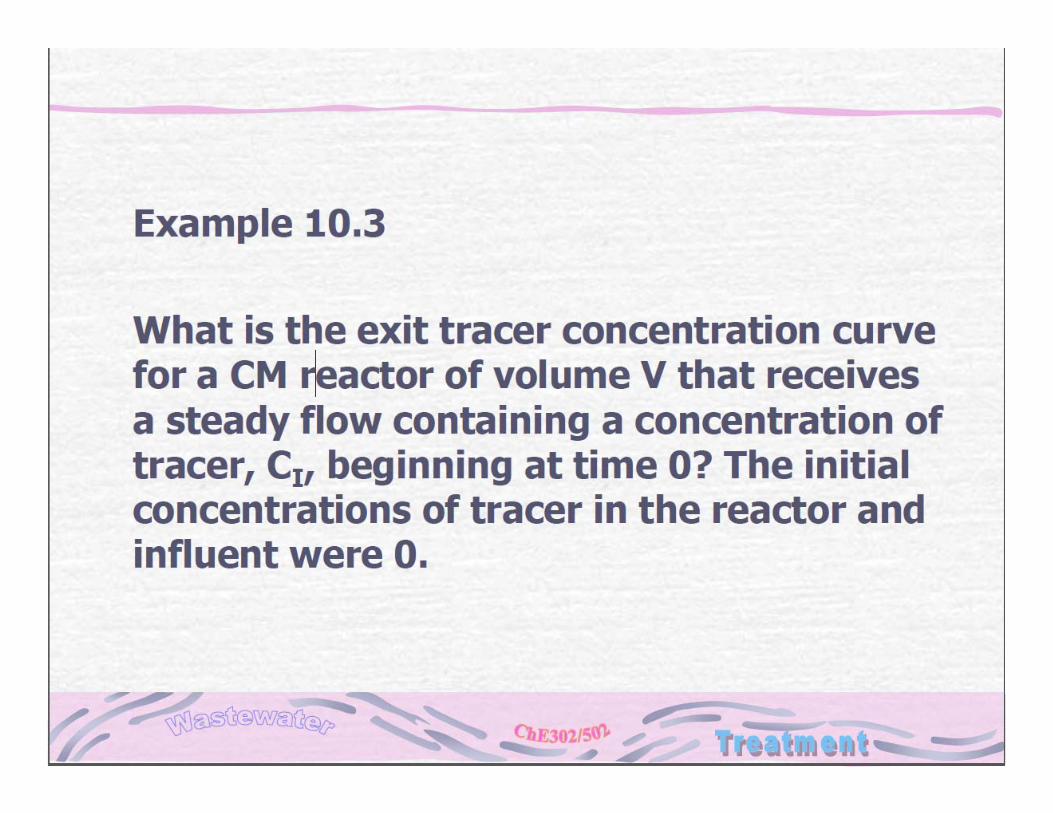
Example 10.2
CM
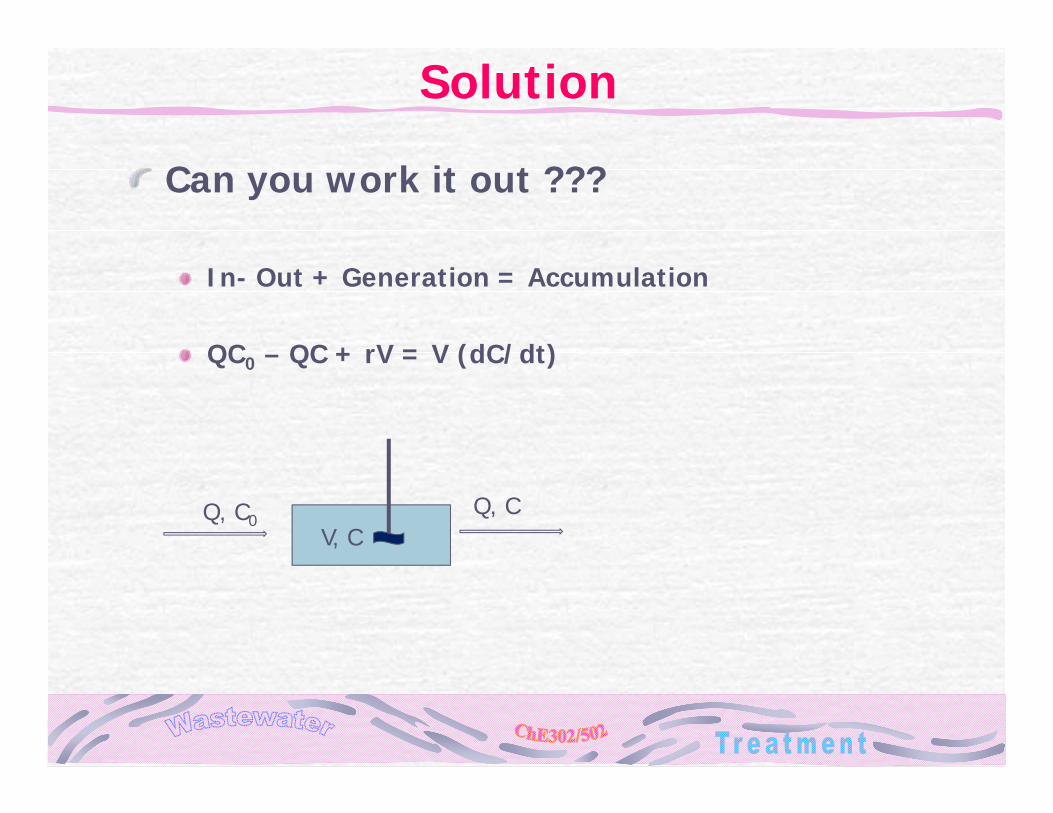
Solution
Can you work it out ???
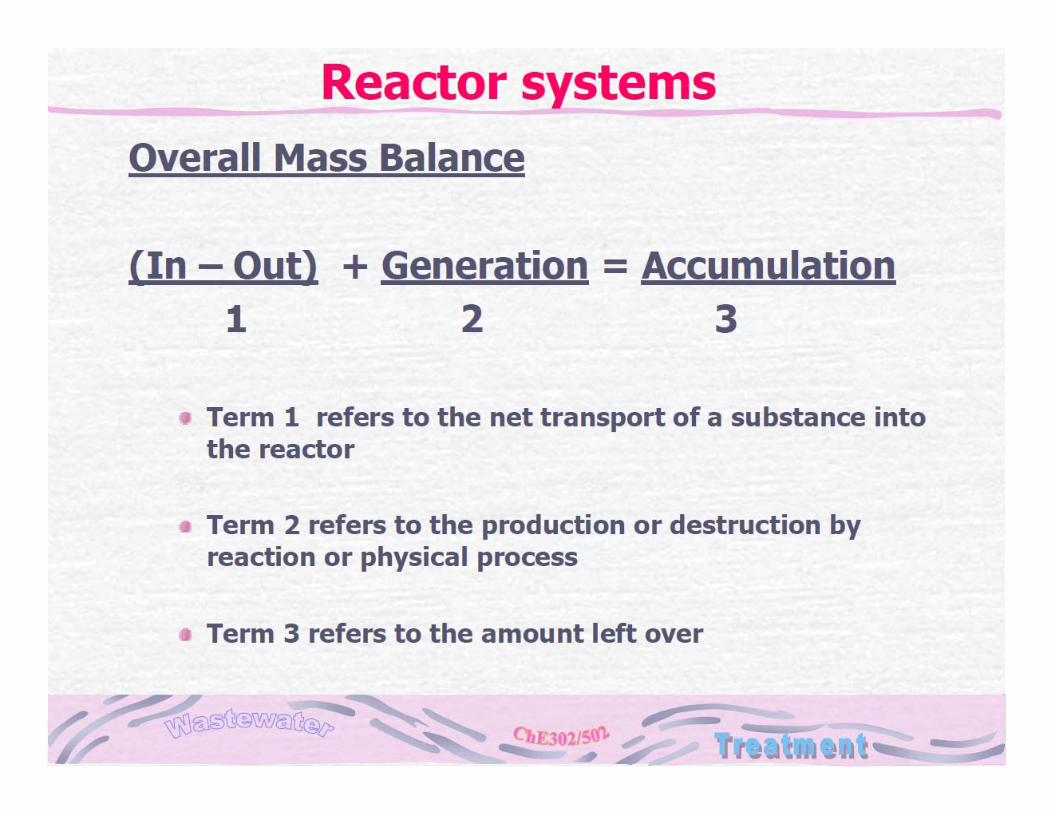
In- Out + Generation = Accumulation
QC0 – QC + rV = V (dC/dt)
V, CQ, C0
Q, C
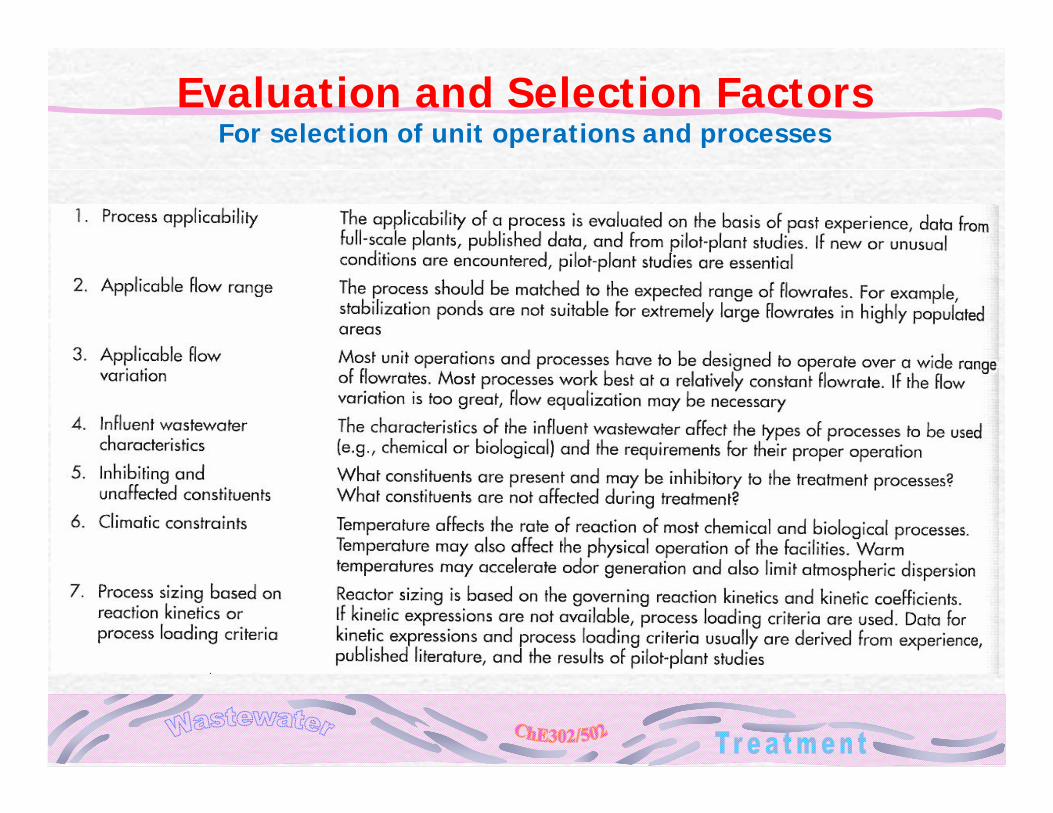
Evaluation and Selection FactorsFor selection of unit operations and processes
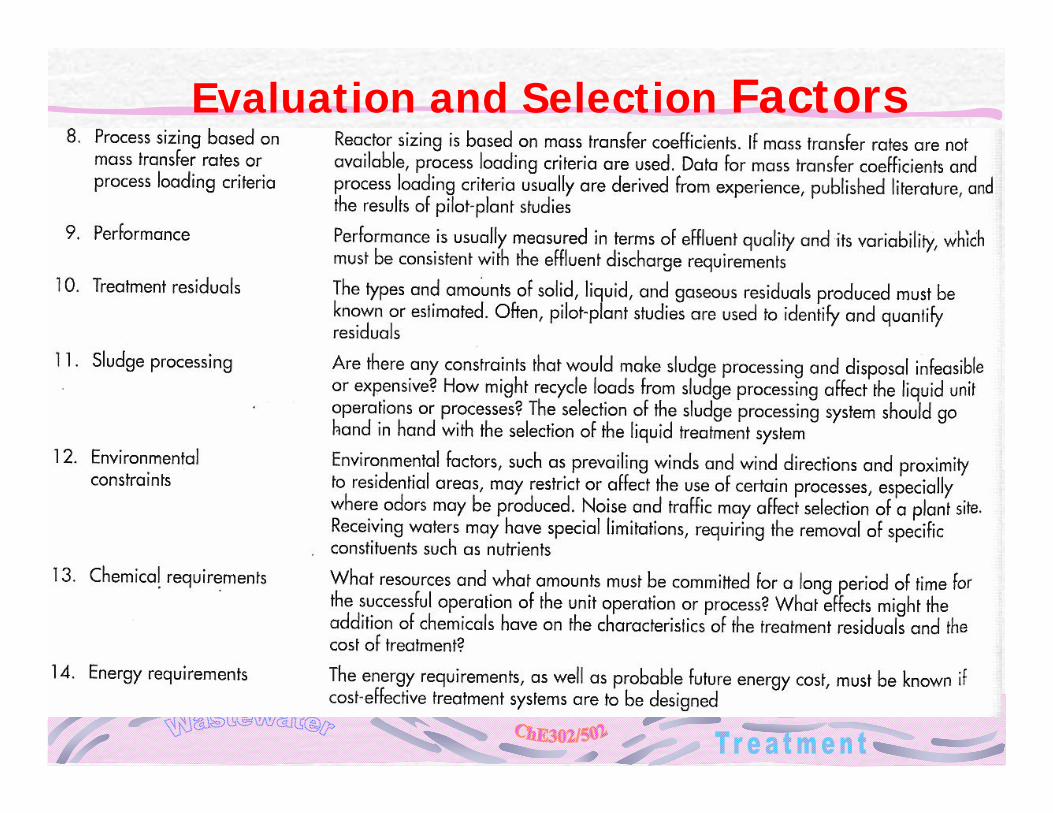
Evaluation and Selection FactorsFor selection of unit operations and processes
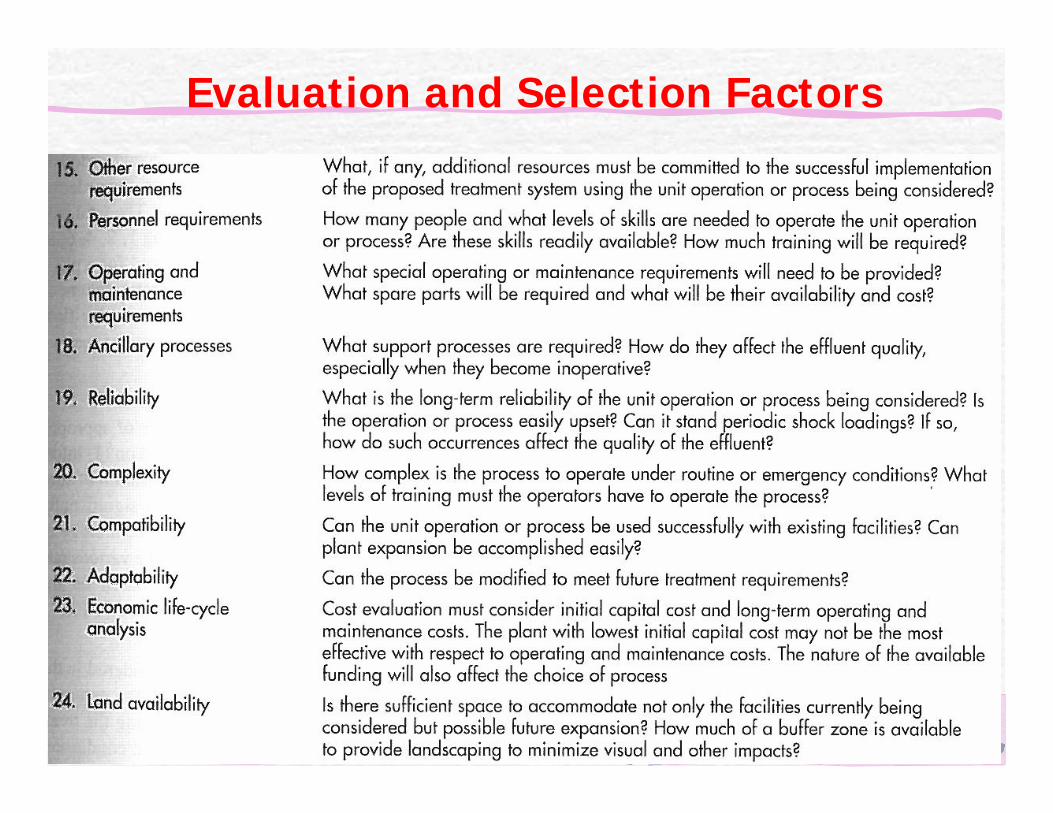
Evaluation and Selection Factors
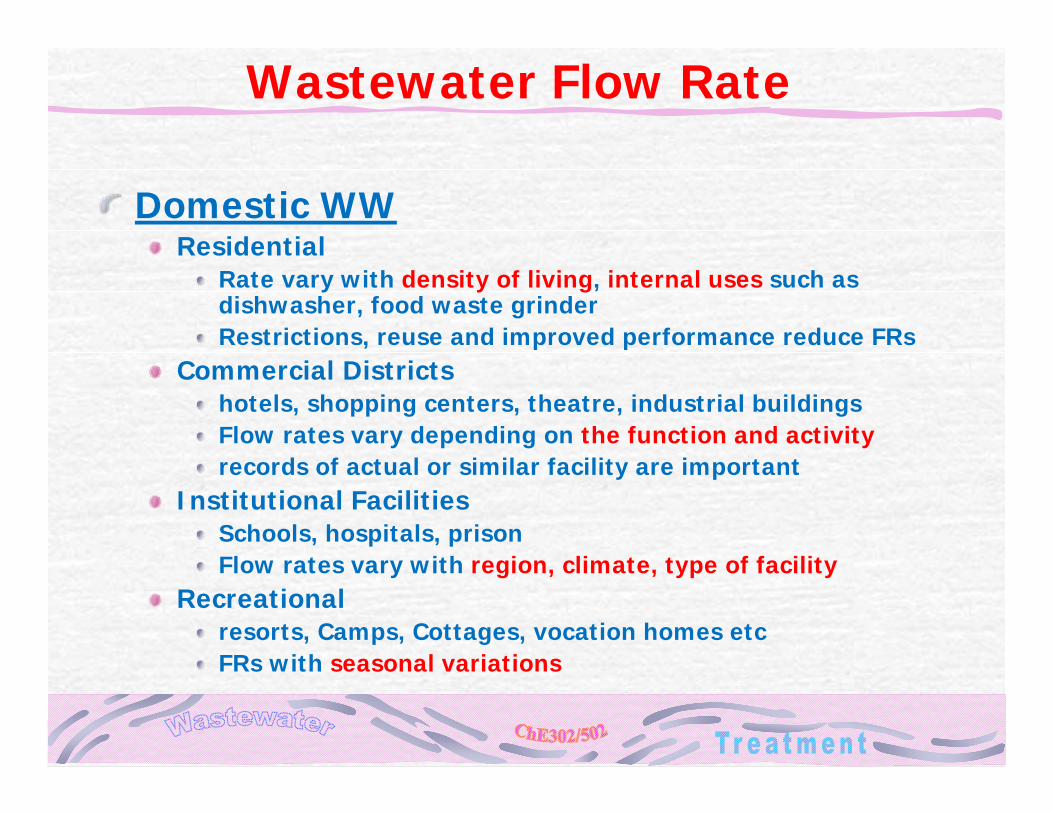
Wastewater Flow Rate
Domestic WWResidential
Rate vary with density of living, internal uses such as dishwasher, food waste grinderRestrictions, reuse and improved performance reduce FRs
Commercial Districtshotels, shopping centers, theatre, industrial buildingsFlow rates vary depending on the function and activityrecords of actual or similar facility are important
Institutional FacilitiesSchools, hospitals, prisonFlow rates vary with region, climate, type of facility
Recreationalresorts, Camps, Cottages, vocation homes etcFRs with seasonal variations
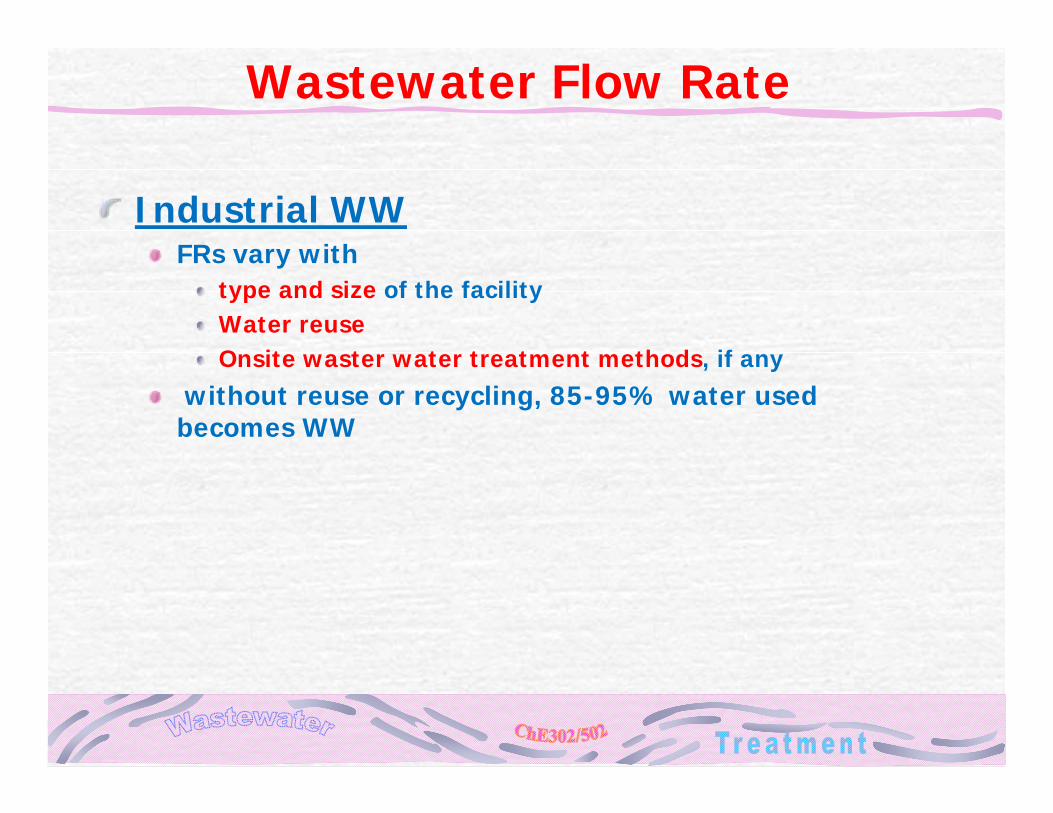
Wastewater Flow Rate
Industrial WWFRs vary with
type and size of the facilityWater reuseOnsite waster water treatment methods, if any
without reuse or recycling, 85-95% water used becomes WW
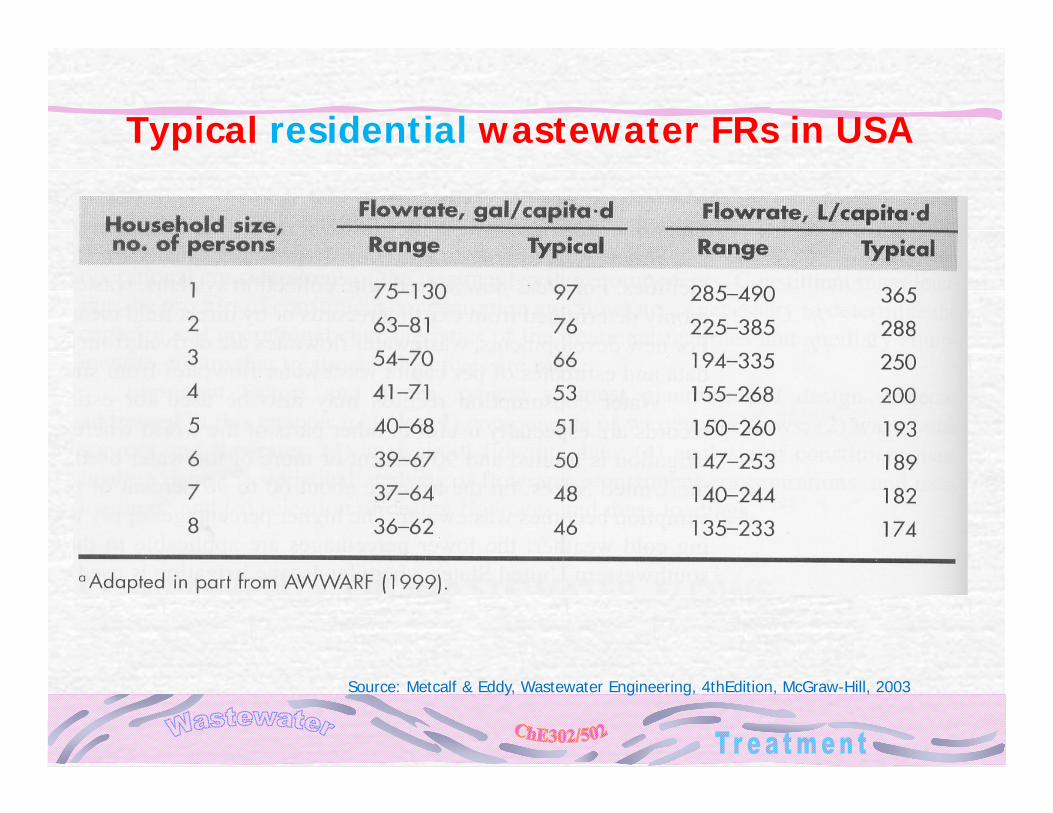
Typical residential wastewater FRs in USA
Source: Metcalf & Eddy, Wastewater Engineering, 4thEdition, McGraw-Hill, 2003
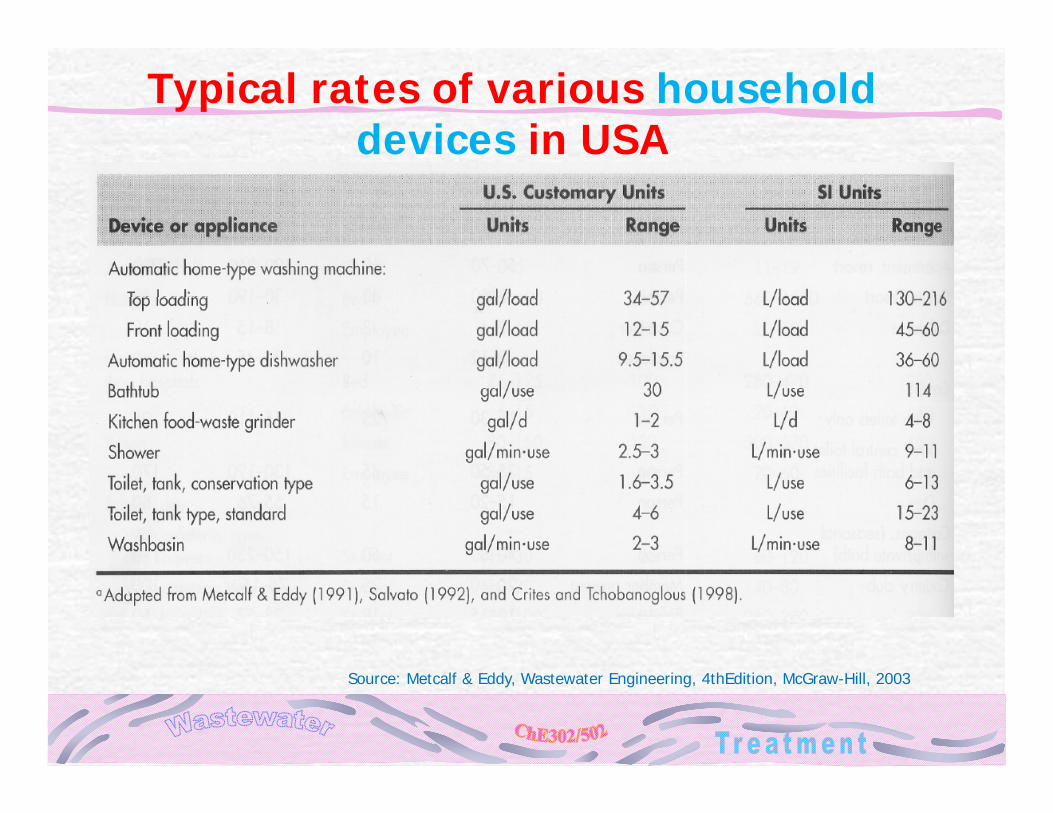
Typical rates of various household devices in USA
Source: Metcalf & Eddy, Wastewater Engineering, 4thEdition, McGraw-Hill, 2003
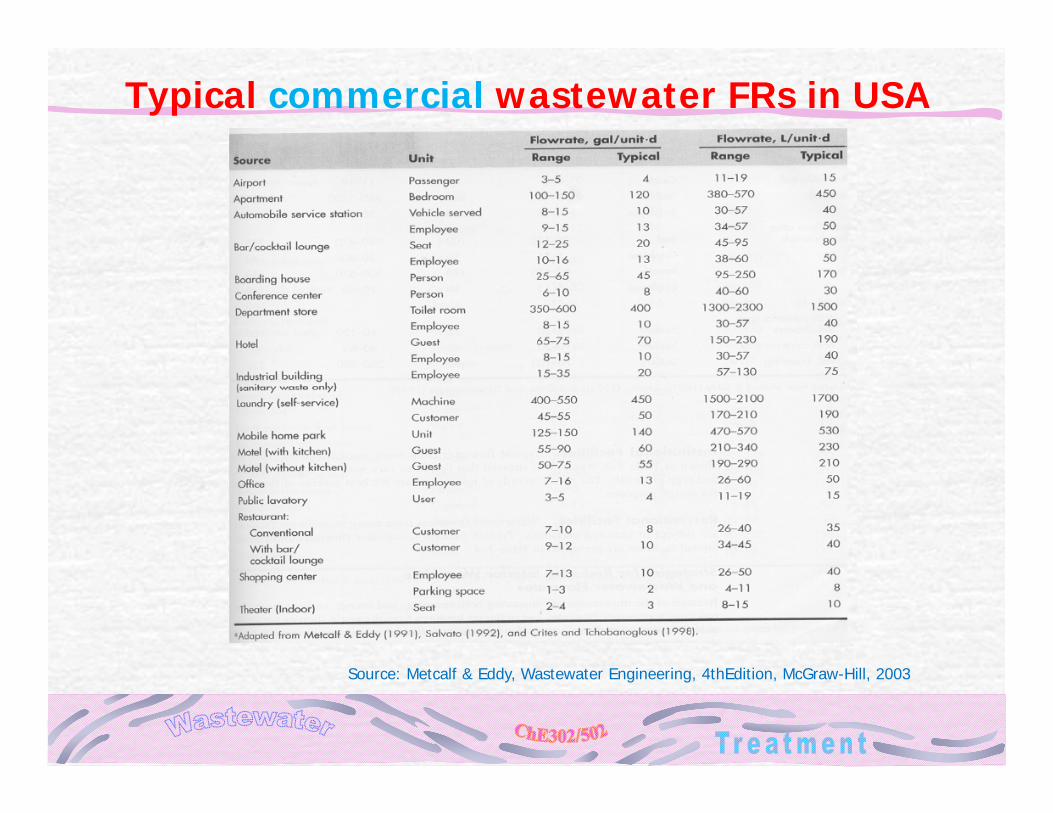
Typical commercial wastewater FRs in USA
Source: Metcalf & Eddy, Wastewater Engineering, 4thEdition, McGraw-Hill, 2003
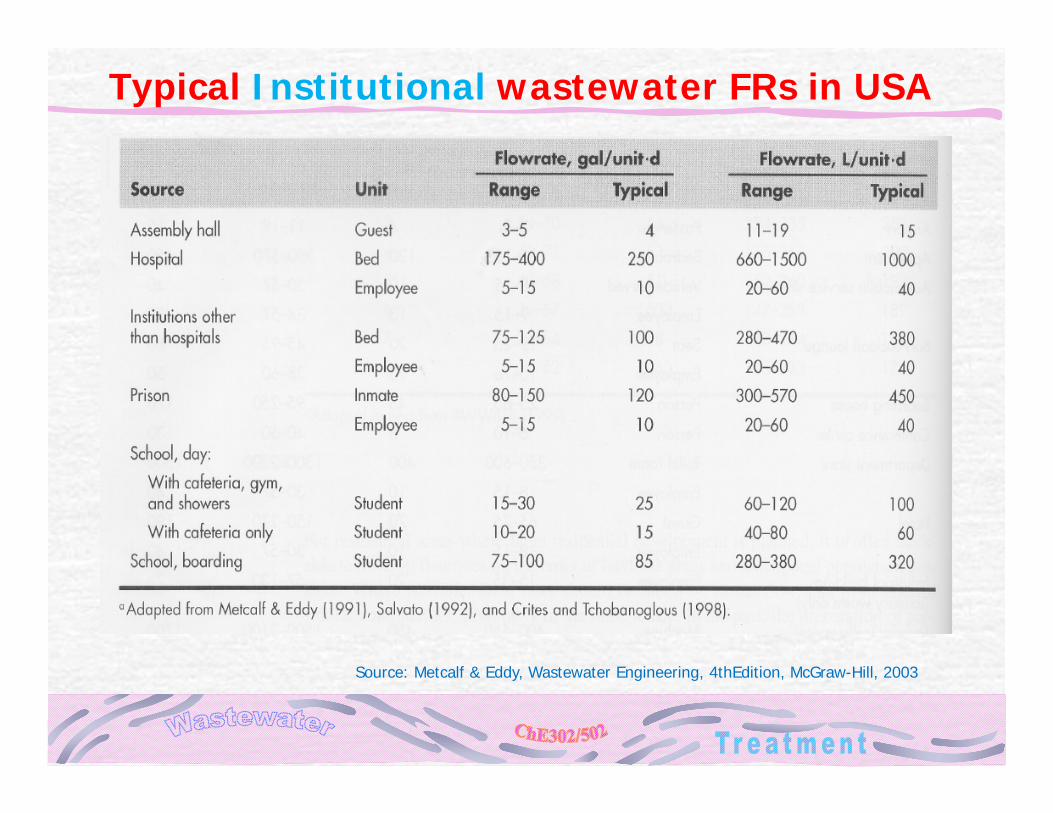
Typical Institutional wastewater FRs in USA
Source: Metcalf & Eddy, Wastewater Engineering, 4thEdition, McGraw-Hill, 2003
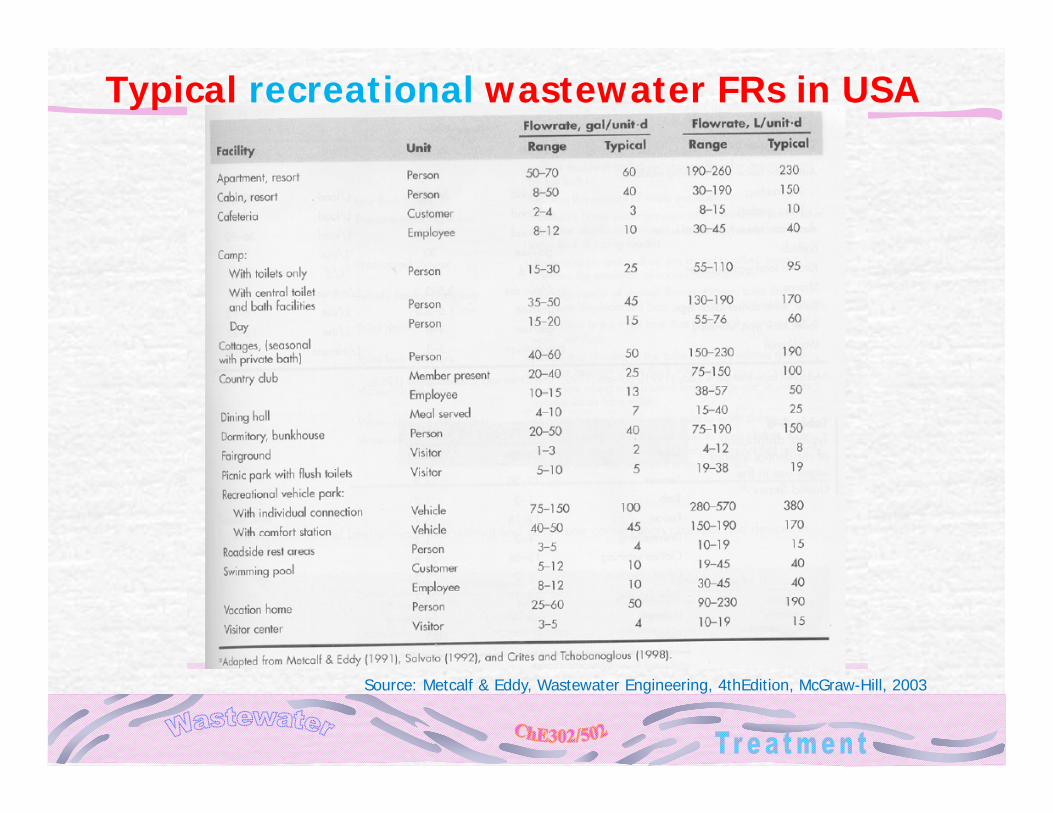
Typical recreational wastewater FRs in USA
Source: Metcalf & Eddy, Wastewater Engineering, 4thEdition, McGraw-Hill, 2003
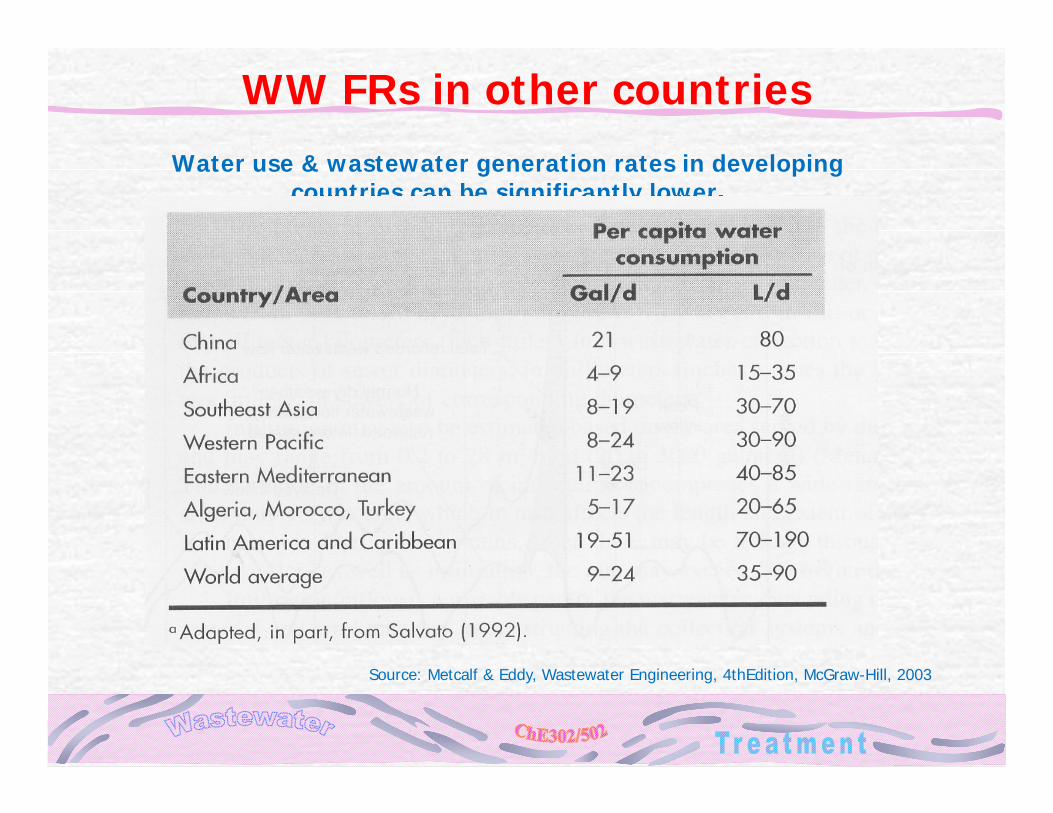
WW FRs in other countries
Source: Metcalf & Eddy, Wastewater Engineering, 4thEdition, McGraw-Hill, 2003
Water use & wastewater generation rates in developing countries can be significantly lower.
Analysis of Wastewater Flow Rate Data
The hydraulic design of both the collection and treatment facility is affected by the variations in WW FRs
If flow rate data is only available in the collection system, the flow rate may differ from the flow rate entering the treatment plant due to the dampening effect of the sewer system
Peak hourly flow rate may also be attenuated by the available storage capacity in the sewer system
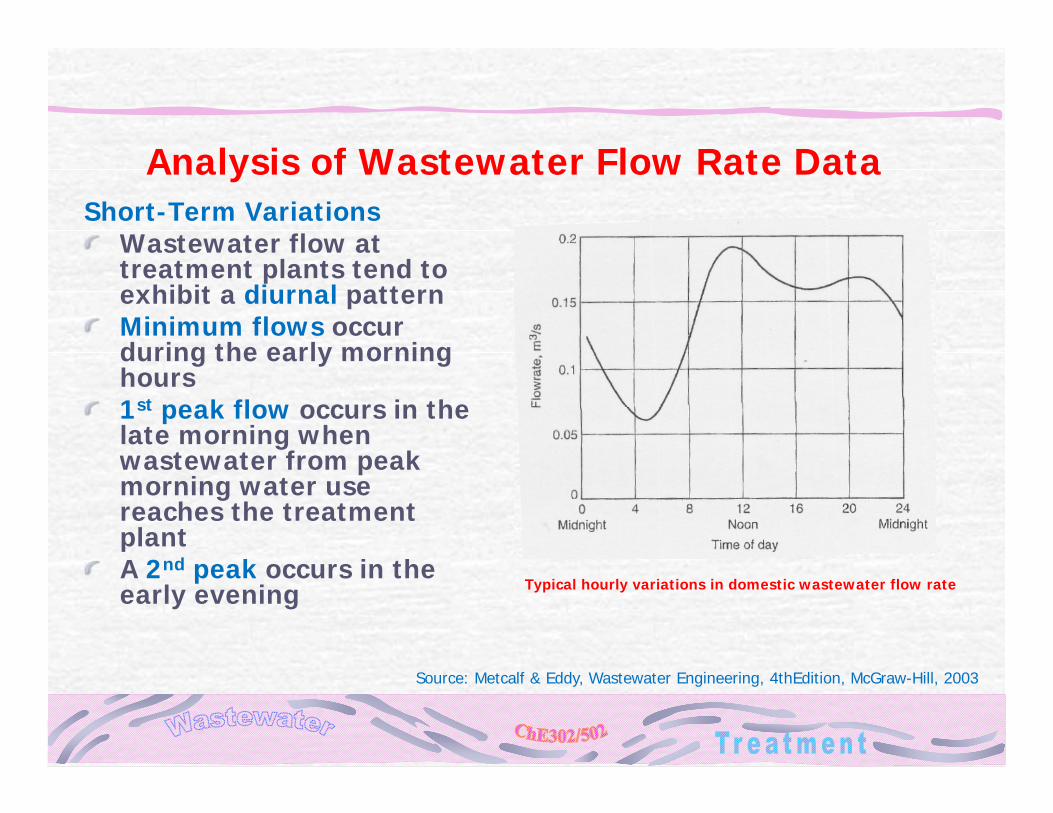
Analysis of Wastewater Flow Rate DataShort-Term Variations
Wastewater flow at treatment plants tend to exhibit a diurnal pattern Minimum flows occur during the early morning hours 1st peak flow occurs in the late morning when wastewater from peak morning water use reaches the treatment plant A 2nd peak occurs in the early evening Typical hourly variations in domestic wastewater flow rate
Source: Metcalf & Eddy, Wastewater Engineering, 4thEdition, McGraw-Hill, 2003
Other Variations
Seasonal VariationsCommonly observed
in resort areas, in small community with college campusesin communities with seasonal commercial and industrial activities
Industrial VariationsIndustrial wastewater discharges are difficult to predict, as it depends on the
internal processesthe clean up shutdown schedule
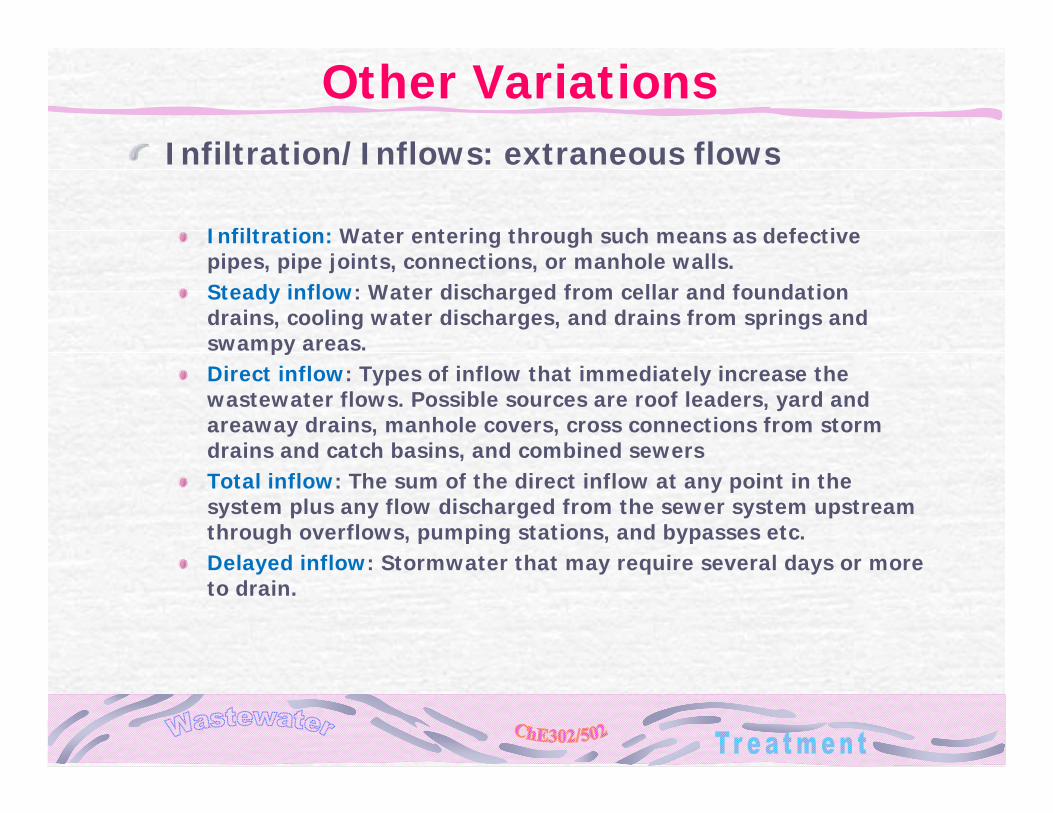
Other VariationsInfiltration/Inflows: extraneous flows
Infiltration: Water entering through such means as defective pipes, pipe joints, connections, or manhole walls.Steady inflow: Water discharged from cellar and foundation drains, cooling water discharges, and drains from springs and swampy areas.Direct inflow: Types of inflow that immediately increase the wastewater flows. Possible sources are roof leaders, yard and areaway drains, manhole covers, cross connections from storm drains and catch basins, and combined sewersTotal inflow: The sum of the direct inflow at any point in the system plus any flow discharged from the sewer system upstream through overflows, pumping stations, and bypasses etc.Delayed inflow: Stormwater that may require several days or more to drain.
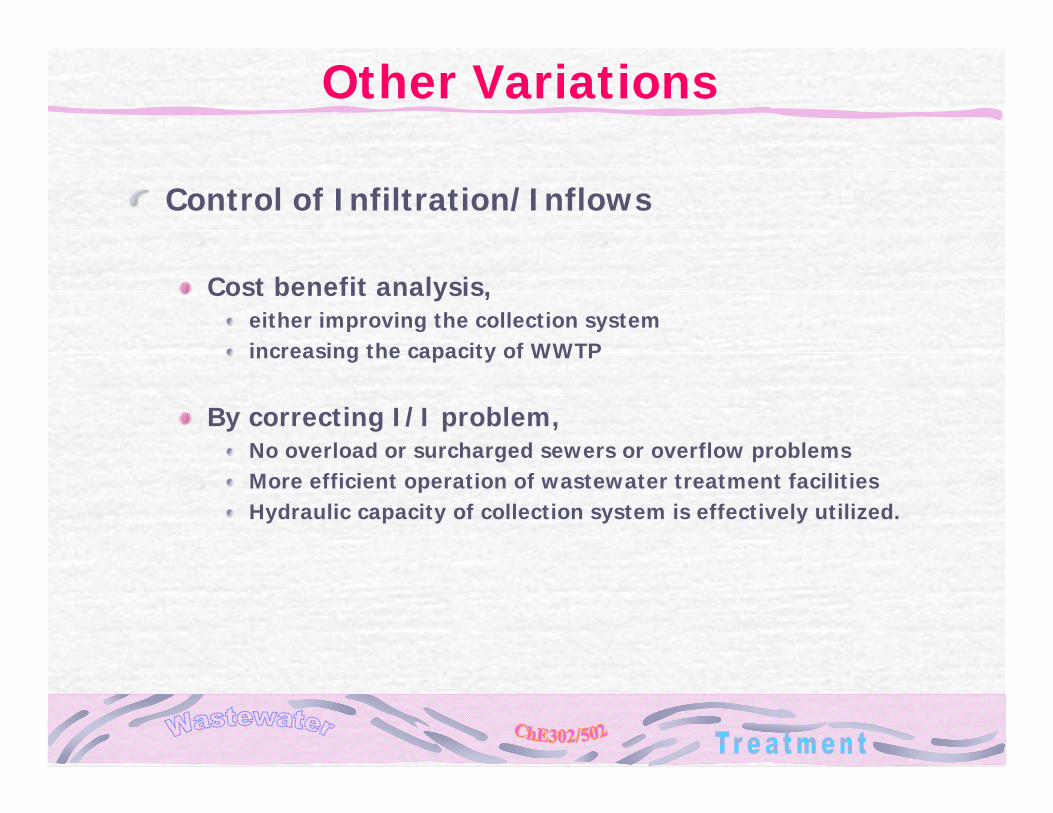
Other Variations
Control of Infiltration/Inflows
Cost benefit analysis, either improving the collection systemincreasing the capacity of WWTP
By correcting I/I problem,No overload or surcharged sewers or overflow problemsMore efficient operation of wastewater treatment facilitiesHydraulic capacity of collection system is effectively utilized.
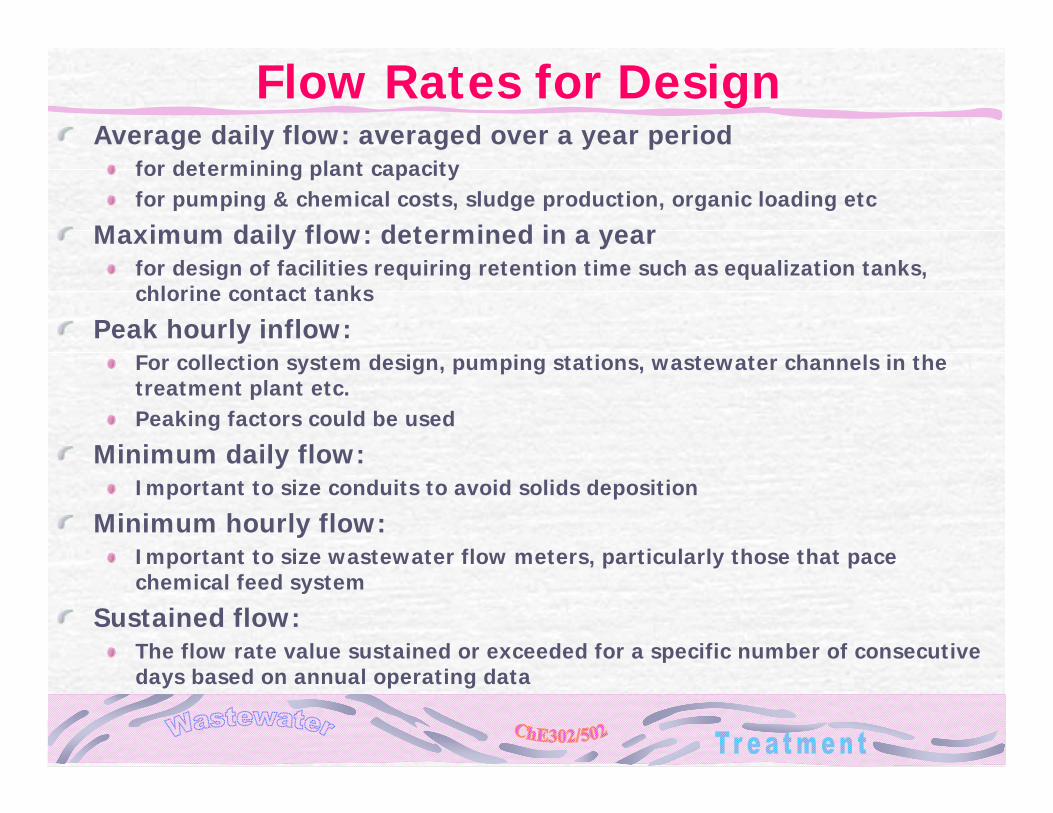
Flow Rates for DesignAverage daily flow: averaged over a year period
for determining plant capacityfor pumping & chemical costs, sludge production, organic loading etc
Maximum daily flow: determined in a yearfor design of facilities requiring retention time such as equalization tanks, chlorine contact tanks
Peak hourly inflow: For collection system design, pumping stations, wastewater channels in the treatment plant etc. Peaking factors could be used
Minimum daily flow: Important to size conduits to avoid solids deposition
Minimum hourly flow: Important to size wastewater flow meters, particularly those that pace chemical feed system
Sustained flow: The flow rate value sustained or exceeded for a specific number of consecutive days based on annual operating data
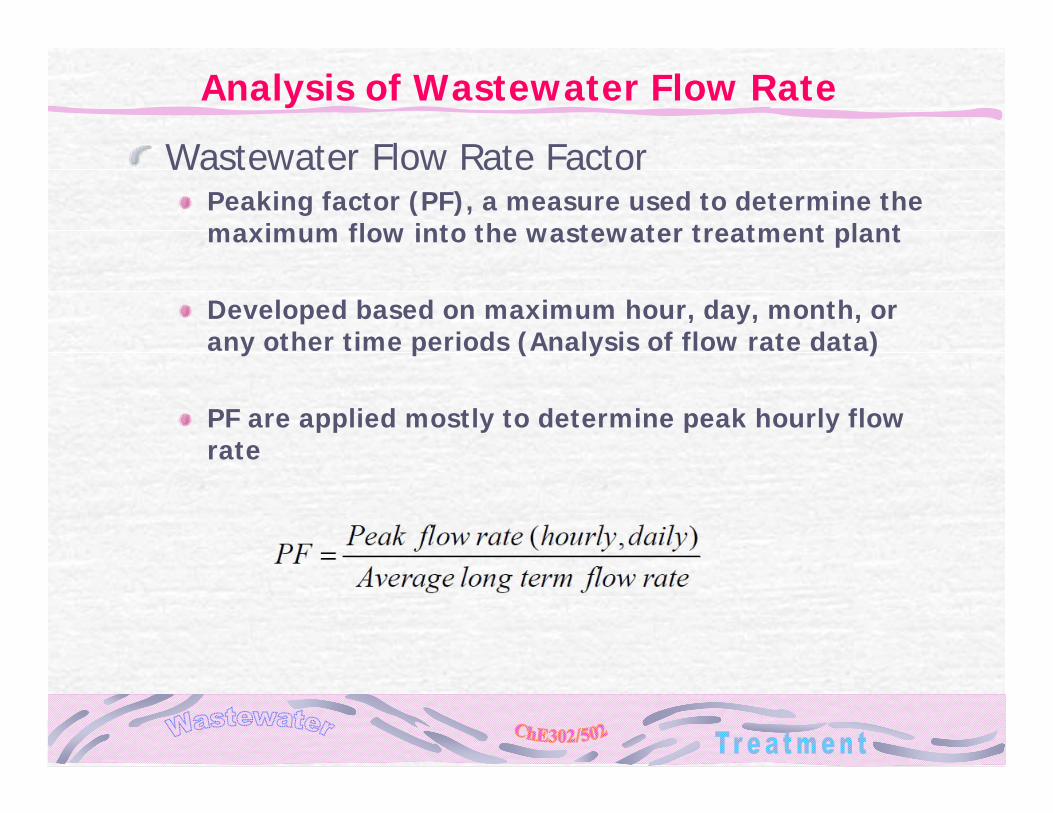
Analysis of Wastewater Flow Rate
Wastewater Flow Rate FactorPeaking factor (PF), a measure used to determine the maximum flow into the wastewater treatment plant
Developed based on maximum hour, day, month, or any other time periods (Analysis of flow rate data)
PF are applied mostly to determine peak hourly flow rate
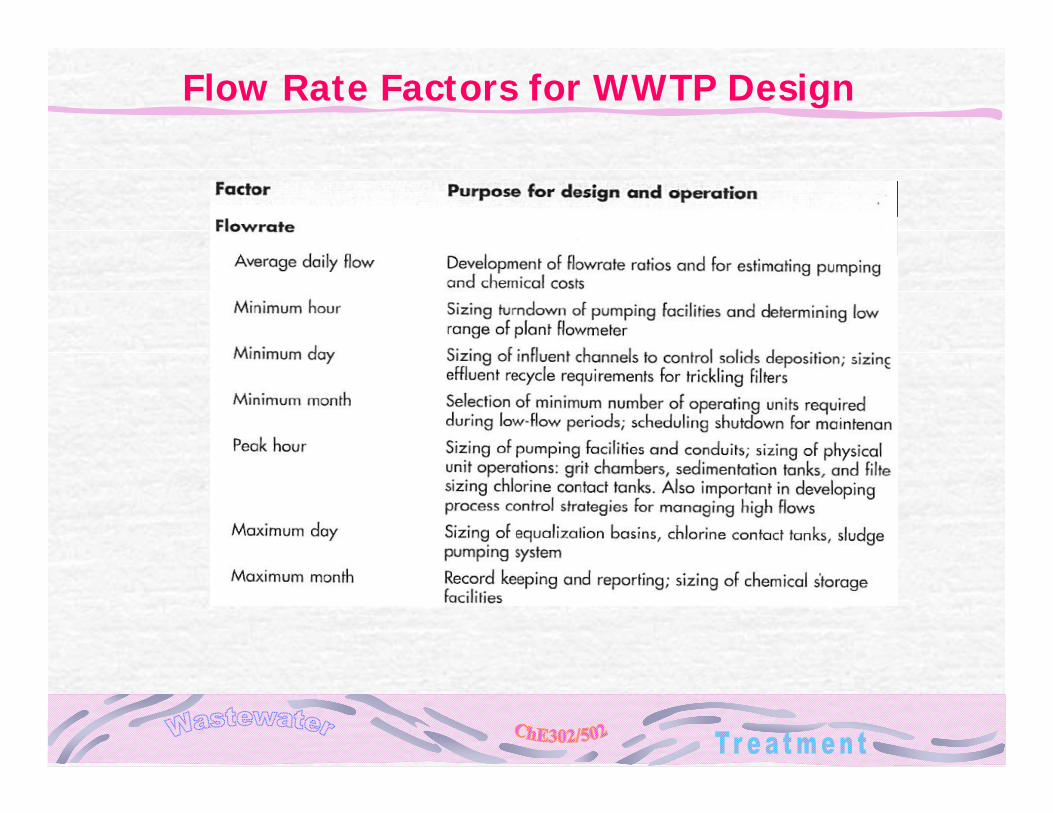
Flow Rate Factors for WWTP Design
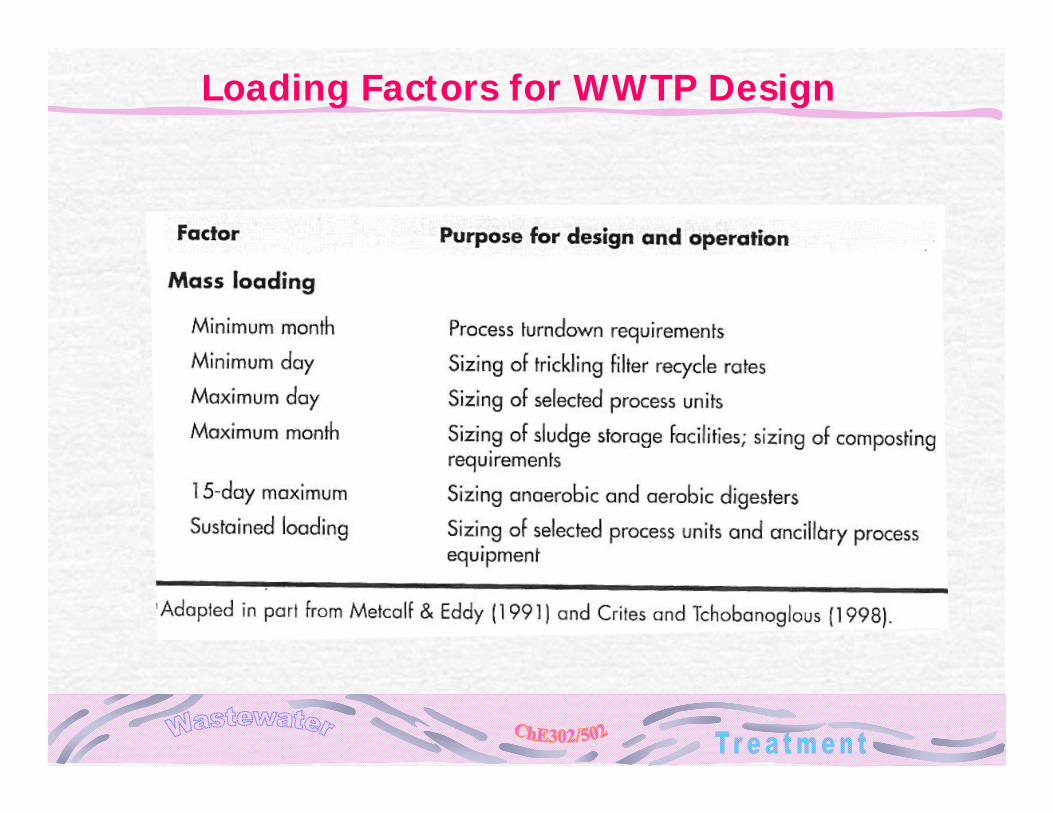
Loading Factors for WWTP Design
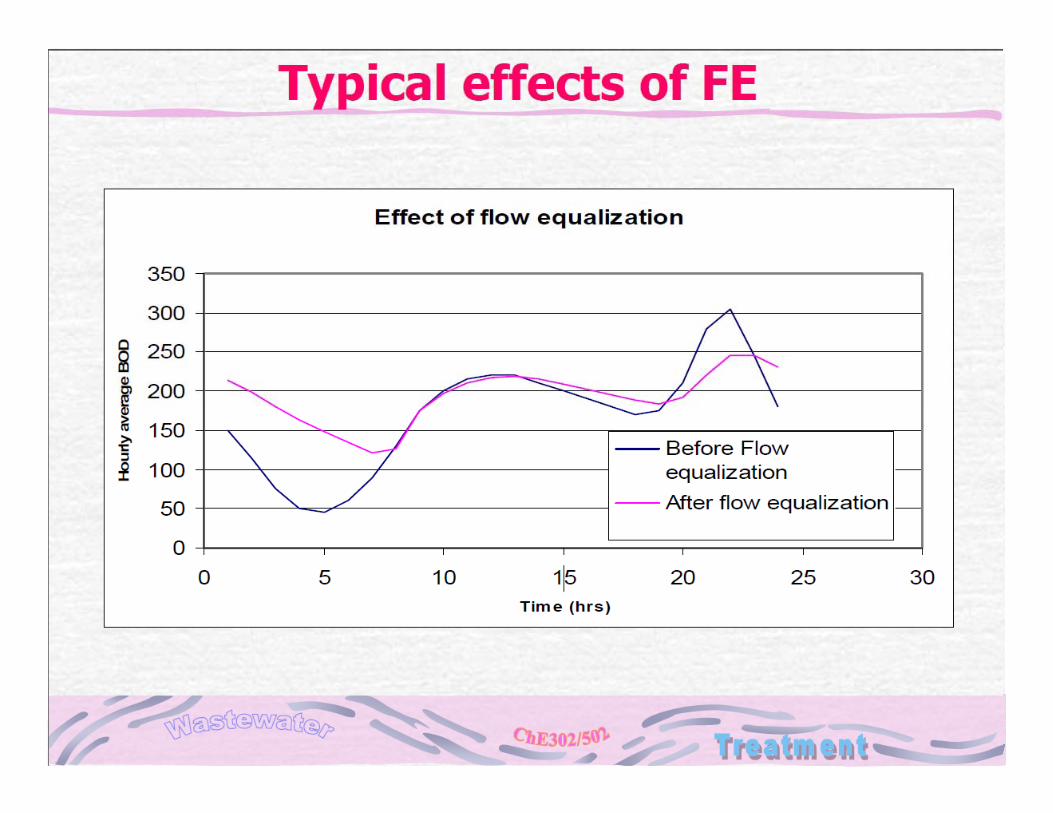
Flow EqualisationVariations in FR and concentration
An equalisation basin smoothens the variation in FR and quality, it equalise
Dry weather flowsWet weather flows from separate sanitary sewersCombined stormwater and sanitary wastewater flows
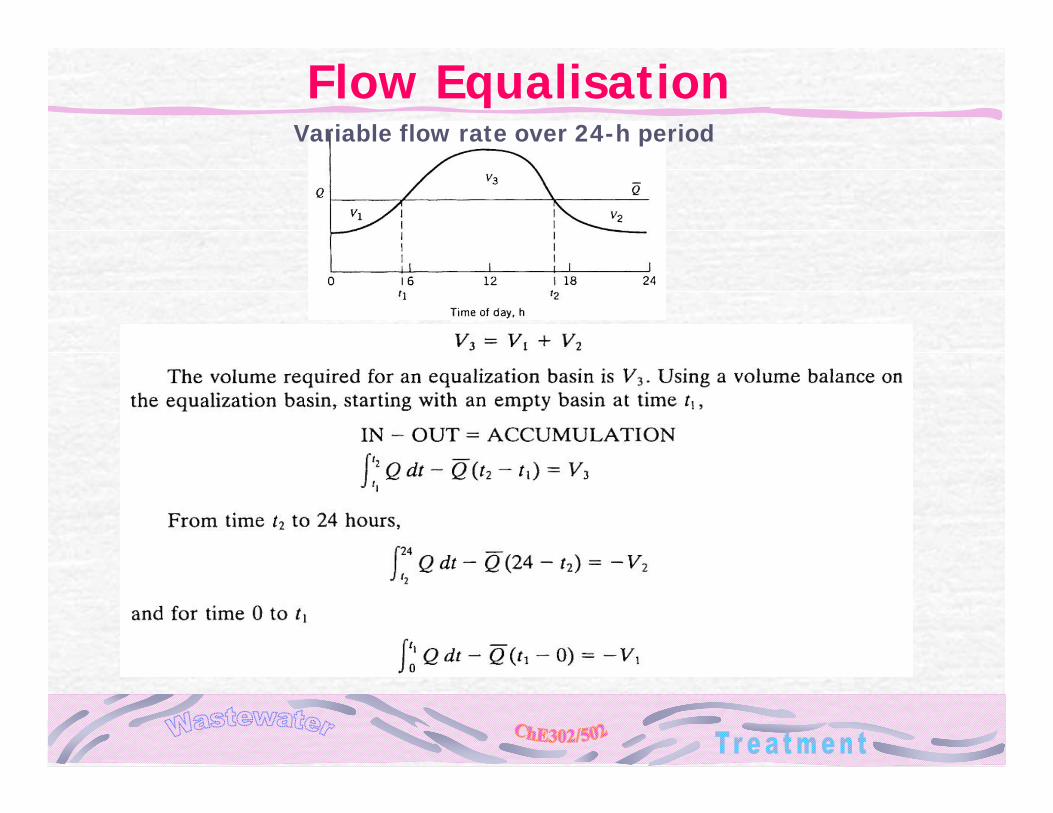
Flow EqualisationVariable flow rate over 24-h period
Flow Equalisation
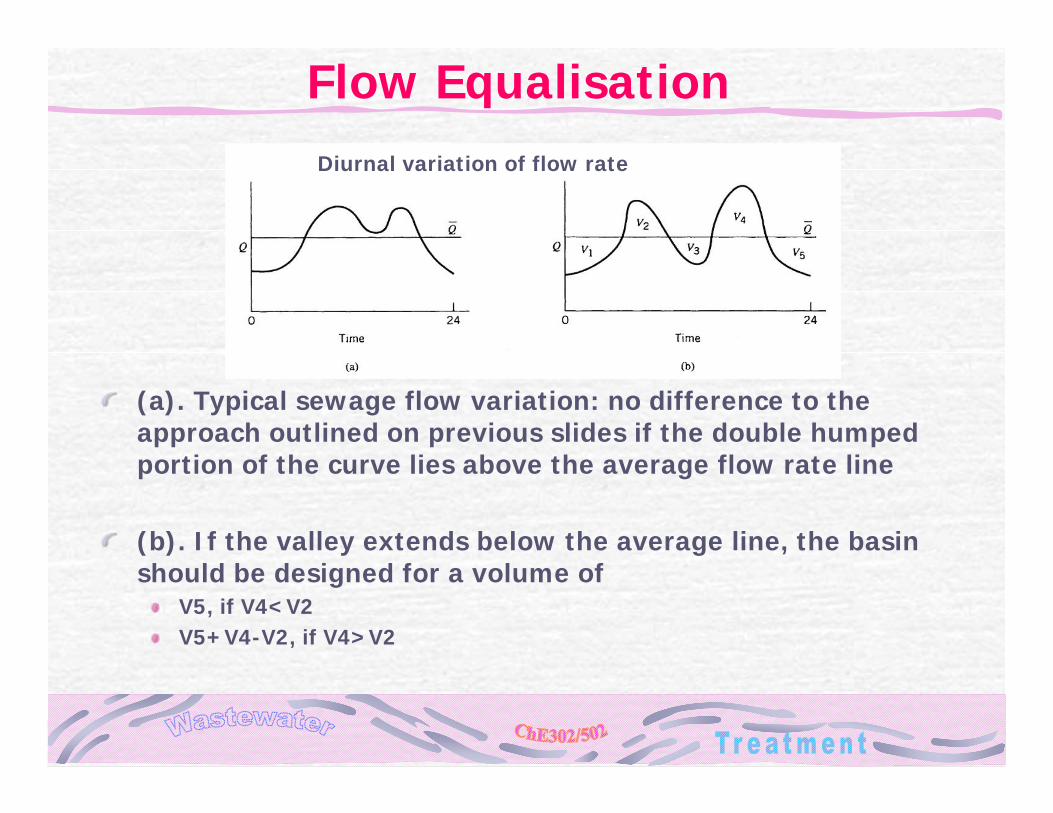
(a). Typical sewage flow variation: no difference to the approach outlined on previous slides if the double humped portion of the curve lies above the average flow rate line
(b). If the valley extends below the average line, the basin should be designed for a volume of
V5, if V4<V2V5+V4-V2, if V4>V2
Diurnal variation of flow rate
Location of Equalization BasinsOptimum location vary with
Characteristics of the collection systemWW to be handledLand requirements and availabilityType of treatment required
FEB adjacent to WWT plantIt is necessary to evaluate their integration into the flow process
In some cases, equalization after primary treatment and before biological treatment may be appropriate
FEBs after primary treatment: fewer problems with solid deposits and sum accumulationFEBs ahead of primary settling and biological systems
Sufficient mixing required to prevent solids deposition and concentration variations, and aeration to prevent odor problems
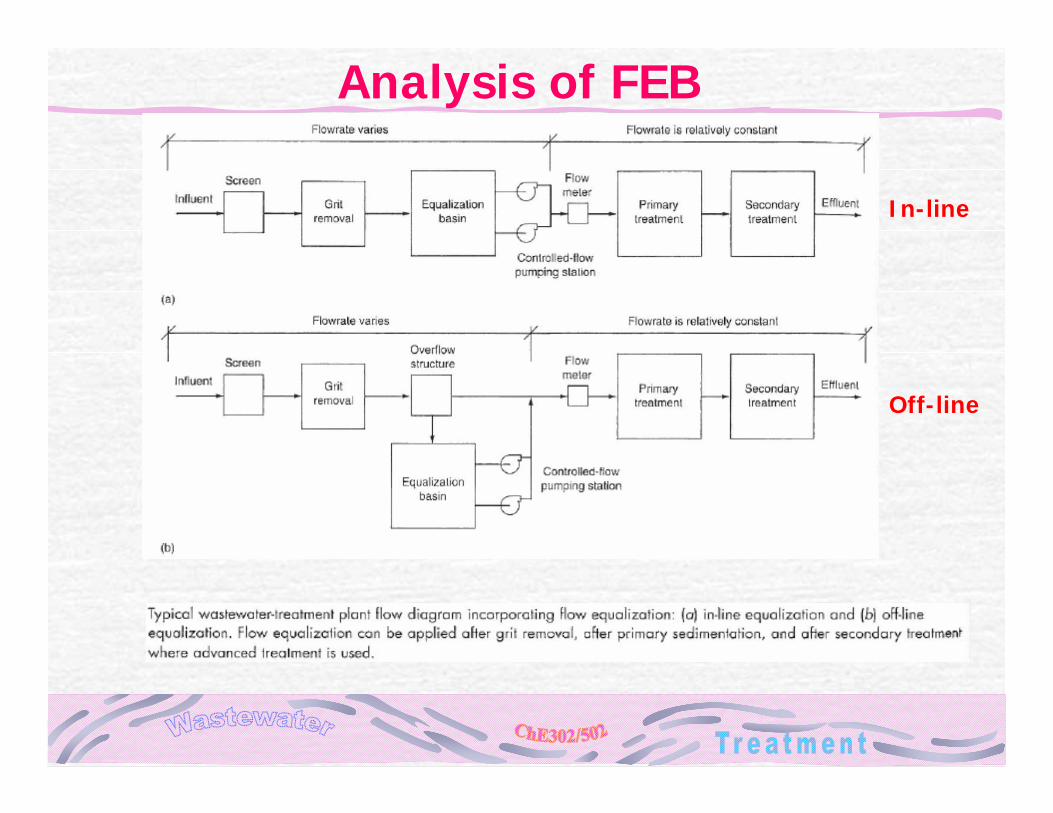
Analysis of FEB
In-line
Off-line
Volume Requirement for Flow Equalisation
In practice volume of equalization basin is about 10-20% greater than theoretical value
Draw down is not possible
Volume must be provided to accommodate the concentrated plant recycle streams that are expected, if such flows are returned to the equalization basin ( a practice that is not recommended due to possible odour problem)
Some contingency to accommodate unforseen changes in diurnal flow
Benefits of FEB
Biological treatment is enhanced, because shock loadings are eliminated, inhibitory substances are diluted, and pH can be stabilised
Most of the other process performance was found to greatly improved
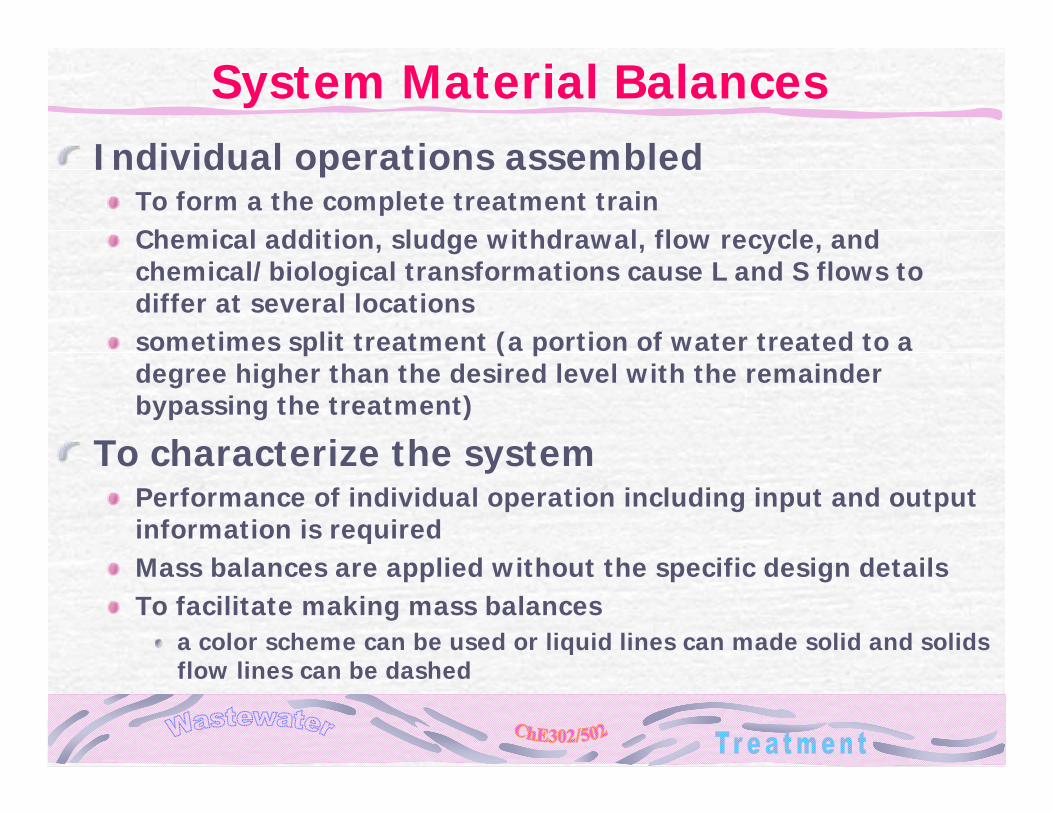
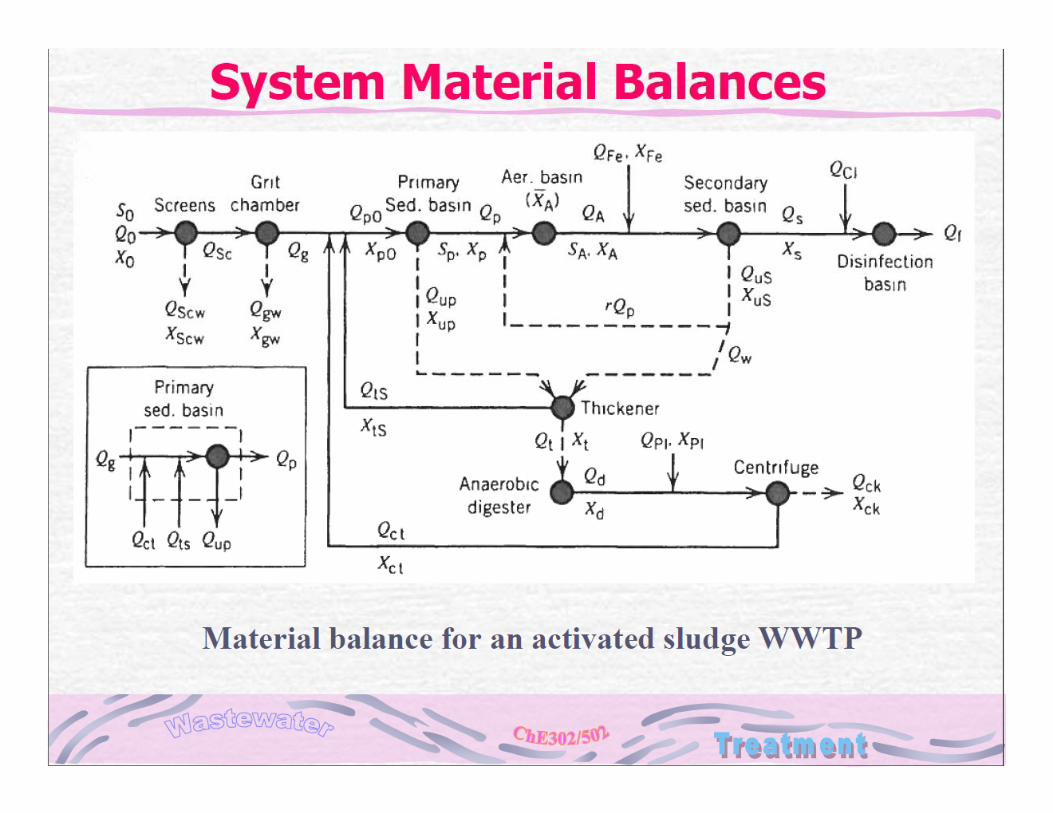
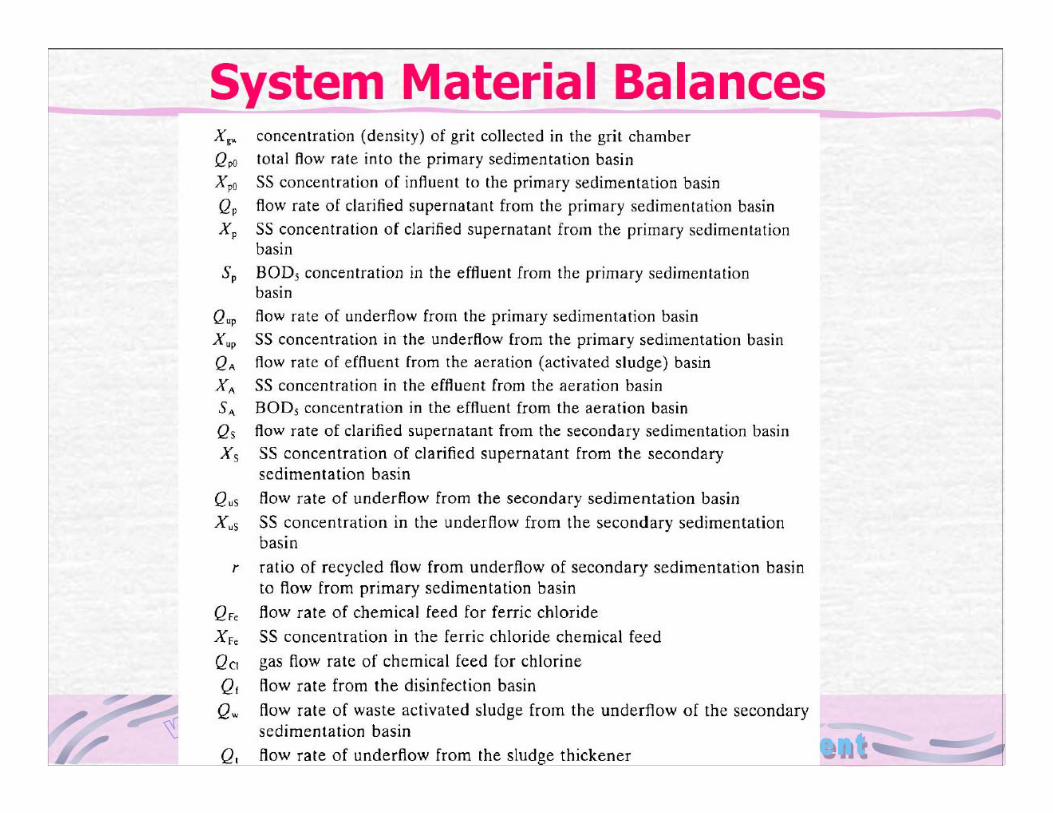
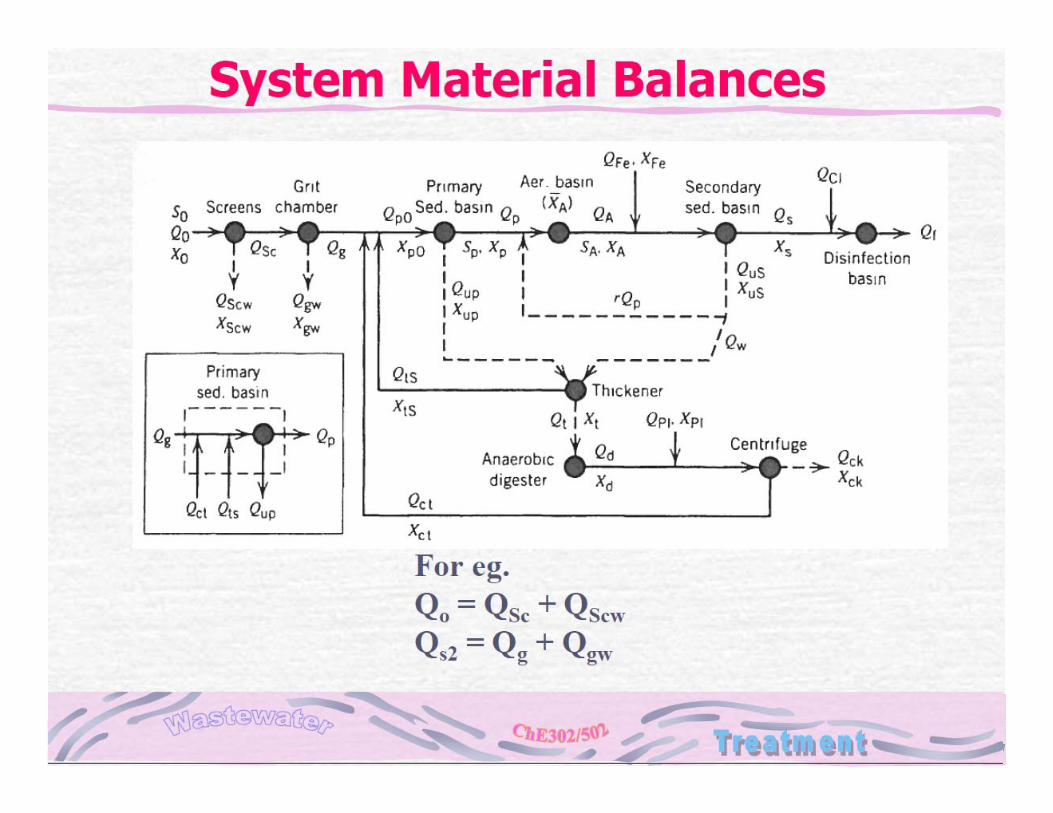
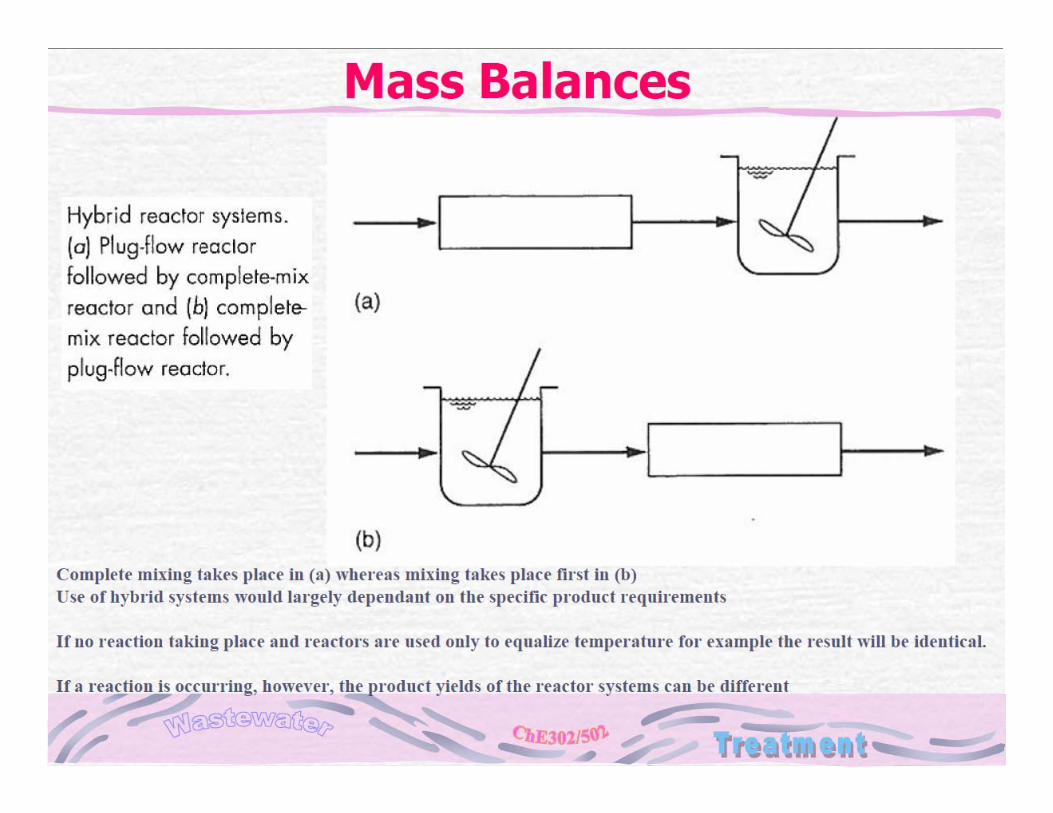
System Material Balances Individual operations assembled
To form a the complete treatment trainChemical addition, sludge withdrawal, flow recycle, and chemical/biological transformations cause L and S flows to differ at several locations sometimes split treatment (a portion of water treated to a degree higher than the desired level with the remainder bypassing the treatment)
To characterize the systemPerformance of individual operation including input and output information is requiredMass balances are applied without the specific design detailsTo facilitate making mass balances
a color scheme can be used or liquid lines can made solid and solids flow lines can be dashed