Mass spectrometry-based absolute quantification reveals rhythmic variation of mouse circadian clock proteins Ryohei Narumi a,1 , Yoshihiro Shimizu b,1,2 , Maki Ukai-Tadenuma a , Koji L. Ode c , Genki N. Kanda a,d , Yuta Shinohara a,d , Aya Sato b , Katsuhiko Matsumoto a , and Hiroki R. Ueda a,c,d,e,2 a Laboratory for Synthetic Biology, RIKEN Quantitative Biology Center, Suita, Osaka 565-0874, Japan; b Laboratory for Cell-Free Protein Synthesis, RIKEN Quantitative Biology Center, Suita, Osaka 565-0874, Japan; c Department of Systems Pharmacology, Graduate School of Medicine, The University of Tokyo, Bunkyo-ku, Tokyo 113-0033, Japan; d Graduate School of Frontier Biosciences, Osaka University, Suita, Osaka 565-0871, Japan; and e Core Research for Evolutional Science and Technology, Japan Science and Technology Agency, Kawaguchi, Saitama 332-0012, Japan Edited by Joseph S. Takahashi, Howard Hughes Medical Institute, University of Texas Southwestern Medical Center, Dallas, TX, and approved April 26, 2016 (received for review March 7, 2016) Absolute values of protein expression levels in cells are crucial information for understanding cellular biological systems. Precise quantification of proteins can be achieved by liquid chromatogra- phy (LC)–mass spectrometry (MS) analysis of enzymatic digests of proteins in the presence of isotope-labeled internal standards. Thus, development of a simple and easy way for the preparation of internal standards is advantageous for the analyses of multiple target proteins, which will allow systems-level studies. Here we describe a method, termed MS-based Quantification By isotope- labeled Cell-free products (MS-QBiC), which provides the simple and high-throughput preparation of internal standards by using a reconstituted cell-free protein synthesis system, and thereby facil- itates both multiplexed and sensitive quantification of absolute amounts of target proteins. This method was applied to a sys- tems-level dynamic analysis of mammalian circadian clock proteins, which consist of transcription factors and protein kinases that gov- ern central and peripheral circadian clocks in mammals. Sixteen pro- teins from 20 selected circadian clock proteins were successfully quantified from mouse liver over a 24-h time series, and 14 proteins had circadian variations. Quantified values were applied to detect internal body time using a previously developed molecular timeta- ble method. The analyses showed that single time-point data from wild-type mice can predict the endogenous state of the circadian clock, whereas data from clock mutant mice are not applicable be- cause of the disappearance of circadian variation. absolute quantification | mass spectrometry | cell-free protein synthesis system | mammalian circadian clock protein | targeted proteomics Q uantitative information on protein expression levels is im- portant to define the dynamic state of cells. Accurate mea- surements of absolute protein abundance in cells can be performed by emerging quantitative proteomics approaches such as selected reaction monitoring (SRM) or high-resolution mass spectrometry (MS) in combination with isotope dilution strategies (1). The methods require a known concentration of internal standards, typ- ically prepared as the tryptic digests of target proteins, which are labeled with isotopically heavy atoms. The standard peptides are combined with samples containing the same peptides, and the mixtures are analyzed by MS. Quantities of peptides, which repre- sent the target proteins, can be calculated by comparing ion in- tensities for isotopically light and heavy peptides. The preparation of isotope-labeled peptides plays a major role in these approaches. The most common way to prepare such peptides is by absolute quantification, which uses chemical syn- thesis of peptides containing isotopically labeled amino acids (1, 2). It provides not only normal proteotypic peptides, but also modified peptides that mimic posttranslational modification. However, the method has several limitations originating from the use of the chemical synthesis. It requires individual peptide synthesis using large amounts of isotopically labeled amino acids as substrates. Difficulties of synthesis vary depending on the peptide sequence. Due to these features, it is difficult to reduce the cost per peptide, which leads to difficulties in preparing large numbers of peptides for the quantification. Multiple peptide production enables not only the multiplexed protein quantification but also highly sensitive detection and quantification of the proteins of interest by selecting effective internal standards with good signal/noise ratio from can- didate peptides (3). Several methods using a cellular gene-expression system have been developed in recent years for multiple peptide production. Multiple peptides can be obtained by the proteolysis of recom- binantly expressed full-length proteins of interest (4, 5) or artificial proteins that compose a set of proteotypic peptides concatenated with each other (6, 7). These peptides are metabolically labeled with stable isotopes through Escherichia coli or other cellular gene-expression systems, allowing them to function as internal standards. The methods have advantages in that multiple peptides are produced from a single construct, which can be applied to both multiplexed and sensitive quantification. A cell-free protein synthesis system is a useful tool for the expression of such proteins (3, 5, 6, 8). The cost for expensive stable isotope-labeled amino acids can be reduced because the volume for reaction mixtures is much lower than for culturing media. Protein expression and purification occurs in a high-throughput manner Significance A method for absolute quantification of proteins for targeted proteomics is developed. It introduces a simple and high- throughput synthesis of internal standards for peptide quan- tification and thereby facilitates both multiplexed and sensitive absolute quantification of proteins. Application of this method to the systems-level dynamic analysis of core circadian clock proteins and detection of internal body time using quantified values of circadian clock proteins is shown. The results dem- onstrate the validity of the developed method in which quantified values from wild-type mice can predict the endog- enous state of the circadian clock. Author contributions: R.N., Y. Shimizu, K.L.O., and H.R.U. designed research; R.N., Y. Shimizu, M.U.-T., K.L.O., G.N.K., Y. Shinohara, A.S., and K.M. performed research; R.N. and Y. Shimizu contributed new reagents/analytic tools; R.N., Y. Shimizu, and M.U.-T. analyzed data; and R.N., Y. Shimizu, and H.R.U. wrote the paper. The authors declare no conflict of interest. This article is a PNAS Direct Submission. 1 R.N. and Y. Shimizu contributed equally to this work. 2 To whom correspondence may be addressed. Email: [email protected] or uedah-tky@ umin.ac.jp. This article contains supporting information online at www.pnas.org/lookup/suppl/doi:10. 1073/pnas.1603799113/-/DCSupplemental. www.pnas.org/cgi/doi/10.1073/pnas.1603799113 PNAS | Published online May 31, 2016 | E3461–E3467 SYSTEMS BIOLOGY PNAS PLUS
Transcript
Mass spectrometry-based absolute quantificationreveals rhythmic variation of mouse circadianclock proteinsRyohei Narumia,1, Yoshihiro Shimizub,1,2, Maki Ukai-Tadenumaa, Koji L. Odec, Genki N. Kandaa,d, Yuta Shinoharaa,d,Aya Satob, Katsuhiko Matsumotoa, and Hiroki R. Uedaa,c,d,e,2
aLaboratory for Synthetic Biology, RIKEN Quantitative Biology Center, Suita, Osaka 565-0874, Japan; bLaboratory for Cell-Free Protein Synthesis, RIKENQuantitative Biology Center, Suita, Osaka 565-0874, Japan; cDepartment of Systems Pharmacology, Graduate School of Medicine, The University of Tokyo,Bunkyo-ku, Tokyo 113-0033, Japan; dGraduate School of Frontier Biosciences, Osaka University, Suita, Osaka 565-0871, Japan; and eCore Research forEvolutional Science and Technology, Japan Science and Technology Agency, Kawaguchi, Saitama 332-0012, Japan
Edited by Joseph S. Takahashi, Howard Hughes Medical Institute, University of Texas Southwestern Medical Center, Dallas, TX, and approved April 26, 2016(received for review March 7, 2016)
Absolute values of protein expression levels in cells are crucialinformation for understanding cellular biological systems. Precisequantification of proteins can be achieved by liquid chromatogra-phy (LC)–mass spectrometry (MS) analysis of enzymatic digests ofproteins in the presence of isotope-labeled internal standards.Thus, development of a simple and easy way for the preparationof internal standards is advantageous for the analyses of multipletarget proteins, which will allow systems-level studies. Here wedescribe a method, termed MS-based Quantification By isotope-labeled Cell-free products (MS-QBiC), which provides the simpleand high-throughput preparation of internal standards by usinga reconstituted cell-free protein synthesis system, and thereby facil-itates both multiplexed and sensitive quantification of absoluteamounts of target proteins. This method was applied to a sys-tems-level dynamic analysis of mammalian circadian clock proteins,which consist of transcription factors and protein kinases that gov-ern central and peripheral circadian clocks in mammals. Sixteen pro-teins from 20 selected circadian clock proteins were successfullyquantified from mouse liver over a 24-h time series, and 14 proteinshad circadian variations. Quantified values were applied to detectinternal body time using a previously developed molecular timeta-ble method. The analyses showed that single time-point data fromwild-type mice can predict the endogenous state of the circadianclock, whereas data from clock mutant mice are not applicable be-cause of the disappearance of circadian variation.
absolute quantification | mass spectrometry | cell-free protein synthesissystem | mammalian circadian clock protein | targeted proteomics
Quantitative information on protein expression levels is im-portant to define the dynamic state of cells. Accurate mea-
surements of absolute protein abundance in cells can be performedby emerging quantitative proteomics approaches such as selectedreaction monitoring (SRM) or high-resolution mass spectrometry(MS) in combination with isotope dilution strategies (1). Themethods require a known concentration of internal standards, typ-ically prepared as the tryptic digests of target proteins, which arelabeled with isotopically heavy atoms. The standard peptides arecombined with samples containing the same peptides, and themixtures are analyzed by MS. Quantities of peptides, which repre-sent the target proteins, can be calculated by comparing ion in-tensities for isotopically light and heavy peptides.The preparation of isotope-labeled peptides plays a major role
in these approaches. The most common way to prepare suchpeptides is by absolute quantification, which uses chemical syn-thesis of peptides containing isotopically labeled amino acids (1, 2).It provides not only normal proteotypic peptides, but also modifiedpeptides that mimic posttranslational modification. However, themethod has several limitations originating from the use of thechemical synthesis. It requires individual peptide synthesis using
large amounts of isotopically labeled amino acids as substrates.Difficulties of synthesis vary depending on the peptide sequence.Due to these features, it is difficult to reduce the cost per peptide,which leads to difficulties in preparing large numbers of peptidesfor the quantification. Multiple peptide production enables notonly the multiplexed protein quantification but also highly sensitivedetection and quantification of the proteins of interest by selectingeffective internal standards with good signal/noise ratio from can-didate peptides (3).Several methods using a cellular gene-expression system have
been developed in recent years for multiple peptide production.Multiple peptides can be obtained by the proteolysis of recom-binantly expressed full-length proteins of interest (4, 5) or artificialproteins that compose a set of proteotypic peptides concatenatedwith each other (6, 7). These peptides are metabolically labeledwith stable isotopes through Escherichia coli or other cellulargene-expression systems, allowing them to function as internalstandards. The methods have advantages in that multiple peptidesare produced from a single construct, which can be applied to bothmultiplexed and sensitive quantification.A cell-free protein synthesis system is a useful tool for the
expression of such proteins (3, 5, 6, 8). The cost for expensive stableisotope-labeled amino acids can be reduced because the volume forreaction mixtures is much lower than for culturing media. Proteinexpression and purification occurs in a high-throughput manner
Significance
A method for absolute quantification of proteins for targetedproteomics is developed. It introduces a simple and high-throughput synthesis of internal standards for peptide quan-tification and thereby facilitates both multiplexed and sensitiveabsolute quantification of proteins. Application of this methodto the systems-level dynamic analysis of core circadian clockproteins and detection of internal body time using quantifiedvalues of circadian clock proteins is shown. The results dem-onstrate the validity of the developed method in whichquantified values from wild-type mice can predict the endog-enous state of the circadian clock.
Author contributions: R.N., Y. Shimizu, K.L.O., and H.R.U. designed research; R.N., Y. Shimizu,M.U.-T., K.L.O., G.N.K., Y. Shinohara, A.S., and K.M. performed research; R.N. and Y. Shimizucontributed new reagents/analytic tools; R.N., Y. Shimizu, and M.U.-T. analyzed data;and R.N., Y. Shimizu, and H.R.U. wrote the paper.
The authors declare no conflict of interest.
This article is a PNAS Direct Submission.1R.N. and Y. Shimizu contributed equally to this work.2To whom correspondence may be addressed. Email: [email protected] or [email protected].
This article contains supporting information online at www.pnas.org/lookup/suppl/doi:10.1073/pnas.1603799113/-/DCSupplemental.
www.pnas.org/cgi/doi/10.1073/pnas.1603799113 PNAS | Published online May 31, 2016 | E3461–E3467
because there is no need for culturing, harvesting, and disruptingcells. Notably, cellular metabolism causes isotope scrambling anddilution, which is a problem where the homogeneity of isotope-labeled peptides is reduced due to conversion of labeled amino acidsinto others, or vice versa (9). This problem can be overcome in a cell-free system by artificial adjustment of the system components (10).Here we describe a workflow for multiplexed absolute quan-
tification of proteins using SRM-based targeted proteomics. Theworkflow, termed MS-based Quantification by isotope-labeledCell-free products (MS-QBiC), has several features that expandadvantages of the internal standard synthesis using a cell-free sys-tem. It is based on the use of the PURE system, a reconstitutedcell-free protein synthesis system (11). Because the PURE systemconsists of purified factors and enzymes for E. coli translationmachinery, synthesized peptides are rarely challenged by proteasedegradation that usually occurs in cell-extract systems. Addition-ally, isotope scrambling or dilution is avoided without the need toadjust system components (10). The developed workflow was ap-plied to the absolute quantification of core circadian clock proteinsin mouse livers across the circadian day. To obtain optimal pep-tides for the detection and quantification by the SRM-based tar-geted proteomics analysis, we synthesized 120 peptides for 20circadian clock proteins. All of the peptides were successfullysynthesized from PCR-amplified genes by the PURE system. Dy-namic changes of copy numbers for 16 proteins during the circadianday were successfully quantified, demonstrating the potential of thismethod for the multiplexed targeted proteomics approaches.
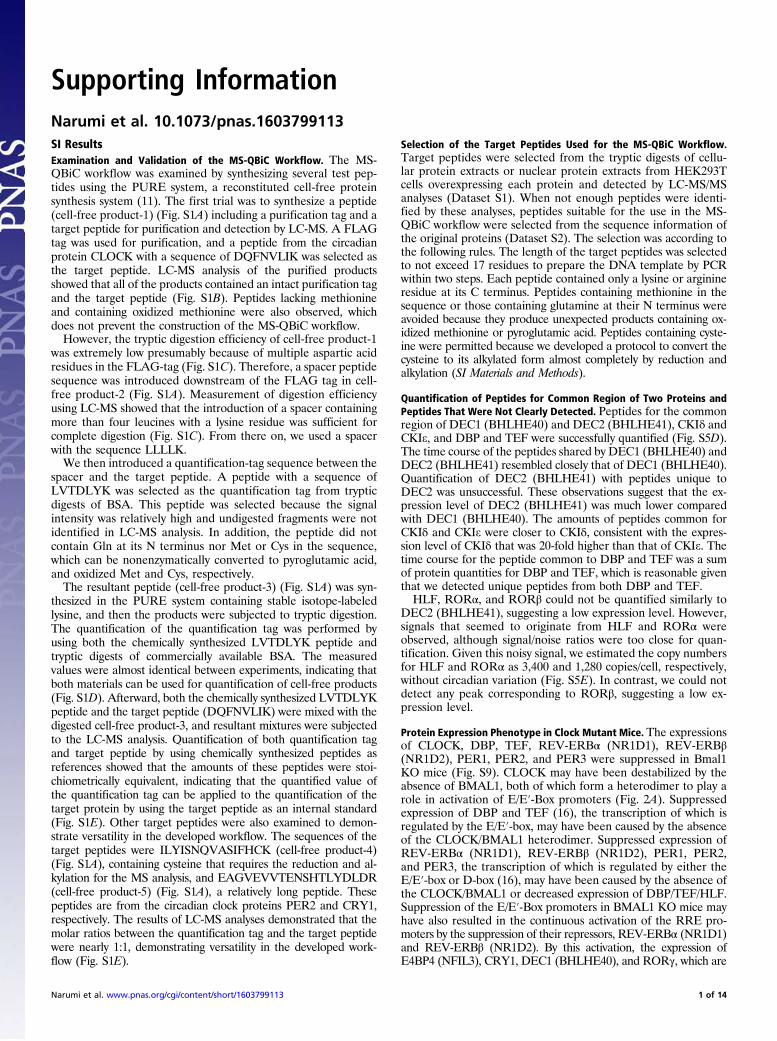
ResultsDesign of the MS-QBiC Workflow. To develop a simple strategy forthe multiplexed absolute quantification of protein using SRM-based targeted proteomics, we devised the MS-QBiC workflow(Fig. 1). This method takes advantage of the PURE system, areconstituted cell-free protein synthesis system (11) for internalpeptide synthesis without peptide degradation and without iso-tope scrambling or dilution (10). It is also noteworthy that thePURE system is suitable for protein or peptide expression fromlinear DNA, which enables the direct addition of the PCR-amplified gene into reaction mixtures. Thus, gene preparation,peptide synthesis, and purification can be performed in a simpleand a high-throughput manner. The whole process can be carriedout in 1 d from one or two DNA primers per peptide.After examination and validation of the workflow by several
liquid chromatography (LC)-MS analyses (Fig. S1 and SI Results),the MS-QBiC peptide was designed as shown in Fig. S2. A FLAGtag was selected as a purification tag and the quantification tagwas obtained from the tryptic digest of bovine serum albumin(BSA), which was attached downstream of the FLAG tag and aspacer peptide sequence. The gene for the peptide was cloned intothe plasmid vector comprising a T7 promoter and the 5′-UTRsequence for the E. coli translation system. The target peptide wasdesigned to be directly attached to the quantification tag by PCRusing the plasmid as a template. The MS-QBiC peptide can bequantified by comparing ion peak intensities of the stable isotope-labeled quantification tag with those of the chemically synthesizedquantification tag (Fig. S2, Lower Left) or the tryptic digest ofcommercially available BSA (Fig. S1D). The quantified MS-QBiCpeptide can be then used to quantify the target peptide by com-paring the intensities of stable isotope-labeled target peptide inMS-QBiC peptide with those of the nonlabeled target peptide inthe sample (Fig. S2, Lower Right).The workflow was further examined for SRM analysis. Both
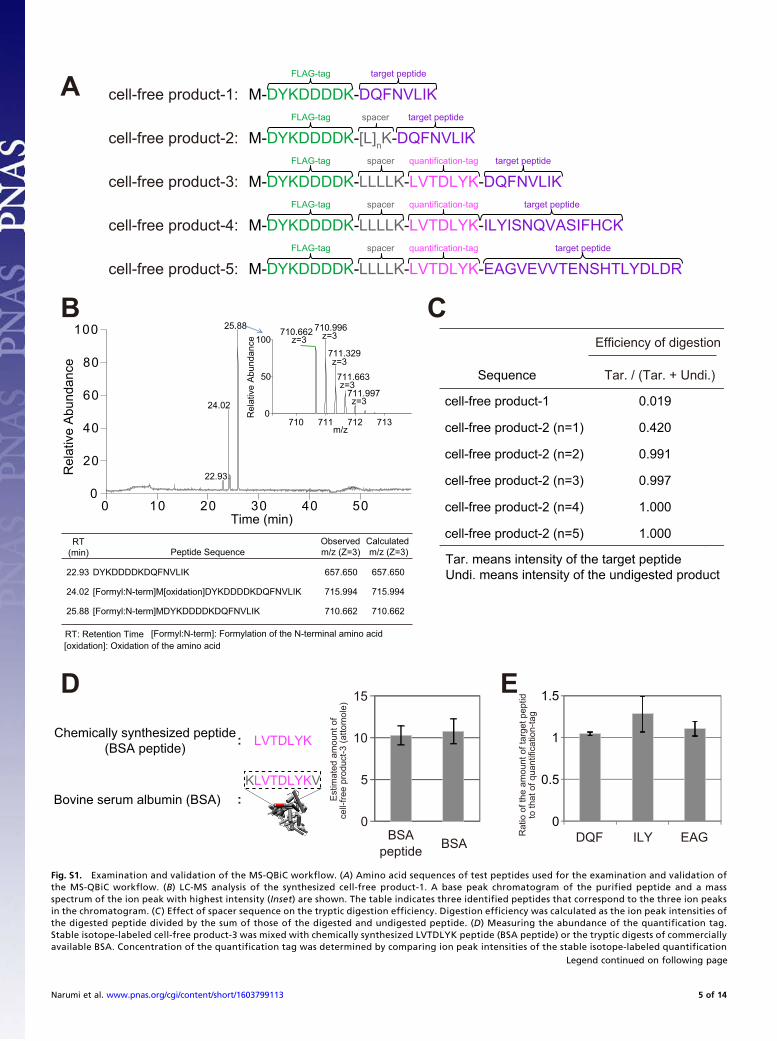
the quantification of the MS-QBiC peptide and the data collectionfor the development of the SRM method for the target peptide(Fig. S3 A–C) were carried out by the LC-SRM analysis usingmixtures containing digested MS-QBiC peptide and the chemi-cally synthesized quantification tag. The developed SRM methodwas then applied to target peptide quantification in mouse liver.
The quantified MS-QBiC peptide was mixed with cellular proteinextracts from a mouse liver and subjected to tryptic digestion andLC-SRM analysis. By comparing the ion peak intensities of thefragment peptides, the quantification of the target peptide couldbe performed (Fig. S3D), indicating that the MS-QBiC workflowcan be applied to the SRM analysis.
Quantification of Core Circadian Clock Proteins. The workflow wasapplied to the quantification of core circadian clock proteins. Themammalian circadian clock is driven through complex feedbackand feed-forward loops regulated by a variety of circadian clockproteins and three clock-controlled elements (12–15) (Fig. 2A).Although quantitative analyses of mRNA-level gene-expression ofcircadian clock proteins have been performed previously (13, 16),direct quantification of these proteins across the circadian day isessential for the accurate description and simulation of circadianclock networks. According to previous mRNA-level gene-expressionprofiles (13, 16), 20 circadian clock proteins were examined and 120tryptic peptides were selected as target peptides for quantification ofthese proteins (Fig. 2 A and B, Datasets S1 and S2, and SI Results).Note that some peptides overlapped a common region of similargenes for DEC1 (BHLHE40) and DEC2 (BHLHE41), CKIδand CKIe, REV-ERBα (NR1D1) and REV-ERBβ (NR1D2),RORα and RORβ, and DBP and TEF.An experimental workflow used for quantification of circadian
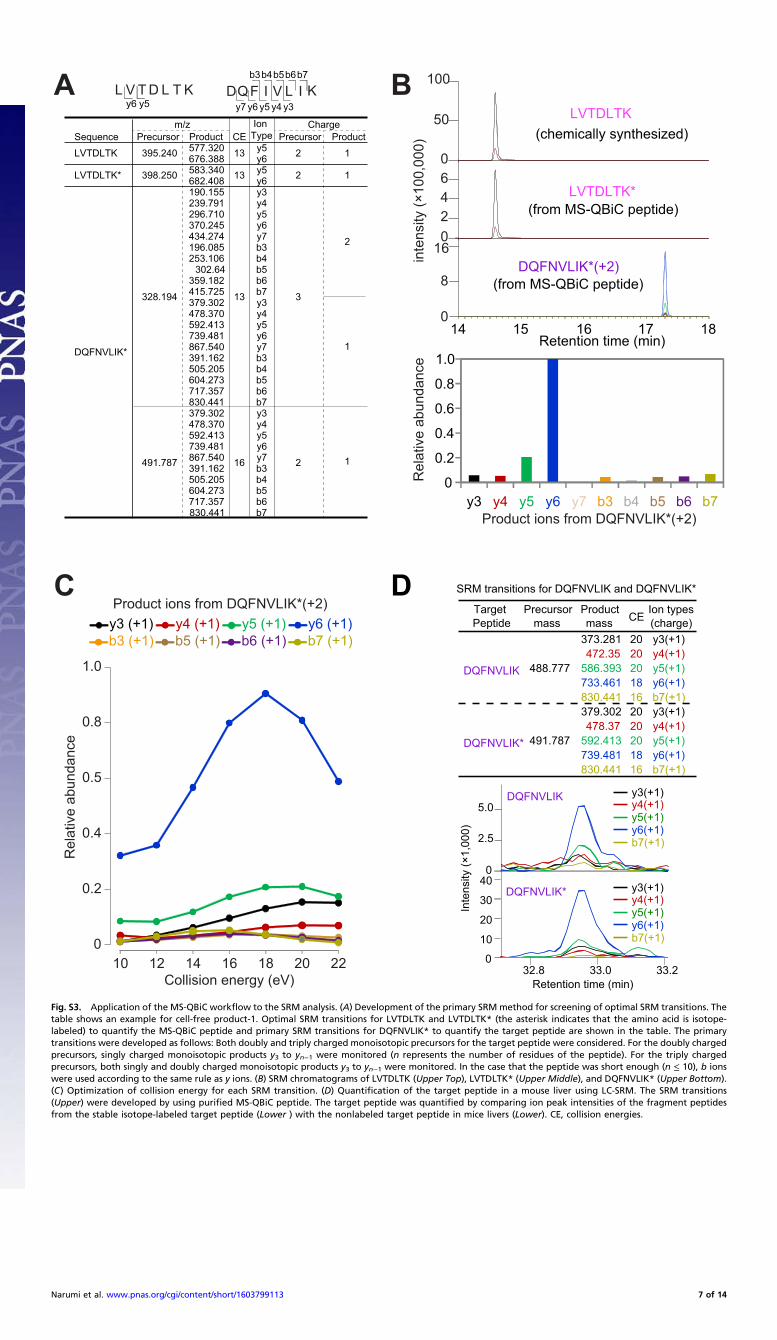
clock proteins is shown (Fig. 2C). Mice were entrained in a 12-hlight/12-h dark (LD) cycle for 2 wk. After transferring to constantdarkness, mice livers were collected at six time points with 4-hintervals at circadian times (CT0, CT4, CT8, CT12, CT16, andCT20). Livers from two mice were collected at each time point.The 120 synthesized and purified MS-QBiC peptides were mixedwith protein extracts from the mice liver. The mixtures weresubjected to tryptic digestion and then prefractionated with super
Addition
Biological sample
TranslationPurification
+
+
DNA
PrU Pu
Q Pr Q T+ +
Pr U Pu Q T
M Pu QK* K* K*T
M Pu QK* K* K*T
Protein
MS-QBiC peptide+
Light version ofquantification-tag
M Pu QK* K* K*TMS-QBiC peptide+
Q K
PeptideR KK
K* RR
RR
K
KRT
TMPuK*
Q KQ K* K*TPeptide
LC-MS
Sig
nal i
nten
sity
of M
S
Retention time
K
K*T
T
LC-MS
Sig
nal i
nten
sity
of M
S
Retention time
Q K
Q K*
DNA template
FW primer
RV primers
MS-QBiC peptideMS-QBiC peptide
Synthesis of MS-QBiC peptide with PURE System
PCR
Quantification of MS-QBiC peptide Quantification of target peptideAddition
TrypsinDigestionTrypsinDigestion
Calculation of the absolute amount of target protein
Fig. 1. Development of the MS-QBiC workflow. Schematic description ofthe MS-QBiC workflow. A purification tag, a quantification tag, and a trypticpeptide of the target protein (target peptide) are sequentially arrayed as asingle peptide sequence (MS-QBiC peptide). The target peptide sequence isattached by one- or two-step PCR. The MS-QBiC peptide is synthesized in thePURE system in the presence of stable isotope-labeled Arg and Lys for isotopiclabeling both the quantification tag and the target peptide. Trypsin digestionof purified MS-QBiC peptide produces equal amounts of isotopically labeledquantification tag and target peptide. The quantification tag is used tomeasure purified MS-QBiC peptide, and the target peptide is used as an in-ternal standard for the target protein quantification.
E3462 | www.pnas.org/cgi/doi/10.1073/pnas.1603799113 Narumi et al.
cation exchange (SCX) chromatography. The resultant 18 fractionswere individually subjected to LC-SRM analysis (Fig. S4 andDataset S2), and quantification of each peptide was performed.Prefractionation by SCX was adopted in the workflow because itwas essential for the detection of proteins with low copy numbers(17, 18).Quantification of the quantification tag showed that all of 120
MS-QBiC peptides were successfully synthesized from PCR-amplified genes by the PURE system. The amounts of purifiedpeptide from the same volume of reaction mixtures (25 μL)ranged between 1.4 and 33.3 pmol (Fig. 2D). Although the yieldswere variable, implying dependency on the sequence of the targetpeptide, they were sufficient for our SRM-based quantification.These data demonstrate the versatility of our workflow for manypeptides regardless of their sequence.Quantification of the target peptide (Fig. 2E) showed that 47
peptides (42 peptides were derived from a single protein and 5peptides were in the common region of two proteins) could beused for detection of circadian clock proteins in mice liversamples (Fig. 2B and Dataset S2). The remaining 73 peptideswere classified into two classes: in one class, internal standardswere not detected probably because of unsuccessful separationwith SCX chromatography (black rows in Fig. S4C) and in theother class signal/noise ratios were not high enough for detection
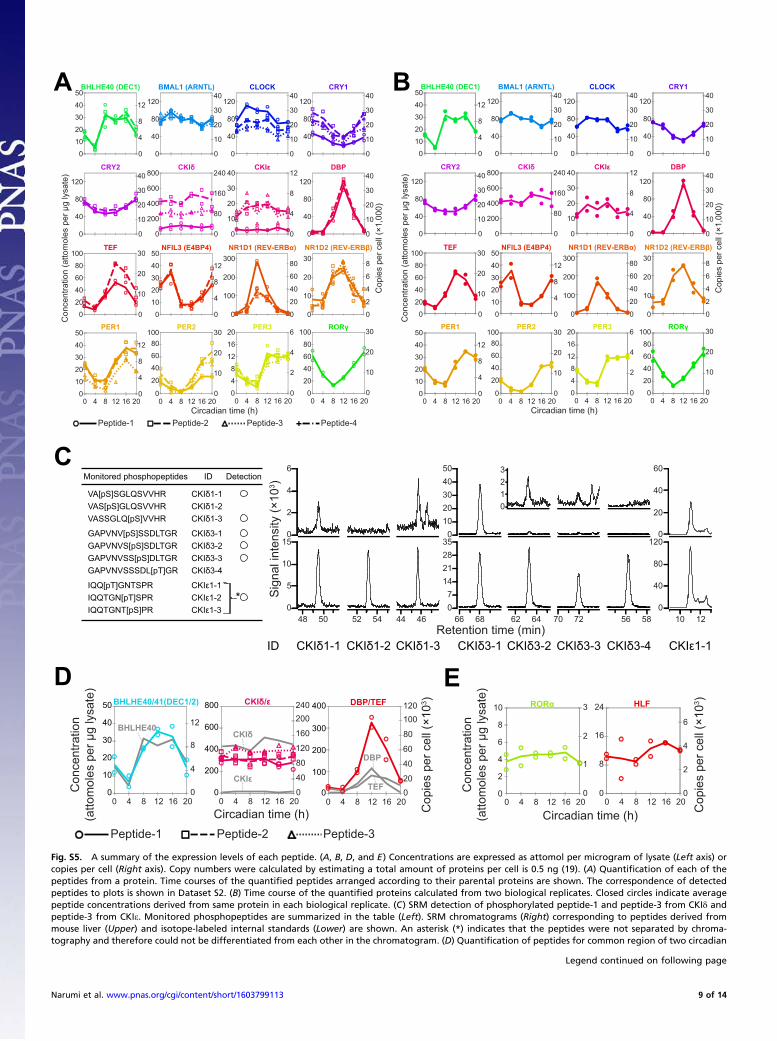
of endogenous targets. The quantified values of 47 peptides at sixtime points were compared between two biological replicates bya double-logarithmic plot (Fig. 2F). The quantified values werehighly correlated between replicates, indicating the biologicalreproducibility of circadian clock protein dynamics as well as thetechnical reproducibility of the developed workflow. Fifteen pro-teins were detected with two or more internal standards whereasone protein, RORγ, was detected with a single internal standard(Fig. 2A and Fig. S5A). Peptides for the common region of DEC1(BHLHE40) and DEC2 (BHLHE41), CKIδ and CKIe, and DBPand TEF were also successfully quantified, but four proteins[DEC2 (BHLHE41), HLF, RORα, and RORβ] were not detectedclearly in our analysis (Fig. S5 D and E and SI Results).Time courses for the concentrations of 16 proteins (Fig. 3A)
were shown as averaged peptide concentrations derived from sameprotein with errors between peptides. The differences in concen-tration between peptides (Fig. S5A and Dataset S3) were relativelyhigher than those between biological replicates (Fig. S5B andDataset S3). Various factors, such as posttranslational modifica-tion, the presence of unknown protein isoforms, and inefficient ormissed cleavages by the proteolysis, in addition to measurementerror itself, may cause these differences, which are common to MS-based absolute quantification (20). Despite these problems, thedata showed similar values from peptides derived from same
Primers corresponding to120 target peptides
DNA
120 of MS-QBiC peptides
Quantification of MS-QBiC peptidesand development of the SRM assaysby LC-SRM/MS
120 of MS samples forproduct quantification
Proteins
Peptides
Quantification of clock proteinsby LC-SRM/MS
(sampled at 6 timepoints every 4 hwith two biological replicates)
SCX Chro-matography
Digestion
18 fractions from each sample forquantification of clock proteins
Concentration of replicate-1(attomoles per μg lysate)
Con
cent
ratio
n of
repl
icat
e-2
(atto
mol
es p
er μ
g ly
sate
)
1,000
10
1
100
1 100
r = 0.96
Fig. 2. Quantification of 20 circadian clock proteins in mice livers. (A) The transcriptional circuit of the mouse circadian clock. Clock-controlled elements (CCE;rectangles), transcriptional factors (green or magenta ovals) with their effects (lines), and kinases (yellow ovals) are shown in the circuit. Green ovals representactivators, and magenta ovals represent repressors. Gray lines indicate that the CCE is located on the promoter (or enhancer) regions of the correspondingtranscription factor genes. Dashed lines indicate that the putative CCE is encoded. (B) A list of target proteins to be quantified. The numbers indicate thenumber of prepared target peptides and, in parentheses, the number of detected target peptides in the LC-SRM analyses. An asterisk indicates that targetpeptides are shared between two target proteins. (C) An experimental workflow for the absolute quantification of 20 circadian clock proteins. (D) Yields of120 MS-QBiC peptides synthesized in the PURE system. The colors of each bar are same as those used in B. (E) Examples of SRM chromatograms correspondingto target peptides derived from clock proteins (Upper) and their internal standards (Lower). (F) Comparison of the quantified values between two biologicalreplicates. Correlation coefficient (r) is indicated in the plot.
Narumi et al. PNAS | Published online May 31, 2016 | E3463
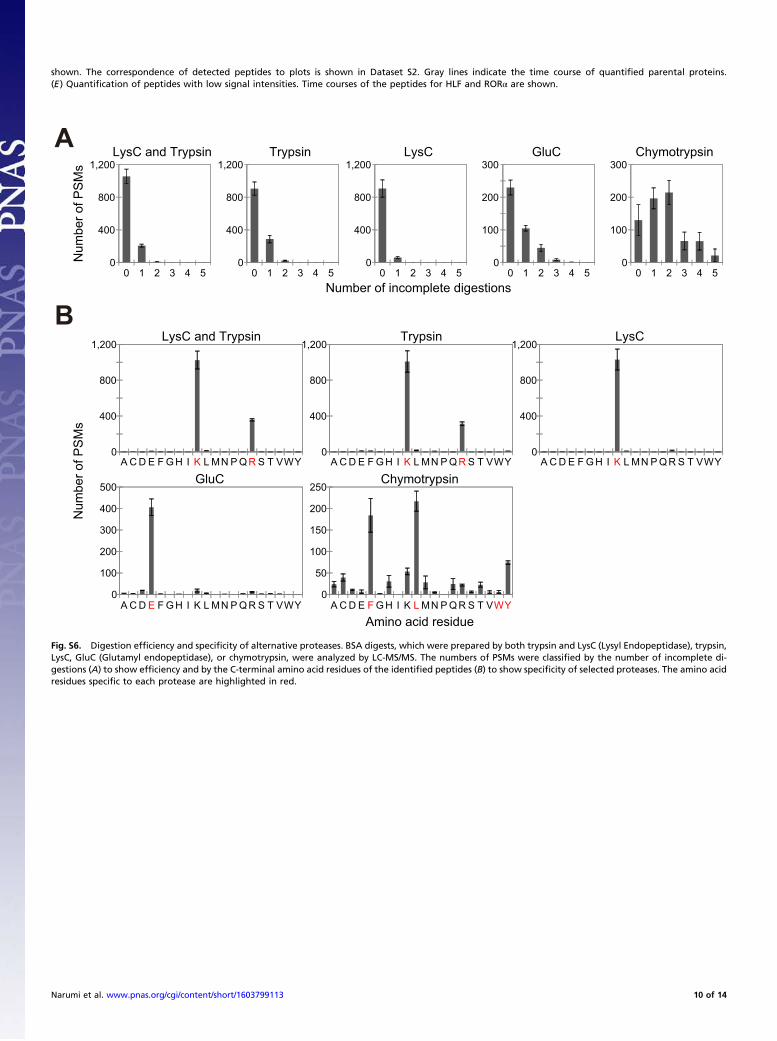
protein, which suggests that the observed values reflect abso-lute copy numbers in cells. Six proteins [DEC1 (BHLHE40),CRY2, DBP, CKIe, TEF, and NFIL3 (E4BP4)] were quantifiedwith only two target peptides, and two proteins (CKIδ and RORγ)were quantified with only a single peptide. Although target peptideswere selected from as many as possible according to our criteria(Dataset S2 and SI Results), the number of detected peptides de-pends on both a trypsin cleavage site in the amino acid sequence ofthe protein and the signal/noise ratio of each target peptide in theSRM analysis. The use of alternative proteases may increase thenumber of usable peptides for more reliable quantification. How-ever, absolute quantification depends on the efficiency and speci-ficity of the selected proteases, which is highest with the use of atandem LysC (Lysyl Endopeptidase)/trypsin cleavage (Fig. S6).Thus, this method is currently the best way for MS-based proteinquantification (21) and our studies (SI Results). To show errorsbetween peptides for the six proteins, maximum and minimumquantified values from each measurement were additionally plottedin the graph (Fig. 3A). It should be noted that peptide-1 and peptide-3 from CKIδ and peptide-1 from CKIe (Fig. S5A) were excludedfrom protein quantification. The concentrations of these peptideswere consistently lower compared with the maximum peptide con-
centration for each protein, i.e., the coefficient of variation betweenpeptides was more than 50% at all time points (Dataset S3). Ad-ditional experiments showed that these peptides were phosphory-lated (Fig. S5C), which indicated that the peptides were not suitablefor quantification. Phosphorylation of peptide-1 from CKIe was alsoreported previously in phosphoproteomics analyses including that ofmice liver (22, 23).The relative abundance of the mRNA corresponding to each
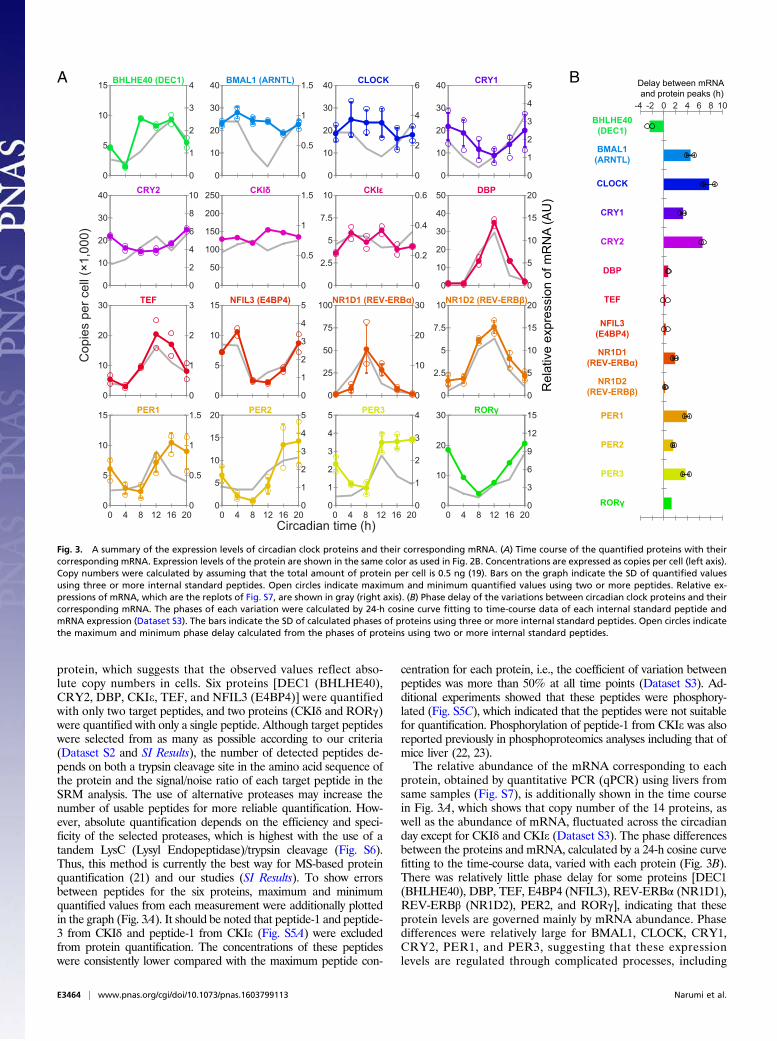
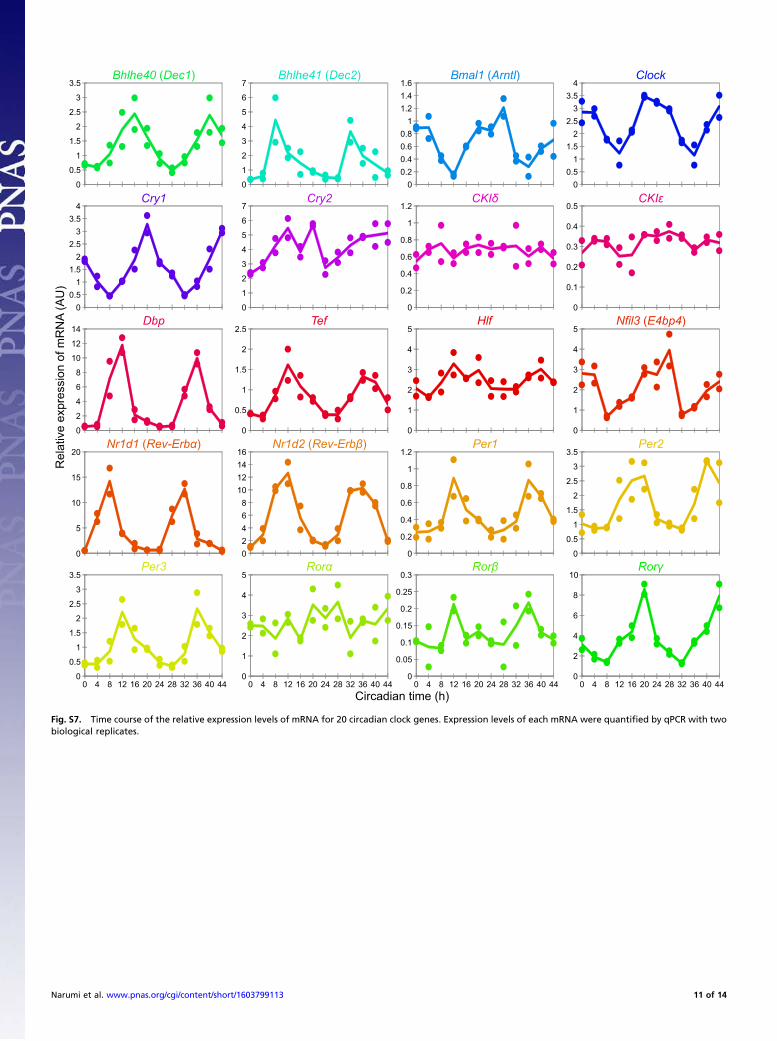
protein, obtained by quantitative PCR (qPCR) using livers fromsame samples (Fig. S7), is additionally shown in the time coursein Fig. 3A, which shows that copy number of the 14 proteins, aswell as the abundance of mRNA, fluctuated across the circadianday except for CKIδ and CKIe (Dataset S3). The phase differencesbetween the proteins and mRNA, calculated by a 24-h cosine curvefitting to the time-course data, varied with each protein (Fig. 3B).There was relatively little phase delay for some proteins [DEC1(BHLHE40), DBP, TEF, E4BP4 (NFIL3), REV-ERBα (NR1D1),REV-ERBβ (NR1D2), PER2, and RORγ], indicating that theseprotein levels are governed mainly by mRNA abundance. Phasedifferences were relatively large for BMAL1, CLOCK, CRY1,CRY2, PER1, and PER3, suggesting that these expressionlevels are regulated through complicated processes, including
Fig. 3. A summary of the expression levels of circadian clock proteins and their corresponding mRNA. (A) Time course of the quantified proteins with theircorresponding mRNA. Expression levels of the protein are shown in the same color as used in Fig. 2B. Concentrations are expressed as copies per cell (left axis).Copy numbers were calculated by assuming that the total amount of protein per cell is 0.5 ng (19). Bars on the graph indicate the SD of quantified valuesusing three or more internal standard peptides. Open circles indicate maximum and minimum quantified values using two or more peptides. Relative ex-pressions of mRNA, which are the replots of Fig. S7, are shown in gray (right axis). (B) Phase delay of the variations between circadian clock proteins and theircorresponding mRNA. The phases of each variation were calculated by 24-h cosine curve fitting to time-course data of each internal standard peptide andmRNA expression (Dataset S3). The bars indicate the SD of calculated phases of proteins using three or more internal standard peptides. Open circles indicatethe maximum and minimum phase delay calculated from the phases of proteins using two or more internal standard peptides.
E3464 | www.pnas.org/cgi/doi/10.1073/pnas.1603799113 Narumi et al.
posttranscriptional regulation, translation control, posttranslationalmodification, and degradation (24–28). These observations dem-onstrated that the direct quantification of proteins is essential forthe description of protein-level dynamics of biological systems.Circadian variation of PER1, PER2, CRY1, and CRY2 was
investigated previously by Western blot analyses (24). The timepoints for the maximum and minimum quantity of these proteinsin that report corresponded well with this study. Both studiesshowed that the amplitudes of PER1 and PER2 were largercompared with CRY1 and CRY2. In contrast, significantly highvariations of BMAL1 and CLOCK expression level observed inthe Western blot analysis were not observed in our results. Al-though we have no explanation for this inconsistency, our ob-servations suggested that the amplitude of the variation of theseproteins was relatively low. It is noteworthy that the copy num-bers and variations of these proteins matched each other, whichreflects that they function through the formation of a heterodimer(29). It is interesting that these copy numbers also matched CRY1at CT0, the peak time for CRY1. A recent report suggested thatthe three proteins form a ternary complex to inhibit the E/E′-Boxpromoters at this time point (30). Finally, the mRNA-level ex-pression of all of the proteins, except for CKIδ and CKIe, is knownto fluctuate across the circadian day (13), which is consistent withour analysis.
Construction of a Molecular Timetable. The quantified values ofpeptides for 14 circadian clock proteins except for CKIδ and CKIeshowed circadian rhythmicity (Dataset S3). The time points formaximum or minimum quantity varied among the proteins. Ourprevious studies demonstrated that such data sets can provide amolecular timetable that acts as a reference for body-time (BT)detection from only one or two time points (31–33). BT detectionhas been performed for mRNA-level gene-expression profiles ofmouse cells and the mouse and human blood metabolite profiles.In the present study, the method was further applied for protein-level expression profiles using the quantified values of each pep-tide to show whether they indicate the endogenous state of thecircadian clock.To construct a molecular timetable, the quantified values of 36
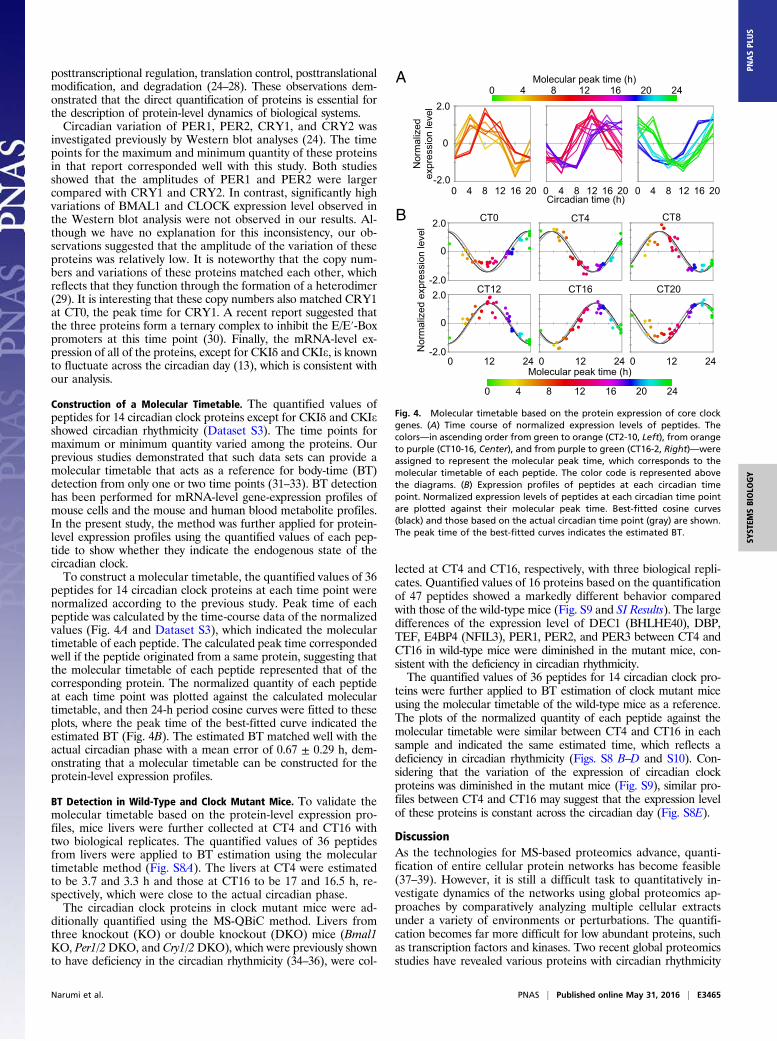
peptides for 14 circadian clock proteins at each time point werenormalized according to the previous study. Peak time of eachpeptide was calculated by the time-course data of the normalizedvalues (Fig. 4A and Dataset S3), which indicated the moleculartimetable of each peptide. The calculated peak time correspondedwell if the peptide originated from a same protein, suggesting thatthe molecular timetable of each peptide represented that of thecorresponding protein. The normalized quantity of each peptideat each time point was plotted against the calculated moleculartimetable, and then 24-h period cosine curves were fitted to theseplots, where the peak time of the best-fitted curve indicated theestimated BT (Fig. 4B). The estimated BT matched well with theactual circadian phase with a mean error of 0.67 ± 0.29 h, dem-onstrating that a molecular timetable can be constructed for theprotein-level expression profiles.
BT Detection in Wild-Type and Clock Mutant Mice. To validate themolecular timetable based on the protein-level expression pro-files, mice livers were further collected at CT4 and CT16 withtwo biological replicates. The quantified values of 36 peptidesfrom livers were applied to BT estimation using the moleculartimetable method (Fig. S8A). The livers at CT4 were estimatedto be 3.7 and 3.3 h and those at CT16 to be 17 and 16.5 h, re-spectively, which were close to the actual circadian phase.The circadian clock proteins in clock mutant mice were ad-
ditionally quantified using the MS-QBiC method. Livers fromthree knockout (KO) or double knockout (DKO) mice (Bmal1KO, Per1/2DKO, and Cry1/2DKO), which were previously shownto have deficiency in the circadian rhythmicity (34–36), were col-
lected at CT4 and CT16, respectively, with three biological repli-cates. Quantified values of 16 proteins based on the quantificationof 47 peptides showed a markedly different behavior comparedwith those of the wild-type mice (Fig. S9 and SI Results). The largedifferences of the expression level of DEC1 (BHLHE40), DBP,TEF, E4BP4 (NFIL3), PER1, PER2, and PER3 between CT4 andCT16 in wild-type mice were diminished in the mutant mice, con-sistent with the deficiency in circadian rhythmicity.The quantified values of 36 peptides for 14 circadian clock pro-
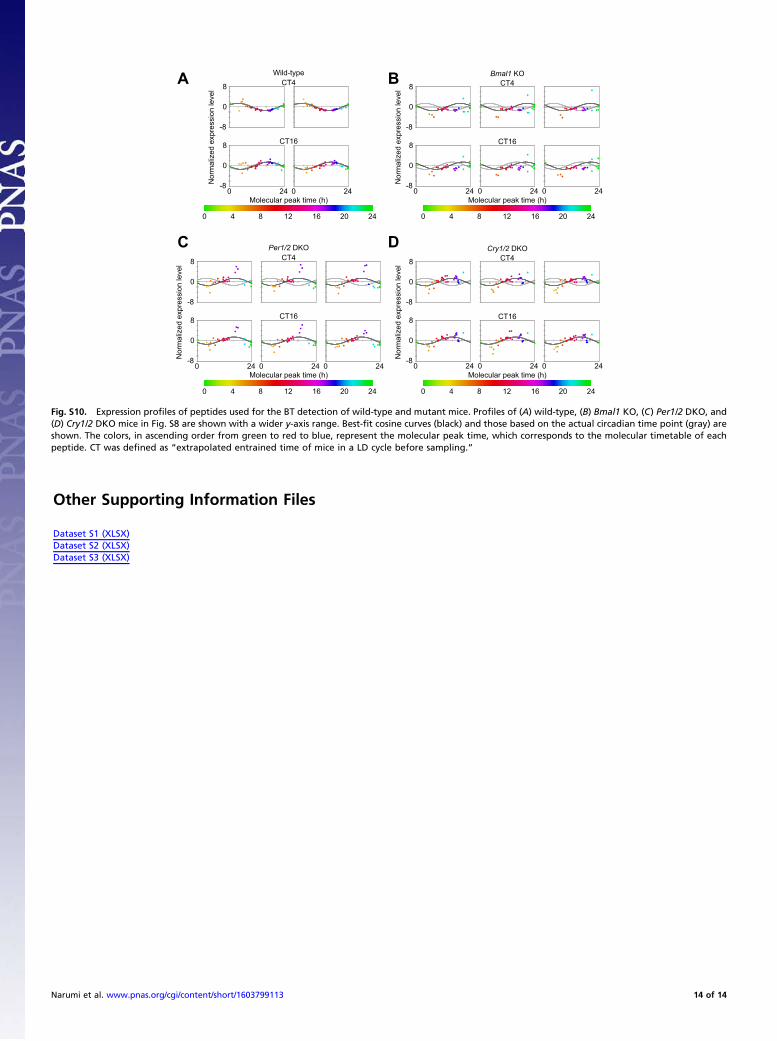
teins were further applied to BT estimation of clock mutant miceusing the molecular timetable of the wild-type mice as a reference.The plots of the normalized quantity of each peptide against themolecular timetable were similar between CT4 and CT16 in eachsample and indicated the same estimated time, which reflects adeficiency in circadian rhythmicity (Figs. S8 B–D and S10). Con-sidering that the variation of the expression of circadian clockproteins was diminished in the mutant mice (Fig. S9), similar pro-files between CT4 and CT16 may suggest that the expression levelof these proteins is constant across the circadian day (Fig. S8E).
DiscussionAs the technologies for MS-based proteomics advance, quanti-fication of entire cellular protein networks has become feasible(37–39). However, it is still a difficult task to quantitatively in-vestigate dynamics of the networks using global proteomics ap-proaches by comparatively analyzing multiple cellular extractsunder a variety of environments or perturbations. The quantifi-cation becomes far more difficult for low abundant proteins, suchas transcription factors and kinases. Two recent global proteomicsstudies have revealed various proteins with circadian rhythmicity
lFig. 4. Molecular timetable based on the protein expression of core clockgenes. (A) Time course of normalized expression levels of peptides. Thecolors—in ascending order from green to orange (CT2-10, Left), from orangeto purple (CT10-16, Center), and from purple to green (CT16-2, Right)—wereassigned to represent the molecular peak time, which corresponds to themolecular timetable of each peptide. The color code is represented abovethe diagrams. (B) Expression profiles of peptides at each circadian timepoint. Normalized expression levels of peptides at each circadian time pointare plotted against their molecular peak time. Best-fitted cosine curves(black) and those based on the actual circadian time point (gray) are shown.The peak time of the best-fitted curves indicates the estimated BT.
Narumi et al. PNAS | Published online May 31, 2016 | E3465
by analyzing time-series samples from large numbers of mice livers(40, 41). However, core circadian clock proteins, which consistmainly of transcription factors and kinases, were not detected.Targeted proteomics has grown in recent years as a strategy to
compensate for the weaknesses of global proteomics approaches.It monitors only signal intensities with good signal/noise ratiosderived from target peptides under optimal conditions. It cananalyze low-abundance proteins more effectively, but the num-ber of proteins that can be analyzed is reduced compared withthe global proteomics approaches. Therefore, targeted proteomicsapproaches are suitable for analyzing the dynamics of specifiedbiological systems comprising low-abundance proteins.In this study, we performed systems-level analysis of dynamics
of core circadian clock proteins by using SRM-based targetedproteomics. Sixteen proteins from 20 circadian clock proteinswere successfully quantified using time-series samples from miceliver, and 14 proteins had circadian variation (Fig. 3 and DatasetS3). The developed method can be applied to other organs ortissues such as the brain that function as a central circadian clock.It will be interesting to quantify the core circadian clock proteinsin the brain to compare the abundance between the central andperipheral organs using the developed method for future studies.Four proteins [DEC2 (BHLHE41), HLF, RORα, and RORβ]
were not clearly quantified, although estimation of two proteins(HLF and RORα) was examined from peak intensities with lowsignal/noise ratios (Fig. S5E). The quantification result from thecommon region of DEC1 (BHLHE40) and DEC2 (BHLHE41)suggests that the expression level of DEC2 is extremely low (Fig.S5D), and this may have resulted in unsuccessful detection of thesignal peaks for DEC2. The detection limit of DEC2 (BHLHE41)and RORβ, estimated as threefold of the SD of noise peaks, isabout 1,000 and 100 copies per cell, respectively, when the mostsensitive standard peptides are used (Dataset S3). Thus, furtherdevelopment of the SRM-based detection as well as the sensitivityof MS itself is necessary for the detection of proteins with ex-tremely low expression levels (<1,000 copies per cell).The MS-QBiC workflow allows for multiplexed preparation of
isotopically labeled peptides for use as internal standards. Mul-tiple peptides can be prepared in parallel without any cDNAcloning or gene synthesis step by using the MS-QBiC workflow.The use of the reconstituted cell-free protein synthesis systemavoids isotope scrambling and dilution. Moreover, multiplexedpeptide preparation can increase the sensitivity of SRM analysisby developing an optimal method that depends on the physicalproperties of individual peptides. Although the yield of synthesizedpeptides differs from one peptide to another, sufficient amounts ofthe peptide were successfully prepared regardless of their se-quences, suggesting versatility in the developed workflow. Thisversatility also suggests that the developed method does not rely onthe characteristics of proteins and can be applied to proteins thatare difficult to prepare recombinantly, such as membrane-boundproteins and other DNA-binding proteins. Currently, SRM analy-ses highly depends on the performance of the MS, and thus de-tection of several hundreds of proteins is estimated to be the upperlimit according to previous reports (39, 42). However, this limit canbe increased by improvement of MS performance. Therefore, high-throughput synthesis of internal peptides using the PURE systemcan be adapted to such improvements in the future. Presently,the developed method is not able to be applied to the preparationof modified peptides that mimic posttranslational modification.However, integration of the developed method with technologiesbased on genetic code engineering (43), including site-specific in-corporation of phosphoserine residues into the proteins or peptides(44), has the potential to overcome this difficulty, and we are nowexploring this possibility.The core circadian clock proteins consist mainly of transcription
factors, which bind to DNA and function as activators or repres-sors for transcription. Interactions between DNA and BMAL1,
CLOCK, CRY1, CRY2, PER1, and PER2, which play crucialroles in the formation of circadian rhythmicity, have been com-prehensively analyzed using ChIP-seq analyses (45) demonstratingthat binding of these proteins to their binding sites shows circadianrhythmicity. The peak time of binding matches well with that ofthe protein concentrations quantified in this study, except forCRY2, suggesting that the binding is principally regulated by theexpression levels of each protein. However, the binding may beregulated not only by the quantity of protein, but also by otherqualities (e.g., posttranslational modification status): The ampli-tude of BMAL1, CLOCK, CRY1, and CRY2 is quite low, and aconsiderable amount of the proteins may remain in cells at acircadian phase when their binding to DNA is low and the peaktime of CRY2 concentration is different from that of its DNAbinding. These observations suggest that qualitative changes ofthese proteins are also important for the DNA-binding activities.Calculating from our results and the ChIP-seq data, the numbersof proteins at each binding site are 5.6 BMAL1, 14.6 CLOCK, 7.2PER1, 3.2 PER2, 3.4 CRY1, and 4.8 CRY2 at a single bindingsite, respectively. The values suggest that 3–15 proteins are nec-essary at a binding site to regulate gene expression for the for-mation of the circadian clock.The application of the molecular timetable methods to the
quantified peptides from 14 circadian clock proteins demonstratesthat single-time-point data can predict body time, indicating thatexpression levels of each circadian protein are promising markersfor future application of body time detection in human samples.The accuracy of detection is comparable to the mRNA-levelexpression-based timetable method rather than the metabolite-based method, which requires two-time-point data for detection(31–33). Furthermore, the constructed timetable, which is basedon the absolute quantification of cellular proteins, can be universalcompared with the previous two methods based on the relativequantification, which may enable the single-time-point assay indifferent places. Resemblance of peptide expression profiles be-tween CT4 and CT16 in three mutant mice suggests that the ex-pression level of the proteins is fixed at the level of the designatedtime point. In Bmal1 KO mice, the absence of CLOCK/BMAL1heterodimer represses the E/E′-Box promoters and then activatesthe RRE promoters. In Per1/2 DKO and Cry1/2 DKO mice, theabsence of PER1 and PER2 or CRY1 and CRY2 activates theE/E′-Box promoters and in turn activates the D-Box promoterswhereas the RRE promoters are suppressed to some extent(Figs. S8E and S9). Such fixation of the activities of each pro-moter may result in the stalled circadian gene-expression dy-namics at the specific circadian phase.
Materials and MethodsAnimals. All mice were carefully kept and handled according to the RIKENRegulations for Animal Experiments. See SI Materials and Methods for details.
Sample Preparation. Chemically synthesized peptides, MS-QBiC peptides, cell/nuclear lysates from HEK293T cells, and mouse liver samples were preparedfor this study. They were subjected to enzymatic digestion and prefractio-nation before MS analyses. See SI Materials and Methods for details.
MS Analyses. Two types of mass spectrometers—an Orbitrap mass spectrom-eter and a triple quadruple mass spectrometer—were used in this study. See SIMaterials and Methods for details.
RNA Expression Analysis of Circadian Clock Genes by qPCR. The mRNA-levelexpression profiles of circadian clock genes were measured by qPCR. See SIMaterials and Methods for details.
BT Detection by Molecular Timetable Methods. Estimation of body time byusing expression profiles of circadian clock proteins was performed accordingto the molecular timetable methods as reported previously (31). See SIMaterials and Methods for details.
E3466 | www.pnas.org/cgi/doi/10.1073/pnas.1603799113 Narumi et al.
ACKNOWLEDGMENTS. We thank the laboratory members at RIKEN QBiC,in particular, J. Hara and G. A. Sunagawa for their kind help in preparingknockout mice; A. Millius for his critical reading and editing of themanuscript; E. A. Susaki for his kind support in setting up the MS room;and T. Kawashima for his early efforts on the molecular timetable. Thiswork was supported by the Program for Innovative Cell Biology by Innova-tive Technology and the Brain Mapping by Integrated Neurotechnologiesfor Disease Studies from the Ministry of Education, Culture, Sports, Scienceand Technology (MEXT) of Japan (H.R.U.); Grant-in-Aid for ScientificResearch (S) 25221004 (to H.R.U.); Grant-in-Aid for Scientific Research onInnovative Areas 23115006 (to H.R.U.); Grant-in-Aid for Young Scientists
(A) 26710014 (to Y. Shimizu); Grant-in-Aid for Young Scientists (B) 25830146(to K.L.O.); Grant-in-Aid for Challenging Exploratory Research 26640134(to Y. Shimizu); Grant-in-Aid for Exploratory Research 15K13750 (to K.M.);Grants-in-Aid for Japan Society for the Promotion of Science (JSPS) Fel-lows 25-1565 (to G.N.K.) and 25-5989 (to Y. Shinohara) from MEXT/JSPS;the strategic programs for R&D (President’s Discretionary Fund) of RIKEN(H.R.U. and Y. Shimizu); an intramural Grant-in-Aid from the RIKEN Quan-titative Biology Center (to H.R.U. and Y. Shimizu); the RIKEN Special Post-doctoral Research Program (G.N.K.); and a grant from Core Researchfor Evolutional Science and Technology of Japan Science and TechnologyAgency (to H.R.U.).
1. Brun V, Masselon C, Garin J, Dupuis A (2009) Isotope dilution strategies for absolutequantitative proteomics. J Proteomics 72(5):740–749.
2. Gerber SA, Rush J, Stemman O, Kirschner MW, Gygi SP (2003) Absolute quantificationof proteins and phosphoproteins from cell lysates by tandem MS. Proc Natl Acad SciUSA 100(12):6940–6945.
3. Stergachis AB, MacLean B, Lee K, Stamatoyannopoulos JA, MacCoss MJ (2011) Rapidempirical discovery of optimal peptides for targeted proteomics. Nat Methods 8(12):1041–1043.
4. Hanke S, Besir H, Oesterhelt D, Mann M (2008) Absolute SILAC for accurate quanti-tation of proteins in complex mixtures down to the attomole level. J Proteome Res7(3):1118–1130.
5. Simicevic J, et al. (2013) Absolute quantification of transcription factors during cel-lular differentiation using multiplexed targeted proteomics. Nat Methods 10(6):570–576.
6. Beynon RJ, Doherty MK, Pratt JM, Gaskell SJ (2005) Multiplexed absolute quantifi-cation in proteomics using artificial QCAT proteins of concatenated signature pep-tides. Nat Methods 2(8):587–589.
8. Mirzaei H, McBee JK, Watts J, Aebersold R (2008) Comparative evaluation of currentpeptide production platforms used in absolute quantification in proteomics. Mol CellProteomics 7(4):813–823.
9. Muchmore DC, McIntosh LP, Russell CB, Anderson DE, Dahlquist FW (1989) Expressionand nitrogen-15 labeling of proteins for proton and nitrogen-15 nuclear magneticresonance. Methods Enzymol 177:44–73.
10. Yokoyama J, Matsuda T, Koshiba S, Tochio N, Kigawa T (2011) A practical method forcell-free protein synthesis to avoid stable isotope scrambling and dilution. AnalBiochem 411(2):223–229.
11. Shimizu Y, et al. (2001) Cell-free translation reconstituted with purified components.Nat Biotechnol 19(8):751–755.
12. Lowrey PL, et al. (2000) Positional syntenic cloning and functional characterization ofthe mammalian circadian mutation tau. Science 288(5465):483–492.
13. Ueda HR, et al. (2002) A transcription factor response element for gene expressionduring circadian night. Nature 418(6897):534–539.
14. Xu Y, et al. (2005) Functional consequences of a CKIdelta mutation causing familialadvanced sleep phase syndrome. Nature 434(7033):640–644.
15. Ukai-Tadenuma M, et al. (2011) Delay in feedback repression by cryptochrome 1 isrequired for circadian clock function. Cell 144(2):268–281.
16. Ueda HR, et al. (2005) System-level identification of transcriptional circuits underlyingmammalian circadian clocks. Nat Genet 37(2):187–192.
17. Ebhardt HA, Sabidó E, Hüttenhain R, Collins B, Aebersold R (2012) Range of proteindetection by selected/multiple reaction monitoring mass spectrometry in an un-fractionated human cell culture lysate. Proteomics 12(8):1185–1193.
18. Burgess MW, Keshishian H, Mani DR, Gillette MA, Carr SA (2014) Simplified and ef-ficient quantification of low-abundance proteins at very high multiplex via targetedmass spectrometry. Mol Cell Proteomics 13(4):1137–1149.
19. Brown TA, ed (2002) Transcriptomes and proteomes. Genomes (John Wiley & Sons,New York), 2nd Ed, pp 70–91.
20. Lawless C, et al. (2016) Direct and absolute quantification of over 1800 yeast proteinsvia selected reaction monitoring. Mol Cell Proteomics 15(4):1309–1322.
21. Glatter T, et al. (2012) Large-scale quantitative assessment of different in-solutionprotein digestion protocols reveals superior cleavage efficiency of tandem Lys-C/trypsinproteolysis over trypsin digestion. J Proteome Res 11(11):5145–5156.
22. Pan C, Gnad F, Olsen JV, Mann M (2008) Quantitative phosphoproteome analysis of amouse liver cell line reveals specificity of phosphatase inhibitors. Proteomics 8(21):4534–4546.
23. Monetti M, Nagaraj N, Sharma K, Mann M (2011) Large-scale phosphosite quantifi-cation in tissues by a spike-in SILAC method. Nat Methods 8(8):655–658.
24. Lee C, Etchegaray JP, Cagampang FR, Loudon AS, Reppert SM (2001) Posttranslationalmechanisms regulate the mammalian circadian clock. Cell 107(7):855–867.
25. Hirayama J, et al. (2007) CLOCK-mediated acetylation of BMAL1 controls circadianfunction. Nature 450(7172):1086–1090.
26. Isojima Y, et al. (2009) CKIepsilon/δ-dependent phosphorylation is a temperature-insensitive, period-determining process in the mammalian circadian clock. Proc NatlAcad Sci USA 106(37):15744–15749.
27. Hirano A, et al. (2013) FBXL21 regulates oscillation of the circadian clock throughubiquitination and stabilization of cryptochromes. Cell 152(5):1106–1118.
28. Gao P, et al. (2013) Phosphorylation of the cryptochrome 1 C-terminal tail regulatescircadian period length. J Biol Chem 288(49):35277–35286.
29. Gekakis N, et al. (1998) Role of the CLOCK protein in the mammalian circadianmechanism. Science 280(5369):1564–1569.
30. Ye R, et al. (2014) Dual modes of CLOCK:BMAL1 inhibition mediated by Cryptochromeand Period proteins in the mammalian circadian clock. Genes Dev 28(18):1989–1998.
31. Ueda HR, et al. (2004) Molecular-timetable methods for detection of body time andrhythm disorders from single-time-point genome-wide expression profiles. Proc NatlAcad Sci USA 101(31):11227–11232.
32. Minami Y, et al. (2009) Measurement of internal body time by blood metabolomics.Proc Natl Acad Sci USA 106(24):9890–9895.
33. Kasukawa T, et al. (2012) Human blood metabolite timetable indicates internal bodytime. Proc Natl Acad Sci USA 109(37):15036–15041.
34. Shimba S, et al. (2011) Deficient of a clock gene, brain and muscle Arnt-like protein-1(BMAL1), induces dyslipidemia and ectopic fat formation. PLoS One 6(9):e25231.
35. Bae K, et al. (2001) Differential functions of mPer1, mPer2, and mPer3 in the SCNcircadian clock. Neuron 30(2):525–536.
36. van der Horst GT, et al. (1999) Mammalian Cry1 and Cry2 are essential for mainte-nance of circadian rhythms. Nature 398(6728):627–630.
37. Wilhelm M, et al. (2014) Mass-spectrometry-based draft of the human proteome.Nature 509(7502):582–587.
38. KimMS, et al. (2014) A draft map of the human proteome. Nature 509(7502):575–581.39. Kennedy JJ, et al. (2014) Demonstrating the feasibility of large-scale development of
standardized assays to quantify human proteins. Nat Methods 11(2):149–155.40. Mauvoisin D, et al. (2014) Circadian clock-dependent and -independent rhythmic
41. Robles MS, Cox J, Mann M (2014) In-vivo quantitative proteomics reveals a key contri-bution of post-transcriptional mechanisms to the circadian regulation of liver metabo-lism. PLoS Genet 10(1):e1004047.
42. Sabidó E, et al. (2013) Targeted proteomics reveals strain-specific changes in themouse insulin and central metabolic pathways after a sustained high-fat diet. MolSyst Biol 9(1):681.
43. Chin JW (2014) Expanding and reprogramming the genetic code of cells and animals.Annu Rev Biochem 83:379–408.
44. Park HS, et al. (2011) Expanding the genetic code of Escherichia coli with phospho-serine. Science 333(6046):1151–1154.
45. Koike N, et al. (2012) Transcriptional architecture and chromatin landscape of thecore circadian clock in mammals. Science 338(6105):349–354.
46. Ozaki N, et al. (2012) Regulation of basic helix-loop-helix transcription factors Dec1and Dec2 by RORα and their roles in adipogenesis. Genes Cells 17(2):109–121.
47. Hida A, et al. (2000) The human and mouse Period1 genes: Five well-conservedE-boxes additively contribute to the enhancement of mPer1 transcription. Genomics65(3):224–233.
48. Fields R (1972) The rapid determination of amino groups with TNBS. MethodsEnzymol 25:464–468.
49. Shimizu Y, Ueda T (2010) PURE technology. Methods Mol Biol 607:11–21.50. Ukai H, et al. (2007) Melanopsin-dependent photo-perturbation reveals desynchro-
nization underlying the singularity of mammalian circadian clocks. Nat Cell Biol 9(11):1327–1334.
51. Masuda T, Tomita M, Ishihama Y (2008) Phase transfer surfactant-aided trypsin di-gestion for membrane proteome analysis. J Proteome Res 7(2):731–740.
52. Rappsilber J, Mann M, Ishihama Y (2007) Protocol for micro-purification, enrichment,pre-fractionation and storage of peptides for proteomics using StageTips. Nat Protoc2(8):1896–1906.
53. Boersema PJ, Raijmakers R, Lemeer S, Mohammed S, Heck AJ (2009) Multiplex peptidestable isotope dimethyl labeling for quantitative proteomics. Nat Protoc 4(4):484–494.
54. Narumi R, Tomonaga T (2016) Quantitative analysis of tissue samples by combiningiTRAQ isobaric labeling with selected/multiple reaction monitoring (SRM/MRM).Methods Mol Biol 1355:85–101.
55. Tsujino K, et al. (2013) Establishment of TSH β real-time monitoring system in mammalianphotoperiodism. Genes Cells 18(7):575–588.
Narumi et al. PNAS | Published online May 31, 2016 | E3467
SYST
EMSBIOLO
GY
PNASPL
US
Supporting InformationNarumi et al. 10.1073/pnas.1603799113SI ResultsExamination and Validation of the MS-QBiC Workflow. The MS-QBiC workflow was examined by synthesizing several test pep-tides using the PURE system, a reconstituted cell-free proteinsynthesis system (11). The first trial was to synthesize a peptide(cell-free product-1) (Fig. S1A) including a purification tag and atarget peptide for purification and detection by LC-MS. A FLAGtag was used for purification, and a peptide from the circadianprotein CLOCK with a sequence of DQFNVLIK was selected asthe target peptide. LC-MS analysis of the purified productsshowed that all of the products contained an intact purification tagand the target peptide (Fig. S1B). Peptides lacking methionineand containing oxidized methionine were also observed, whichdoes not prevent the construction of the MS-QBiC workflow.However, the tryptic digestion efficiency of cell-free product-1
was extremely low presumably because of multiple aspartic acidresidues in the FLAG-tag (Fig. S1C). Therefore, a spacer peptidesequence was introduced downstream of the FLAG tag in cell-free product-2 (Fig. S1A). Measurement of digestion efficiencyusing LC-MS showed that the introduction of a spacer containingmore than four leucines with a lysine residue was sufficient forcomplete digestion (Fig. S1C). From there on, we used a spacerwith the sequence LLLLK.We then introduced a quantification-tag sequence between the
spacer and the target peptide. A peptide with a sequence ofLVTDLYK was selected as the quantification tag from trypticdigests of BSA. This peptide was selected because the signalintensity was relatively high and undigested fragments were notidentified in LC-MS analysis. In addition, the peptide did notcontain Gln at its N terminus nor Met or Cys in the sequence,which can be nonenzymatically converted to pyroglutamic acid,and oxidized Met and Cys, respectively.The resultant peptide (cell-free product-3) (Fig. S1A) was syn-
thesized in the PURE system containing stable isotope-labeledlysine, and then the products were subjected to tryptic digestion.The quantification of the quantification tag was performed byusing both the chemically synthesized LVTDLYK peptide andtryptic digests of commercially available BSA. The measuredvalues were almost identical between experiments, indicating thatboth materials can be used for quantification of cell-free products(Fig. S1D). Afterward, both the chemically synthesized LVTDLYKpeptide and the target peptide (DQFNVLIK) were mixed with thedigested cell-free product-3, and resultant mixtures were subjectedto the LC-MS analysis. Quantification of both quantification tagand target peptide by using chemically synthesized peptides asreferences showed that the amounts of these peptides were stoi-chiometrically equivalent, indicating that the quantified value ofthe quantification tag can be applied to the quantification of thetarget protein by using the target peptide as an internal standard(Fig. S1E). Other target peptides were also examined to demon-strate versatility in the developed workflow. The sequences of thetarget peptides were ILYISNQVASIFHCK (cell-free product-4)(Fig. S1A), containing cysteine that requires the reduction and al-kylation for the MS analysis, and EAGVEVVTENSHTLYDLDR(cell-free product-5) (Fig. S1A), a relatively long peptide. Thesepeptides are from the circadian clock proteins PER2 and CRY1,respectively. The results of LC-MS analyses demonstrated that themolar ratios between the quantification tag and the target peptidewere nearly 1:1, demonstrating versatility in the developed work-flow (Fig. S1E).
Selection of the Target Peptides Used for the MS-QBiC Workflow.Target peptides were selected from the tryptic digests of cellu-lar protein extracts or nuclear protein extracts from HEK293Tcells overexpressing each protein and detected by LC-MS/MSanalyses (Dataset S1). When not enough peptides were identi-fied by these analyses, peptides suitable for the use in the MS-QBiC workflow were selected from the sequence information ofthe original proteins (Dataset S2). The selection was according tothe following rules. The length of the target peptides was selectedto not exceed 17 residues to prepare the DNA template by PCRwithin two steps. Each peptide contained only a lysine or arginineresidue at its C terminus. Peptides containing methionine in thesequence or those containing glutamine at their N terminus wereavoided because they produce unexpected products containing ox-idized methionine or pyroglutamic acid. Peptides containing cyste-ine were permitted because we developed a protocol to convert thecysteine to its alkylated form almost completely by reduction andalkylation (SI Materials and Methods).
Quantification of Peptides for Common Region of Two Proteins andPeptides That Were Not Clearly Detected. Peptides for the commonregion of DEC1 (BHLHE40) and DEC2 (BHLHE41), CKIδ andCKIe, and DBP and TEF were successfully quantified (Fig. S5D).The time course of the peptides shared by DEC1 (BHLHE40) andDEC2 (BHLHE41) resembled closely that of DEC1 (BHLHE40).Quantification of DEC2 (BHLHE41) with peptides unique toDEC2 was unsuccessful. These observations suggest that the ex-pression level of DEC2 (BHLHE41) was much lower comparedwith DEC1 (BHLHE40). The amounts of peptides common forCKIδ and CKIe were closer to CKIδ, consistent with the expres-sion level of CKIδ that was 20-fold higher than that of CKIe. Thetime course for the peptide common to DBP and TEF was a sumof protein quantities for DBP and TEF, which is reasonable giventhat we detected unique peptides from both DBP and TEF.HLF, RORα, and RORβ could not be quantified similarly to
DEC2 (BHLHE41), suggesting a low expression level. However,signals that seemed to originate from HLF and RORα wereobserved, although signal/noise ratios were too close for quan-tification. Given this noisy signal, we estimated the copy numbersfor HLF and RORα as 3,400 and 1,280 copies/cell, respectively,without circadian variation (Fig. S5E). In contrast, we could notdetect any peak corresponding to RORβ, suggesting a low ex-pression level.
Protein Expression Phenotype in Clock Mutant Mice. The expressionsof CLOCK, DBP, TEF, REV-ERBα (NR1D1), REV-ERBβ(NR1D2), PER1, PER2, and PER3 were suppressed in Bmal1KO mice (Fig. S9). CLOCK may have been destabilized by theabsence of BMAL1, both of which form a heterodimer to play arole in activation of E/E′-Box promoters (Fig. 2A). Suppressedexpression of DBP and TEF (16), the transcription of which isregulated by the E/E′-box, may have been caused by the absenceof the CLOCK/BMAL1 heterodimer. Suppressed expression ofREV-ERBα (NR1D1), REV-ERBβ (NR1D2), PER1, PER2,and PER3, the transcription of which is regulated by either theE/E′-box or D-box (16), may have been caused by the absence ofthe CLOCK/BMAL1 or decreased expression of DBP/TEF/HLF.Suppression of the E/E′-Box promoters in BMAL1 KO mice mayhave also resulted in the continuous activation of the RRE pro-moters by the suppression of their repressors, REV-ERBα (NR1D1)and REV-ERBβ (NR1D2). By this activation, the expression ofE4BP4 (NFIL3), CRY1, DEC1 (BHLHE40), and RORγ, which are
Narumi et al. www.pnas.org/cgi/content/short/1603799113 1 of 14
regulated by the RRE promoters (16, 46), may have been activatedcompared with the wild-type mice, which may have resulted in thedisappearance of the circadian rhythmicity.The expression levels of each protein resembled each other in
Per1/2 KO and Cry1/2 KO mice, although there were subtledifferences between strains (Fig. S9). The expression of DEC1(BHLHE40), DBP, TEF, REV-ERBα (NR1D1), REV-ERBβ(NR1D2), and RORγ was elevated in both KO mice, suggestingthat the E/E′-Box promoters were activated by the absence oftheir repressors, PER1 and PER2 or CRY1 and CRY2. Theincreased level of DBP and TEF may have activated in turn theD-Box promoters, which may have resulted in the increasedexpression level of PER3. In contrast, the effect on the RREpromoters was complicated because levels of both repressors,REV-ERBα (NR1D1) and REV-ERBβ (NR1D2), and an acti-vator, RORγ, were increased. Considering that mild repressionof BMAL1, CLOCK, and E4BP4 (NFIL3) was observed, theRRE promoters may have been repressed to some extent.Thus, the quantified values of these proteins in diverse indi-
viduals can be beneficial for further study of those networks bysystems biological approaches using modeling and simulation.Wenote that some peptides corresponding to PER1 and PER2 werequantified to some extent even in Per1/2 KOmice. They may haveresulted from themethod of gene deletion, in which a large part ofthe promoter and exon regions still remain in this strain (35, 47).
SI Materials and MethodsAnimals.All mice were carefully kept and handled according to theRIKENRegulations for Animal Experiments. Eight- to 10-wk-oldmale mice of wild-type (C57BL/6N, Japan SLC) and mutant wereentrained under a 12 h–12 h light–dark condition (400 lx) for2 wk. After transferring to constant darkness, wild-type micewere killed every 4 h over 1 d (i.e., CT0, -4, -8, -12, -16, and -20)for proteomic analyses or every 4 h over 2 d (i.e., CT0, -4, -8, -12,-16, -20, -24, -28, -32, -36, -40, and -44) for qPCR analyses. Allmutant mice were killed in 4 and 16 h (i.e., CT4 and -16). Liverswere excised and then quickly frozen in liquid nitrogen followedby storage at −80 °C. The mutant mice, all of which displayed acircadian arrhythmic behavior in constant darkness, were Bmal1knockout mice (Bmal1 KO), Per1/Per2 double knockout mice(Per1/2 DKO), and Cry1/Cry2 double knockout mice (Cry1/2DKO), which were originally generated by Shimba et al. (34),Bae et al. (35), and van der Horst et al. (36), respectively.
Preparation of Chemically Synthesized Peptides. Four pep-tides (DQFNVLIK, LVTDLYK, ILYISNQVASIFHCK, andEAGVEVVTENSHTLYDLDR) and 10 phosphopeptides shownin Fig. S5C were synthesized with a peptide synthesizer SyroWave (Biotage) using Fmoc solid-phase chemistry. Concentra-tions of the synthesized peptide were measured by an aminogroup determination method (48).
Preparation of MS-QBiC Peptides. A DNA sequence (5′-ATG-GACTACAAGGACGACGACGACAAGCTGCTGCTG-CTGAAGCTGGTTACTGACCTGACTAAG-3′) that en-codes a FLAG tag, spacer peptide, and a quantification tag(MDYKDDDDKLLLLKLVTDLTK) was cloned into a pURE1vector (BioComber) containing a T7 promoter sequence and theribosome-binding site (Shine-Dalgarno sequence). Using theresultant plasmid as a template, templates for MS-QBiC peptidesynthesis were amplified by PCR with a T7 promoter primer(5′-GGGCCTAATACGACTCACTATAG-3′) as a forward primerand appropriate reverse primers listed in Dataset S2. PCR mixtures(2.5 μL) were directly added to yield 25 μL PURE system reactionmixtures (49) containing 13C6
15N4 L-Arginine and 13C6 L-Lysine(Thermo Scientific) as a substitute for nonlabeled L-Arginine andL-Lysine, respectively. The mixtures were incubated at 37 °C for30 min, and then synthesized peptides were purified using anti-FLAG
M2 Magnetic Beads (Sigma Aldrich) according to the manufac-turer’s instruction. The peptides were eluted with 20 μL 0.2% tri-fluoroacetic acid (TFA) solution, and then they were diluted sixtimes with phase-transfer surfactant (PTS) buffer (12 mM sodiumdeoxycholate, 12 mM sodium N-lauroylsarcosinate, and 50 mMNH4HCO3) and stored at −80 °C until used. Peptides that were notsubjected to enzymatic digestion were diluted twice with water andstored. For quantification of the peptide using the quantificationtag, 5 μL of the diluted solution was mixed with 1 pmol ofLVTDLYK peptide with three technical replicates.
Preparation of Cell/Nuclear Lysates from HEK293T Cells. All of thecircadian clock genes used in this study [Dec1 (Bhlhe40), Dec2(Bhlhe41), Bmal1 (Arntl), Clock, Cry1, Cry2, CKIδ, CKI«, Dbp,Tef, Hlf, E4bp4 (Nfil3), Rev-Erbα (Nr1d1), Rev-Erbβ (Nr1d2),Per1, Per2, Per3, Rorα, and Rorγ] except for Rorβ (isoform 1)were subcloned into the pMU2 vector (50) and expressed underthe CMV promoter as a FLAG-tag fusion form in their N terminus.Rorβ was subcloned into the pCMVTnT vector (Promega) andexpressed under the CMV promoter. The genes were derived froma mammalian gene collection library [Dec1 (Bhlhe40), CKIδ, andRorα] and an NIH 3T3 cDNA library [CKI«, Dbp, Tef, Hlf, E4bp4(Nfil3), Rev-Erbα (Nr1d1), Rev-Erbβ (Nr1d2), Rorγ, and Rorβ]. AcDNA collection for Bmal1 (Arntl), Clock, Cry1, Cry2, Per1, Per2,and Per3 is a kind gift from Hajime Tei (Kanazawa University,Kanazawa, Japan) and cDNA of Dec2 (Bhlhe41) is a kind gift fromKen-ichi Honma and Sato Honma (Hokkaido University, Sapporo,Japan). For the expression of the genes, HEK293T cells weregrown in DMEM (Invitrogen) supplemented with 10% (vol/vol)FBS (JRH Biosciences) and antibiotics (25 U/mL penicillin and 25mg/mL streptomycin) (Invitrogen). At 24 h before transfection,cells were plated at 106 cells per well in 10-cm dishes. Transfectionwas performed with FuGene6 (Promega) according to the manu-facturer’s instruction. A total of 2 μg of each expression vector or amixture of 1 μg BMAL1 vector and 1 μg CLOCK vector wastransfected to the HEK293T cells on 10-cm dishes. After 48 h, cellswere collected by 0.25% trypsin–EDTA (Life Technologies)treatment. The cell pellets were lysed in 1 mL PTS buffer followedby extensive sonication. The cell lysates were then flash-frozen inliquid nitrogen and stored at −80 °C. For the detection of TEF,BMAL1, CLOCK, REV-ERBα (NR1D1), REV-ERBβ (NR1D2),and RORγ, we also performed nuclear isolation from the cellpellet. The cell pellet was suspended with 1 mL of the following fivebuffers (and at each time collected by centrifugation at 1,500 × g for5 min): Buffer #1—DPBS (Life Technologies); #2 and #3—NB(10 mM Tris·HCl, pH 7.0, 10 mM NaCl, 3 mMMgCl2, and 30 mMsucrose) supplemented with 0.5% (vol/vol) Nonidet P-40; #4 and#5—NB + 10 mM CaCl2. The resultant pellet, mainly consisting ofnuclei, was lysed in 1 mL PTS buffer followed by extensive sonica-tion. The cell lysates were then flash-frozen in liquid nitrogen andstored at −80 °C.
Enzymatic Digestion. Enzymatic digestion of MS-QBiC peptides,mouse liver samples, and cell/nuclear lysates fromHEK293T cellswas performed basically according to a PTS protocol as reportedearlier (51). Before the digestion, blocking treatment of test tubeswas performed for MS-QBiC peptides, in comparatively lowerpeptide concentration, by reducing nonspecific adsorption ofpeptides. Enolase from Baker’s yeast (Sigma Aldrich) was sub-jected to the enzymatic digestion using Lysyl Endopeptidase(LysC, Wako Pure Chemical Industries) as described below.Digests (0.2 μg/μL) in a PTS buffer were added to new tubes andwere incubated at 4 °C overnight, followed by discarding of thecontents. A sample in a PTS buffer was reduced with 10 mM TCEPat 37 °C for 1 h and then alkylated with 15 mM iodoacetamide at37 °C for 30 min in case it contained cysteine residues. The resultantsample was diluted five times with 50 mM NH4HCO3 solution.Predigestion was performed by the addition of LysC at 2 ng/μL
Narumi et al. www.pnas.org/cgi/content/short/1603799113 2 of 14
(MS-QBiC peptides), 1:50 (wt/wt) (mouse liver samples), or1:100 (wt/wt) (cell/nuclear lysates from HEK293T), which were in-cubated at 37 °C for 8 h. Subsequently, digestion was performed bythe addition of same amounts of trypsin (Roche) as of LysC, whichwere incubated at 37 °C for 16 h. After the digestion, an equalvolume of ethyl acetate was added to the sample, which was acid-ified with 0.5% TFA to transfer the detergents into an organicphase. After the sample was centrifuged at 10,000 × g for 10 min atroom temperature, an aqueous phase containing peptides was col-lected and dried with SpeedVac (Thermo Scientific). The samplewas dissolved in a solution containing 2% acetonitrile and 0.1%TFA, and then it was desalted by using self-prepared stage tips (52)(MS-QBiC peptides and cell/nuclear lysates from HEK293T cells)or 1 cc Oasis HLB cartridge (10 mg sorbent; Waters) (mouseliver samples), which was dried again with SpeedVac and storedat −80 °C until use.
Prefractionation of Mouse Liver Samples with SCX Chromatography.Digested mouse liver samples were prefractionated into 18fractions by SCX chromatography as follows: The dried peptidemixtures were dissolved in 500 μL of a SCX-A (25% acetonitrileand 10 mM H3PO4, pH 2.7). A total of 200 μL of the solutionwas applied to a PolySULFOETHYL A column (100 × 2.1 mm,5-μm particles with a 300-Å pore diameter; PolyLC) using theElite LaChrom HPLC system (Hitachi). Using two mobile pha-ses, SCX-A and SCX-B (1 M KCl, 25% acetonitrile, and 10 mMH3PO4, pH 2.7), peptides were eluted with a gradient (0% B for3 min, 0–7% B in 25 min, 7–22% B in 12 min, 22–65% B in7 min, 40–100% B in 4 min, and 100% B for 5 min, 200 μL/min).The elution was collected every 1 min up to 60 min, and theresulting 60 fractions were dried with SpeedVac. Then they weredissolved in a solution containing 2% acetonitrile and 0.1% TFAand combined into 18 fractions as shown in Fig. S4A. Resultantfractions were desalted by using self-prepared stage tips (52),dried again with SpeedVac, and stored at −80 °C until use.
Mass Spectrometers.Two types of mass spectrometers were used inthis study. One was an Orbitrap mass spectrometer (positivemode, scan range of 350–1,500 m/z, 30,000 FWHM resolution at400 m/z, LTQ Orbitrap Velos Pro mass spectrometer, ThermoScientific), which was used for a high-resolution full-scan analysis.The other was a triple quadruple mass spectrometer (positive mode,scan width of 0.002 m/z, Q1 and Q3 resolutions of 0.7 FWHM, acycle time of 1 s, a gas pressure of 1.8 mTorr, TSQ Vantage EMRmass spectrometer, Thermo Scientific), which was used for SRManalyses. Both of them were equipped with a nanoLC interface(AMR), a nano-Advance UHPLC system (Bruker Daltonics), andan HTC-PAL autosampler (CTC Analytics) with a trap column(0.3 × 5 mm, L-column, C18; Chemicals Evaluation and ResearchInstitute). Analytical samples were separated by reversed-phasechromatography in which we used a home-made capillary column(length of 200 mm and inner diameter of 100 μm) packed with 2 μmC18 resin (L-column 2, Chemicals Evaluation and Research In-stitute) using two mobile phases of RP-A (0.5% acetic acid) andRP-B (0.5% acetic acid and 80% acetonitrile). Elution was directlyelectrosprayed (2.4 kV) into the MS.
Mass Spectrometric Analyses of MS-QBiC Peptides and Cell/NuclearLysates from HEK293T Cells.To develop and examine the MS-QBiCworkflow, in vitro-synthesized MS-QBiC peptides or their trypticdigests were analyzed with both the Orbitrap mass spectrometerand the triple quadrupole mass spectrometer. Analytical sampleswere separated with a linear gradient from 15 to 40 min at a flowrate of 300 nL/min using RP-A and RP-B. Tryptic digests of cell/nuclear lysates from HEK293T cells were analyzed with theOrbitrap mass spectrometer to identify expressed circadian clockproteins. Analytical samples were separated with a linear gradientfor 210 min at a flow rate of 300 nL/min using RP-A and RP-B.
The MS scans to analyze precursor ions were performed in theOrbitrap mass analyzer, and then the MS/MS scans to analyzefragment ions were performed in the LTQ mass analyzer whereeach of the most intense precursor ions (up to top 10) was isolatedand fragmented by collision-induced dissociation (CID) with thenormalized collision energy (35%). The CID raw spectra wereextracted using Proteome Discoverer 1.3 (Thermo Scientific) andsearched against the mouse International Protein Index (IPI)database (version 3.87) using Mascot (v2.3, Matrix Science) withfollowing settings: The parameter of the cleavage was set to trypsinand the missed cleavage was allowed up to 1. The mass toleranceswere set to 5 ppm for precursor ion and 0.6 Da for fragment ion,respectively. On the conditions of the modification, we set carba-midomethylation at cysteine as fixed modification and oxidation atmethionine as variable (nonfixed) modification. The significancethreshold of P < 0.05 was set. The list of the identified peptides incircadian clock proteins is indicated in Dataset S1.
Development of SRM Methods. Optimal SRM methods containingSRM transitions (from three to five per peptide), which wererepresented as specific pairs of m/z values associated with pre-cursor and fragment ions, and collision energies (CE) associatedwith each SRM transition were developed by LC-SRM/MSanalyses of tryptic digests containing MS-QBiC peptides and1 pmol of LVTDLYK using primary SRM transitions developedas follows: For m/z values of precursor ions, those of both thedoubly and triply charged ones were used. For m/z values offragment ions, those of singly charged y3 to yn−1 were used if theprecursor ion was doubly charged (n represents the number ofresidues of the precursor ion). If the precursor ion was triplycharged, values of both singly and doubly charged y3 to yn−1 wereused. In the case in which the precursor ion was short enough(n ≤ 10), b ions were also used according to the same rule as yions. Primary CE for each SRM transition was determined ac-cording to the following formulas, as previously reported (17):CE = 0.034 × m/zprecursor − 0.848 for doubly charged precursorions and CE = 0.022 × m/zprecursor + 5.953 for triply chargedprecursor ions. Up to 10 candidate transitions with strong in-tensities were selected from SRM chromatograms obtained byprimary SRM transitions using Pinpoint software (version 2.3.0;Thermo Scientific). Optimization of CE was further performed foreach candidate transition by the LC-SRM/MS analyses accom-panied with seven CE values (primary CE, primary CE ± 2 eV,primary CE ± 4 eV, and primary CE ± 6 eV). Obtained chro-matograms were analyzed and the best CE for each transition wasdetermined. Finally, up to five transitions per peptide were de-veloped as optimal SRM methods. A total of 574 SRM transitions(1,149 transitions for light and heavy peptides) was obtained for120 target peptides.
Quantification of Circadian Clock Proteins with SRM. Prefractionatedmouse liver samples by the SCX chromatography were analyzedfor quantification of circadian clock proteins. If no target peptidewas detected in the first 3 fractions from 18 fractions, theremaining 15 fractions were analyzed. The dried peptide mixtureswere dissolved in 10 μL of a solution containing 2% acetonitrileand 0.1% TFA. A total of 2 μL of each sample was applied to thetriple quadruple mass spectrometer and analyzed with usingdeveloped SRMmethods. Samples were separated with a gradientusing RP-A and RP-B (5–45% B in 50 min, 45–95% B in 1 min,95% for 2 min, 95–5% B in 1 min, and 5% B for 6 min) at a flowrate of 300 nL/min. After each run, 30 min washing of the LC lineand equilibration of the analytical column for the next run wereperformed. SRM chromatograms for each SRM transition wereextracted using Qual Browser of Xcaliber 2.2 (Thermo Scientific).Quantification of the target peptides was performed by using thepeak with the highest ratio of signal to noise in the peaks, which
Narumi et al. www.pnas.org/cgi/content/short/1603799113 3 of 14
was associated with one target peptide and not overlapped bynoise peaks.
Analysis of Digestion Efficiency and Specificity of Several Proteases.Enzymatic digestion of BSA was performed according to a PTSprotocol as reported earlier (51). BSA (20 μg) in a PTS buffer wasreduced with 10 mM TCEP at 37 °C for 1 h and then alkylatedwith 15 mM iodoacetamide at 37 °C for 30 min in the dark. Theresultant sample was diluted five times with a 50-mM NH4HCO3solution. Enzymatic digestion was performed using several condi-tions in addition to the same condition with liver proteins to com-pare several proteases where 1:50 (wt/wt) of Trypsin, 1:50 (wt/wt)of LysC, 1:50 (wt/wt) of chymotrypsin (Princeton Separations), or1:20 (wt/wt) endopeptidase Glu-C (New England BioLabs) with0.5 mM Glu-Glu, respectively, was added and followed by a 24-hincubation at 37 °C. After the digestion, peptide mixtures wereextracted using ethyl acetate and TFA as described above and de-salted by using self-prepared stage tips (52). BSA digests (100 fmol)were subjected to LC-MS/MS analysis. The data were analyzed byProteome Discoverer 1.4 (Thermo Scientific) and Mascot (v2.3,Matrix Science) using the bovine IPI database (v3.73): The pa-rameter of the cleavage was set to each protease or none, whichmeans searching for nonspecific cleavage, and missed cleavageswere allowed up to 7. The mass tolerances were set to 5 ppm forprecursor ion and 0.6 Da for fragment ion, respectively. On theconditions of the modification, we set carbamidomethylation atcysteine as a fixed modification and oxidation at methionine mod-ification and pyroglutamylation at N-terminal glutamine as variable(nonfixed). The hit with an ion score >20 was adopted by a peptidespectrum match (PSM).
Detection of Phosphorylated Peptides.Analyses of phosphorylationof peptide-1 and peptide-3 from CKIδ and peptide-1 from CKIe(Fig. S5A) were performed by a targeted proteomics approachusing isotope labeling with chemical dimethylation according tothe previous report (53). Chemically synthesized 10 phospho-peptides (Fig. S5C) were dimethyl-labeled with isotope-labeledformaldehyde (13CD2O, ISOTEC) to introduce heavy isotopes.They were dissolved in 2% acetonitrile and 0.1% TFA andstored at −80 °C until use. Enzymatically digested mouse liversamples including 2 mg of proteins were dimethyl-labeled withformaldehyde (Sigma-Aldrich) on solid-phase extraction cartridges[solid phase extraction (SPE) cartridges, Oasis HLB 30 mg, Wa-ters]. The samples eluted from the SPE cartridges were combinedwith 10 isotope-labeled phosphopeptides that were diluted with thesolution containing 50 ng/μL Enolase digest, 2% acetonitrile, and0.1% TFA. The resultant mixtures were applied to Fe-IMAC(Immobilized Metal Ion Affinity Chromatography) according to aprevious report (54) to enrich the phophopeptides and then sub-jected to the SRM analysis. The developed SRM methods forthose phosphopeptides are shown in Dataset S2.
RNA Expression Analysis of Circadian Clock Genes by qPCR. ThemRNA-level expression profiles of circadian clock genes weremeasured by qPCR. Mouse livers were sampled every 4 h over 2 d(n = 2). Total RNA was prepared from the livers at each timepoint using TRIzol reagents (Life Technologies) according to themanufacturer’s instructions. The cDNA was synthesized from0.25 μg of total RNA with random hexamer (Promega) and Su-
perScript II Reverse Transcriptase (Life Technologies) accordingto the manufacturer’s instructions. The qPCR was performedusing QuantStudio7 Real-Time PCR System (Life Technologies)and SYBR Premix Ex Taq GC (TaKaRa). Samples contained 1 ×SYBR Premix Ex Taq, 0.8 μM primers, and 1/20 synthesizedcDNA in a 10-μL volume. PCR conditions were as follows: 1 minat 95 °C, then 45 cycles of 15 s at 95 °C, and 1 min at 59 °C.Absolute cDNA abundance was calculated using the standardcurve obtained from mouse genomic DNAs. Tbp expression levelswere quantified and used as the internal control (55). Oligonu-cleotide sequences of qPCR primers for the circadian clock genesare described in Dataset S2.
Phase Determination of Peptide and mRNA Levels by Cosine CurveFitting. To assess the circadian rhythmicity and determine thephases for peptides and mRNA, 24-h cosine curve fitting to thetime-course data of each peptide and mRNA was performed.Pearson’s correlations between the time-series data of eachpeptide and 24-h period cosines with different peak times at10-min intervals were calculated, and then the best-fit cosinecurve that gave a maximum Pearson’s correlation was selected.Circadian rhythmicity of each peptide and mRNA was evaluatedby a permutation test.
BT Detection by Molecular Timetable Methods. Estimation of bodytime by using expression profiles of circadian clock proteins wasperformed according to the molecular timetable methods asreported previously (31). The timetable was created by using thecalculated phases ti (i = 1 . . . 36) for 36 peptides from 14 cir-cadian clock proteins, which showed circadian rhythmicity by24-h cosine curve fitting. Using the timetable, we estimated thebody time as follows: We normalized an absolute amount Xi (i =1 . . . 36) of the peptide i (i = 1 . . . 36) by using its average μi andSD σi. The normalized expression level Yi is described as follows:Yi = (Xi − μi)/σi. We created an expression profile {ti, Yi} (i =1 . . . 36) composed of the peak time ti of peptide i and itsnormalized expression level Yi. To estimate the BT of an ex-pression profile, we calculated the Pearson’s correlation over thepeptides (i = 1 . . . 36) between an expression profile {ti, Yi} and a24-h cosine curve {ti, √2 Cos(2π(ti − b)/24)} with a peak timeb (0 ≤ b < 24). We prepared 24-h cosine curves with a peak timeb from 0 to 24 h in increments of 10 min. We then selected thebest-fit cosine curve that gave a maximum Pearson’s correlation(c) and body time (bc). Then we evaluated the statistical signif-icance of the maximum Pearson’s correlation as follows: We firstgenerated random expression data by obtaining the sum of a24-h period cosine at random time [√2 Cos(2π(tr − bi)/24)]and a measurement noise (Ni), where tr represents randomtime (0 ≤ tr < 24). Ni was a randomly selected value in the noisedata set of the each peptide, which were obtained by subtracting thecalculated values [√2 Cos(2π(ti − bc)/24)] from the experimentalvalues (Yi) over the indicated time points. For the random expres-sion data, we evaluated a maximum Pearson’s correlation. We re-peated this procedure 10,000 times to create the distribution ofmaximum Pearson’s correlations. The statistical significance(P value) was determined by dividing the number of greater cor-relations obtained from random expression data than the correla-tion obtained from the experimental expression data by 10,000.
Narumi et al. www.pnas.org/cgi/content/short/1603799113 4 of 14
RT: Retention Time [Formyl:N-term]: Formylation of the N-terminal amino acid[oxidation]: Oxidation of the amino acid
Fig. S1. Examination and validation of the MS-QBiC workflow. (A) Amino acid sequences of test peptides used for the examination and validation ofthe MS-QBiC workflow. (B) LC-MS analysis of the synthesized cell-free product-1. A base peak chromatogram of the purified peptide and a massspectrum of the ion peak with highest intensity (Inset) are shown. The table indicates three identified peptides that correspond to the three ion peaksin the chromatogram. (C ) Effect of spacer sequence on the tryptic digestion efficiency. Digestion efficiency was calculated as the ion peak intensities ofthe digested peptide divided by the sum of those of the digested and undigested peptide. (D) Measuring the abundance of the quantification tag.Stable isotope-labeled cell-free product-3 was mixed with chemically synthesized LVTDLYK peptide (BSA peptide) or the tryptic digests of commerciallyavailable BSA. Concentration of the quantification tag was determined by comparing ion peak intensities of the stable isotope-labeled quantification
Legend continued on following page
Narumi et al. www.pnas.org/cgi/content/short/1603799113 5 of 14
tag with nonlabeled peptides. (E ) Validation of the quantification of a target peptide. Stable isotope-labeled cell-free product-3, -4, and -5 were mixedwith the chemically synthesized target peptides DQFNVLIK (DQF), ILYISNQVASIFHCK (ILY), and EAGVEVVTENSHTLYDLDR (EAG), respectively. Con-centration of the target peptide was determined by comparing ion peak intensities of the stable isotope-labeled target peptide with nonlabeledpeptides.
target peptideFLAG-tag quantification-tagspacer
Tryptic digestion
LC-MS
DQFNVLIK (Target)LVTDLTK (Known concentration)+
+
MDYKDDDDK*LLLLK*LVTDLTK*DQFNVLIK*
Quantification of target peptideQuantification of MS-QBiC peptideLVTDLTK*LVTDLTK DQFNVLIK*DQFNVLIK
392 394 396 398 400 4020
4
8
12
16395.240
398.249
395.741
398.751
396.242
LVTDLTK*LVTDLTK
486 488 490 492 494 4960
1
2
3
4
5 488.777
489.278491.786
492.288489.779
DQFNVLIK*DQFNVLIK
m/z m/z
Inte
nsity
(×10
6 )
Inte
nsity
(×10
7 )
Fig. S2. Peptide quantification by the MS-QBiC method. Quantification of the quantification tag and the target peptide using LC-MS. Purified MS-QBiCpeptide (Upper) was digested by trypsin. The quantification tag was quantified by comparing ion peak intensities of the stable isotope-labeled quantificationtag with those of the chemically synthesized quantification tag (Lower Left). The target peptide was quantified by comparing the stable isotope-labeled targetpeptide with the nonlabeled target peptide (Lower Right). The target peptide was derived from CLOCK, a circadian protein.
Narumi et al. www.pnas.org/cgi/content/short/1603799113 6 of 14
Fig. S3. Application of the MS-QBiC workflow to the SRM analysis. (A) Development of the primary SRMmethod for screening of optimal SRM transitions. Thetable shows an example for cell-free product-1. Optimal SRM transitions for LVTDLTK and LVTDLTK* (the asterisk indicates that the amino acid is isotope-labeled) to quantify the MS-QBiC peptide and primary SRM transitions for DQFNVLIK* to quantify the target peptide are shown in the table. The primarytransitions were developed as follows: Both doubly and triply charged monoisotopic precursors for the target peptide were considered. For the doubly chargedprecursors, singly charged monoisotopic products y3 to yn−1 were monitored (n represents the number of residues of the peptide). For the triply chargedprecursors, both singly and doubly charged monoisotopic products y3 to yn−1 were monitored. In the case that the peptide was short enough (n ≤ 10), b ionswere used according to the same rule as y ions. (B) SRM chromatograms of LVTDLTK (Upper Top), LVTDLTK* (Upper Middle), and DQFNVLIK* (Upper Bottom).(C) Optimization of collision energy for each SRM transition. (D) Quantification of the target peptide in a mouse liver using LC-SRM. The SRM transitions(Upper) were developed by using purified MS-QBiC peptide. The target peptide was quantified by comparing ion peak intensities of the fragment peptidesfrom the stable isotope-labeled target peptide (Lower ) with the nonlabeled target peptide in mice livers (Lower). CE, collision energies.
Narumi et al. www.pnas.org/cgi/content/short/1603799113 7 of 14
Fig. S4. Prefractionation of tryptic digests composed of cellular protein extracts from mice livers and MS-QBiC peptides using SCX chromatography. (A) Achromatogram of the tryptic digests separated with the SCX chromatography. Numbers above the chromatogram indicate numbers of the SCX fractions.(B) Examples of the SRM chromatogram. SRM chromatograms of FSQGQQLVTK* (SRM-ID 21, Upper) contained in the SCX fractions from no. 4 to no. 10 andthose of YFGSIDSSENNHK* (SRM-ID 91, Lower) in the fractions from no. 11 to no. 17 are shown. (C) Distribution of the signal intensities corresponding to thetarget peptides originated from the MS-QBiC peptide in the SCX fractions from no. 3 to no. 18. A red color indicates that the corresponding signal was detectedin the fraction. Black rows indicate that the signal was not able to be detected in any fraction.
Narumi et al. www.pnas.org/cgi/content/short/1603799113 8 of 14
Fig. S5. A summary of the expression levels of each peptide. (A, B, D, and E) Concentrations are expressed as attomol per microgram of lysate (Left axis) orcopies per cell (Right axis). Copy numbers were calculated by estimating a total amount of proteins per cell is 0.5 ng (19). (A) Quantification of each of thepeptides from a protein. Time courses of the quantified peptides arranged according to their parental proteins are shown. The correspondence of detectedpeptides to plots is shown in Dataset S2. (B) Time course of the quantified proteins calculated from two biological replicates. Closed circles indicate averagepeptide concentrations derived from same protein in each biological replicate. (C) SRM detection of phosphorylated peptide-1 and peptide-3 from CKIδ andpeptide-3 from CKIe. Monitored phosphopeptides are summarized in the table (Left). SRM chromatograms (Right) corresponding to peptides derived frommouse liver (Upper) and isotope-labeled internal standards (Lower) are shown. An asterisk (*) indicates that the peptides were not separated by chroma-tography and therefore could not be differentiated from each other in the chromatogram. (D) Quantification of peptides for common region of two circadian
Legend continued on following page
Narumi et al. www.pnas.org/cgi/content/short/1603799113 9 of 14
shown. The correspondence of detected peptides to plots is shown in Dataset S2. Gray lines indicate the time course of quantified parental proteins.(E) Quantification of peptides with low signal intensities. Time courses of the peptides for HLF and RORα are shown.
A D E F GC H K L MNI P Q S T VWR Y A D E F GC H K L MNI P Q S T VWR Y A D E F GC H K L MNI P Q S T VWR Y
A D E F GC H K L MNI P Q S T VWR Y A D E F GC H K L MNI P Q S T VWR Y
LysC and Trypsin Trypsin LysC
GluC Chymotrypsin
1,200
800
400
0
1,200
800
400
0
1,200
800
400
0
500
300
100
0
400
200
250
150
50
0
200
100
Num
ber o
f PS
Ms
Amino acid residue
B
Fig. S6. Digestion efficiency and specificity of alternative proteases. BSA digests, which were prepared by both trypsin and LysC (Lysyl Endopeptidase), trypsin,LysC, GluC (Glutamyl endopeptidase), or chymotrypsin, were analyzed by LC-MS/MS. The numbers of PSMs were classified by the number of incomplete di-gestions (A) to show efficiency and by the C-terminal amino acid residues of the identified peptides (B) to show specificity of selected proteases. The amino acidresidues specific to each protease are highlighted in red.
Narumi et al. www.pnas.org/cgi/content/short/1603799113 10 of 14
Fig. S7. Time course of the relative expression levels of mRNA for 20 circadian clock genes. Expression levels of each mRNA were quantified by qPCR with twobiological replicates.
Narumi et al. www.pnas.org/cgi/content/short/1603799113 11 of 14
Estimated time (h)(Statistical significance)(Statistical significance)
3.3(P < 0.0001)
3.7(P < 0.0001)CT4
16.5(P < 0.0001)
17(P < 0.005)CT16
Environment
19.3(P = 0.1136)
20.2(P = 0.1424)
20.5(P = 0.1889)CT4
Estimated time (h)
20.7(P < 0.05)
20.3(P = 0.055)
19.8(P = 0.1537)CT16
EnvironmentMice
Bmal1 KOWild-type
Mice
(Estimated time: 19.7 h, P = 0.0974) (Estimated time: 15.8 h, P < 0.0001) (Estimated time: 15.8 h, P < 0.0005)
Fig. S8. BT detection of wild-type and clock mutant mice by molecular timetable methods using a single-time-point data set. BT of (A) wild-type, (B) Bmal1KO, (C) Per1/2 DKO, and (D) Cry1/2 DKO mice at CT4 and CT16 was estimated using datasets of expression profiles of peptides. Data sets were obtained withtwo (wild-type) and three (mutant) biological replicates. Best-fit cosine curves (black) and those based on the actual circadian time point (gray) are shown. Thepeak time of the best-fit curves indicates the estimated BT, which is also shown with its statistical significance. Statistical significance was obtained by esti-mating the goodness of the Pearson correlation in the cosine curve fitting of the experimental profile by comparing with those of 10,000 random profiles(details are described in SI Materials and Methods). The colors, in ascending order from green to red to blue, represent the molecular peak time, whichcorresponds to the molecular timetable of each peptide. The color code is represented below the diagrams. CT was defined as “extrapolated entrained time ofmice in a LD cycle before sampling.” (E) Averaged expression profiles of peptides in Bmal1 KO, Per1/2 DKO, and Cry1/2 DKO mice at both CT4 and CT16[normalized expression levels at CT4 (n = 3) and CT16 (n = 3) are averaged]. Error bars indicate SDs. Parental proteins of each peptide are designated.
Narumi et al. www.pnas.org/cgi/content/short/1603799113 12 of 14
Fig. S9. Expression levels of circadian clock proteins in clock mutant mice. Livers from three knockout mice (Bmal1 KO, Per1/2 DKO, and Cry1/2 DKO) werecollected at CT4 and CT16 with three biological replicates. Relative concentrations of each peptide, in which the concentration was divided by the median valueof that across the circadian day in the wild type, are summarized according to parental proteins. Red and blue lines indicate the maximum and minimumconcentration of the peptides across the circadian day in wild type, respectively. CT was defined as “extrapolated entrained time of mice in a LD cycle beforesampling.”
Narumi et al. www.pnas.org/cgi/content/short/1603799113 13 of 14
Fig. S10. Expression profiles of peptides used for the BT detection of wild-type and mutant mice. Profiles of (A) wild-type, (B) Bmal1 KO, (C) Per1/2 DKO, and(D) Cry1/2 DKO mice in Fig. S8 are shown with a wider y-axis range. Best-fit cosine curves (black) and those based on the actual circadian time point (gray) areshown. The colors, in ascending order from green to red to blue, represent the molecular peak time, which corresponds to the molecular timetable of eachpeptide. CT was defined as “extrapolated entrained time of mice in a LD cycle before sampling.”