Mass Transfer- II CALEDONIAN COLLEGE OF ENGINEERING, SULTANATE OF OMAN 2017 - 2018 LABORATORY MANUAL Semester B Lab instructor: Bushra Salim Al Rahbi DEPARTMENT OF MECHANICAL & INDUSTRIAL ENGINEERING Module Leader Dr Anna Jesil Module Code ENCH 307
Transcript
Mass Transfer- II
CALEDONIAN COLLEGE OF
ENGINEERING, SULTANATE OF OMAN 2017 - 2018
LABORATORY MANUAL Semester B
Lab instructor:
Bushra Salim Al
Rahbi
DEPARTMENT OF MECHANICAL & INDUSTRIAL
ENGINEERING
Module Leader
Dr Anna Jesil
Module
Code
ENCH 307
ENCH 307 Mass Transfer- II A/c year 2017 - 18 Rev 11 Semester-B 2
Preface
There will be seven experiments in this module. The experiments are intended to
demonstrate the theoretical concepts learned from a practical point of view.
Emphasis will be on distillation, extraction, leaching and drying. Students are
expected to submit the log report weekly after each experiment and the completed
log reports will be collated and submitted at the end of the semester. Lab reports
have to be hand written with neat presentation of results, analysis and discussion.
Before the start of the experiment, the student must fill the risk assessment form and
get it signed by the concerned authority and submit it along with the log report.
ENCH 307 Mass Transfer- II A/c year 2017 - 18 Rev 11 Semester-B 3
Safety rules to be observed for Mass Transfer II (ENCH 307)
Semester B 2017 -18
Laboratory attendance is mandatory. The following rules must be observed at all times.
1. A lab coat, covered shoes, mask and gloves are to be worn while working in the laboratory.
2. Smoking, eating and drinking in the laboratory is not permitted at any time.
3. Any spilled or broken containers of chemicals should be immediately brought to the attention
of the instructor.
4. Any accident should be immediately reported to the instructor.
5. Sensitive and expensive instruments should be handled with proper care.
6. At the end of the experiment, students are requested to clean the equipment and keep the
glass ware in the appropriate places
7. After finishing the lab work, the equipment is to be switched off, power supply disconnected
and hands are to be washed th
8. Roughly with soap and water before leaving the laboratory.
ENCH 307 Mass Transfer- II A/c year 2017 - 18 Rev 11 Semester-B 4
TABLE OF CONTENTS
Experiment No. Title of the experiment Page No.
1 Packed Bed Distillation 5
2 Simple Distillation 10
3 Steam distillation 15
4 Liquid Liquid equilibrium 17
5 Solid liquid leaching 18
6 Tray Dryer 20
7 Adsorption studies 25
8 Packed bed extractor( Demo) 28
ENCH 307 Mass Transfer- II A/c year 2017 - 18 Rev 11 Semester-B 5
Experiment 1
PACKED BED DISTILLATION
AIM: To determine the number of theoretical plates equivalent to packed column height (HETP) using 1.
Fenske's equation and 2.McCabe-Thiele method
THEORY: Packed columns are often used for distillation, liquid –liquid extraction and humidification as well as for
gas absorption. For distillation, the gas phase is continuous and the liquid flows in rivulets over the
packing. A packed tower can be used as a fractionating column for either continuous or batch
distillation. The column height is usually based on the number of theoretical plates and the height
equivalent to a theoretical plate (HETP). In most cases the upper operating line is slightly steeper than
the equilibrium line and the reverse is true for the lower operating line. The pressure drop per
equivalent plate is generally less than that for a sieve or bubble cap tray, which is an important
advantage for vacuum operation. The smaller pairings have lower values of HETP but they also have
lower capacity and are not likely to be used in large columns.
Packed distillation towers can often be operated over moderate range of flow rates at nearly constant
separation efficiency. As the capacity parameter increases, both the liquid rate and vapor rate
increase because of which HETP is nearly constant. The HETP decreases in the loading region
because of the more rapid increase in liquid hold up and wetted area, bit it then increases sharply as
flooding is approached. With these high capacity packings, the rise in HETP is believed to be due to
the entrainment of the liquid. Structured sheet metal packings give slightly better separations than
dumped packings and the HETP values are nearly constant over a three to four fold range of flow
rates. The more efficient are the gauze type packings. The gauze is completely wetted even at low
flow rates and the HETP can be predicted from fundamental equations for mass transfer in wetted
channels. Low surface tension tends to increase the wetted area but too low values may lead to
foaming which increases HETP.
PROCEDURE: Methanol or ethanol may be used depending on the availability
A Preparing Calibration Chart
Step 1: Mix known volumes of Methanol-Water (0:5. 1:4, 2:3, 3:2, 4:1, 5:0) ml
Step 2: Determine the densities or refractive index (RI) of the mixtures by using specific
gravity bottle or Abbey refractometer,
Step 3: Determine the density or RI of pure methanol and water at room temperature.
ENCH 307 Mass Transfer- II A/c year 2017 - 18 Rev 11 Semester-B 6
Step 4: Convert the volume fractions into mole fractions of methanol (more volatile
component).
Step 5: A plot of density or RI (Y-axis) versus mole fraction of methanol (X-axis) is the
required calibration chart.
If density or RI is known mole fraction can be obtained from the calibration chart.
B Experiment part
Step 1: Fill the Reboiler with 2.5 litres of water and 2.5 litres of methanol.
Step 2: Allow water to pass through the condenser at a regulated flow rate.
Step 3: Switch on the heater and open the air vent of condenser.
Step 4: Operate the packed bed at total reflux for about 2 hour.
Step 5: Collect the distillate in a receiver.
Step 6: Note down the distillate temperature and residue temperature along with
rotameter readings
Step 7: Switch off the heater and cool the apparatus.
Step 8: Determine the density/refractive index of both residue and distillate.
OBSERVATIONS AND CALCULATION:
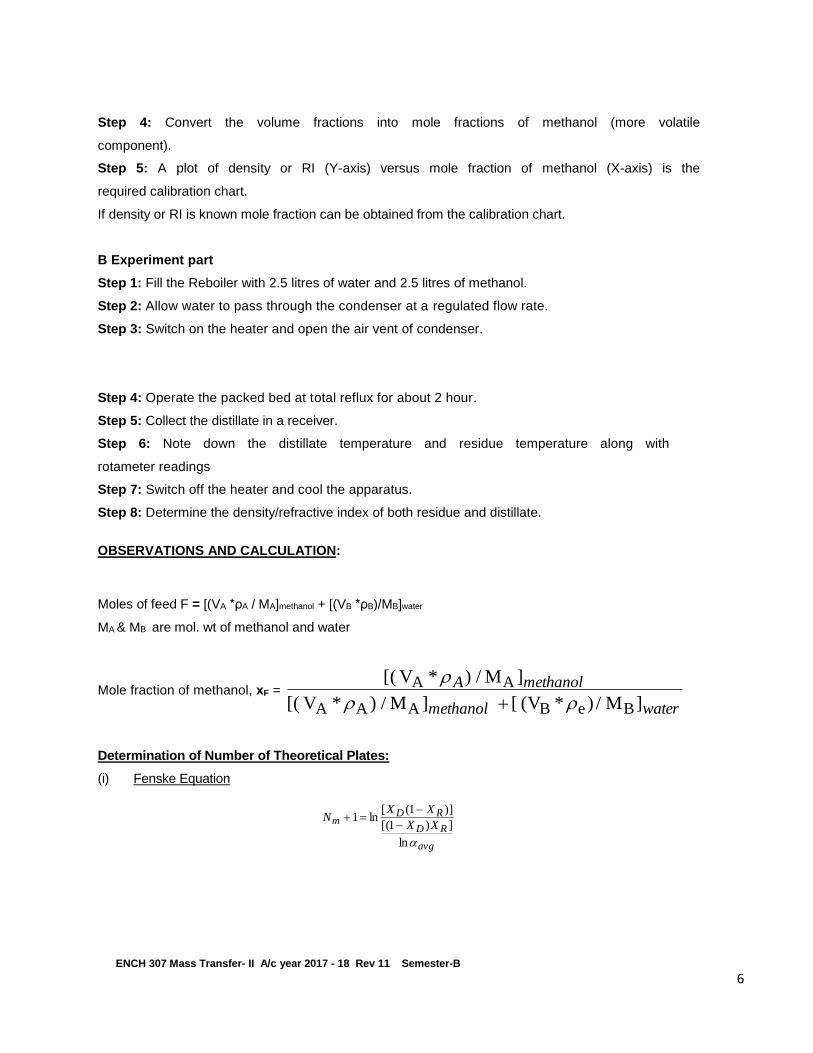
Moles of feed F = [(VA *ρA / MA]methanol + [(VB *ρB)/MB]water
MA & MB are mol. wt of methanol and water
Mole fraction of methanol, xF =
watermethanol
methanolA
]M /) * (V [ ]M / ) * V ([
]M / ) * V [(
BeB AAA
AA
Determination of Number of Theoretical Plates:
(i) Fenske Equation
avg
RD
RDm XX
XXN
ln
])1[(
)]1([ln1
ENCH 307 Mass Transfer- II A/c year 2017 - 18 Rev 11 Semester-B 7
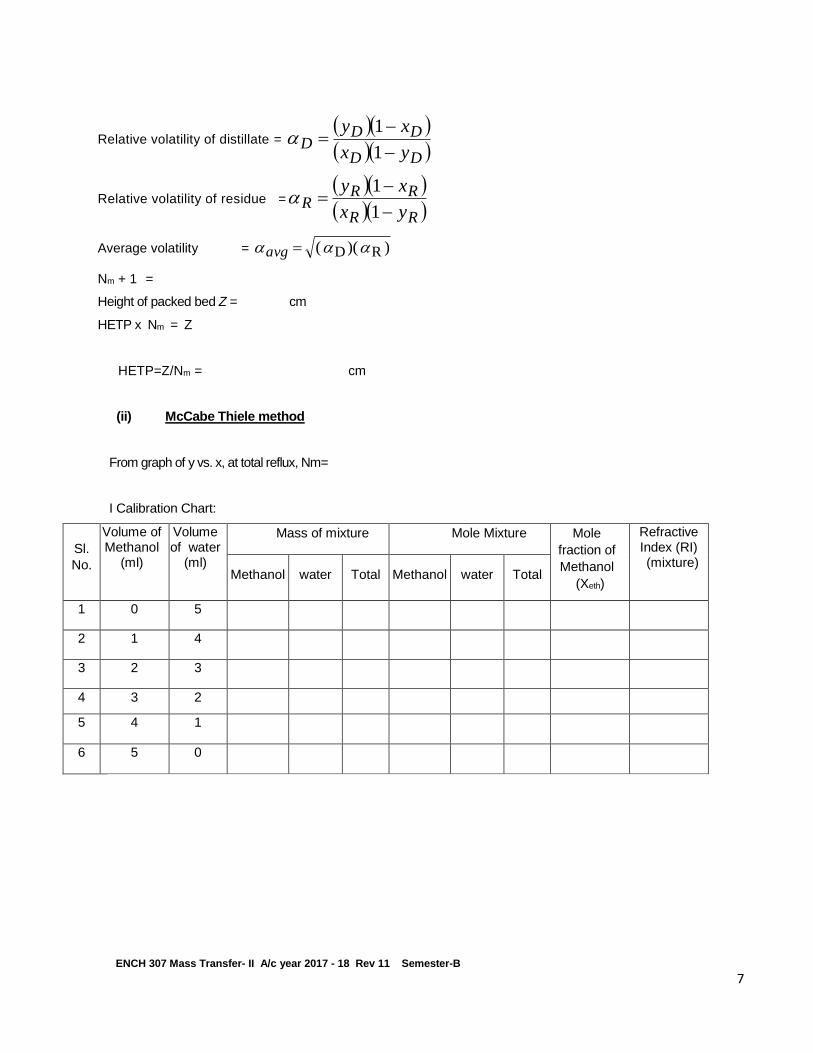
Relative volatility of distillate = DD
DDD
yx
xy
1
1
Relative volatility of residue = RR
RRR
yx
xy
1
1
Average volatility = ) )( ( RD avg
Nm + 1 =
Height of packed bed Z = cm
HETP x Nm = Z
HETP=Z/Nm = cm
(ii) McCabe Thiele method
From graph of y vs. x, at total reflux, Nm=
I Calibration Chart:
Sl.
No.
Volume of Methanol
(ml)
Volume of water
(ml)
Mass of mixture Mole Mixture Mole
fraction of
Methanol
(Xeth)
Refractive Index (RI) (mixture)
Methanol
water
Total
Methanol
water
Total
1 0 5
2 1 4
3 2 3
4 3 2
5 4 1
6 5 0
ENCH 307 Mass Transfer- II A/c year 2017 - 18 Rev 11 Semester-B 8
II. Equilibrium data for water methanol system:
Temp (oC)
x (mole f)
y (mole f)
100 0 0
98.4 0.012 0.068
96.9 0.02 0.121
95.8 0.026 0.159
95.1 0.033 0.188
94.1 0.036 0.215
92.2 0.053 0.275
90 0.074 0.356
88.6 0.087 0.395
86.9 0.108 0.44
85.4 0.129 0.488
83.4 0.164 0.537
82 0.191 0.572
79.1 0.268 0.648
78.1 0.294 0.666
76.5 0.352 0.704
75.3 0.402 0.734
74.2 0.454 0.76
73.2 0.502 0.785
72 0.563 0.812
70.9 0.624 0.835
69.2 0.717 0.877
68.1 0.79 0.91
67.2 0.843 0.93
66.9 0.857 0.939
65.7 0.938 0.971
65 1 1
Experimental data from the compilation by Gmehling, J. and Onken, U. 1977. Vapor-Liquid Equilibrium Data Collection, Dechema, Frankfurt,
Graphs: Calibration Chart:
ENCH 307 Mass Transfer- II A/c year 2017 - 18 Rev 11 Semester-B 9
RESULTS & DISCUSSIONS: (To be filled by the student performing the experiment)
Signature of Module leader/tutor
ENCH 307 Mass Transfer- II A/c year 2017 - 18 Rev 11 Semester-B 10
Experiment No: 2
SIMPLE DISTILLATION
AIM:-
To verify Rayleigh’s equation through simple distillation for a binary mixture of Methanol and
water.
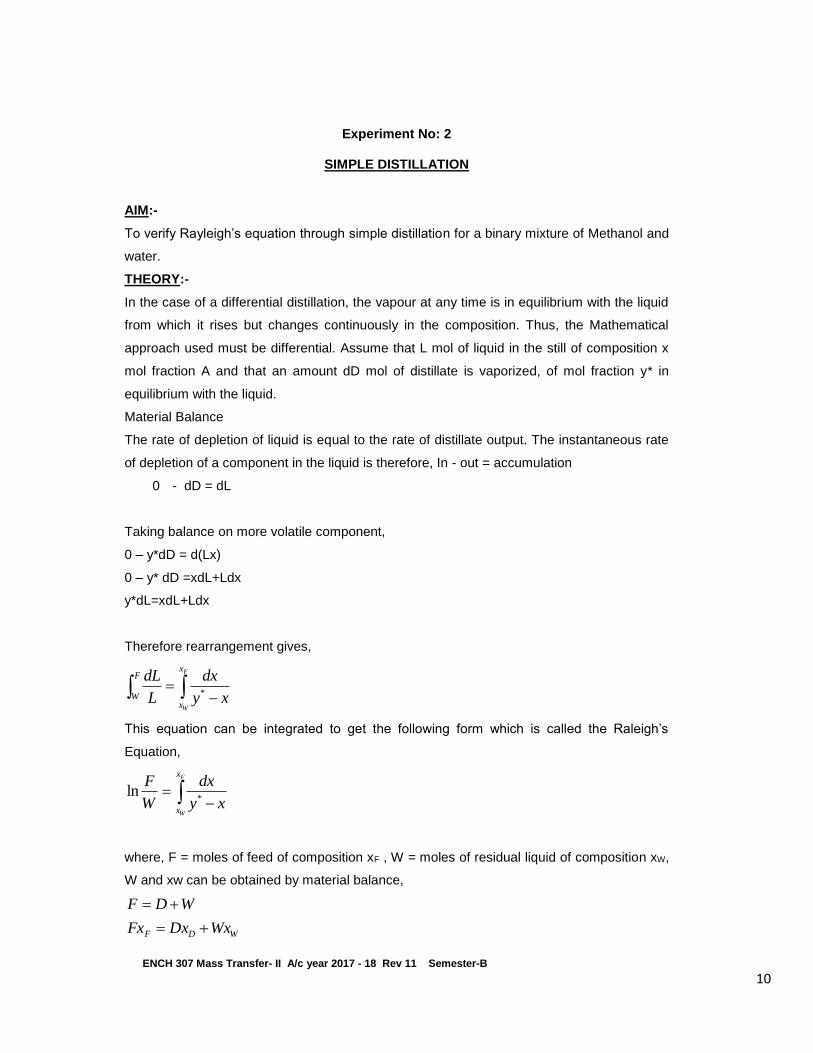
THEORY:-
In the case of a differential distillation, the vapour at any time is in equilibrium with the liquid
from which it rises but changes continuously in the composition. Thus, the Mathematical
approach used must be differential. Assume that L mol of liquid in the still of composition x
mol fraction A and that an amount dD mol of distillate is vaporized, of mol fraction y* in
equilibrium with the liquid.
Material Balance
The rate of depletion of liquid is equal to the rate of distillate output. The instantaneous rate
of depletion of a component in the liquid is therefore, In - out = accumulation
0 - dD = dL
Taking balance on more volatile component,
0 – y*dD = d(Lx)
0 – y* dD =xdL+Ldx
y*dL=xdL+Ldx
Therefore rearrangement gives,
F
W
x
x
F
W xy
dx
L
dL*
This equation can be integrated to get the following form which is called the Raleigh’s
Equation,
F
W
x
xxy
dx
W
F*
ln
where, F = moles of feed of composition xF , W = moles of residual liquid of composition xW,
W and xw can be obtained by material balance,
WDF WxDxFx
WDF
VO
M
ENCH 307 Mass Transfer- II A/c year 2017 - 18 Rev 11 Semester-B 11
The integral in Raleigh’s Equation, can be solved analytically (provided the relationship
between y* and x is available) or graphically (calculating the area under the curve for the
plot of 1/(y* − x) vs x.
PROCEDURE:-
Step 1: Take 500ml of methanol and 500ml of water in distillation still.
Step 2: Connect the water tap to the condenser and allow water flow through, then switch
on the heater.
Step 3: Heat the solution till 50% of the liquid in the flask is obtained as a distillate.
Step 4: Switch off the heater. Collect the residue & distillate.
Step 5: Note down the volumes of the distillate and residue.
Step 6: Prepare a calibration chart either by refractive index or by density of mixture in
different volume proportions versus mole fraction.
Step 7: Use this calibration chart to find out the composition of residue and distillate.
Step 8: Calculate the left and right hand side of Rayleigh’s equation and check whether they
are equal.
FORMULAE USED:
mass of water = density of water x volume of water
mass of Methanol = density of Methanol x volume of Methanol Moles of water =
Moles of Mthanol = Mass of Methanol/ Mol. Wt. Of Methanol
Total Moles = moles of water + moles of Methanol
Mole Fraction of Mthanol = Moles of Methanol/ Total Mole
Mole Fraction of water = moles of water
Total moles
waterOf Wt.Mol.
waterof mass
ENCH 307 Mass Transfer- II A/c year 2017 - 18 Rev 11 Semester-B 12
OBSERVATIONS
Sl. No. Description Data
1 Room Temperature (TR,
0C)
2 Density of Water at TR, (ρw , g/cc) 1.000
3 Density of Methanol at TR, (ρf , g/cc) 0.78860
4 Molecular Weight (MW) of Methanol (CH3OH) 32.04
5 Molecular weight (MW)of water (H2O) 18
118
6 Volume of Distillate (VD), ml
7 Volume of Residue (VR), ml
8 Mass/Weight of Distillate (mD), g
9 Mass/Weight of Residue (mR), g
10 Refractive Index of Distillate (RID)
11 Refractive Index of Residue (RIR)
12 Mole fraction of Distillate (XD) (from the calibration chart)
13 Mole fraction of Residue (XR) (from the calibration chart)
Plot a calibration chart by density/refractive index of mixture versus mole fraction of methanol.
I. CALCULATIONS (CALIBRATION DATA/CHART)
Sl.
No.
Volume of Methanol
(ml)
Volume of water
(ml)
Mass of mixture Mole Mixture Mole
fraction of
Methanol
(xmeth)
Refractive Index (RI) (mixture)
Methanol
water
Total
Methanol
water
Total
1 0 5
2 1 4
3 2 3
ENCH 307 Mass Transfer- II A/c year 2017 - 18 Rev 11 Semester-B 13
4 3 2
5 4 1
6 5 0
II. CALCULATIONS PART-A
Sl. No. Description Data
1 Volume of water, ml 500
2 Volume of Methanol, ml 500
3 Density of Water at TR, (ρw , g/cc) 1.0000
4 Density of Methanol at TR, (ρf , g/cc) 0.792
3 Moles of water in the feed (WF) = mass /MW
4 Moles of Methanol in the feed (MF) = mass /MW
5 Total moles in the feed (F) (Moles of water + Moles of Mthanol)
6 Mole Fraction of water in the feed (xW) = WF/ F
7 Mole Fraction of Methanol in the feed (xF) = MF/ F
8 Mole fraction of Methanol in the residue (xR)
(from the graph)
9 Mole fraction of water in the residue = (1- xR)
10 Average molecular Wt.of the residue (MWR)
[(Mol. Wt of water) (1- x) + (Mol.Wt of Methanol) (x)]
11
Total No. of moles in the residue (R)
12 Mole of water in the residue (WR) = R (1- xR)
13 Mole of Methanol in the residue (MR) = R (xR)
(NOTE: From the calibration chart (RI versus mole fraction of Methanol) we can obtain on
the mole fraction of Methanol in the residue)
(OVERALL MATERIAL BALANCE) In = Out
F = R + D, D = F – R = ___________
Where: F = Total no. of moles in the feed, R = Total no. of moles in the residue,
D = Total no. of moles in the distillate
residue theofMol.Wt Average
residue theofWeight
ENCH 307 Mass Transfer- II A/c year 2017 - 18 Rev 11 Semester-B 14
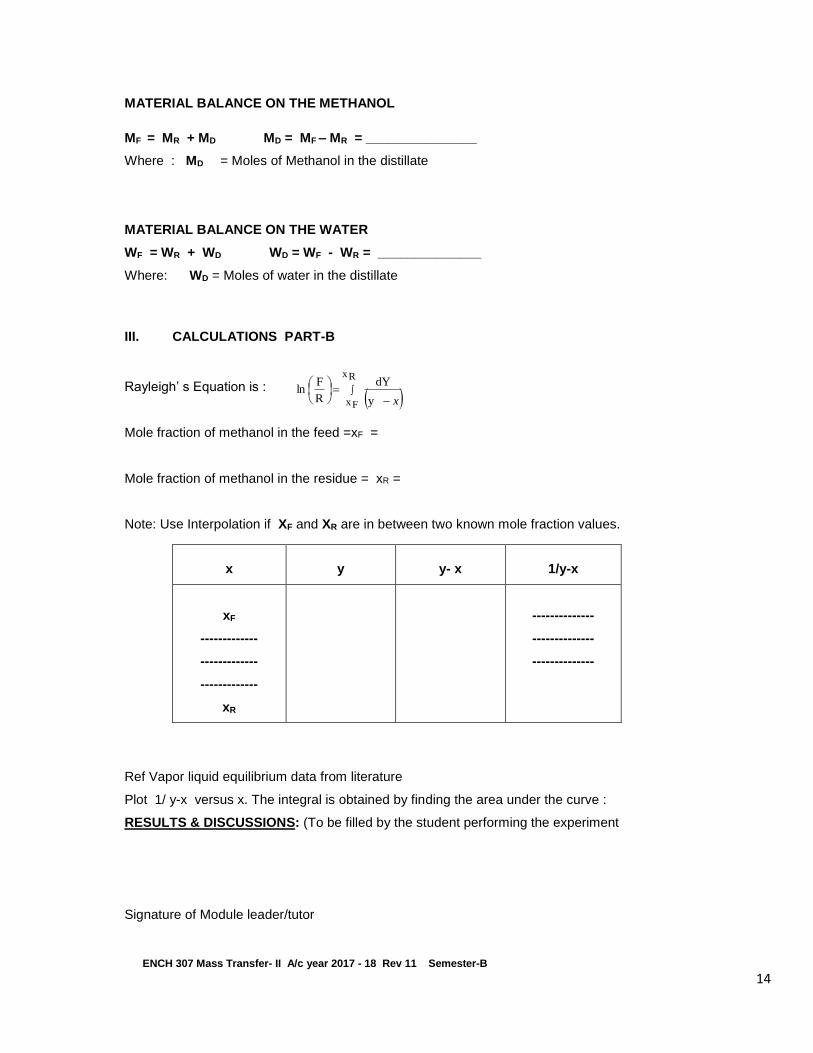
MATERIAL BALANCE ON THE METHANOL
MF = MR + MD MD = MF – MR = _______________
Where : MD = Moles of Methanol in the distillate
MATERIAL BALANCE ON THE WATER
WF = WR + WD WD = WF - WR = ______________
Where: WD = Moles of water in the distillate
III. CALCULATIONS PART-B
Rayleigh’ s Equation is :
Mole fraction of methanol in the feed =xF =
Mole fraction of methanol in the residue = xR =
Note: Use Interpolation if XF and XR are in between two known mole fraction values.
Ref Vapor liquid equilibrium data from literature
Plot 1/ y-x versus x. The integral is obtained by finding the area under the curve :
RESULTS & DISCUSSIONS: (To be filled by the student performing the experiment
Signature of Module leader/tutor
x y y- x 1/y-x
xF
-------------
-------------
-------------
xR
--------------
--------------
--------------
Rx
Fx y
dY
R
Fln
x
ENCH 307 Mass Transfer- II A/c year 2017 - 18 Rev 11 Semester-B 15
Experiment No: 3
STEAM DISTILLATION
AIM To verify the principle of immiscible liquid mixture boiling by steam distillation.
1. Check the water level in boiler and sump tank and then switch on the steam boiler.
2. Weigh 100ml of Turpentine and pour into the still through the funnel and close the
feed valve.
3. Switch on the pump and allow water to flow through the condenser.
4. Open slightly the steam outlet valve on the boiler.
5. The flow rate of the steam is maintained constant throughout the experiment.
6. The temperature inside the flask starts rising up and at a particular temperature it
remains constant. Note down this value as boiling point of mixture.
7. Collect the condensate in the given flask.
8. After the operation is over completed collect the residue in a separating funnel.
9. Transfer the distillate [receiving jar] into a separating funnel and allowed to settle
into two phases.
10. Separate the two phases of both residue and distillate and measure their volumes
and note them down.
CALCULATION 1) Volume of Turpentine (TP) = 100ml
Density of Turpentine = residue =
Mass of water in the distillate = Volume of water x density of water. Mass of TP in the distillate = Volume of TP x Density of TP Molecular weight of water (MA) = 18
ENCH 307 Mass Transfer- II A/c year 2017 - 18 Rev 11 Semester-B 16
Molecular weight of TP (MB) = 136 Boiling point of the mixture =
2) Theoretical Weight Ratio (of B to A) =
AA
BB
MP
MP
Where PA = Partial pressure of steam at boiling point of the mixture (steam table) PB = Partial pressure of TP = Total pressure – PA
Experimental Weight Ratio = distillatein water of Mass
distillatein TP of Mass
Vaporization Efficiency = r = 100ratio weight lTheoretica
ratio weight alExperimentx %
Signature of Module leader/tutor
ENCH 307 Mass Transfer- II A/c year 2017 - 18 Rev 11 Semester-B 17
Experiment No: 4
LIQUID LIQUID EQUILIBRIUM
AIM: To determine the equilibrium distribution data for the given system and to obtain an
equation to fit in the data.
SYSTEM: Benzene – Water – Acetic acid.
PROCEDURE: Take 6 nos. of 250 cc bottles with stoppers and clean them well. To each
one of them add 50 cc of benzene and 50 cc of distilled water from separate burette. Add to
the mixture glacial acetic acid from a burette 1 cc, 5 cc, 10 cc, 15 cc, 20cc and 25 cc in the
1st, 2nd, 3rd, 4th, 5th and 6th bottles respectively.
Shake the bottles frequently and settle them, repeat this process for an hour. Mean
while prepare IN NaOH solution and standardize with oxalic acid solution with
phenolphthalein solution as indicator.
Separate the two layers in each bottle with the help of a 250 cc separating funnel.
Find weight and volume of each layer. Use phenolphthalein solution as indicator and
estimate the acid contents of each of the layers with standard NaOH solution. When titrating
the organic layer initially add about 10 cc of distilled water.
Calculate the weight fraction of acid in each layer and tabulate the data.
Draw a graph between the conc. of the acid in organic layer against the conc. of
acid in aqueous layer on a rectangular graph sheet.
If it is a curve plot the data on log-log graph sheet and obtains the equation, which
fits the experimental data of the system.
Results & Discussions: (To be filled by the student performing the experiment)
Signature of Module leader/tutor
ENCH 307 Mass Transfer- II A/c year 2017 - 18 Rev 11 Semester-B 18
Experiment No: 5
SOLID LIQUID LEACHING
AIM:
To Estimate the recovery of solute after three stages in cross current solid liquid leaching.
INTRODUCTION
Leaching is widely used in the extraction of valued chemicals from solids into liquids. The
desired components from the solid diffuse into suitable solvent which they are soluble when
they are brought into intimate contact through agitation. The solute diffuses through the solid
to the bulk solvent. The block diagram representing the process has been shown in Fig 5.1.
Fig 5.1 Schematic of a single stage extraction
V= Mass of overflow solution
L=Mass of liquid in slurry solution
B= Mass of dry solute free solid
N=Mass of dry solute free solid (B)/ Mass of solution retained (L)
xA = Composition of A in overflow solution
yA= Composition of A in slurry solution
ENCH 307 Mass Transfer- II A/c year 2017 - 18 Rev 11 Semester-B 19
PROCEDURE
STANDARDISATION OF 1N HCl:
Prepare standard solution of Sodium carbonate (1N) was prepared by dissolving 5.3g of
sodium carbonate in 100ml of water.
Wash 50ml burette and rinse with the prepared HCl of approximately 1N. Pipette out 20ml of
std. sodium carbonate into conical flask and titrate it with HCl in burette using methyl orange
indicator. The end point is the appearance of red color.
LEACHING STUDIES:
1. Take 200 gm of sand in a beaker and 10 gm of Sodium carbonate. Add 200 ml of
distilled water and stir it well for 10 minutes.
2. After allowing time for equilibration and settling of solids, decant the clear solution
and analyze for sodium carbonate by titration with HCl.
3. The above procedure is repeated by adding same amount of solvent to the solid
slurry for two more times.
OBSERVATIONS AND CALCULATIONS:
S.No Set Volume of
Decantant(ml)
Burette reading Volume of
HCl(ml)
Na2CO3
(g) Initial Final
Volume of sodium carbonate = V1 = 20 ml
Normality of sodium carbonate = N1 =
Volume of HCl = V2 = ml
Normality of HCl = N2 = 1 N
RESULT: (To be filled by the student performing the experiment)
Signature of Module leader/tutor
Department of Mechanical and Industrial Engineering
ENCH 307 Mass Transfer- II A/c year 2017 - 18 Rev 11 Semester-B 20
Experiment No: 6
TRAY DRYER
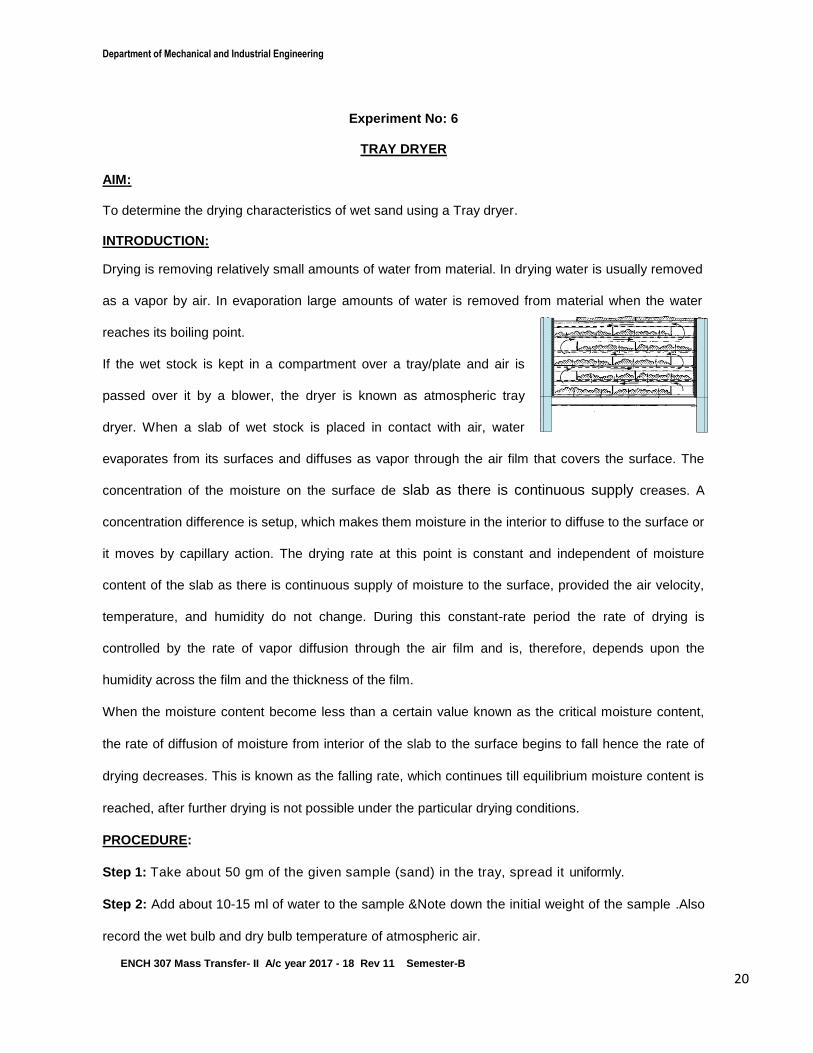
AIM: To determine the drying characteristics of wet sand using a Tray dryer. INTRODUCTION:
Drying is removing relatively small amounts of water from material. In drying water is usually removed
as a vapor by air. In evaporation large amounts of water is removed from material when the water
reaches its boiling point.
If the wet stock is kept in a compartment over a tray/plate and air is
passed over it by a blower, the dryer is known as atmospheric tray
dryer. When a slab of wet stock is placed in contact with air, water
evaporates from its surfaces and diffuses as vapor through the air film that covers the surface. The
concentration of the moisture on the surface de slab as there is continuous supply creases. A
concentration difference is setup, which makes them moisture in the interior to diffuse to the surface or
it moves by capillary action. The drying rate at this point is constant and independent of moisture
content of the slab as there is continuous supply of moisture to the surface, provided the air velocity,
temperature, and humidity do not change. During this constant-rate period the rate of drying is
controlled by the rate of vapor diffusion through the air film and is, therefore, depends upon the
humidity across the film and the thickness of the film.
When the moisture content become less than a certain value known as the critical moisture content,
the rate of diffusion of moisture from interior of the slab to the surface begins to fall hence the rate of
drying decreases. This is known as the falling rate, which continues till equilibrium moisture content is
reached, after further drying is not possible under the particular drying conditions.
PROCEDURE:
Step 1: Take about 50 gm of the given sample (sand) in the tray, spread it uniformly.
Step 2: Add about 10-15 ml of water to the sample &Note down the initial weight of the sample .Also
record the wet bulb and dry bulb temperature of atmospheric air.
Department of Mechanical and Industrial Engineering
ENCH 307 Mass Transfer- II A/c year 2017 - 18 Rev 11 Semester-B 21
Step 3: Set the temperature at desired level (say 1.5°C), when the temperature is around 55 °C
switch on the blower. Start the stop clock only when the temperature reaches the desired level.
Step 4: Note down the time taken for the digital balance for every 2 gm loss in weight. Or after 10
mint take down the weight balance.
Wet bulb
temperature,ºC
Dry bulb
temperature,ºC
Manometer
reading Rm, m Hot air
temperature Th
Room
temperature TR,
OBSERVATIONS AND CALCULATION:
Sl
No
Moisture
content, X
Weight
change, dw(gm)
Time
taken, sec
dw/dt
x 10-
3Kg/sec
Ө
kg/m2 sec
1 / Ө x 10-3
(sec)-1
Density of air RT
PMair
3m
kg (at room temp)
Density of water 2
Rhmwater
TTatT
_______________________________ Kg/m3
Drying area, A = = _________________________ m2
Weight of dry solid WS = 0.25 Kg
Drying rate, dtA
dW
, where dw = change in weight = 0.002 Kg
Orifice diameter, Do = 0.028 m
Department of Mechanical and Industrial Engineering
ENCH 307 Mass Transfer- II A/c year 2017 - 18 Rev 11 Semester-B 22
Pipe diameter, Dp = 0.05 m
Area of the orifice = A0= 4
D2
0
Co-efficient of discharge of orifice meter Cd = 0.62
pipeD
D0 = 0.028 / 0.05 = 0.56
Chamber dimensions = 400mm x 300mm x 200 mm
Cross section area of the duct = Ac = 300mm x 200 mm = 60000 mm2 = m2
Pressure drop across orifice meter is )( airwm gRP _____________________ N/m2
Velocity of air at orifice = Vo Vo =
Mass of air 00 AVM air ______________________ Kg/sec
Mass of air in the chamber, cairair AVM
Velocity of air in the chamber,Ac
MV
airair
m/sec
Mass velocity of air airair VG _______________________Kg / (m)2 sec
Heat transfer co-efficient h = 24.2 x G 0.37 =
W/m-0C
Moisture Content X=Ls
LsW
Ls= bone dry weight W= wet weight Humidity at temperature Th (from chart) H 2 = Kg / Kg dry air H1 = initial humidity
sec / m )(
P) x 2 ( x
) - (1
C
21
21
2/14
d
air
Department of Mechanical and Industrial Engineering
ENCH 307 Mass Transfer- II A/c year 2017 - 18 Rev 11 Semester-B 23
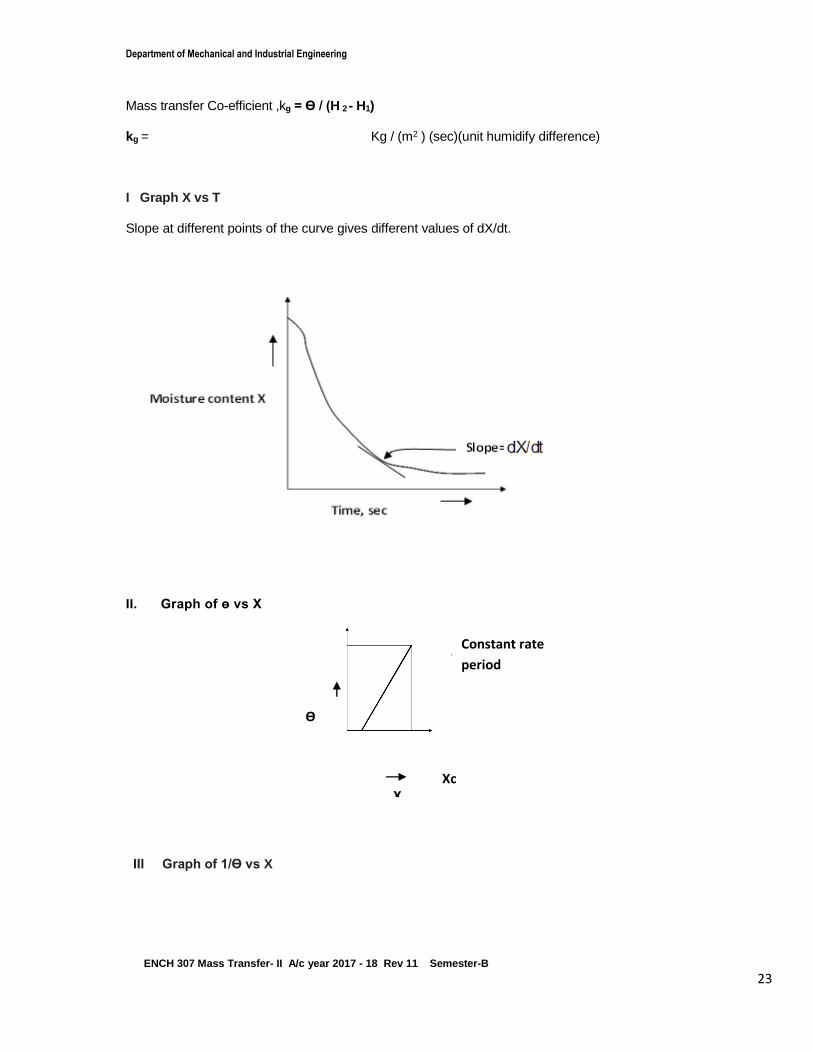
Mass transfer Co-efficient ,kg = Ө / (H 2 - H1) kg = _____________________________ Kg / (m2 ) (sec)(unit humidify difference) I Graph X vs T Slope at different points of the curve gives different values of dX/dt.
II. Graph of ө vs X III Graph of 1/Ө vs X
Constant rate
period
Xc
Ө
X
Department of Mechanical and Industrial Engineering
ENCH 307 Mass Transfer- II A/c year 2017 - 18 Rev 11 Semester-B 24
Time of constant rate period,
c
cinitialsc
A
XXLT
Time of falling rate period,
dXA
LT
X
cX
sF
1
TF =( Ls /A)( S) = sec RESULTS & DISCUSSIONS: (To be filled by the student performing the experiment)
Signature of Module leader/tutor
1 / Ө
X
S=area under the
curve
Department of Mechanical and Industrial Engineering
ENCH 307 Mass Transfer- II A/c year 2017 - 18 Rev 11 Semester-B 25
Experiment No: 7
ADSORPTION STUDIES
AIM: To determine the adsorption constants for the adsorption isotherm of Oxalic acid on
activated carbon
THEORY: At a given temperature, the mass of adsorbate adsorbed by a solid adsorbent for
various concentrations is given by the following equation:
n
1
kcm
xq
The above equation is known as the Freundlich adsorption isotherm where x is the mass of
the adsorbate adsorbed by mg of the adsorbent at various concentrations of the adsorbate.
The values of k and n are constants at a given temperature for the given solid adsorbent and
adsorbate
PROCEDURE:
1. Transfer 1 g of the activated carbon to each of the six reagent bottles. Number the
reagent bottles.
2. Add 60, 50, 40, 30, 20, 10ml of 1 N Oxalic acid to each bottle and add adding 0, 10, 20,
30, 40 and 50 ml of distilled water to the above.
3. Shake the bottles vigorously and leave for 30 minutes in a thermostat at desired
temperature with intermittent shaking.
4. Filter the solution from each bottle using filter papers and collect the filtrate in a labelled
conical flask.
5. Titrate 10 ml of each filtrate against standard NaOH (1N) using phenolphthalein as the
indicator to obtain the concentration of acetic acid.
6. Plot a graph of log(x/m) vs log c
OBSERVATIONS
Estimation of Oxalic acid after adsorption:
Standard NaOH vs Oxalic acid
Indicator: Phenolphthalein
Department of Mechanical and Industrial Engineering
ENCH 307 Mass Transfer- II A/c year 2017 - 18 Rev 11 Semester-B 26
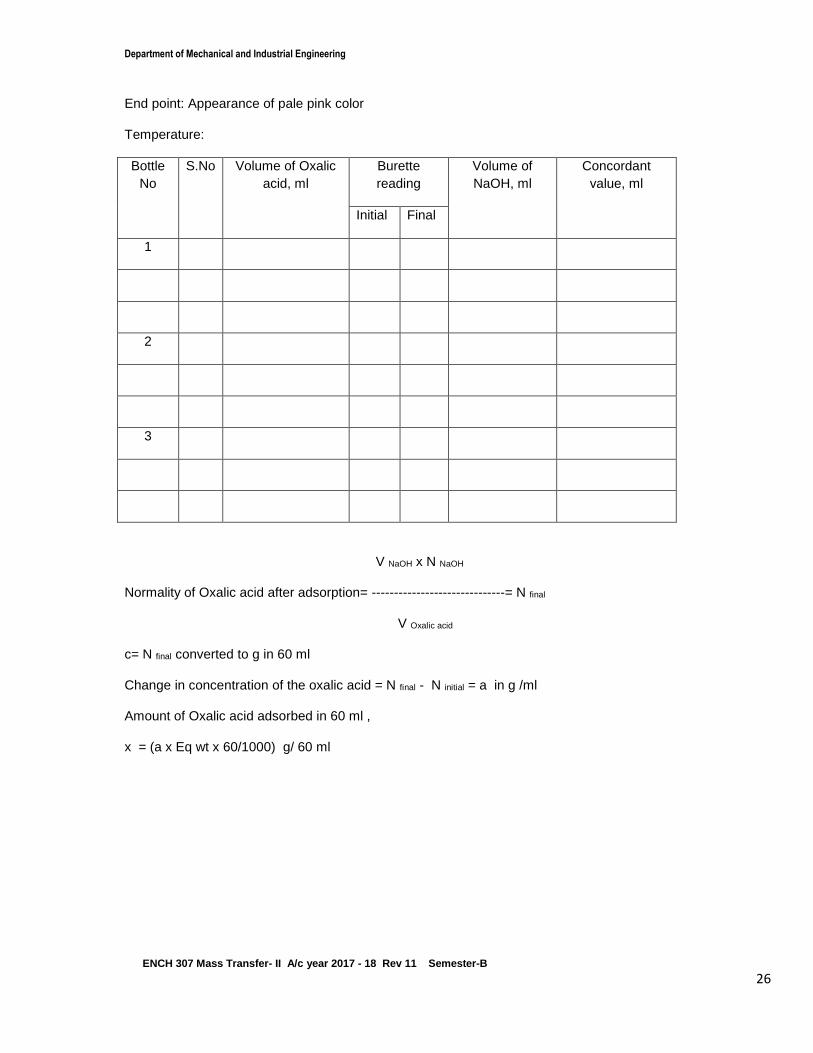
End point: Appearance of pale pink color
Temperature:
Bottle
No
S.No Volume of Oxalic
acid, ml
Burette
reading
Volume of
NaOH, ml
Concordant
value, ml
Initial Final
1
2
3
V NaOH x N NaOH
Normality of Oxalic acid after adsorption= ------------------------------= N final
V Oxalic acid
c= N final converted to g in 60 ml
Change in concentration of the oxalic acid = N final - N initial = a in g /ml
Amount of Oxalic acid adsorbed in 60 ml ,
x = (a x Eq wt x 60/1000) g/ 60 ml
Department of Mechanical and Industrial Engineering
ENCH 307 Mass Transfer- II A/c year 2017 - 18 Rev 11 Semester-B 27
Bottle
No
Concentration of Oxalic
acid, N
Weight of
oxalic acid
adsorbed g /60
ml
Amount of
Oxalic acid
adsorbed in 60
ml
Weight of
activated
carbon, g
x/m Log(x/
m)
Log c
N initial N final X
Plot Graph of log(x/m) vs log C
Slope = 1/n =
Intercept = log k=
RESULTS & DISCUSSIONS: (To be filled by the student performing the experiment)
Signature of Module leader/tutor
Department of Mechanical and Industrial Engineering
ENCH 307 Mass Transfer- II A/c year 2017 - 18 Rev 09 Semester-B P28 | P a g e age 1
Experiment No: 8
PACKED BED EXTRACTOR (DEMO)
AIM: To determine the limiting flow rates in the packed tower using water as a continuous medium and
Kerosene as dispersed medium and to correlate the limiting flow rates.
APPARATUS: Packed column, conical flask, measuring cylinder. CHEMICALS: Kerosene, distilled water INTRODUCTION: Limiting flow rates are required for the purpose of tower design and to fix the operating flow rates in
packed towers as a percentage of the limiting flow rates. Two immiscible liquids are admitted in
counter current direction in the given tower. The dispersed phase Kerosene is being admitted at the
bottom as a spray for any fixed flow rate of the continuous phase. If the flow rate of the dispersed
phase is increased, a condition will be reached when the dispersed phase will be rejected at the
bottom of the tower and flows out with the continuous phase. This is because the number of droplets
in the column increases as the flow rate of the dispersed phase is increased and the flow rate of the
continuous phase is gradually decreased. The free cross sectional area for the rising of the drops
decreased and encounters larger resistance. In addition the continuous phase keeps pushing the
dispersed phase droplets. These two effects are responsible for rejection of the dispersed phase
through the bottom of the tower. The maximum flow rate of the dispersed phase at which the tower
can operate with the two phases flowing in counter current direction is called the limiting flow rate for
the set continuous phase. This condition can also be reached by fixing the flow rate of the dispersed
phase and gradually increasing the continuous phase flow rate. Thus the flow rates of the other phase
at this point are the limiting flow rates with respect to each other,the velocities are expressed in m/hr.
PROCEDURE:
1. Fill the feed tanks with water and kerosene acetate and close the valves.
Department of Mechanical and Industrial Engineering
ENCH 307 Mass Transfer- II A/c year 2017 - 18 Rev 09 Semester-B P29 | P a g e age 1
2. Switch on the compressor.
3. After the required pressure is developed, open the air inlet valve.
4. Open the water inlet valve and allow the water to fill the column.
5. Adjust the Kerosene flow rate to a required value ( say 15 lph). Observe that the column is
getting filled up with droplets of Kerosene.
6. Adjust the level of the interface in the top section of the column by adjusting the extract phase
rotameter.
7. Note down the flow rates of water and kerosene when the level of the interface is constant.
8. Repeat the experiment for different heights of the interface and record the readings.