Massachusetts Development Finance Agency FY16 Strategic Plan Massachusetts Development Finance Agency FY2016 Strategic Themes & Business Plan Goals Summary Support Economic Growth - Foster and cultivate opportunities that equip businesses, nonprofits and communities with the tools they need to sustain and or expand, creating quality jobs to meet the needs of the Commonwealth's economy. Goal Key Performance Indicator(s) 1.1 Provide access to capital markets for customers throughout the Commonwealth Dollars provided by program type 1.2 Support the creation of employment in the Commonwealth with a focus on specific economic sectors and/or regions Jobs created (new permanent and construction) 1.3 Strengthen and champion the Commonwealth’s commercial and industrial sectors, with a specific focus on manufacturers Manufacturing jobs created, financing provided 1.4 Strengthen and champion the Commonwealth's innovation sector by increasing business starts, improving access to the innovation economy for new communities and building supportive ecosystems for entrepreneurs Collaborative/maker spaces assisted, new business starts 1.5 Strengthen and champion the Commonwealth’s Defense sector, military installations and related industry sectors Operational cost reductions, Companies connected to contracting opportunities Build Regional Competitiveness - Increase housing stock and make investments in targeted communities, add to their housing availability and commercial property stock, remediate troubled sites and apply effective redevelopment practices. Goal Key Performance Indicator(s) 2.1 Champion Transformative Development Initiative and leverage existing resources and investments Districts established and assisted, Fellows placed, Equity Investments deployed 2.2 Increase housing availability by providing access to capital and technical expertise to support the creation of multi-family and other housing choices for residents Housing units financed 2.3 Build regional knowledge and facilitate regionally based economic growth RE Service projects moved to implementation 2.4 Catalyze urban economic growth, cultivate small businesses and improve Brownfields program New and improved program rollouts 2.5 Increase "developability" of the Devens community and continue to move project towards self-sustainability Acres made development ready, increase in tax valuation and increased operational efficiencies Strive for Organizational Excellence - Create a high-performing organization with efficient, effective and integrated delivery of services to external and internal customers and a diverse, highly-qualified workforce with the right skills in the right jobs. Goal Key Performance Indicator(s) 3.1 Foster a culture of constant learning by developing and implementing a comprehensive staff training program Implementation of training programs and employee satisfaction 3.2 Modernize and revamp agency online presence to support key initiatives Deployment of online customer interfaces and internal dashboards 3.3 Develop new cross departmental collaboration models and implement strategies to increase inter agency and partner agency collaborative efforts Implementation of inter- agency and partner agency collaboration strategies 3.4 Increase stakeholder engagement by providing increased opportunities for informed participation in agency programs Deployment of improved public affairs strategy and transparency efforts 3.5 Strengthen performance management by following successful, evidence-based practices to strengthen attainment of mission Increased alignment of agency performance management to statewide efforts, Successful pilot of DevensStat
Transcript
Massachusetts Development Finance Agency FY16 Strategic Plan
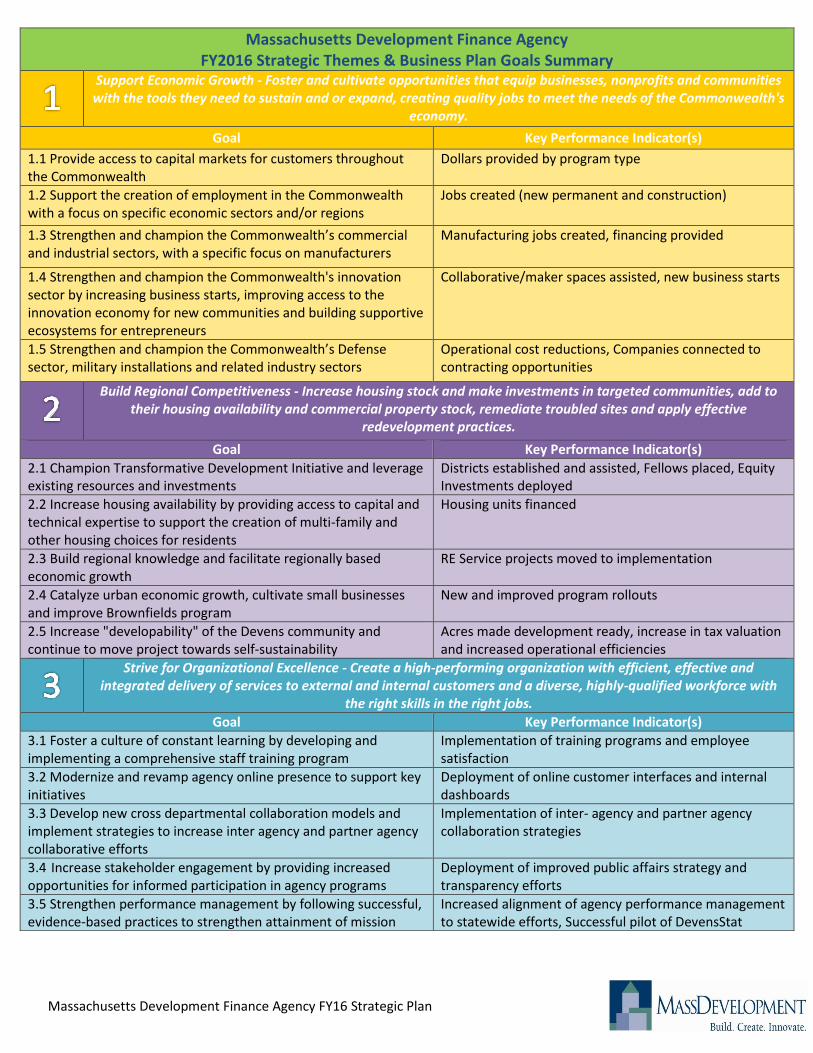
Massachusetts Development Finance Agency FY2016 Strategic Themes & Business Plan Goals Summary
Support Economic Growth - Foster and cultivate opportunities that equip businesses, nonprofits and communities
with the tools they need to sustain and or expand, creating quality jobs to meet the needs of the Commonwealth's economy.
Goal Key Performance Indicator(s)
1.1 Provide access to capital markets for customers throughout the Commonwealth
Dollars provided by program type
1.2 Support the creation of employment in the Commonwealth with a focus on specific economic sectors and/or regions
Jobs created (new permanent and construction)
1.3 Strengthen and champion the Commonwealth’s commercial and industrial sectors, with a specific focus on manufacturers
Manufacturing jobs created, financing provided
1.4 Strengthen and champion the Commonwealth's innovation sector by increasing business starts, improving access to the innovation economy for new communities and building supportive ecosystems for entrepreneurs
Collaborative/maker spaces assisted, new business starts
1.5 Strengthen and champion the Commonwealth’s Defense sector, military installations and related industry sectors
Operational cost reductions, Companies connected to contracting opportunities
Build Regional Competitiveness - Increase housing stock and make investments in targeted communities, add to
their housing availability and commercial property stock, remediate troubled sites and apply effective redevelopment practices.
Goal Key Performance Indicator(s)
2.1 Champion Transformative Development Initiative and leverage existing resources and investments
Districts established and assisted, Fellows placed, Equity Investments deployed
2.2 Increase housing availability by providing access to capital and technical expertise to support the creation of multi-family and other housing choices for residents
Housing units financed
2.3 Build regional knowledge and facilitate regionally based economic growth
RE Service projects moved to implementation
2.4 Catalyze urban economic growth, cultivate small businesses and improve Brownfields program
New and improved program rollouts
2.5 Increase "developability" of the Devens community and continue to move project towards self-sustainability
Acres made development ready, increase in tax valuation and increased operational efficiencies
Strive for Organizational Excellence - Create a high-performing organization with efficient, effective and
integrated delivery of services to external and internal customers and a diverse, highly-qualified workforce with the right skills in the right jobs.
Goal Key Performance Indicator(s)
3.1 Foster a culture of constant learning by developing and implementing a comprehensive staff training program
Implementation of training programs and employee satisfaction
3.2 Modernize and revamp agency online presence to support key initiatives
Deployment of online customer interfaces and internal dashboards
3.3 Develop new cross departmental collaboration models and implement strategies to increase inter agency and partner agency collaborative efforts
Implementation of inter- agency and partner agency collaboration strategies
3.4 Increase stakeholder engagement by providing increased opportunities for informed participation in agency programs
Deployment of improved public affairs strategy and transparency efforts
3.5 Strengthen performance management by following successful, evidence-based practices to strengthen attainment of mission
Increased alignment of agency performance management to statewide efforts, Successful pilot of DevensStat
Annual Performance Report — Fiscal Year 2015
Charlie Baker, Governor
Karyn Polito, Lt. Governor
Jay Ash, Chairman and Secretary, Executive Office of Housing and Economic Development
Marty Jones, President & CEO
JOBS CREATED 130% of Target for Fiscal Year
PROJECTS IN FISCAL 2015
Emerging Technology Fund - $2.5M, Cambridge
Acquire tooling and equipment enabling N12 to
develop commercial manufacturing of its advanced
carbon nanotube materials. Project is expected to create 25 jobs.
501 c 3 Bond & New Market
Tax Credit - $27M, Middle-
borough/Brockton
Acquire/renovate Brockton
facility and redevelop St.
Luke’s Hospital in Middleborough. Projects
are expected to create 220 new jobs, 73 con-
struction jobs, and allow for more than 4,000
new treatment slots for patients.
Central Square Technical Assistance Panel & [TDI]
District in Development - $500,000, Lynn
Provided intensive one day planning for Central
Square, selected district for [TDI] and placed fellow to organize local
partnership. Goal is to recast the square as a destination through pro-
gram and public space improvements to increase development.
General Fund Housing
Loan - $5M, Leominster
Downtown redevelop-
ment for market rate
housing. Project is expected to create 51 housing
units, 24 construction jobs and 7 new jobs.
AT A GLANCE
HOUSING UNITS
PRESERVED
&/OR BUILT
IN FISCAL 2015
Manufacturing Bond
& Loan Guarantees -
$5M, Lee
Acquire/renovate Lee facility with updated
clean rooms, labs, and work rooms and pur-
chase/ install new drug manufacturing equip-
ment.
Project expected to create 30 new jobs and 7
construction jobs.
107% of Target for Fiscal Year
STRATEGIC THEMES & FISCAL YEAR 2015 GOALS
SUPPORT ECONOMIC GROWTH
BUILD ORGANIZATIONAL EXCELLENCE
BUILD REGIONAL COMPETITIVENESS
FULLY MET GOAL
PARTIALLY MET GOAL
Provide Access to Capital
Support Job Creation
Support Manufacturing
Support Defense Sector
Increase Housing Availability
Build Regional Economic Development Knowledge
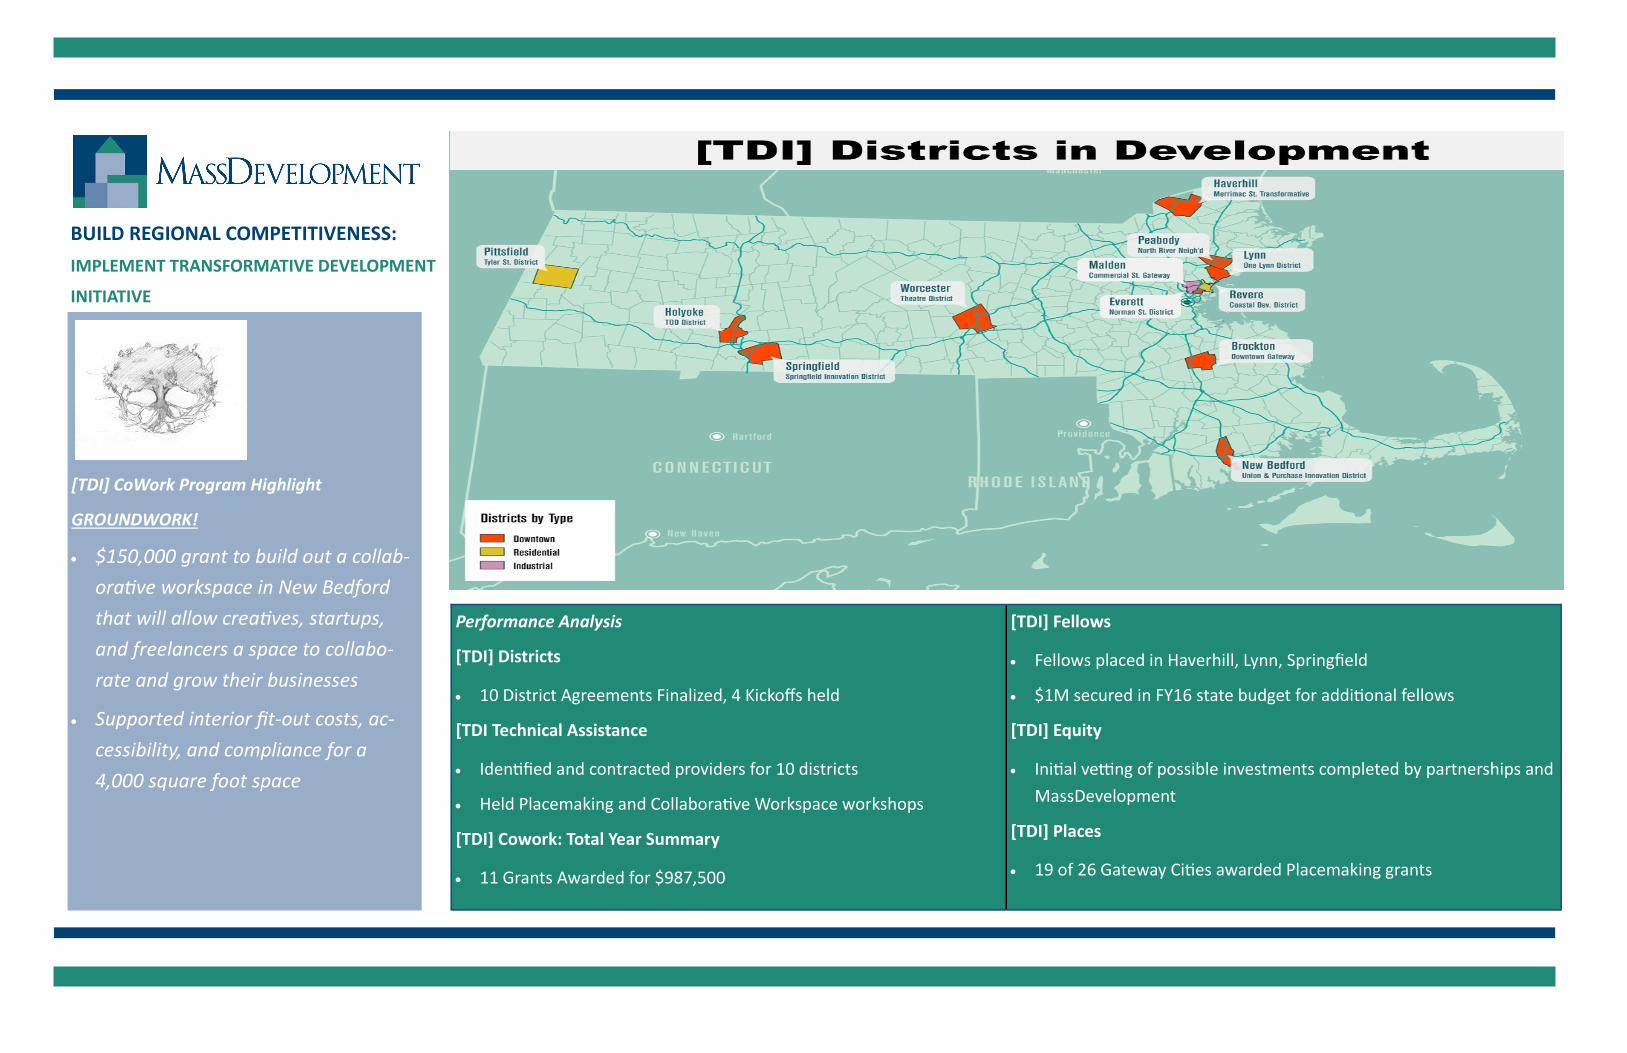
Implement the Transformative Development Initiative
Develop Devens
Maintain Financial Resources
Build Collaborative Culture
Build MassDevelopment Workforce Capacity
Modernize Systems & Technology
STRATEGIC THEMES
Strategic Theme 1: Support Economic Growth Foster and Cultivate Opportunities That Equip Businesses, Nonprofits and Communities with the Tools They Need to Sustain and or Expand, Creating Quality Jobs to Meet the
Needs of the Commonwealth's Economy
Strategic Theme 2: Build Regional Competitiveness Increase Housing Stock and Make Investments In Targeted
Communities, Add to their Housing Options and Commercial Property Stock, Remediate Troubled Sites and Apply Effec-
tive Redevelopment Practices.
Strategic Theme 3: Build Organizational Excellence Create a High-Performing Organization with Efficient, Effec-tive and Integrated Delivery of Services to External and In-
ternal Customers and a Diverse, Highly-Qualified Workforce with the Right Skills in the Right Jobs.
KEY PERFORMANCE INDICATORS
SUPPORTING ECONOMIC GROWTH:
JOB CREATION
FY13-FY15 Comparison
SUPPORTING ECONOMIC GROWTH:
ACCESS TO CAPITAL
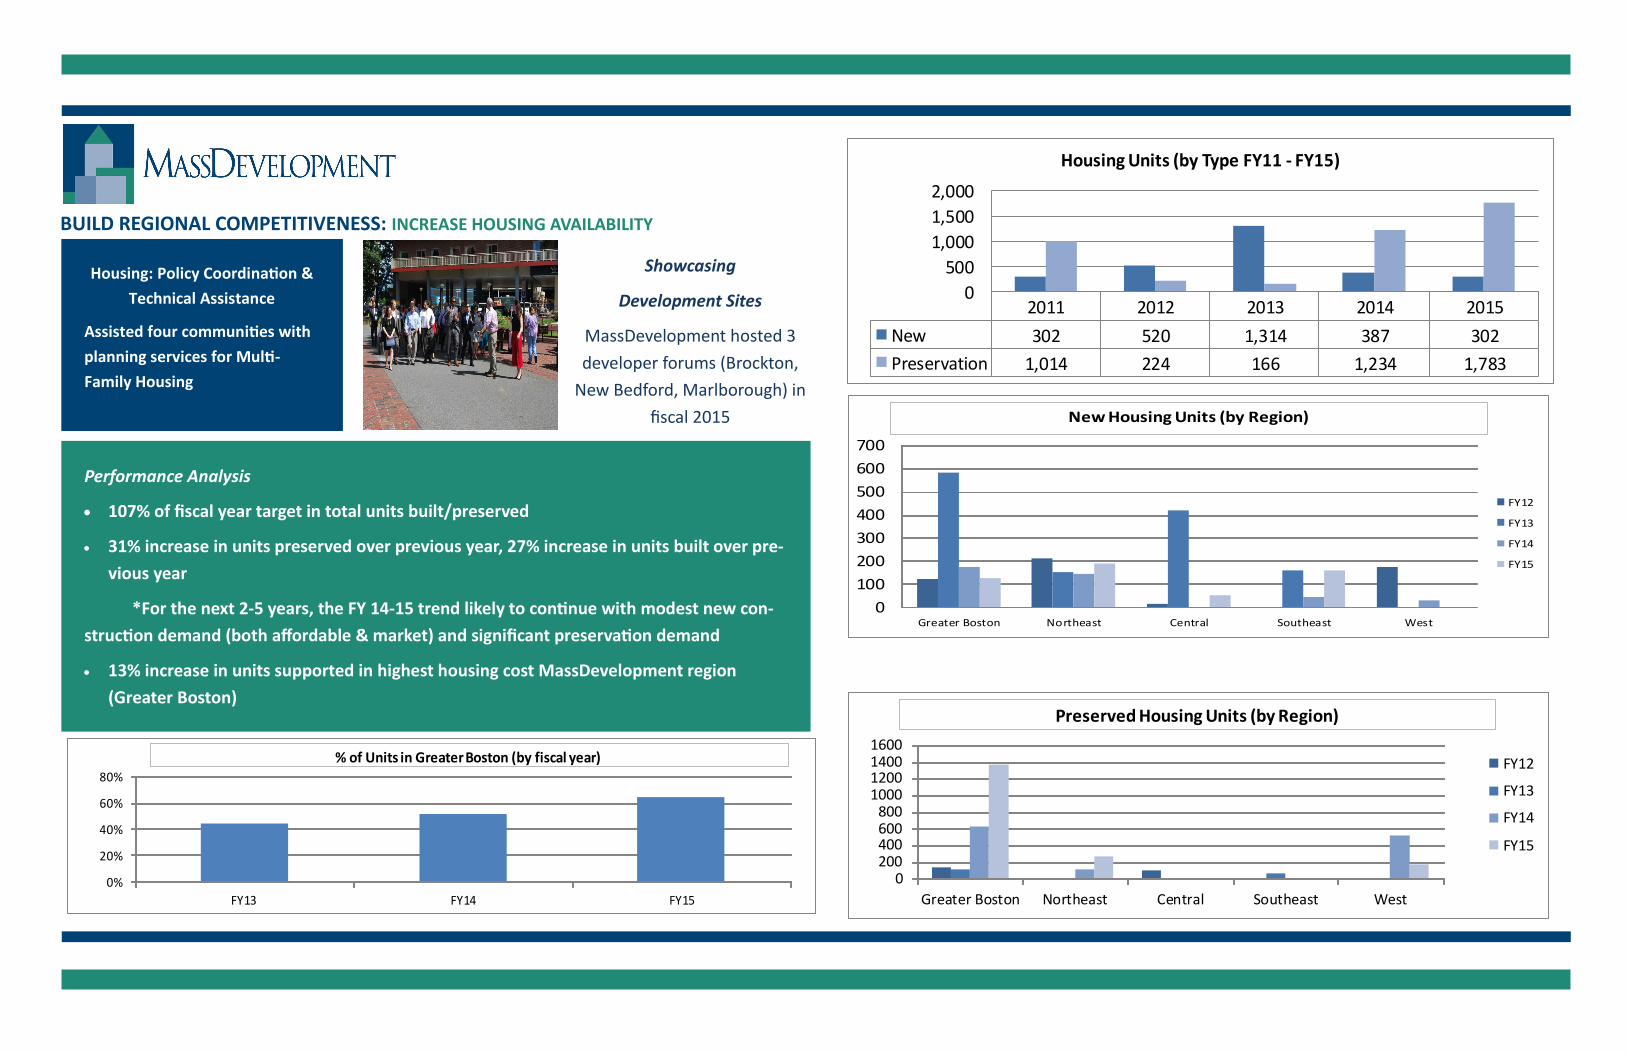
BUILDING REGIONAL COMPETITIVENESS:
INCREASE HOUSING AVAILABILITY
FY13-FY15 Comparison FY13-FY15 Comparison
$0
$500,000,000
$1,000,000,000
$1,500,000,000
$2,000,000,000
$2,500,000,000
$3,000,000,000
FY13 FY14 FY15
Actual
Target
TOTAL FINANCED FY13 - FY15
0
200
400
600
800
1,000
1,200
1,400
1,600
1,800
2,000
FY13 FY14 FY15
Actual
Target
TOTAL UNITS BUILT/REHABILITATEDFY13 - FY15
0
2000
4000
6000
8000
10000
12000
14000
16000
FY13 FY14 FY15
Actual
Target
TOTAL JOBS CREATED FY13 - FY15
SUPPORT ECONOMIC GROWTH: SUPPORT ACCESS TO CAPITAL
Fiscal 2013 Fiscal 2014 Fiscal 2015
Total $ Invested (Bond,
Loan & Grant Programs)
$2,333,253,346 $2,867,710,604 $2,410,425,751
Total Projects/Closings 317 277 286
MassDevelopment Investment Trends FY2007 - FY2015
FY2015 Total Invested (by region)
Performance Analysis
116% of fiscal year target in total financing volume
Over $400M in support for projects outside of Greater Boston
54% of fiscal year target in direct general fund lending
* 120% over average of fiscal year target for loan guarantee programs (Charter, General)
94% of fiscal year target in community development (Brownfields, CFF, Manufacturing grants) $2,010,593,162